Article

Vulnerability of a Northeast Mediterranean Island to Soil Loss. Can Grazing Management Mitigate Erosion?

Hellenic Centre for Marine Research, Institute of Marine Biological Resources and Inland Waters, 19013 Anavissos Attikis, Greece
*
Author to whom correspondence should be addressed.
Water 2019, 11(7), 1491; https://doi.org/10.3390/w11071491
Submission received: 2 July 2019 / Revised: 12 July 2019 / Accepted: 15 July 2019 / Published: 18 July 2019
(This article belongs to the Special Issue Assessing Surface and Ground- Water Vulnerability and Pollution Risk)

Abstract

:
Grazing management practices can be erosion abatement actions for lowering soil loss and the subsequent sediment pollution of surface water bodies. Process-based Geographic Information Systems models provide the opportunity to identify critical areas and hence better target such actions across the landscape. This study implemented the SWAT (Soil Water Assessment Tool) hydrologic and catchment management model to estimate the soil loss vulnerability of the nearly pristine but highly erodible Greek island of Samothraki in the North Aegean Sea, with a typical Mediterranean climate and steep topography. Model parameterization and evaluation were carried out by taking advantage of previous modeling experience on areas with data limitations. Inter-annual and intra-annual soil loss variability and the most critical areas (subbasins) of soil loss to waters were adequately identified and grazing management scenarios, including livestock reductions by 50% and 100%, grazing period reduction, and a combination of them, were formulated and applied to investigate the degree to which soil loss could be reduced. The annual reduction results varied between scenarios in the range of 10% to 25% for the entire island, and in wider ranges for its individual subbasins, showing a high potential for reducing the vulnerability of the most pressured ones. However, due to the high importance of the natural factors of rainfall and land slopes, the erosion vulnerability of the island overall could be significantly altered only if grazing management was integrated within a vegetation regeneration plan that included reforestation.

1. Introduction

Soil erosion is considered to be one of the major threats to Europe’s soils, impacting on agricultural production, ecosystem services, and water resources [1,2]. As a large problem that puts the achievement of multiple sustainable development goals of the United Nations at risk, it should be managed through an integrated approach considering the environmental, economic, and social components [3]. Especially for the European Mediterranean environments, it is one of the most important land degradation processes, with hot spots of soil erosion (rates > 20 t/ha/y) [4]. The natural factors that are responsible for this are the uneven topography and steep slopes [5], and the high rainfall erosivity [6] arising from the uneven temporal distribution and high seasonal depths of the precipitated water. On the other hand, the major anthropogenic factors of soil erosion and loss are considered to be deforestation, overgrazing, and unsuitable agricultural practices of the cropping land [7]. Recent Mediterranean studies have reported some factors that are responsible for erosion factors, including intensive ploughing [8], the non-adoption of catch crops to cover bare soil in between tree cultivations [9], as well as limited organic farming, which, based on reduced tillage and organic fertilizers, could improve soil physical quality and stability against erosion [10]. The combination of natural and non-natural factors can lead to severe off-site effects such as the sedimentation of rivers, the enhancement of floods, and the euthrophication of surface water bodies due to the transportation of nutrient pollutants’ with soil particles [11].
The European Water Framework Directive (WFD) [12] and relevant environmental legislation require remediation actions at the catchment scale as an integral part of programs of measures embedded within the integrated River Basin Management Plans (RBMPs). However, the implementation of RBMPs may be hampered in remote and relatively isolated islands of Mediterranean Europe, where their unique naturalness and small populations rarely raise significant environmental concerns. Thus, existing pressures in those islands have not been well quantified, and potential restoration actions are difficult to implement. A typical example is the Greek Samothraki Island in the northeast Aegean Sea, which is known for its relatively undisturbed nature [13], as well as for its erosion susceptibility due to steep topography, high rainfall events [14], deforestation [13], and overgrazing [15,16,17], which have resulted in severe floods with considerable damage to local infrastructure [16,18]. The main pressure on the island is over-grazing, which is considered to be one of the main threats of soil erosion and loss [13,14,16,19]. Although grazing is an efficient utilization of grassy biomass that would not be used for people otherwise, it exacerbates the risk of soil degradation in mountainous regions due to steep slopes [20].
Myronidis et al. [14] have determined the erosion risk in Samothraki, leading to a classification of land vulnerability across the island. Based on the produced mapping results, they discussed potential measures that could form part of the framework for a management plan to mitigate erosion. Skoulikidis et al. [13] focused on the assessment of the ecological status of a number of streams in Samothraki. Although the streams’ ecological quality ranged between good and high, both biological results and nitrate water levels did not entirely match their high expectations, given the nearly pristine conditions of the island’s mountainous part, implying that there is a need for further research on the combination of natural and anthropogenic factors and their impact on water resources. Heiling [17] studied the spatial and demographic structure of Quercus petrea forests and found that 86% of the total study area comprised regions with especially high restoration priority, especially those of higher altitude. Fetzel et al. [16] addressed the socio-ecological aspect of grazing in Samothraki, and analyzed the causes and effects of the fluctuations in animal numbers in the last decades. Despite the decrease in livestock over the last decade, they attributed the severity of flood damages in the island to animal overgrazing, highlighting the need for sustainable livestock management. However, the level of stress from livestock still remains unclear in Samothraki, with none of the studies above providing soil loss estimates associated with animal grazing. Actually, any such estimates are not easy to produce; this is supported by a recent landscape assessment study by various experts in the island, in which grazing could not be as consistently interpreted and evaluated as other stressor metrics [21].
From the existing literature, it appears that there is room for improvement of our knowledge and understanding of the actual role and impact of livestock grazing on soil loss on the island of Samothraki. Eco-hydrological distributed models have existed for more than two decades, and have been widely used for the identification of pressure hot spots and for targeting the implementation of measures within catchments [22,23]. Between many existing simulation tools, the SWAT (Soil and Water Assessment Tool) model [24,25] is the most widely used (overwhelmingly dominating the publication records) for such purposes [22]. The model has been used internationally for reproducing various physical and biogeochemical processes in complex landscapes and varying climate regimes and predicting the effectiveness of management practices against different environmental threats, including soil erosion and river sedimentation, among others [26,27,28]. SWAT has been recently applied for the estimation of erosion and sediment fluxes both at small and large scales [29,30,31].
The application of SWAT is central to the work developed in this paper, which focuses on Samothraki to address soil loss across the island, providing actual calculations, and thus moving our insight one step forward compared to previous studies. We parameterize the model appropriately in order to produce reasonable seasonal and multi-annual estimates of soil loss and estimate its spatial variability across the island. The purpose is to investigate the potential of grazing management options to reduce the soil loss vulnerability of the island subbasins, assessing the erosion magnitude due to livestock grazing.

2. Materials and Methods
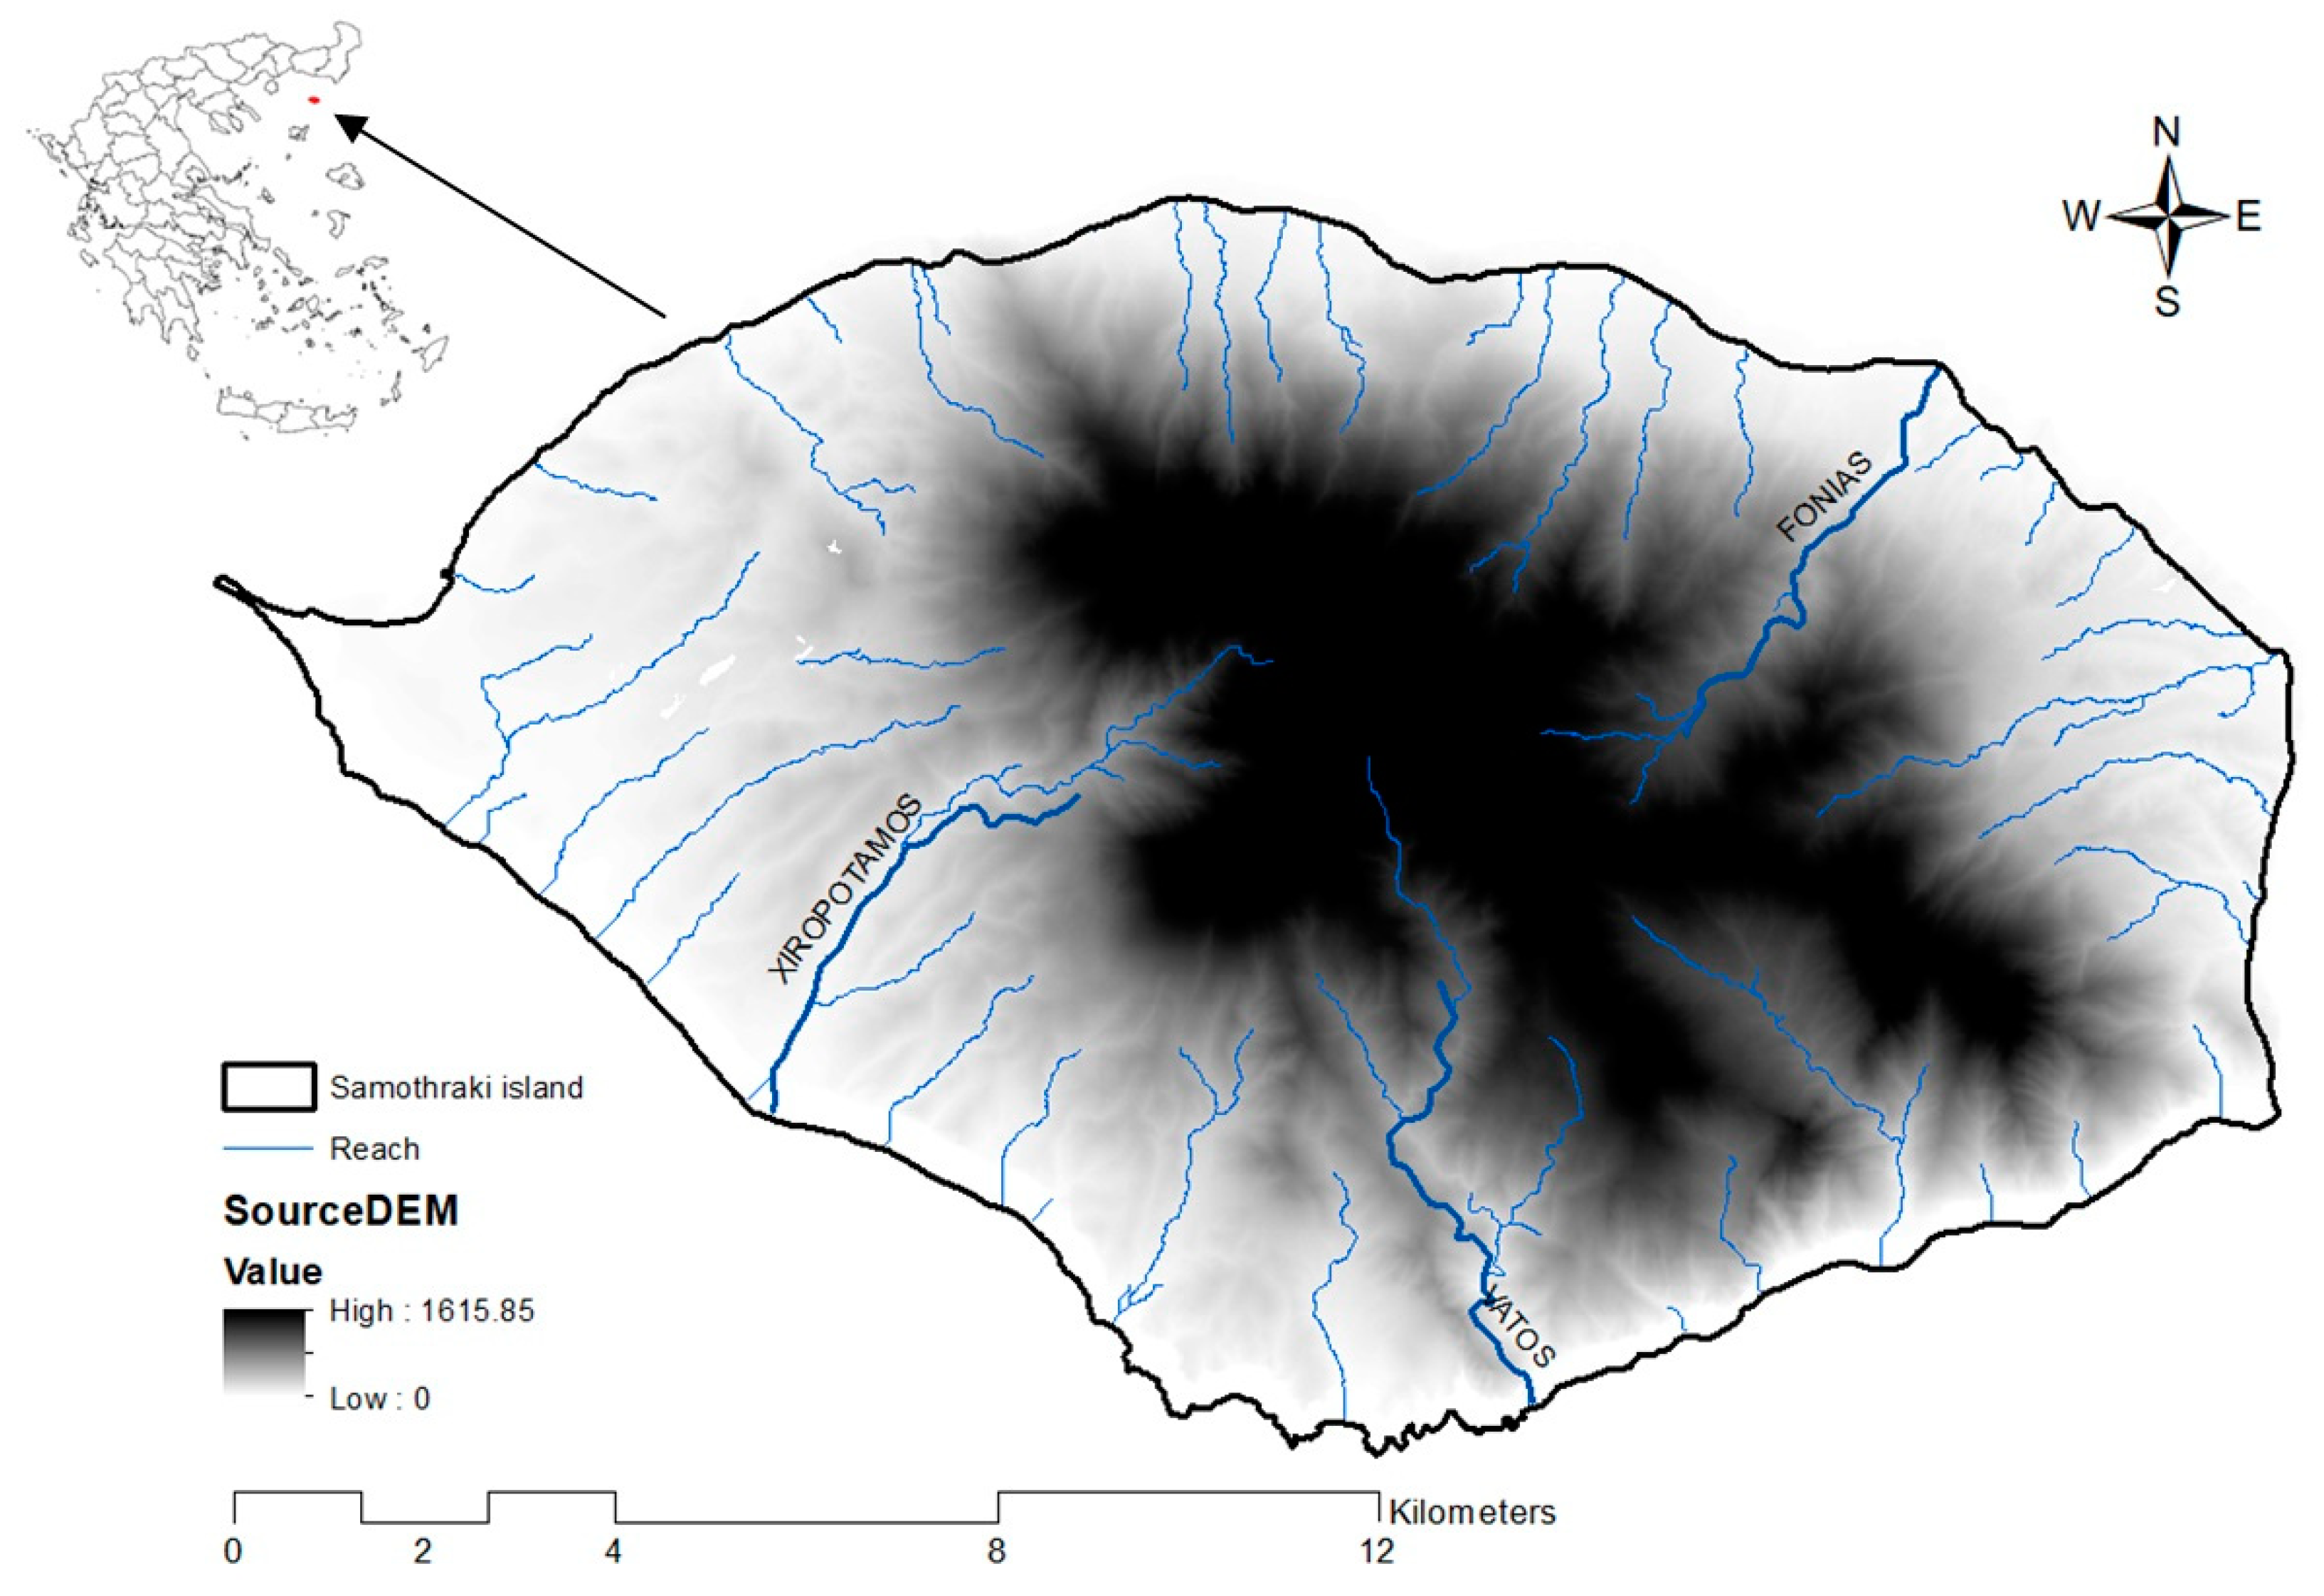
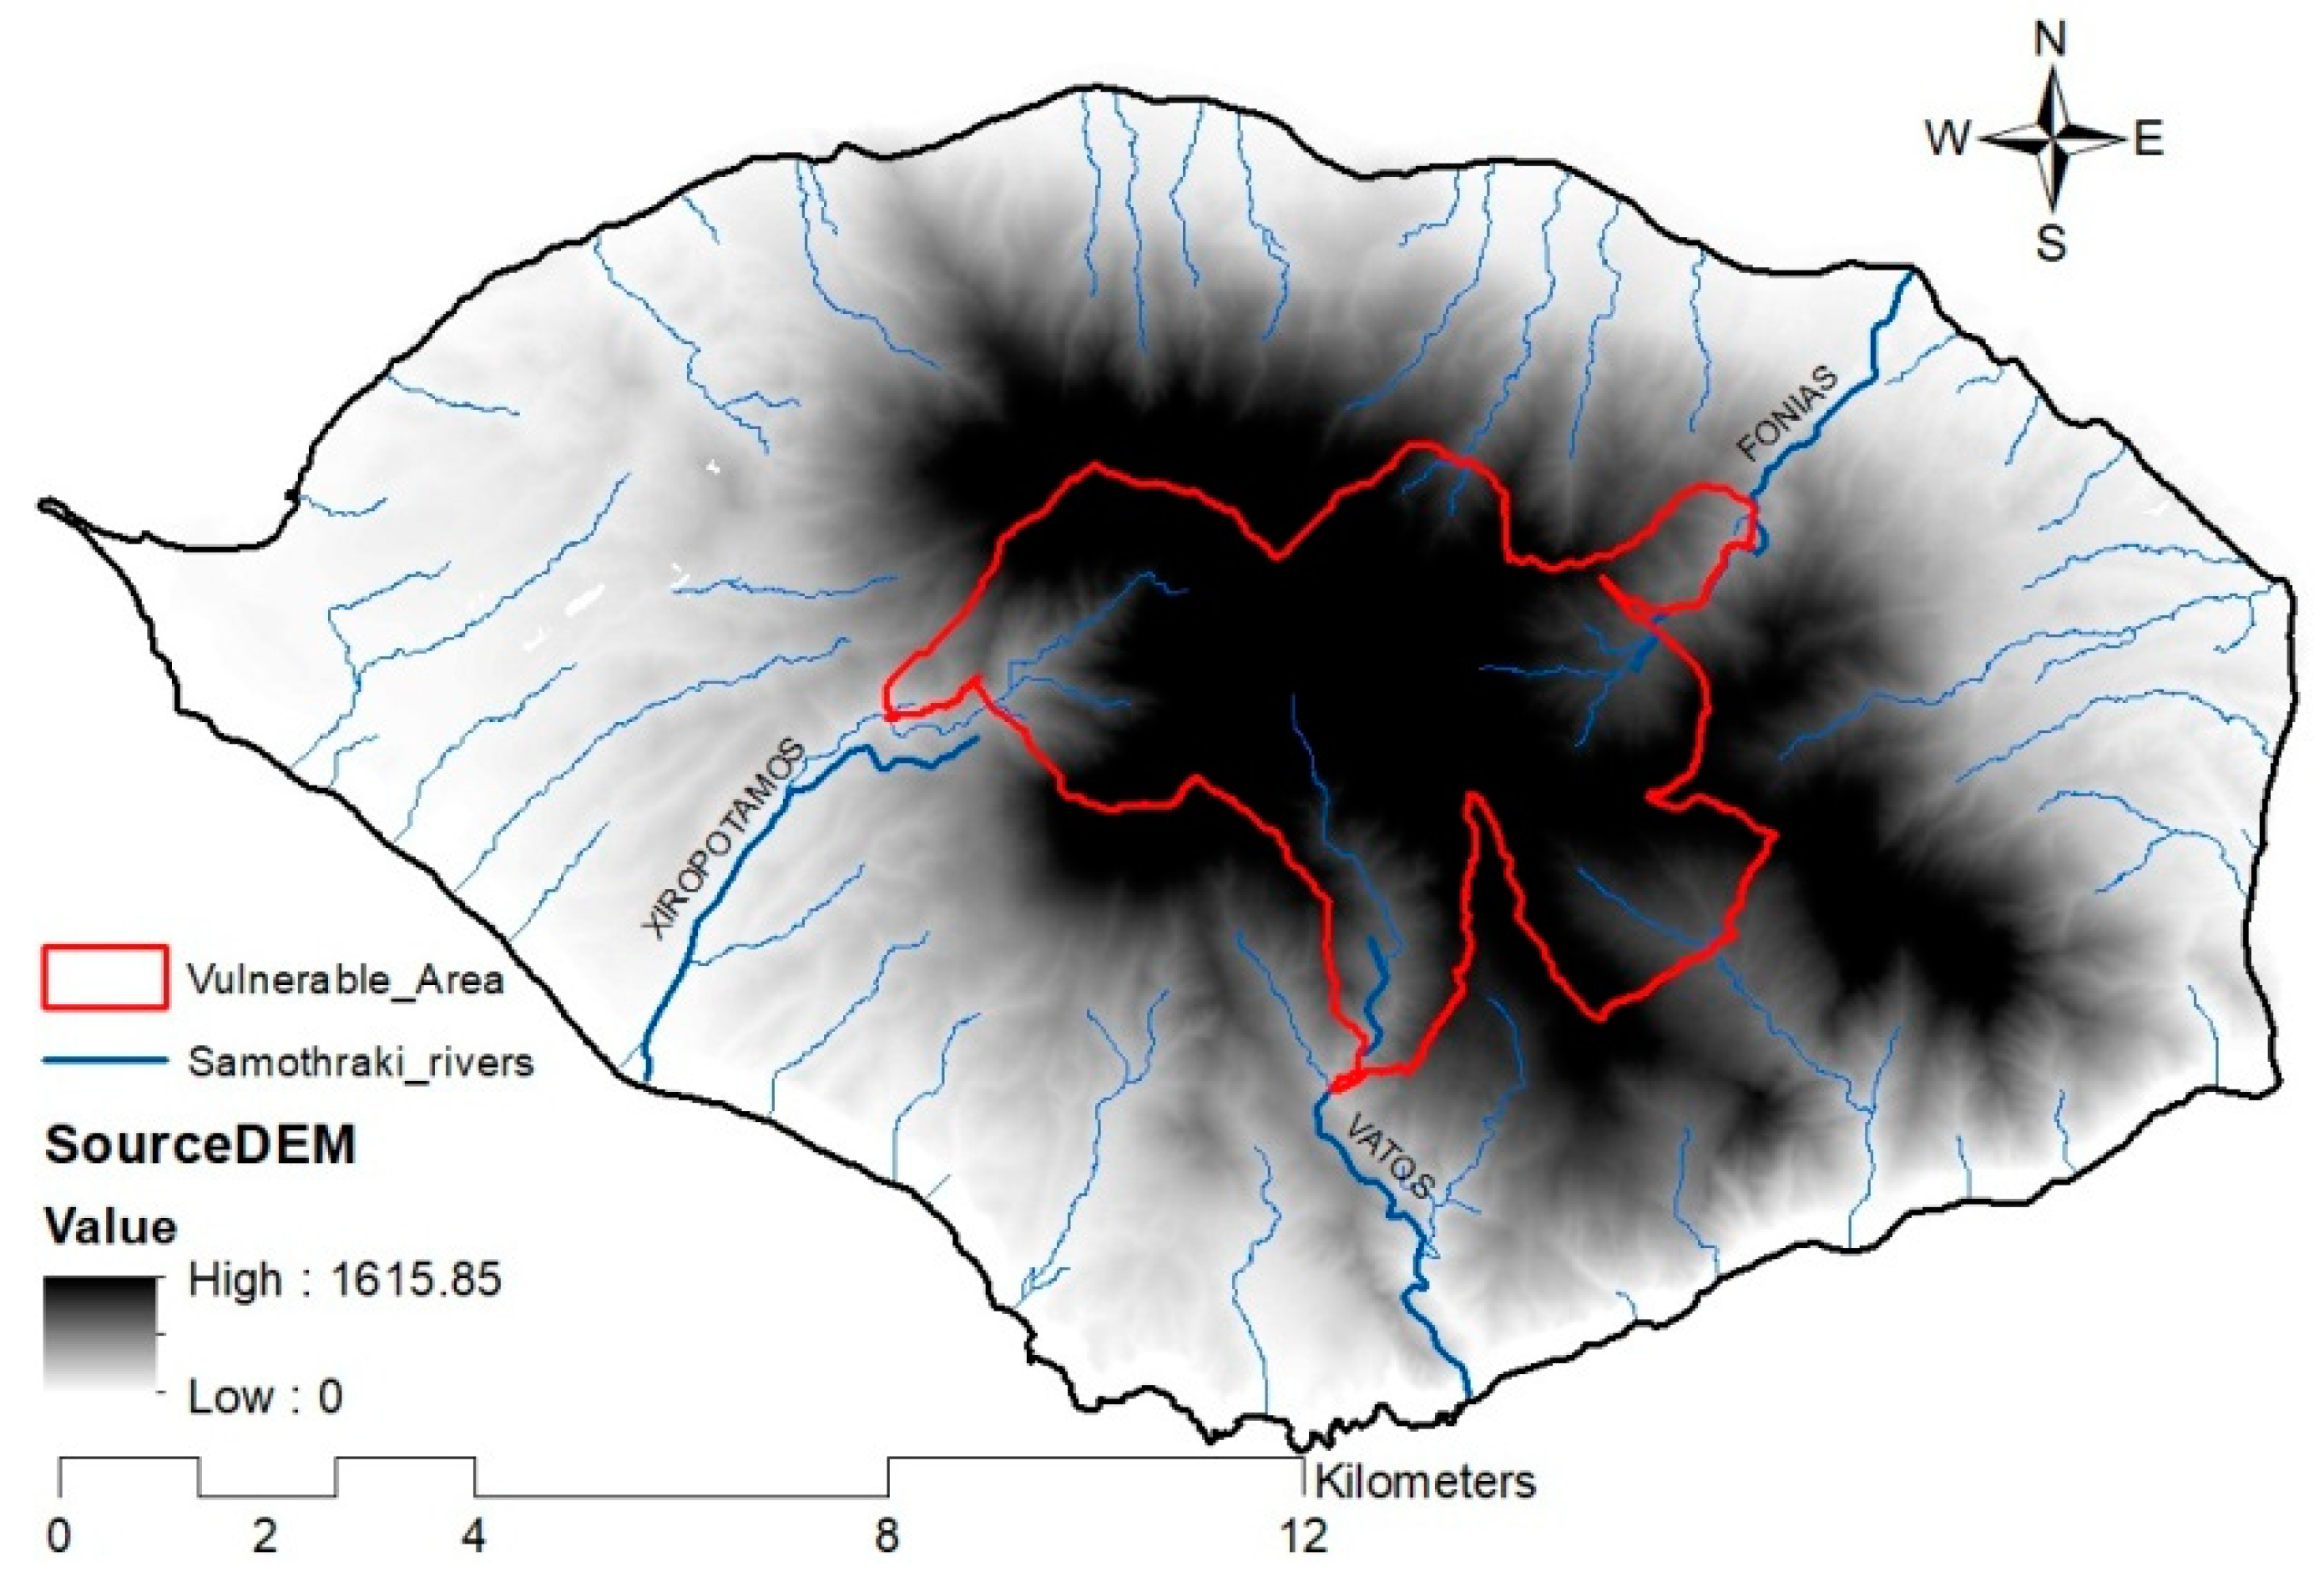
2.1. Study Area

Samothraki is a 178 km2 island in the northeast Aegean archipelago dominated by a high mountain massif in the center, which drains its waters through multiple perennial or intermittent rivers to the surrounding coast (Figure 1). The biggest rivers are the Vatos, Xiropotamos, and Fonias rivers, with historical discharge measurements being available in the last two by the monitoring program of the Public Power Corporation (PPC). Impermeable geological formations of ophiolites and granites predominate [13], with alluvial deposits mostly in a limited area of the western part of the island. The climate is of Mediterranean type, with the historic mean annual temperature and rainfall depth at the closest to the island meteorological station of Alexandroupolis being 15 °C and 552 mm, respectively [14]. However, this station is located opposite the northern part of the island in mainland Greece, and because of its low elevation, the above values need correction in order to be representative for the island [32]. The elevation in Samothraki ranges between 0–1611 m, and its small catchments are generally characterized by very high slope gradients and significant erosion, with the average slope being greater than 30% [14]. The island is characterized by high plant biodiversity, pristine oak, alder, plane and chestnut forests, riparian woodlands, small agricultural areas in the southwestern part, and significant areas of shrublands, pastures, and natural vegetation that are favorable for livestock grazing. Livestock is comprised of small ruminants (goats and sheep), which nowadays have a population of around 45,000 and graze unrestrictedly most of the year [16]. This is the main pressure in Samothraki, since other human pressures such as domestic waste discharge, livestock farming wastes, and diffuse nutrient pollution from crop farming have only very limited and local impacts, primarily at low elevations [13].

2.2. The SWAT Model

The Soil and Water Assessment Tool (SWAT) is a river basin model developed by the United States (US) Department of Agriculture in collaboration with Texas A&M University [25]. A recent release of SWAT version 2012 (SWAT 2012, revision 664) in combination with the ArcGIS (version 10.4) SWAT (ArcSWAT) interface [33] were used in this study. The model includes mathematical descriptions of physical, biogeochemical, and hydrochemical processes, and combines elements of a physical and conceptual semi-empirical nature; thus, it can be called a semi-physically, process-based ecohydrological model [34,35]. It has the capability to simulate various types and techniques of agricultural management practices by explicitly defining the appropriate management parameters [36], thus allowing experimentation with plausible what-if management scenarios and investigation of their effects on water.
Within the Geographic Information Systems (GIS) environment, SWAT offers a distributed modeling as a watershed is delineated into subbasins and subsequently into hydrologic response units (HRUs), which represent homogeneous combinations of land use, soil types, and slope classes in each subbasin [37]. The physical processes associated with water and sediment movement, crop growth, and nutrient cycling are modeled at the HRU scale; runoff and pollutants that are exported from the different HRUs are routed downstream. Simulation of the hydrology is separated into the land (water balance equation in the soil profile) and the routing phase of the hydrologic cycle. Sediment yields from sheet and rill erosion are estimated with the Modified Universal Soil Loss Equation (MUSLE), which simulates the delivered part of sediment material to the streams accounting for a delivery ratio [37]:
s e d = ( 11.8 × Q s u r f × q p e a k × a r e a h r u ) 0.56 × K U S L E × C U S L E × P U S L E × L S K U S L E × C F R G
where sed is the sediment yield on a given day (metric tons), Q s u r f is the surface runoff volume (mm H2O/ha), q p e a k is the peak runoff rate (m3/s), a r e a h r u is the area of the HRU (ha), K U S L E is the Universal Soil Loss Equation (USLE) soil erodibility factor, C U S L E is the USLE cover and management factor, P U S L E is the USLE support practice factor, L S U S L E is the USLE topographic factor, and C F R G is the coarse fragment factor. Surface runoff volumes are simulated using a modification of the Soil Conservation Service (SCS) curve number (CN) method [38], while peak runoff rate predictions are made with a modification of the rational method [37]. In MUSLE, the substitution of the rainfall factor with the runoff factor represents the energy that is used in detaching and transporting sediment so that delivery ratios are not needed [37]. Thus, Equation (1) calculates the hillslope erosion material that is lost from the land entering surface waters; hence, this paper reports soil loss estimates. SWAT also simulates river sediment transport processes, which are not addressed in the present paper.
The model is thoroughly described in the SWAT theoretical documentation [37].

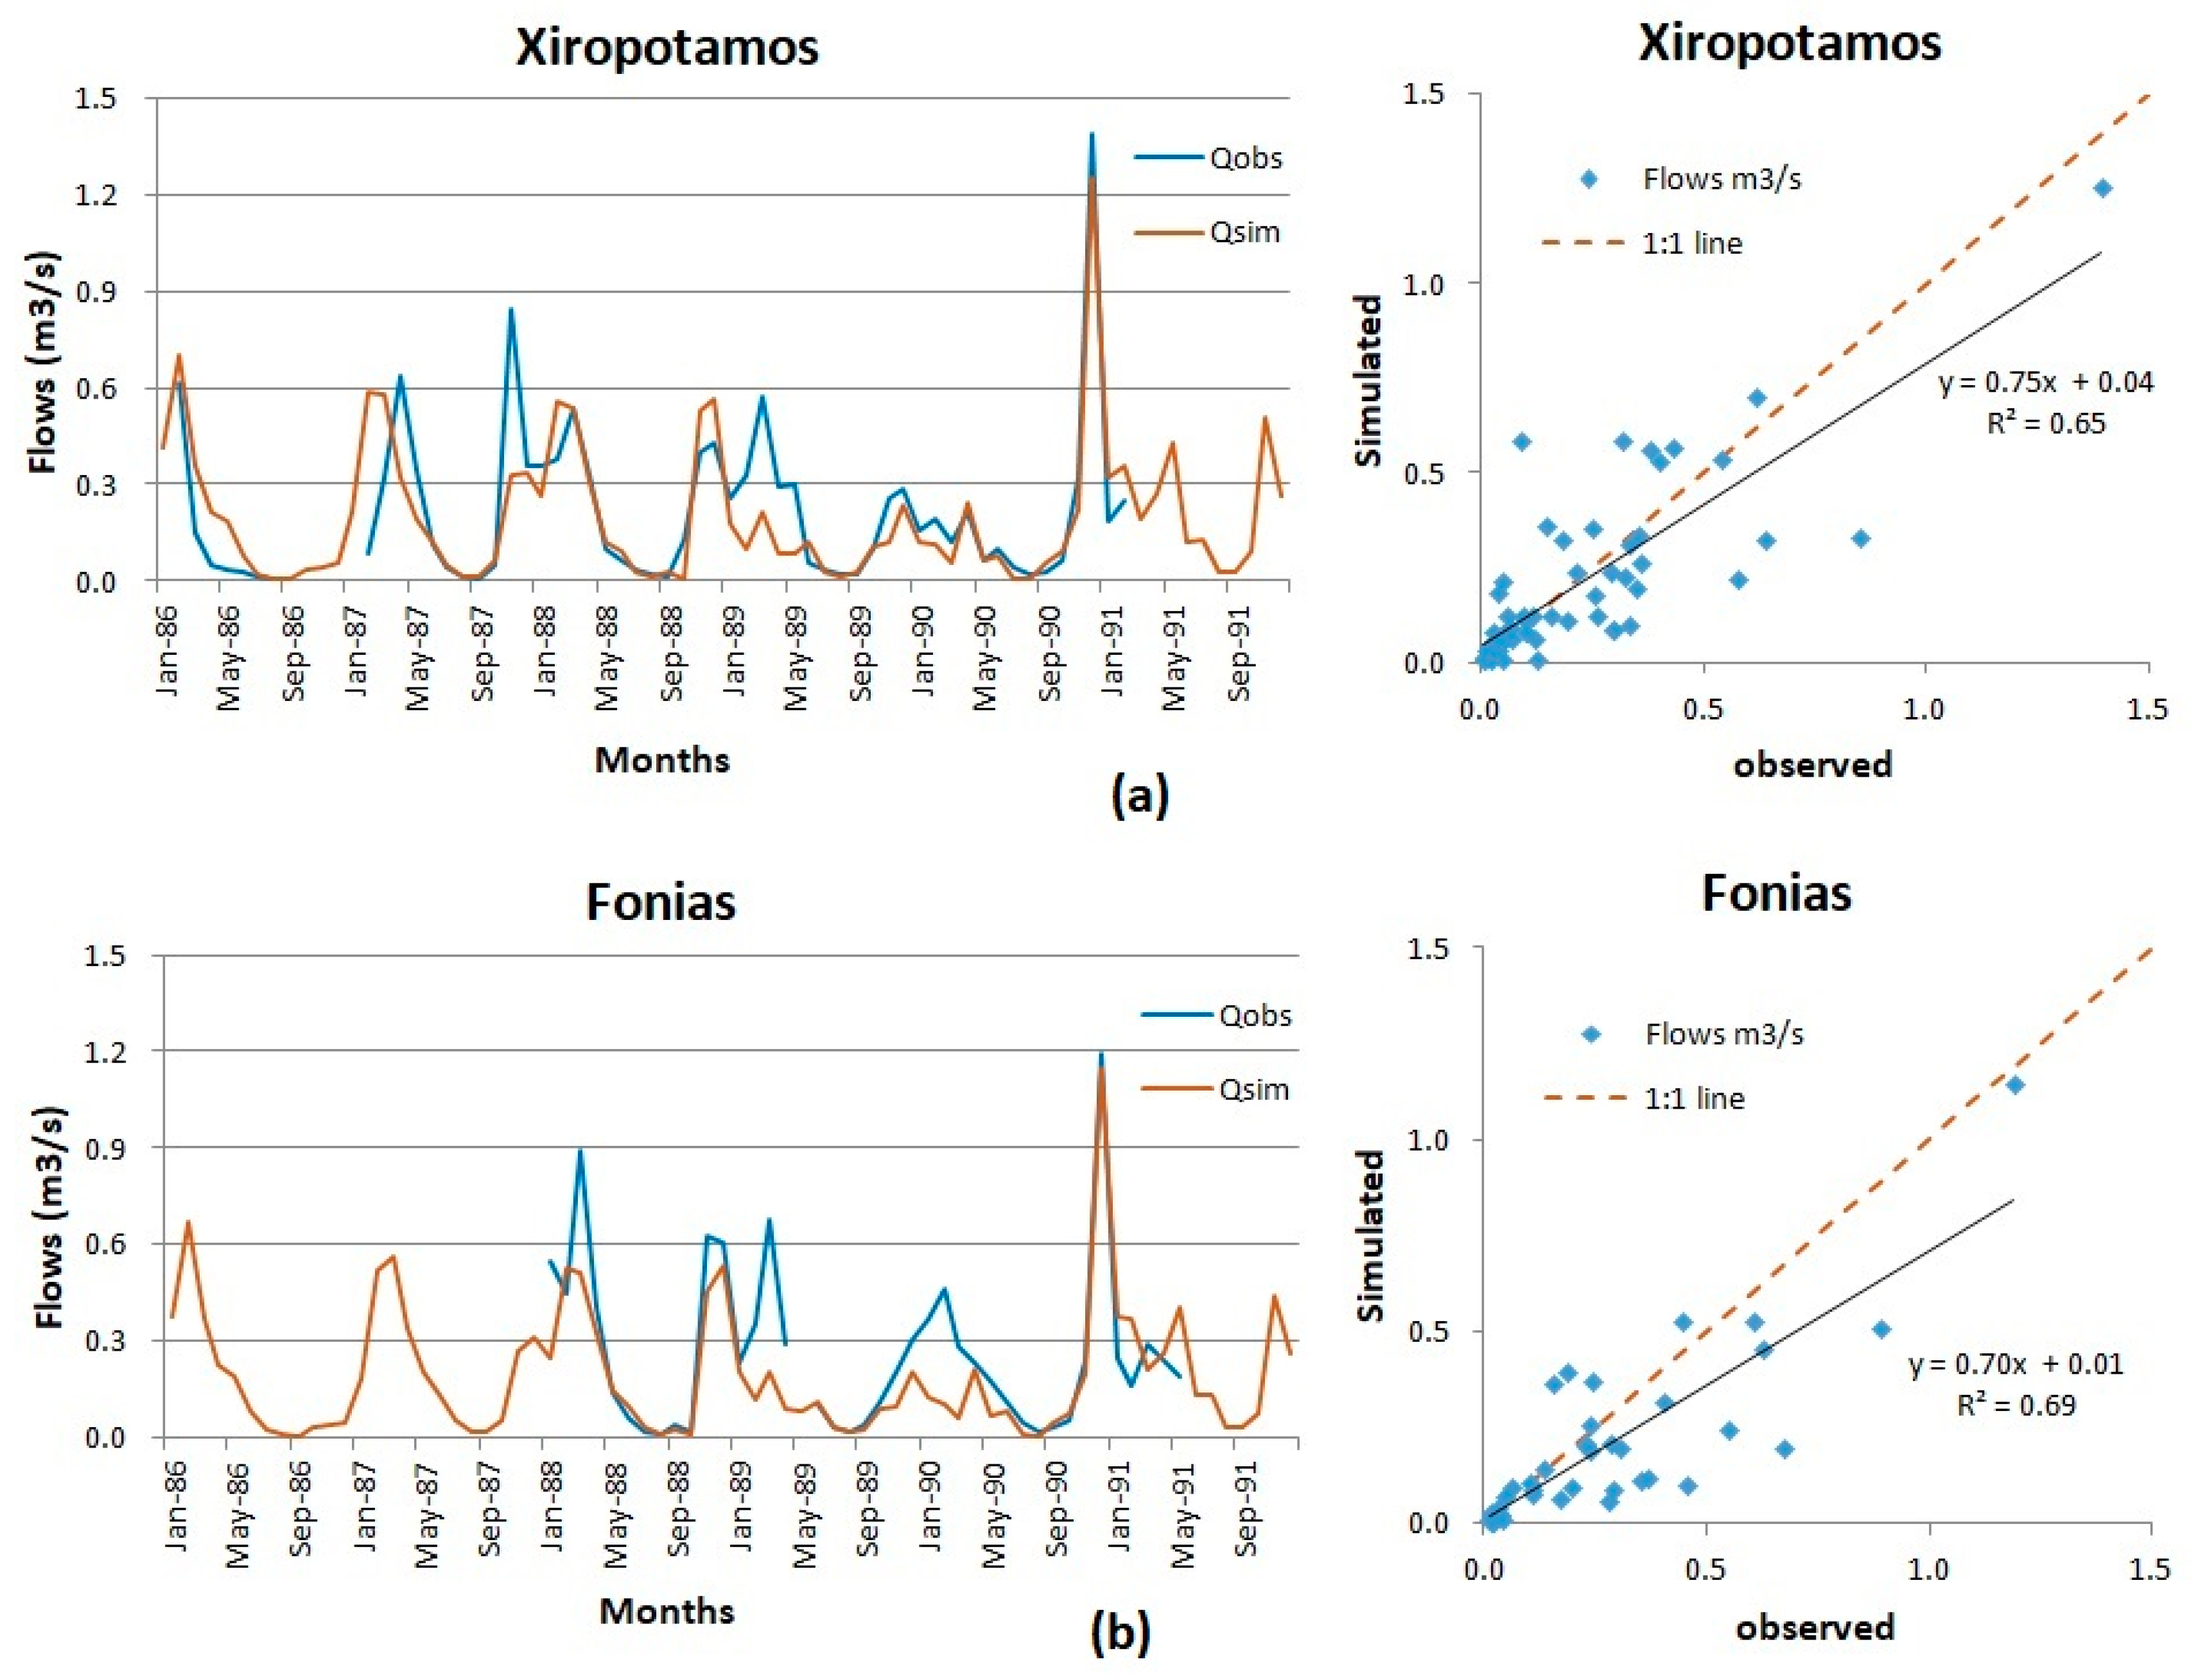
2.3. Samothraki Model Parameterization and Evaluation

SWAT needs spatial data representing the Digital Elevation Model (DEM), the land cover, and the soil map of the catchment, as well as meteorological data. Topography was represented by a 5 × 5 m elevation raster provided by the National Cadastre and Mapping Agency (Figure 1), while soil information was represented by a geological map (1:50,000 scale) provided by the National Institution of Geology and Mineral Exploration. To make use of this map in SWAT, which needs soil information for the topsoil layers (first very few meters), the existing impermeable and semi-impermeable geological types were associated to two textured soils (clay and silty clay loam) differing in their runoff potential (see Figure 2b). The CORINE Land Cover (CLC) database of 2000 [39] was used to represent land use, indicating that natural grasslands and sparsely vegetated areas predominate the island. After appropriate aggregations, Corine classification codes were converted to the SWAT land cover/plant codes, so a SWAT land-use data set was made, indicating that pastures cover 25% of the study area and rangeland covers 50%, with agricultural land being less than 15% and forest almost 10% (Figure 2c). The CORINE 2000 data were considered representative of the entire simulated period (from the mid 1980s until the mid 2000s) in this study, given the negligible differences compared with CLC 1990, the small differences with CLC 2006 (https://land.copernicus.eu/pan-european/corine-land-cover), and the discussions with experts. Three slope classes were defined and delineated based on the DEM: < 10%, 10–30%, and > 30% (Figure 2d). The study area was delineated in ArcSWAT with 97 subbasins covering in total 142 km2 (Figure 2a). The combination of land use, soil, and slope classes resulted in 366 HRUs in the study area.
The simulation period of the study was the 1984–2006 period for which we had meteorological data available, but the first two years were disregarded as a warm-up period. This period enabled the analysis to include the years 1986–1991 when the limited observed discharge data at the Fonias and Xiropotamos streams (Figure 2a) were available to calibrate the model.
Historical information on agricultural management was obtained from relevant literature [14,16] and personal communication with experts. It was concluded that the agricultural population of the island still follows the traditional agricultural ways, with grazing being the main activity, which occurs almost unrestrictedly from March to October in all the naturally vegetated areas of the island. Small ruminants in Samothraki were significantly lower in the 1980s than today; there were nearly 40,000 in the early 1990s, and those figures increased until 2000, but have since reduced again to the 1990s levels [16]. In this modeling study, we considered a stable number of ruminants throughout the simulation period equal to 45,000, representing closely the average of the simulation period 1986–2006 [16]. The sum of shrubs and pasture areas (105 km2) was used entirely for grazing. To simulate grazing, the appropriate animal manure type was selected from the SWAT database [40] and the typical daily consumption and deposition amounts for 45,000 sheep and goats were divided by the total grazing land. This resulted in a 1 kg/ha biomass consumption and manure deposition per day on our model’s grazing land. Between the four-month period between November and February of each year, grazing was not applied, assuming that animal owners collect their goats and sheep into farming facilities at the lower elevations of the island. Although this was not absolutely evidenced, there was agreement among experts that this was a rather common and certainly appropriate practice. Obviously, manure remains a significant source of nutrient pollution during the non-grazing period, but natural vegetation is not further consumed without an impact on soil loss, which is the issue addressed in this paper. Finally, the impact of certain cropping practices (type of cropping system, tillage) on the overall soil loss regime was not considered in this study, because for it to be realistic, a local survey would be required that was not available at the time of this research. However, any such impact is very small compared to the impact of grazing due to both the small cropping areas and the much smoother slopes and low elevations (less precipitation and rainfall erosivity) of the land where cropping takes place. Both manure management during the non-grazing period and a more detailed cropping management representation would be required in a nutrient pollution abatement study for the island of Samothraki.
The daily time-series of measured precipitation and air temperature had to be corrected with elevation for each subbasin based on an annual precipitation lapse rate of 35 mm/100 m and a temperature lapse rate of −0.65 °C/100 m [14]. Therefore, daily precipitation and temperatures in all the subbasins were defined according to the difference of their mean elevation from the elevation of the meteorological station and the above rates. This resulted in increased mean precipitation and decreased mean temperature for the island, which has significant mountainous areas with elevations up to 1611 m. The resulted mean annual precipitation for each subbasin is depicted in Figure 2e.
Monthly observed flows for the Fonias and Xiropotamos streams were available for the short period between 1986–1991 from the PPC. Unfortunately, even this period was not entirely covered, but there were gaps for several months. On the other hand, measured stream sediment loads were not available at all for Samothraki’s streams as in most Greek islands. In the country, such data exist only in continental Greece, which were collected by the PPC at river sites with hydropower generation potential [41]. Therefore, in this study, we do not refer to sediment loads transported by the streams, which are calculated by SWAT as a combination of the soil loss and the river sediment transport modules [37]. Instead, we limit the analysis at the land phase using the predictions of the model for soil loss using the MUSLE equation (Equation (1)). To ensure a realistic model performance, we rely on plausible parameterization of the model with respect to the input data that govern the components of the MUSLE. Previous experience with SWAT has shown that despite observed data limitations, a reasonably parameterized model that keeps the relative magnitude of parameters on a spatial basis (climate, land use, soils, slopes) can still be a good predictor, showing the vulnerability differentiation in time and space [42].
The central approach in many applications of the model where observed data for evaluation are limited is the uniform parameterization and calibration approach, where parameters are dependent on land use and soil type, and are simultaneously adjusted to all the available data in the model domain [43]. Thus, they were adjusted in the present study at two discharge gauge sites (Figure 2a). In contrast, a semi-distributed calibration approach would need the use of different parameter sets in different gauged subbasins, which is not possible for most of the Samothraki’s ungauged catchments (Figure 2a). Nevertheless, in this study of limited spatial extent and similar geomorphologic characteristics across the island, we can take advantage of the catchments with known data to represent the hydrology at the ungauged sites, and thus to transfer data to the ungauged catchments from the proxy basins of Xiropotamos and Fonias (Figure 2a), finding a priori values of many parameters [44,45]. A critical point in the present modeling with scarce data is also that calibration adjustment is limited to only a few parameters, while trying to keep the default values for most of them. This helps to avoid the over-parameterization of SWAT, which has proved to be a very efficient model in predicting river flows under measured data limitations [46,47,48].
The curve number (CN) and soil available water capacity (AWC) have been found to be very sensitive parameters that primarily govern the generation of runoff and soil loss and subsequently streamflow and sediment transport in SWAT, while the KUSLE, CUSLE, LSUSLE, and PUSLE parameters of the MUSLE equation (Equation (1)) have also been found to be very sensitive in simulating erosion [36,42,49,50,51]. So, for the hydrologic parameterization/calibration, the main parameters that were adjusted were the curve numbers (CNs) governing surface runoff and the available water capacity (AWC) of soils. The two different soil types of the present study were parameterized according to previous experience [42,50], and their AWC was further adjusted so that the simulated monthly flow graphs at the two gauge sites (see Figure 2a) resembled in magnitude the observed ones to the greatest possible extent, while at the same time, the relative magnitude of the two soil types in runoff remained plausible. The other important SWAT parameter for calibration, especially for the peak runoff rates and the shape of hydrograph, the CN2 value, is associated to a specific land-use and soil drainage type in SWAT, which updates the CN values of each HRU according to soil moisture [37]. The default CN2 values were lowered by almost 10% for all HRUs; thus, their relative magnitude among different land-use types remained plausible. For example, forested land had consistently lower CN2s compared to pastureland and agricultural land. Table 1 summarizes the land-use and soil-type dependent parameters used in the present modeling for runoff, streamflow, and soil loss simulation. The numbers represent the final (best) values identified through a manual calibration of the model for monthly streamflows and an empirical estimation of annual soil loss.
As can be seen in Table 1, CN2 values were systematically higher for agricultural land, pastureland, and rangeland than for forest, with the highest and lowest value of each land-use type referring to the impermeable (clay) and the semi-impermeable (silty clay loam) soil type respectively (hydrologic groups D and B). The CUSLE coefficient is the default initial value assigned by SWAT to each land-cover type, and is updated daily during the simulation according to the growth cycle of the plant and its canopy development [37]. Forest and pasture result in dense ground cover, and by default had much lower values of CUSLE than agricultural land, protecting the ground from erosion to a greater extent. Moreover, all the areas of the island were modeled without support practices; thus, the PUSLE coefficient was set to its default and maximum value (1.00). Moreover, no change was made for LSUSLE as slopes and slope lengths were defined based on the DEM. For the soil parameter KUSLE, a safe approach would need observed data of sediment yields downstream of certain soil-typed subbasins. In the absence of any data, we used values of similar soils modeled in Western Greece [52]. Finally, similarly to AWC, the parameter of soil hydraulic conductivity (SHC) was defined in such a way as to range according to the soil hydrologic group (Table 1). Conductivity increases with soil permeability and drainage, contrary to AWC, which decreases. Their exact values in Table 1 resulted during flow calibration, but their relative magnitude was preserved close to the physical behavior of semi-permeable and impermeable soils. Finally, small adjustments were made for two groundwater parameters in SWAT that were found to improve the shape of the simulated hydrographs. The threshold depth of water in the shallow aquifer for percolation to occur (GWQMN) was lowered at 100 mm, and the deep aquifer percolation fraction (RCHRG_DP) was lowered to 0.01. For channel erosion processes, the relevant parameters of SWAT [40] were not adjusted, as this study does not address sediment transport and does not report river sediment loads at any subbasin outlet.
The parameterization/calibration approach presented above resulted in the graphs of Figure 3, which show the simulated versus observed flows for the two sites at the Xiropotamos and Fonias streams, respectively (Figure 2a). From the observed monthly data in Figure 3, it can be seen that representing the flow regime in Samothraki was rather hard. In both streams, especially Fonias, the observed monthly data had gaps. Moreover, there was difficulty in capturing some observed peaks. For the inconsistencies in both charts on the left of Figure 3, there was no other explanation than the precipitation non-representativeness for specific events, which was not unexpected given the limited and old meteorological infrastructure, which was located outside the island.
The scattergrams on the right part of Figure 3 demonstrate a positive correlation and a comparable magnitude between observed and simulated predictions. Simulated monthly flows were found to be either above or below the 1:1 line, indicating that the model does not exhibit a tendency to systematically overestimate or underestimate them. However, the majority of monthly flows were underestimated for Fonias stream. This was safely attributed to precipitation underestimation, as matching observed flow peaks within 1988–1990 was not reasonably possible by further adjusting the model parameters. From our analysis, it was concluded that the observed magnitude of Fonias stream flows could only be captured with a meteorological station in the northeastern side of the high mountain massif of the island.
Nevertheless, even with the corrected rainfall of the single available station close to the island and the present parameterization, the data pairs are not very far from the 1:1 line, so the model predicted a magnitude that was comparable to observed data. The coefficient of determination, although not perfect, was marginally acceptable for both sites [53], showing that the model followed the monthly variation of flows. Overall, given the very limited and old monitoring data (precipitation and flows), the graphs show an acceptable performance of SWAT in reproducing river discharges, which were governed from the land hydrology that forms the basis for soil loss from land to waters.
On the other hand, the calibration of river sediment discharges was not possible on the basis of a comparison between observed and simulated time series, as already explained. Instead, the annual prediction of the model for the island of Samothraki could only be compared with reported river sediment yield values, which were expressed in tonnes of sediment material per unit area of the upland catchment, on areas with similar characteristics. Such estimates based on the PPC measured data of 1965–1980 for a large number of rivers in continental Greece have been summarized in Zarris et al. [41]. The river basins with a similar steep topography with Samothraki along a NW–SE gradient (Aoos, Arachtos, Acheloos, and Evinos) were reported to have annual soil losses between 10.5–21.5 t/ha. At least for the Arachtos basin, which has a typical Mediterranean climate, very steep slopes, and main land uses that are similar to Samothraki, the mean annual soil loss has been also estimated at 14 t/ha, and this of the most erodible HRUs close to 150 t/ha [42]. In accordance with those estimates, the present modeling study predicted a 15.82 t/ha annual soil loss (see the Results section) and maximum HRU losses >100 t/ha. Hence, we do believe that the soil loss model predictions in this study are reasonable, as they are comparable with estimates within the Greek territory, but also because of a plausible parameterization of the hydrologic model that appropriately fed the MUSLE (Equation (1)).

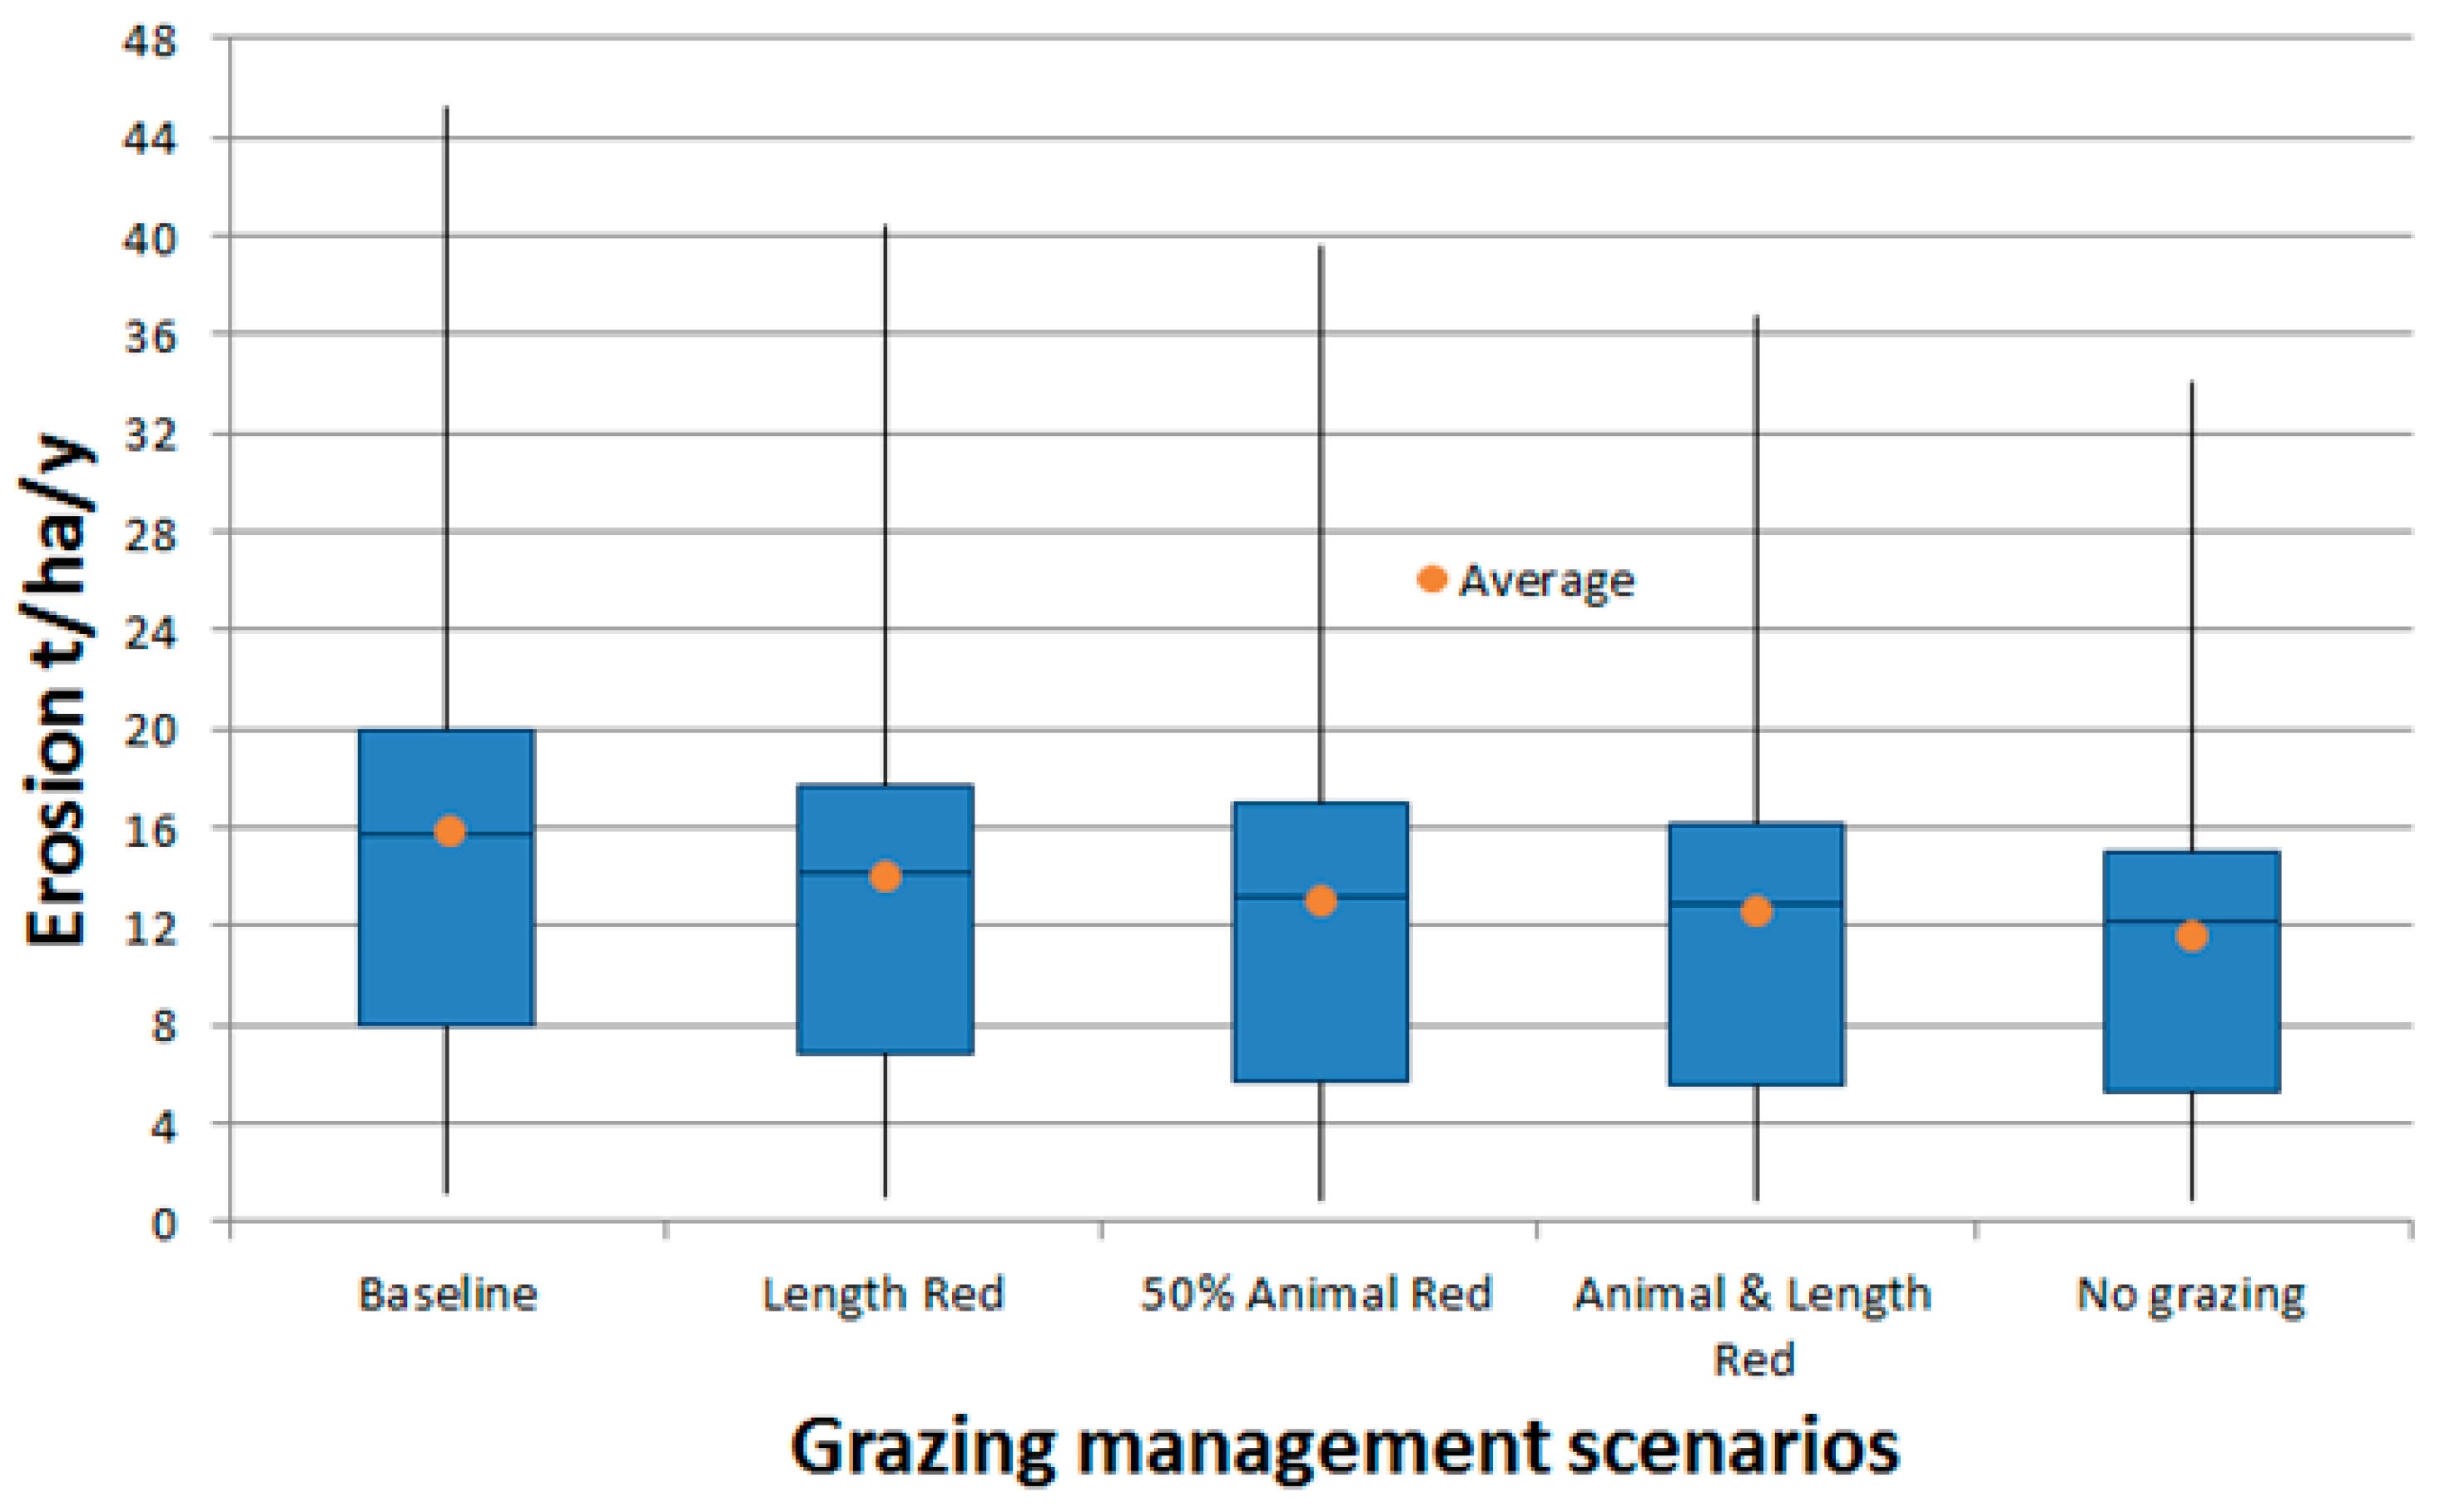
2.4. Scenarios: Grazing Management and Livestock Abandonment

Four alternative scenarios related to the traditional grazing simulated in the baseline were tested in this study. The scenarios included technically feasible and easy to implement practices: a reduction of the grazing period by two months, a 50% reduction in livestock stocking rates, a combination of the previous two, and finally, the no-grazing option in the island of Samothraki. Changes in the spatial allocation of grazing across Samothraki were not explored in this study, since any alteration in its extensive character was not considered realistic in the present study. On the other hand, no grazing, which is also considered unrealistic, was also an option that was interesting to explore just to provide us with an upper bound of the soil loss reduction potential from livestock in Samothraki. Table 2 summarizes the alternative scenarios along with the baseline one, providing the rationale and how they were implemented in SWAT. It should be noted that this study deals with the environmental effect of scenarios only, with the analysis of their economic effects being beyond the scope of the present study. In order for the economic effects to be realistically integrated, the actual data related to the livestock economic activity should be used in a future study toward the estimation of a metric of cost-effectiveness of the grazing management scenarios in reducing soil loss.
The grazing operation in the SWAT model simulates plant biomass removal and manure deposition by livestock on pasture and rangeland HRUs over a specified period of time based on the input information, which includes the time of initiation of grazing and the length of the grazing period, as well as the daily biomass removal by grazing [40]. A daily biomass removal of 1 t/ha was defined at the baseline scenario based on the type and number of animals (45,000 goats) and the total grazing land (almost 10,500 ha). Grazing was initiated on 1 March and lasted for 250 consecutive days; thus, it ended at the end of October of the same calendar year. For the grazing period reduction scenario, the length of the grazing period was assumed to start at the beginning of May instead of the beginning of March, thus allowing an increase in natural vegetation growth during March and April. The breeding of goats during these two months was assumed to take place indoors.
In SWAT, when biomass is removed by grazing, the plant’s leaf area index and accumulated heat units are set back by the fraction of biomass removed. This has an immediate effect on the CUSLE coefficient of the MUSLE (Equation (1)) for the land-cover type, which is updated daily based on the amount of residue on the soil surface [37]. As grazing reduces soil vegetation coverage, the factor is updated increasingly, thus resulting in more erosion and soil loss. It should also be noted that a minimum plant biomass for grazing to occur is provided by SWAT in order to avoid grazing when vegetation is very limited. Since such restrictions are unlikely to occur in Samothraki, this threshold was not set in this modeling. The four alternative scenarios (2–5) of Table 2 were executed with SWAT for the same time period (1986–2006) and climate conditions of the baseline scenario to let the model attribute soil loss reductions solely to grazing alterations.

3. Results

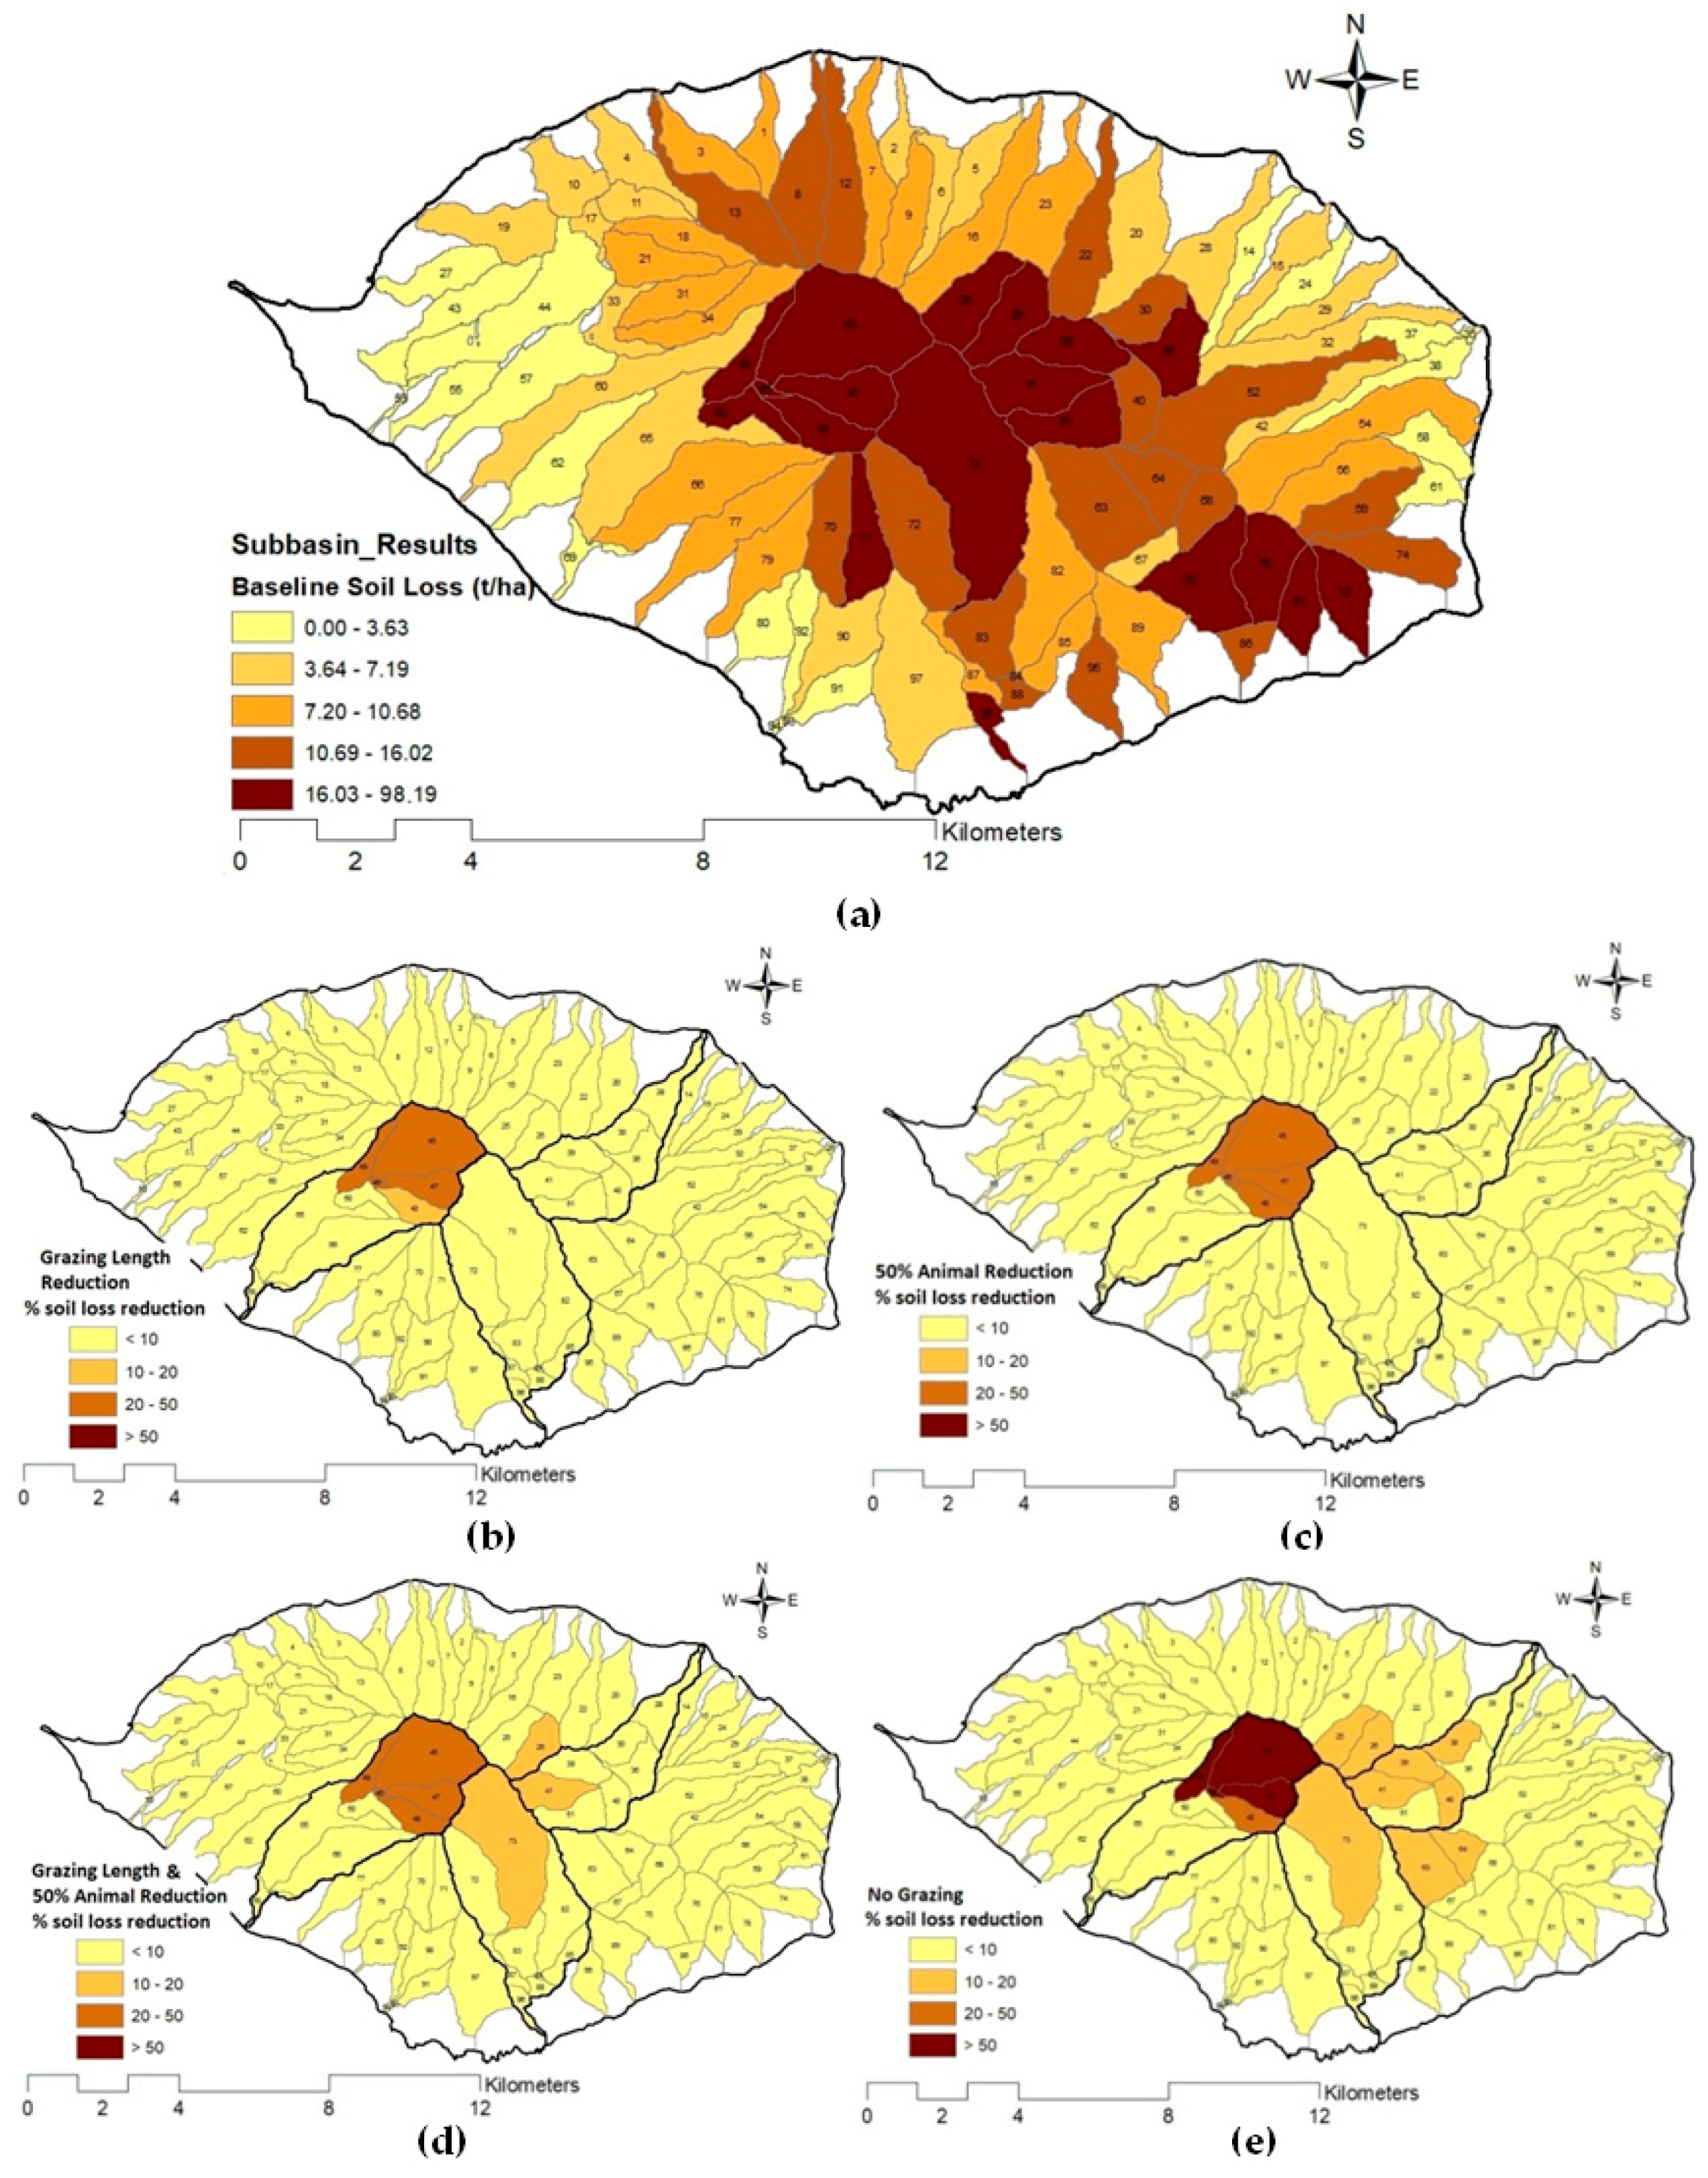
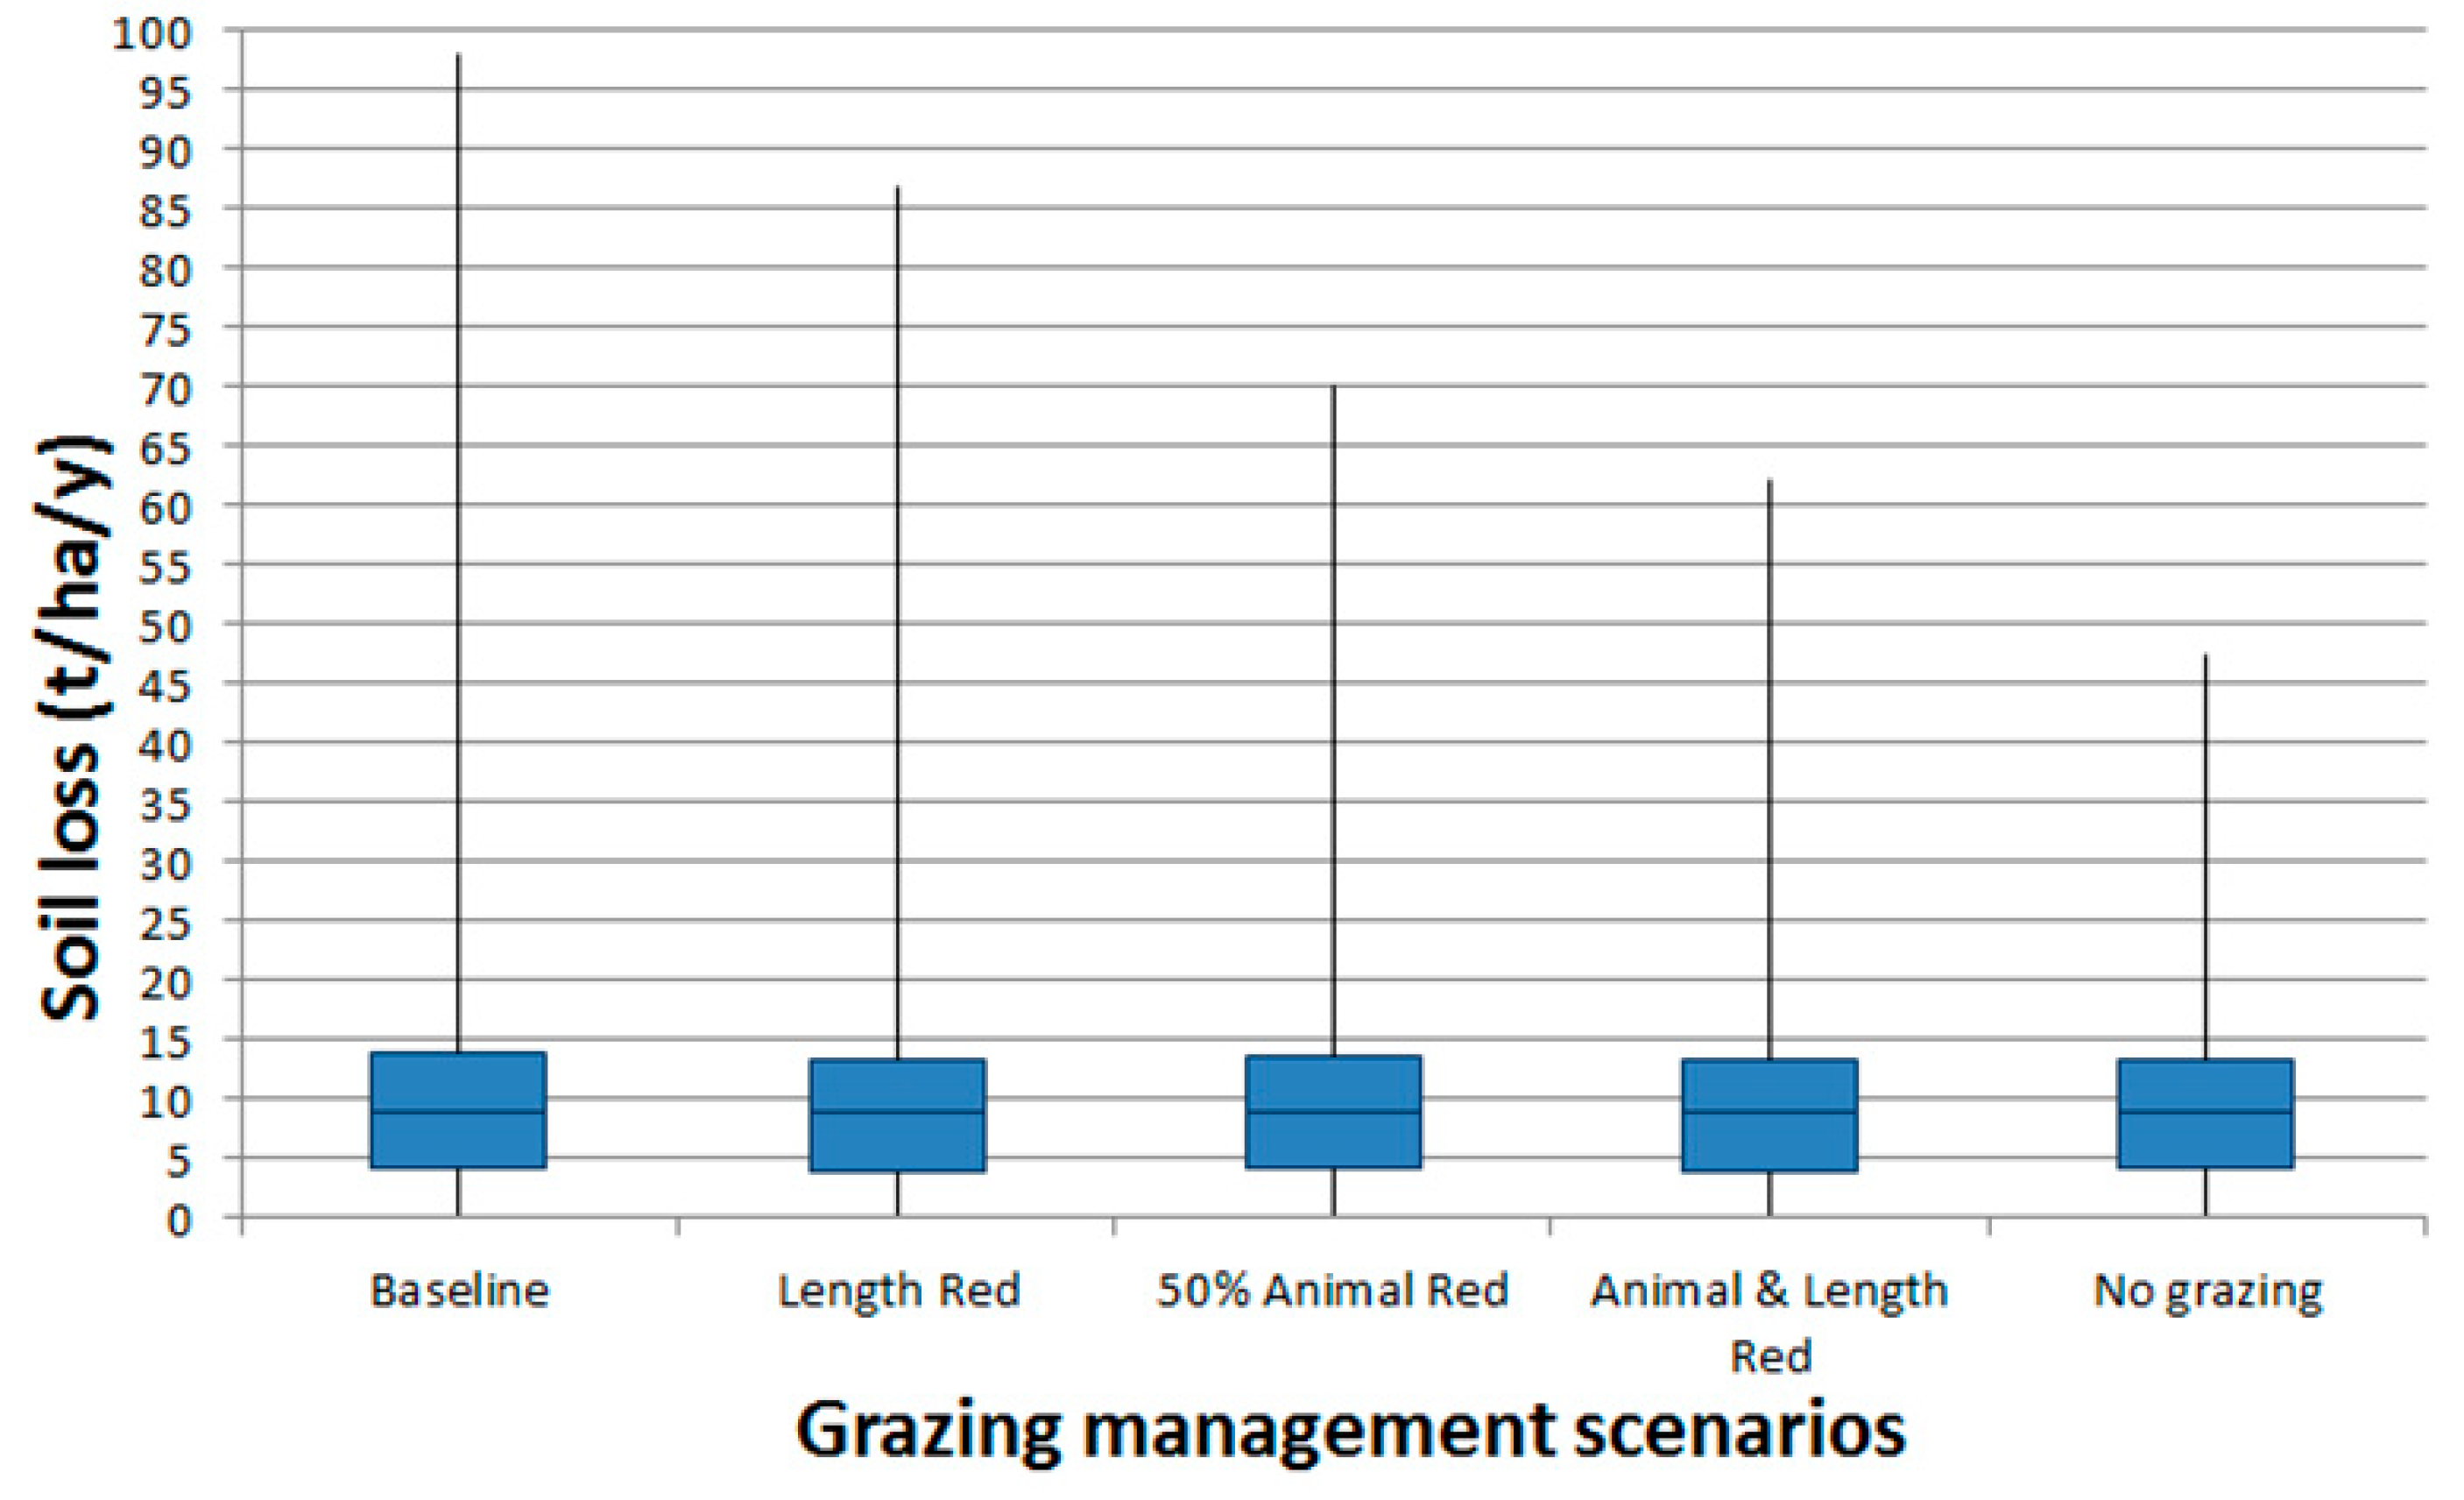
3.1. Annual Soil Loss in Samothraki

The baseline simulation with the actual grazing gave the following mean annual results with regard to water balance and soil loss (Table 3). Apart from averages for the entire island (simulated area 142 km2), values are given for the three basins of Fonias, Xiropotamos, and Vatos, as indicated in Figure 2a. Due to the mountainous land of those three basins, precipitation and snowfall (given as part of the total precipitation) were much higher than the averages for the entire island. This was the case for runoff, which—due to the low soils’ permeability and very steep relief—was enhanced in Samothraki, and even more in the three basins. Evapotranspiration, on the other hand, was almost stable across the island. The mean annual soil loss was calculated to be nearly 16 t/ha on a mean annual basis with the respective values for the three basins being higher than the island’s average. This was expected due to a number of soil loss factors such as higher precipitation and average slopes and a greater percentage of grazed areas by animals, which made the three basins—especially Xiropotamos—more prone to erosion and soil loss per unit area of land.
The simulation of the alternate scenarios resulted in small alterations of runoff and evapotranspiration, but in considerable, although not impressively large, reductions of soil loss from the land of the entire island. Figure 4 summarizes the variability of the annual soil loss in Samothraki within the 21-year period of simulation (1986–2006) under all the tested scenarios (baseline included). Clearly, there is a consistent reduction of almost all the statistical measures depicted in the box plots, namely the maximum annual soil loss within the 21-year period, the medians, the 25th and 75th percentiles, and the averages. The 50% animal reduction is more effective than the grazing period reduction, but their combination has additive effects. The most effective scenario is the no-grazing option, which can reduce the mean annual soil loss in the island at 12 t/ha, 25% lower than the baseline, and the worst year’s (maximum) soil loss from 45 t/ha to 34 t/ha.

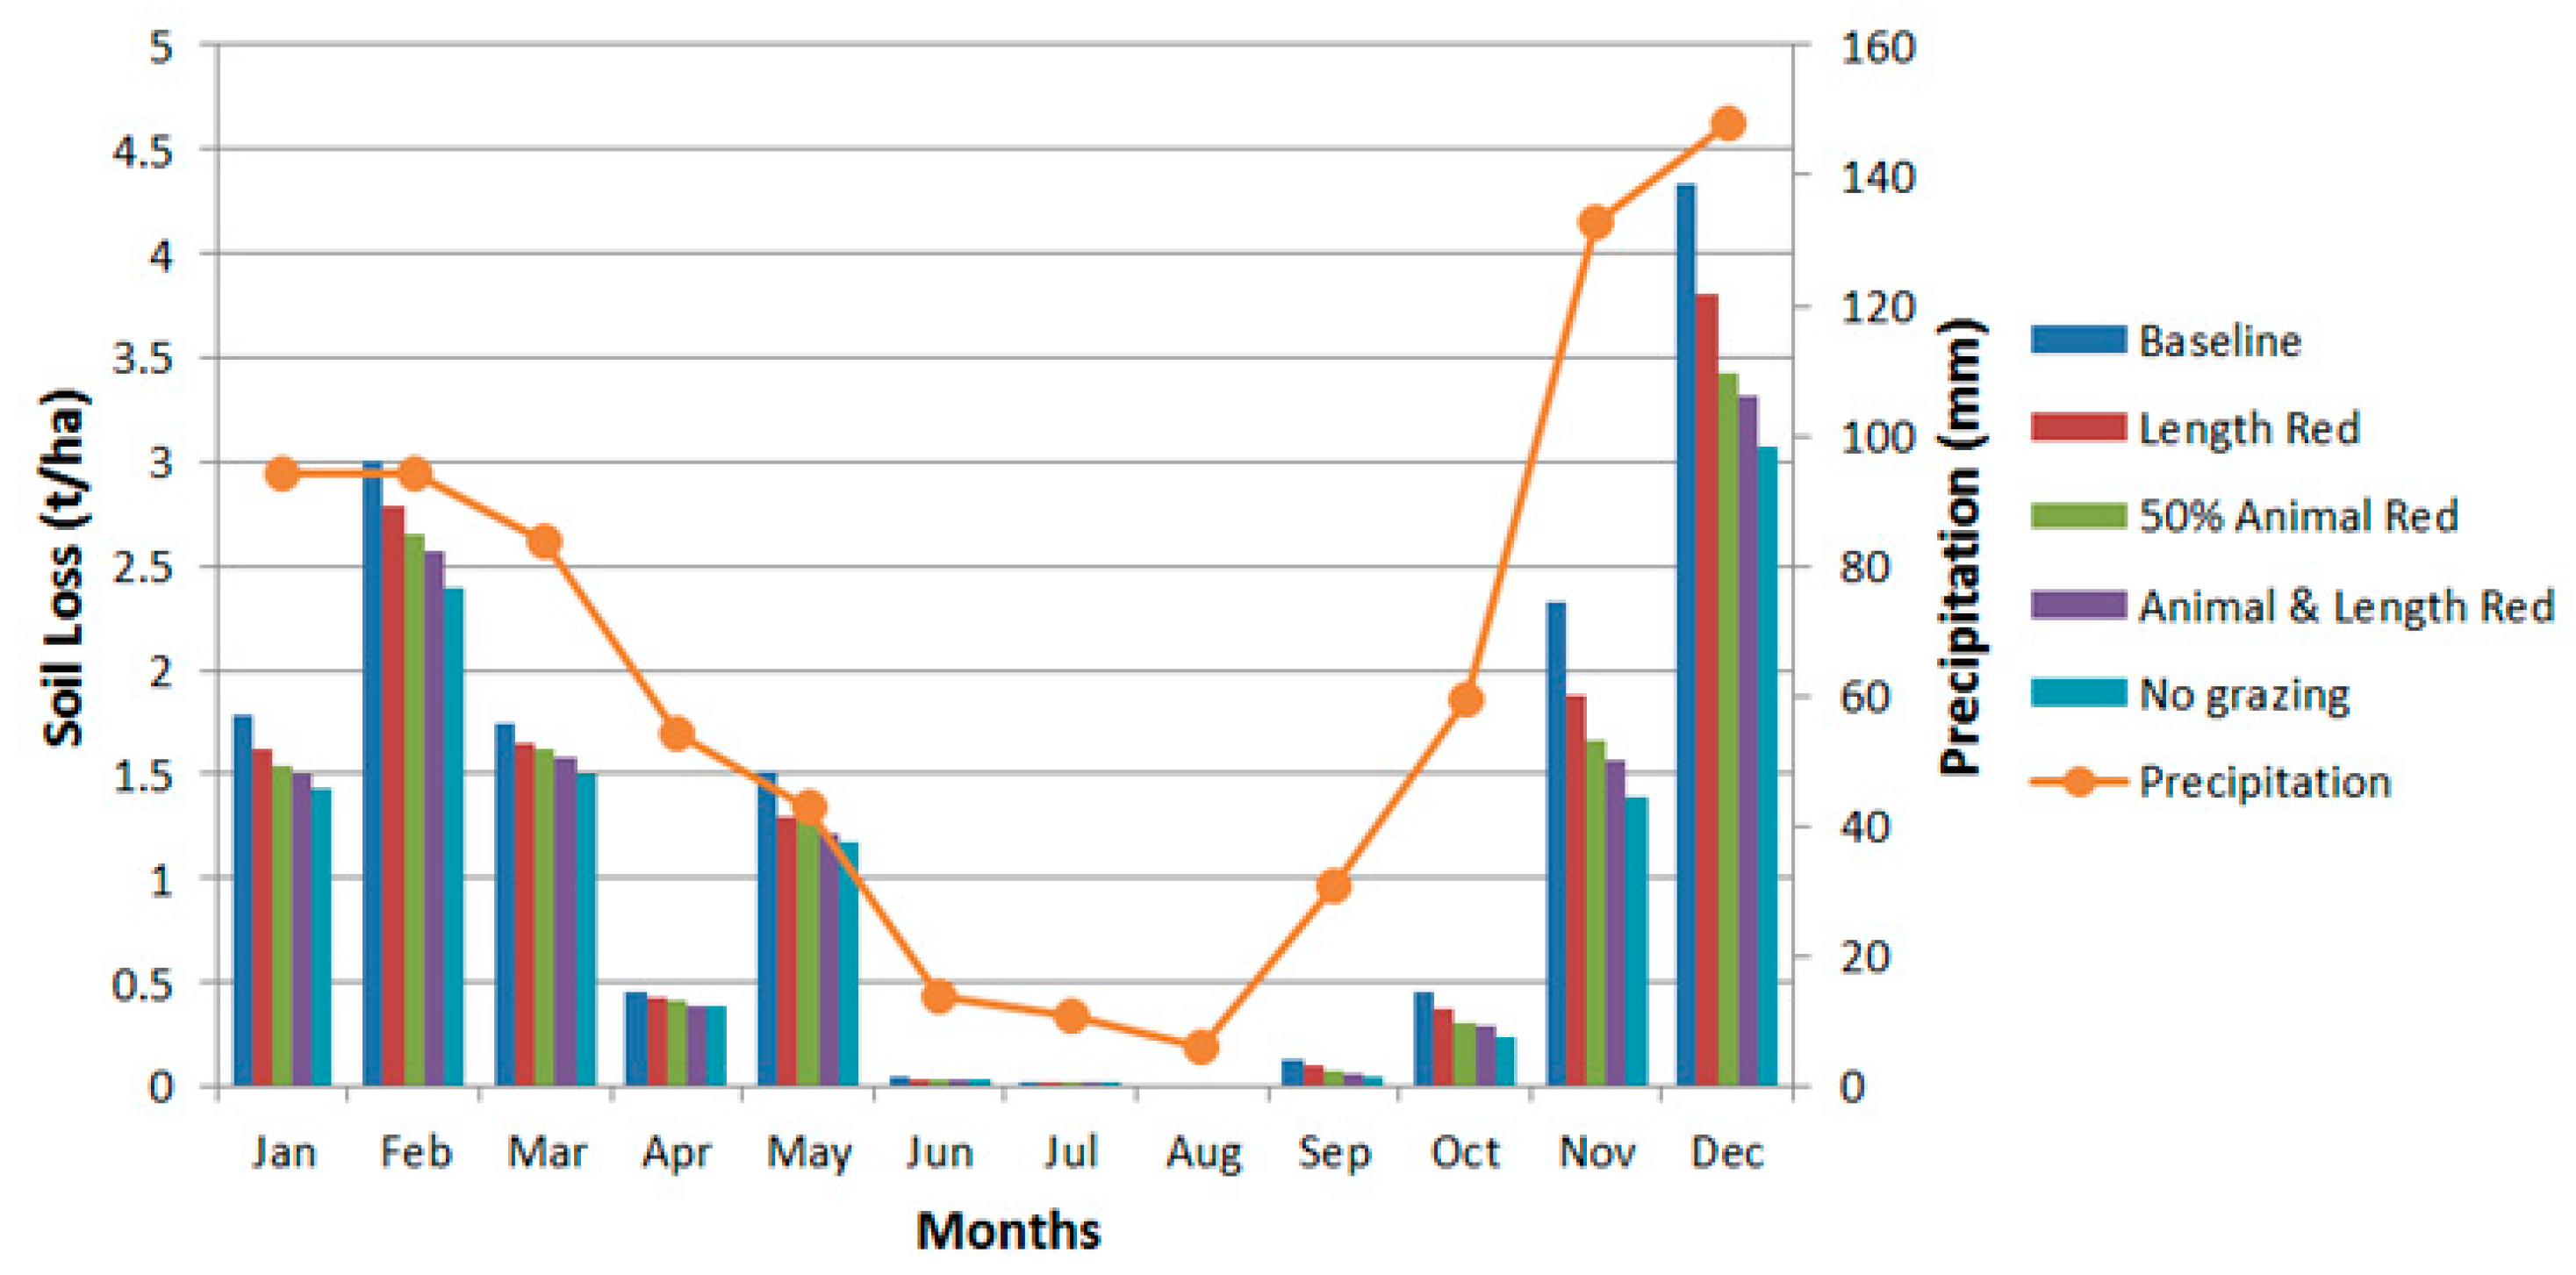
3.2. Temporal Variation of Soil Loss in Samothraki

The seasonal variation of Samothraki’s soil loss with and without the implementation of grazing management scenarios is depicted in Figure 5. The bars show the mean monthly soil loss of the entire simulation period under all the scenarios, with monthly precipitation demonstrated in parallel. Similarly to the annual results presented in Figure 4, the monthly variability revealed the same ranking of grazing management options with respect to their effectiveness in reducing soil loss. Their relative performance was stable in all months of the year, with soil loss being consistently pronounced within the year. Soil loss was higher in December and February and significant in January, March, May, and November. This was initially expected due to the Mediterranean precipitation pattern, which caused runoff to vary significantly between the wet and dry seasons. Inevitably, much greater losses of soil occurred during winter months when precipitation depths were the highest within the year, causing flash floods and significant erosion, which was enhanced by the dominant impermeable soils [13]. The greater soil loss in February compared to January is attributed to the more intense events that occured during February, although the mean monthly precipitation depths were very similar. On the other hand, the soil loss difference between April and May is additionally explained by the vegetation characteristics. In May, Samothraki’s land was more susceptible to erosion due to the accumulated grazing of March and April that had reduced vegetation coverage and the natural protection of land against erosion and soil loss. The following dry period of the year (June–September) resulted in almost negligible soil loss due to the very small precipitation and surface runoff generated.

3.3. Spatial Patterns of Soil Loss in Samothraki

The spatial soil loss pattern across Samothraki is presented in Figure 6a, demonstrating the differentiation of losses per subbasin. As can be seen first, significant soil loss rates (> 3.5 t/ha) occurred in many areas across the landscape. The greatest rates occurred in the central part of the island, as well as in some areas in the southeastern part. Subbasins with soil loss rates < 3.5 t/ha were only found in the western part, where the ground is smooth (Figure 2d) and used for agricultural cropping (Figure 2c). The most erodible areas of the island were expected to be in the central part because of the numerous relevant factors. As has been shown previously (Figure 2), these areas are at the same time very steep (slopes > 30%) and were pressured by deforestation and overgrazing, while due to the high altitudes (Figure 1), precipitation was higher there. Figure 6a demonstrates that this part of the island was severely eroded, with soil loss rates > 16 t/ha; thus, it could be characterized as a Mediterranean hot spot of soil erosion [4]. Moreover, Figure 6a can demonstrate that almost half of the subbasins of the island had annual soil losses greater than 10 t/ha, and more than half of the island was above the rate of 7 t/ha of soil losses per year. These results reveal a significant total soil loss in the island of Samothraki that can characterize most of its area as land with high erosion vulnerability.
Figure 6b–d and e depict with color differentiation the magnitude of soil loss reduction at the subbasin level from the implementation of the four alternative scenarios. Grazing length reduction (Figure 6b) resulted in a considerable reduction of soil loss only on the headwater subcatchments of the Xiropotamos stream at the mountainous central part of the island. Among them, most had soil loss reductions greater than 20%, and a small one had reductions greater than 10%. The 50% animal reduction scenario added the latter to the higher class of > 20% soil loss reduction (Figure 6c), while the combination of the two practices added three more subbasins in the class of > 10% soil loss reduction (Figure 6d), with the two of them being the headwater subcatchments of the Fonias and Vatos streams, respectively. Non-grazing has resulted in the most effective soil loss reduction in the island by adding a few more subbasins in the second class of soil loss > 10% and by dramatically decreasing the soil loss from the headwater subcatchments of Xiropotamos, moving them to the fourth and most effective class of > 50% soil loss reduction (Figure 6e). It should be noted that under all the scenarios, the majority of Samothraki’s subbasins located at lower elevations remained within the first class of < 10% soil loss reduction. Except for the ones non-dominated by grazed land, erosion in others could be reduced up to 10%, which, based on the standards of this study, was not considered significant enough to alter the local erosion regimes. The soil loss reduction results shown on the maps of Figure 6 depended highly on the level of the actual (baseline) soil loss. The largest reduction levels at the most eroded subbasins was not unexpected, as in those areas, the co-existence of the steepest slopes and the largest grazing land formed the background for the high potential of erosion mitigation when the pressure decreases.
The latter is supported by the box plots of mean annual soil losses from the 97 subbasins under the five simulated scenarios, as demonstrated in Figure 7. The subbasins’ mean annual soil loss variability (t/ha) shows that the main difference between scenarios was at the level of the maximum rates, namely at the subbasins having the highest soil losses. The upper parts of the box plots show that the most eroded subbasins met significant reductions, with the top eroded ones meeting soil loss reductions from the level of 100 t/ha (baseline) to the level of < 50 t/ha if no grazing occurred. On the other hand, quartiles are on almost the same level, showing that the majority of subbasins met low reductions of soil loss.

4. Discussion

As a simulation study, uncertainties in Samothraki’s model predictions may arise from various sources. Meteorological and land-use information, the Modified Universal Soil Loss Equation for soil loss estimation, and the uncalibrated soil loss predictions are considered potential uncertainty factors in this work. Rainfall was obtained from a single station with available data, and was corrected with elevation. Still, the resulted areal precipitation (772 mm, Table 3) is lower than the precipitation estimated by Karavitis and Kerkides [32] for Samothraki (> 1000 mm), while local events that are usually around the steep mountainous sides of the island could not be captured by the limited available information. Another possible limitation is the land-use information used in the modeling due to the generic land-cover types in the original map that did not allow a straightforward association with the SWAT land-cover types. For example, the types of ‘schlerophyllous vegetation’, ‘natural grasslands’, ‘sparsely vegetation areas’, and ‘land principally dominated by agriculture, with significant areas of natural vegetation’, are theoretically areas that are adoptable for grazing in Samothraki. To assign them to SWAT types and allow grazing to occur equally on all of them, we based our measurements on available literature [13,14,16] and expert judgment. However, a more accurate land-use map and definition of grazing extent based on in situ visits and local evidence may have improved the present representation, including the distinction of land into pasture and rangeland in SWAT, which impacts on the results. In line with this, it has to be also underscored that there are some areas on the mountainous part of Samothraki covered by bare rocks, which result in rock debris (large boulders) transportation within the stream beds, and then toward the coast. However, bare rock areas and the associated debris transport were not represented in the present modeling, possibly resulting in an underestimation of the true total eroded material.
Moreover, it cannot be disregarded that modeling is never a perfect representation of the natural processes. Although processes in SWAT are well described according to general established knowledge [37], they may not be appropriate under particular local circumstances. Even the widely used MUSLE-based method, which was central to this work, has been criticized for its inability to recognize the physical rationale behind the erosion process [54]. Moreover, discussion with experts has supported that SWAT grazing representation may have not been able to capture the accumulated grazing impact on land degradation and soil loss over the years, overestimating the vegetation regrowth rates in between two grazing periods, thus underestimating the total soil loss and the soil loss reduction levels of the grazing management scenarios tested. The uncertainty of predictions could be reduced in this study if measured sediment discharges of Samothraki’s streams were available. Unfortunately, such data are difficult to monitor on a stable basis in order to assist continuous models in reproducing accurately the inter-annual and intra-annual variability of erosion and soil transport processes. Hence, the only alternative was to compare the present long-term estimates with measured data from other catchments, and the similarity between them allowed us to accept the annual estimates of soil loss.
Our modeling was focused on the most crucial parameters, avoiding the over-parameterization of the model and maintaining control over the model behavior. Hydrologic performance, which is the basis of soil loss simulation in SWAT, was evaluated at two gauged catchments by assigning uniform land-use and soil-type dependent parameters that could be easily transferable to the numerous neighboring catchments with similar hydrologic behavior, but no available monitoring data. Samothraki is comprised of various typical Mediterranean catchments, with quick responses and a rapid rise of peaks due to the precipitation pattern, their very steep slopes, and the dominance of shallow groundwater aquifers [13]. This situation causes high soil losses from the ground, which mainly occur within the wet periods and particularly during flush floods that may be catastrophic, e.g., the September 2017 flood destroyed parts of the island’s capital city, including the town hall, a number of roads and bridges, and even a part of the 700-year-old Tower at Fonias stream outflow [16,18]. Therefore, even with the current field data and model limitations and according to the familiarity with the study area and the plausible definition of model parameters, it is believed that soil losses have been also reasonably reproduced on a monthly basis and across the HRUs of the modeling study. It is generally considered sufficient to accept both the large time-step predictions of the model and the subbasins differentiation in annual soil losses to waters, because when calculating aggregated results, limitations are attenuated, and the reliability of the estimates increases. Similarly, it is considered sufficient to accept the ranking of the different scenarios and their relative magnitude in reducing soil loss across the island.
Therefore, this research work attempted the identification of vulnerable areas in soil losses by considering the best available topographical, meteorological, soil, land-cover, and management information across the landscape. SWAT summarized the influence of those factors, and produced soil loss estimates across Samothraki for various grazing management scenarios, which, if not adapted for concluding certain soil loss rates or soil loss reduction levels, they are at least able to give a broad and reliable overview of the soil loss pattern across the landscape. The baseline pattern (Figure 6a) agrees with the vulnerability of Samothraki’s landscape, which is expressed as actual soil erosion risk in Myronidis et al. [14], and shows that a large area extended from the center of the mountainous island to the adjacent steep headwater areas of its streams is highly vulnerable to erosion and soil loss.
The produced maps herein assist in recognizing areas that contributed disproportionally large amounts of sediments facilitating the targeting of mitigation measures to the land at highest risk. Moreover, they assist in recognizing which of those areas have a high potential for soil loss reduction with grazing management. We summarized this land, which includes the upstream (headwater) subbasins of the majority of catchments all around the island, as occupying a total area of almost 30 km2, as depicted in Figure 8. According to the model’s estimates, soil loss in Samothraki (simulated area 142 km2) under the present situation of animal grazing was 225,000 t/y or 15.82 t/ha. By aggregating losses from certain subbasins, the total mean annual soil loss from the indicated 30 km2 area (Figure 8) was 120,000 t/y or 40 t/ha. The respective numbers for the rest of the island’s area (112 km2) were 105,000 t/y or almost 10 t/ha.
Even if not adopting the above actual values, one could rely on the more certain and acceptable estimate that almost 20% of the island’s area—concentrated in its central steep mountainous part (Figure 8)—contributes a disproportionally large amount of sediment to waters per unit area, while its contribution may exceed 50% of the total soil loss, making it the main factor responsible for Samothraki’s streams sediment transport.
Among the grazing scenarios implemented, grazing length reduction, a 50% reduction in livestock stocking rates, and their combination, reduced annual soil loss by 10%, 17%, and 20%, respectively. No grazing resulted in a 25% decrease, and translated to a soil loss reduction of 55,000 t/y from the entire island. The subbasin results showed that the greatest part of this amount came from the highly vulnerable area of the central island (Figure 8), where normal vegetation growth under no grazing resulted in increased soil protection, which weakened the high erosion risk from the rainfall erosivity and very steep slopes. It should be noted here that the no-grazing scenario was just implemented as the theoretically least disturbing scenario in order to obtain an upper limit of the soil loss reduction potential. No grazing in practice means zero livestock stocking rates or exclusive animal breeding indoors. Both options seem not feasible to implement from a socio-economic point of view as they constitute severe changes of traditional agriculture, disturbing the local population’s way of living. Moreover, it has to be highlighted that complete grazing abandonment does not necessarily mean the least erosion potential in practice, especially for the Mediterranean region, where the long dry summer in combination with sufficient vegetation form favorable conditions for wildfires with subsequent severe consequences of soil erosion and loss [55,56,57]. Besides, this extreme scenario was by only 5% more effective in soil loss reduction than the more socially friendly combined scenario of grazing length and livestock stocking rates reduction. The present SWAT model simulated results showed that even with a hypothetic grazing abandonment, the natural controls that still kept soil loss in Samothraki at quite high levels are very important (170,000 t/y or 12 t/ha), as these levels are higher than they have been reported on average for continental Greece [41]. This may be attributed to the deforestation that took place in the past due to the heavy use of forests during the 18th century, massive charcoal production for export in the 19th century [17], and wild fires. The increase of small ruminant numbers from the 1960s and especially since the 1990s due to European Union (EU) subsidies created high grazing pressure, which exceeds the grazing capacity of the island [16], thus inhibiting the regeneration of former and existing forest areas. Particularly regarding the ancient oak forest, research results showed over-aged woodland with numerous already declining trees [17]. In addition, Löw [58], who combined remote sensing and ground truthing, detected areas with significant vegetation degradation and others with undesirable encroachment processes. In line with the above, our results highlighted the urgent need of an integrated plan for the Samothraki Island focusing on erosion and soil loss prevention actions. Today, that need for mainstreaming European water policy with agricultural policy has been clearly recognized [59], one cannot neglect the need to improve and modernize agricultural practices, and in particular grazing in the areas where it is a high priority. Grazing has to be managed sustainably by establishing spatially and temporally controlled grazing areas, but a really effective erosion mitigation plan would additionally require reforestation to the greatest possible extent along with protection against wildfires, as well as constructive practices (terraces). The latter could prevent soil loss if built in the hilly vulnerable areas by increasing the retention of soil resources in the upland catchments. At the areas where farming is practiced, the newly introduced Sown Biodiverse Permanent Pastures may act toward both controlled grazing and soil erosion abatement [60]. The recent fencing of a part of the existing oak forest by the Forestry Department of Alexandroupolis (big city opposite the island) provides encouraging signs for the state’s willingness to support the sustainability of Samothraki Island.

5. Conclusions

In the present article, a Soil and Water Assessment Tool (SWAT) model for Samothraki Island was built and represented the actual erosion regime. Four alternative grazing management scenarios were implemented including livestock reduction, grazing length reduction, their combination, and no grazing, in order to explore the potential to mitigate erosion and soil loss across the island. The produced results showed that the greatest erosion and soil loss rates and more than half of the total soil losses in the island come from its central steep mountainous part, which is the most vulnerable area. Among the scenarios tested, the one that combined livestock reduction and the length of the grazing period reduction seems favorable from an environmental and socio-economic point of view. However, to mitigate erosion sustainably in Samothraki Island, the paper supports that grazing management practices alone are not enough, and should be considered within an integrated plan of regeneration of natural vegetation.

Author Contributions

Conceptualization, Y.P. and E.D.; methodology, Y.P.; software, Y.P.; validation, Y.P. and E.D.; formal analysis, Y.P. E.D. and N.S.; investigation, Y.P.; resources, Y.P., E.D. and N.S.; data curation, Y.P. and E.D.; writing—original draft preparation, Y.P.; writing—review and editing, Y.P., E.D. and N.S.; visualization, Y.P.; supervision, E.D. and N.S.; project administration, E.D. and N.S.

Funding

This research received no external funding.

Acknowledgments

The authors should thank the HCMR scientific staff, Angeliki Mentzafou for providing the discharge data measured by the Public Power Corporation, Anastasios Papadopoulos for providing the meteorological data and Stamatios Zogaris for his advices, support and many discussions. We also specially thank Marina Fischer-Kowalski and Dominik Noll, University of Natural Resources and Life Sciences, Vienna, for fruitful discussions regarding overgrazing and its effects.

Conflicts of Interest

The authors declare no conflict of interest.

References

  1. Panagos, P.; Borrelli, P.; Poesen, J.; Ballabio, C.; Lugato, E.; Meusburger, K.; Montanarella, L.; Alewell, C. The new assessment of soil loss by water erosion in Europe. Environ. Sci. Policy 2015, 54, 438–447. [Google Scholar] [CrossRef]
  2. Robinson, D.A.; Panagos, P.; Borrelli, P.; Jones, A.; Montanarella, L.; Tye, A.; Obst, C.G. Soil natural capital in Europe; a framework for state and change assessment. Sci. Rep. 2017, 7, 6706. [Google Scholar] [CrossRef] [PubMed]
  3. Keesstra, S.; Mol, G.; de Leeuw, J.; Okx, J.; de Cleen, M.; Visser, S. Soil-related sustainable development goals: Four concepts to make land degradation neutrality and restoration work. Land 2018, 7, 133. [Google Scholar] [CrossRef]
  4. Borrelli, P.; Robinson, D.; Fleischer, L.R.; Lugato, E.; Panagos, P. An assessment of the global impact of 21st century landuse change on soil erosion. Nat. Commun. 2017, 8, 2013. [Google Scholar] [CrossRef] [PubMed]
  5. Panagos, P.; Borrelli, P.; Meusburger, K. A New European Slope Length and Steepness Factor (LS-Factor) for Modeling Soil Erosion by Water. Geosci. J. 2015, 5, 117–126. [Google Scholar] [CrossRef] [Green Version]
  6. Panagos, P.; Ballabi, C.; Borrelli, P.; Meusburger, K.; Klik, A.; Rousseva, S.; Tadić, M.P.; Michaelides, S.; Hrabalíková, M.; Preben, O.; et al. Rainfall erosivity in Europe. Sci. Total Environ. 2015, 511, 801–814. [Google Scholar] [CrossRef] [PubMed] [Green Version]
  7. Pimentel, D.; Burgess, M. Soil erosion threatens food production. Agriculture 2013, 3, 443–463. [Google Scholar] [CrossRef]
  8. Rodrigo-Comino, J.; Keesstra, S.; Cerdà, A. Soil Erosion as an Environmental Concern in Vineyards: The Case Study of Celler del Roure, Eastern Spain, by Means of Rainfall Simulation Experiments. Beverages 2018, 4, 31. [Google Scholar] [CrossRef]
  9. Cerdà, A.; Rodrigo-Comino, J.; Giménez-Morera, A.; Keesstra, S.D. Hydrological and erosional impact and farmer’s perception on catch crops and weeds in citrus organic farming in Canyoles river watershed, Eastern Spain. Agric. Ecosyst. Environ. 2018, 258, 49–58. [Google Scholar] [CrossRef]
  10. Di Prima, S.; Rodrigo-Comino, J.; Novara, A.; Iovino, M.; Pirastru, M.; Keesstra, S.; Cerdà, A. Soil physical quality of citrus orchards under tillage, herbicide, and organic managements. Pedosphere 2018, 28, 463–477. [Google Scholar] [CrossRef]
  11. Boardman, J.; Poesen, J. Soil Erosion in Europe: Major Processes, Causes and Consequences. In Soil Erosion in Europe; Boardman, J., Poesen, J., Eds.; John Wiley & Sons, Ltd.: Chichester, UK, 2006. [Google Scholar]
  12. Directive, W.F. Directive 2000/60/EC of the European Parliament and of the Council of 23 October 2000 establishing a framework for Community action in the field of water policy. Off. J. Eur. Communities 2000, 22, 2000. [Google Scholar]
  13. Skoulikidis, Ν.; Lampou, A.; Karaouzas, Ι.; Gritzalis, K.; Lazaridou, M.; Zogaris, S. Stream ecological assessment on an Aegean island: Insights from an exploratory application on Samothraki (Greece). Fresen. Environ. Bull. 2014, 23, 1173–1182. [Google Scholar]
  14. Myronidis, D.; Ioannou, K.; Sapountzis, M.; Fotakis, D. Development of a sustainable plan to combat erosion for an island of the Mediterranean region. Fresen. Environ. Bull. 2010, 19, 1694–1702. [Google Scholar]
  15. Fischer-Kowalski, M.; Xenidis, L.; Singh, S.J.; Pallua, I. Transforming the Greek Island of Samothraki into a UNESCO Biosphere Reserve. An Experience in Transdisciplinarity. GAIA Ecol. Perspect. Sci. Soc. 2011, 20, 181–190. [Google Scholar] [CrossRef] [Green Version]
  16. Fetzel, T.; Petridis, P.; Noll, D.; Singh, S.J.; Fischer-Kowalski, M. Reaching a socio-ecological tipping point: Overgrazing on the Greek island of Samothraki and the role of European agricultural policies. Land Use Policy 2018, 76, 21–28. [Google Scholar] [CrossRef]
  17. Heiling, C. On the State of Oak Forests in Samothraki: Tree Regeneration, Restoration Priorities and Forest Structure as a Mirror of Past Land Use on a Greek Island. Master’s Thesis, University of Natural Resources and Life Sciences, Vienna, Austria, 2018; p. 134. [Google Scholar]
  18. Plekhov, D.; Levine, E.I. Assessing the effects of severe weather events through remote sensing on Samothrace, Greece: Applications for the management of cultural resources. J. Archaeol. Sci. Rep. 2018, 21, 810–820. [Google Scholar] [CrossRef]
  19. Biel, B.; Tan, K. The flora of Samothraki; The Goulandris Natural History Museum Kifissia: Kifissia, Greece, 2014; p. 228. [Google Scholar]
  20. Barbayiannis, N.; Panayotopoulos, K.; Psaltopoulos, D.; Skuras, D. The influence of policy on soil conservation: A case study from Greece. Land Degrad. Dev. 2011, 22, 47–57. [Google Scholar] [CrossRef]
  21. Vassiliki, V.; Zogaris, S.; Djuma, H.; Kokkoris, I.P.; Kehayias, G.; Dimopoulos, P. A Field Method for Landscape Conservation Surveying: The Landscape Assessment Protocol (LAP). Sustainability 2019, 11, 2019. [Google Scholar] [CrossRef]
  22. Fu, B.; Merritt, W.S.; Croke, B.F.W.; Weber, T.R.; Jakeman, A.J. A review of catchment-scale water quality and erosion models and a synthesis of future prospects. Environ. Modell. Softw. 2019, 114, 75–97. [Google Scholar] [CrossRef]
  23. Yang, Y.S.; Wang, L. A Review of Modelling Tools for Implementation of the EU Water Framework Directive in Handling Diffuse Water Pollution. Water Resour. Manag. 2009, 24, 1819–1843. [Google Scholar] [CrossRef] [Green Version]
  24. Arnold, J.G.; Srinivasan, R.; Muttiah, R.S.; Williams, J.R. Large area hydrologic modelling and assessment part I: Model development. J. Am. Water Resour. Assoc. 1998, 34, 73–89. [Google Scholar] [CrossRef]
  25. Williams, J.R.; Arnold, J.G.; Kiniry, J.R.; Gassman, P.W.; Green, C.H. History of model development at Temple, Texas. Hydrol. Sci. J. 2008, 53, 948–960. [Google Scholar] [CrossRef] [Green Version]
  26. Gassman, P.W.; Reyes, M.R.; Green, C.H.; Arnold, J.G. The Soil and Water Assessment Tool: Historical Development, Applications, and Future Research Directions. Trans. ASABE 2007, 50, 1211–1250. [Google Scholar] [CrossRef] [Green Version]
  27. Gassman, P.W.; Sadeghi, A.M.; Srinivasan, R. Applications of the SWAT Model Special Section: Overview and Insights. J. Environ. Qual. 2014, 43, 1–8. [Google Scholar] [CrossRef]
  28. Tuppad, P.; Douglas-Mankin, K.R.; Lee, T.; Srinivasan, R.; Arnold, J.G. Soil and Water Assessment Tool (SWAT) hydrologic/water quality model: Extended capability and wider adoption. Trans. ASABE 2011, 54, 1677–1684. [Google Scholar] [CrossRef]
  29. Hussain, F.; Ghulam, N.; Wu, R.S.; Hussain, B.; Abbas, T. Parameter evaluation for soil erosion estimation on small watersheds using SWAT model. Int. J. Agric. Biol. Eng. 2019, 12, 96–108. [Google Scholar] [CrossRef] [Green Version]
  30. Park, J.Y.; Ale, S.; Teague, W.R. Simulated water quality effects of alternate grazing management practices at the ranch and watershed scales. Ecol. Model. 2017, 360, 1–13. [Google Scholar] [CrossRef]
  31. Vigiak, O.; Malagó, A.; Bouraoui, F.; Vanmaercke, M.; Obreja, F.; Poesen, J.; Habersack, H.; Fehér, J.; Grošelj, S. Modelling sediment fluxes in the Danube River Basin with SWAT. Sci. Total Environ. 2017, 599, 992–1012. [Google Scholar] [CrossRef]
  32. Karavitis, C.; Kerkides, P. Estimation of the Water Resources Potential in the Island System of the Aegean Archipelago, Greece. Water Int. 2002, 27, 243–254. [Google Scholar] [CrossRef]
  33. SWAT. ArcSWAT: ArcGIS-ArcView Extension and Interface for SWAT; U.S. Department of Agriculture, Agricultural Research Service, Grassland, Soil & Water Research Laboratory: Temple, TX, USA, 2018; Available online: http://swat.tamu.edu/software/arcswat/ (accessed on 7 May 2019).
  34. Krysanova, V.; Hattermann, F.; Wechsung, F. Development of the ecohydrological model SWIM for regional impact studies and vulnerability assessment. Hydrol. Process. 2005, 19, 763–783. [Google Scholar] [CrossRef]
  35. Krysanova, V.; Arnold, J.G. Advances in ecohydrological modelling with SWAT—A review. Hydrol. Sci. J. 2008, 53, 939–947. [Google Scholar] [CrossRef]
  36. Arabi, M.; Frankenberger, J.R.; Engel, B.A.; Arnold, J.G. Representation of agricultural conservation practices with SWAT. Hydrol. Process. 2008, 22, 3042–3055. [Google Scholar] [CrossRef]
  37. Neitsch, S.L.; Arnold, J.G.; Kiniry, J.R.; Williams, J.R. Soil and Water Assessment Tool–Theoretical Documentation Version 2009; Texas Water Resources Institute Technical report 406; Texas A&M University System College Station: Texas, TX, USA, 2011; Available online: http://swat.tamu.edu/ media/99192/swat2009-theory.pdf (accessed on 7 September 2018).
  38. USDA; Soil Conservation Service. Section 4: Hydrology in National Engineering Handbook; SCS: Grand Rapids, MI, USA, 1972.
  39. EEA-ETC/TE. CORINE Land Cover Update. I&CLC 2000 Project, Technical Guidelines. 2002. Available online: http://www.eea.europa.eu/publications/COR0-landcover (accessed on 7 September 2018).
  40. Arnold, J.G.; Kiniry, J.R.; Srinivasan, R.; Williams, J.R.; Haney, E.B.; Neitsch, S.L. Soil and Water Assessment Tool-Input/Output File Documentation-Version 2012; Texas Water Resources Institute Technical Report 439; Texas A&M University System College Station: Texas, TX, USA, 2012; Available online: https://swat.tamu.edu/media/69296/swat-io-documentation-2012.pdf (accessed on 7 May 2019).
  41. Zarris, D.; Lykoudi, E.; Panagoulia, D. Assessing the Impacts of Sediment Yield on the Sustainability of Major Hydraulic Systems. In Proceedings of the International Conference “Protection and Restoration of the Environment VIII”, Chania, Greece, 3–7 July 2006. [Google Scholar] [CrossRef]
  42. Panagopoulos, Y.; Makropoulos, C.; Baltas, E.; Mimikou, M. SWAT parameterization for the identification of critical diffuse pollution source areas under data limitations. Ecol. Model. 2011, 222, 3500–3512. [Google Scholar] [CrossRef]
  43. Donnelly, C.; Dahné, J.; Lindström, G.; Rosberg, J.; Strömqvist, J.; Pers, C.; Yang, W.; Arheimer, B. An evaluation of multi-basin hydrological modelling for predictions in ungauged basins. In Proceedings of the Symposium HS.2 at the Joint IAHS & IAH Convention, Hyderabad, India, 6–12 September 2009; Volume 333, pp. 112–120. [Google Scholar]
  44. Kuchment, L.; Gelfan, A. Assessing parameters of physically-based models for poorly gauged basins. New Approaches to Hydrological Prediction in Data-sparse Regions. In Proceedings of the Symposium HS.2 at the Joint IAHS & IAH Convention, Hyderabad, India, 2009; Volume 333, pp. 3–10. [Google Scholar]
  45. Wang, R.; Kalin, L. Modelling effects of land use/cover changes under limited data. Ecohydrology 2011, 4, 265–276. [Google Scholar] [CrossRef]
  46. Du, B.; Ji, X.; Harmel, D.R.; Hauck, L. Evaluation of a Watershed Model for Estimating Daily Flow Using Limited Flow Measurements1. J. Am. Water Resour. Assoc. 2009, 45, 475–484. [Google Scholar] [CrossRef]
  47. Sisay, E.; Khare, D.; Haleform, A.; Singh, L. Hydrological modelling of ungauged urban watershed using SWAT model. Model. Earth Syst. Environ. 2017, 3, 693–702. [Google Scholar] [CrossRef]
  48. Stehr, A.; Debels, P.; Romero, F.; Alcayaga, H. Hydrological Modelling with SWAT under Conditions of Limited Data Availability: Evaluation of Results from A Chilean Case Study. Hydrol. Sci. J. 2008, 53, 588–601. [Google Scholar] [CrossRef]
  49. Lenhart, T.; Eckhardt, K.; Fohrer, N.; Frede, H.-G. Comparison of two different approaches of sensitivity analysis. Phys. Chem. Earth 2002, 27, 645–654. [Google Scholar] [CrossRef]
  50. Panagopoulos, Y.; Makropoulos, C.; Mimikou, M. Diffuse surface water pollution: Driving factors for different geoclimatic regions. Water Resour. Manag. 2011, 25, 3635–3660. [Google Scholar] [CrossRef]
  51. Van Griensven, A.; Meixner, T.; Grunwald, S.; Bishop, T.; Diluzio, M.; Srinivasan, R. A global sensitivity analysis tool for the parameters of multi-variable catchment models. J. Hydrol. 2006, 324, 10–23. [Google Scholar] [CrossRef]
  52. Panagopoulos, Y.; Georgiou, E.; Grammatikogiannis, A.; Polizoi, E.; Mimikou, M. Impacts of Human Interaction on the Sediment Transport Processes in the Arachtos River Basin, Western Greece. Eur. Water 2008, 21, 3–16. [Google Scholar]
  53. Moriasi, D.N.; Arnold, J.G.; Liew, M.W.; Bingner, R.L.; Harmel, R.D.; Veith, T.L. Model Evaluation Guidelines for Systematic Quantification of Accuracy in Watershed Simulations. Trans. ASABE 2007, 50, 885–900. [Google Scholar] [CrossRef]
  54. Kinnel, P.I.A. Why the universal soil loss equation and the revised version of it do not predict event erosion well. Hydrol. Process. 2005, 19, 851–854. [Google Scholar] [CrossRef]
  55. Cerdà, A.; Borja, M.E.L.; Úbeda, X.; Martínez-Murillo, J.F.; Keesstra, S.; Pinus halepensis, M. versus Quercus ilex subsp. Rotundifolia L. runoff and soil erosion at pedon scale under natural rainfall in Eastern Spain three decades after a forest fire. For. Ecol. Manag. 2017, 400, 447–456. [Google Scholar] [CrossRef]
  56. Nunes, J.P.; Naranjo Quintanilla, P.; Santos, J.M.; Serpa, D.; Carvalho-Santos, C.; Rocha, J.; Keizer, J.J.; Keesstra, S.D. Afforestation, subsequent forest fires and provision of hydrological services: A model-based analysis for a Mediterranean mountainous catchment. Land Degrad. Dev. 2018, 29, 776–788. [Google Scholar] [CrossRef]
  57. Van Eck, C.M.; Nunes, J.P.; Vieira, D.C.; Keesstra, S.; Keizer, J.J. Physically-Based Modelling of the Post-Fire Runoff Response of a Forest Catchment in Central Portugal: Using Field versus Remote Sensing Based Estimates of Vegetation Recovery. Land Degrad. Dev. 2016, 27, 1535–1544. [Google Scholar] [CrossRef]
  58. Löw, M. Spatial Patterns of Land Cover Dynamics on Samothraki Island: Applying Remote Sensing on complex Mediterranean Pastures. Master’s Thesis, AAU Klagenfurt, Graz, Vienna, Austria, 2017; p. 111. [Google Scholar]
  59. Carvalho, L.; Mackay, E.B.; Cardoso, A.C.; Baattrup-Pedersen, A.; Birk, S.; Blackstock, K.L.; Borics, G.; Borja, A.; Feld, C.K.; Ferreira, M.T.; et al. Protecting and restoring Europe’s waters: An analysis of the future development needs of the Water Framework Directive. Sci. Total Environ. 2019, 658, 1228–1238. [Google Scholar] [CrossRef]
  60. Teixeira, R.F.M.; Proença, V.; Crespo, D.; Valada, T.; Domingos, T. A conceptual framework for the analysis of engineered biodiverse pastures. Ecol. Eng. 2015, 77, 85–97. [Google Scholar] [CrossRef]
Figure 1. Samothraki Island’s elevations and streams, and location within Greece.
Water 11 01491 g001
Figure 2. Samothraki island as delineated in Soil Water Assessment Tool (SWAT): (a) subbasins (basins of Xiropotmaos, Fonias, and Vatos are indicated) and discharge stations, (b) soils: silty clay loam (CLSI) and clay (C), (c) land-cover information, (d) slope classes showing the dominating steep slopes (> 30%) in the island, (e) mean annual precipitation. Note: SWAT land-use classes correspond to mixed forest (FRST), pasture (PAST), rangeland (RNGB), agricultural land (AGRL), olive groves (OLIVE), low-density urban land (URML), and water areas (WATR).
Water 11 01491 g002
Figure 3. Stream flow evaluation in Samothraki: (a) monthly simulated vs. observed hydrograph at Xiropotamos stream (see Figure 2a) and correlation of flows on a two-axes scattergram, (b) monthly simulated vs. observed hydrograph at Fonias stream (see Figure 2a) and correlation of flows on a two-axes scattergram.
Water 11 01491 g003
Figure 4. Box plots of annual soil loss in Samothraki Island under various grazing management scenarios from the 21-year period between 1986–2006 simulated.
Water 11 01491 g004
Figure 5. Temporal variation of soil loss in Samothraki.
Water 11 01491 g005
Figure 6. (a) Vulnerability of Samothraki’s subbasins to soil loss and percentage mean annual reduction of soil loss from the implementation of the four alternative management scenarios of Table 2: (b) grazing length reduction, (c) 50% animal reduction, (d) the combination of the previous two, (e) no grazing. The basins of Fonias, Xiropotamos, and Vatos are indicated (see also Figure 1 and Figure 2a).
Water 11 01491 g006
Figure 7. Box plots of mean annual (1986–2006) soil loss (t/ha) from Samothraki’s subbasins at the baseline scenario and four alternative grazing management scenarios.
Water 11 01491 g007
Figure 8. The most vulnerable to erosion and favorable for soil loss reduction area in Samothraki.
Water 11 01491 g008
Table 1. Calibration values of six crucial SWAT parameters in determining water and sediments from different hydrologic response units (HRUs) in Samothraki.
Parameter/Land-Cover TypeForestAgricultural LandRangelandPasture
CUSLE0.010.20.030.03
PUSLE1.001.001.001.00
Curve Number Value (CN2)55, 6570, 7555, 6562, 70
Parameter/Soil Type Silty-ClayClay
Available Water Capacity (AWC)
(mmH2O/mmSoil)
0.080.12
Saturated Hydraulic Conductivity (SHC) (mm/hr) 10020
KUSLE 0.120.10
Hydrologic Group BD
Table 2. List of grazing management scenarios implemented in Samothraki.
Scenario NoScenario TypeDescription and ImpactSWAT Representation
1baselineConventional grazing practices
Max reduction of natural vegetation (aboveground biomass) and soil protection
45,000 ruminants grazing from March to October
2grazing period
reduction
Increased natural vegetation (more aboveground biomass) and soil protection in March and April45,000 ruminants grazing from May to October
350% goats
reduction
Less reduction of natural vegetation (more aboveground biomass) and soil protection throughout the year22,500 ruminants grazing from March to October
4(2&3)Less reduction of natural vegetation (more aboveground biomass) and soil protection throughout the year22,500 ruminants grazing from May to October
5100% goats
reduction
No reduction of natural vegetation (full aboveground biomass) and soil protectionNo livestock
No grazing
Table 3. Simulated water balance components (mm) and soil loss (t/ha) on a mean annual basis.
Model Outputs1986–20061986–20061986–20061986–2006
Samothraki Island (142 km2)Fonias Basin (9.3 km2)Xiropotamos Basin (15.1 km2)Vatos Basin (15.5 km2)
Precipitation (mm)7721096959905
Snow (mm)381128473
Total runoff (mm)466785651596
Evapotranspiration (mm)305310307308
Soil loss (t/ha)15.8218.6340.0817.68

