Stable Isotope Analysis and Persistent Organic Pollutants in Crustacean Zooplankton: The Role of Size and Seasonality

 ,
, 
 ,
, 
Abstract
1. Introduction
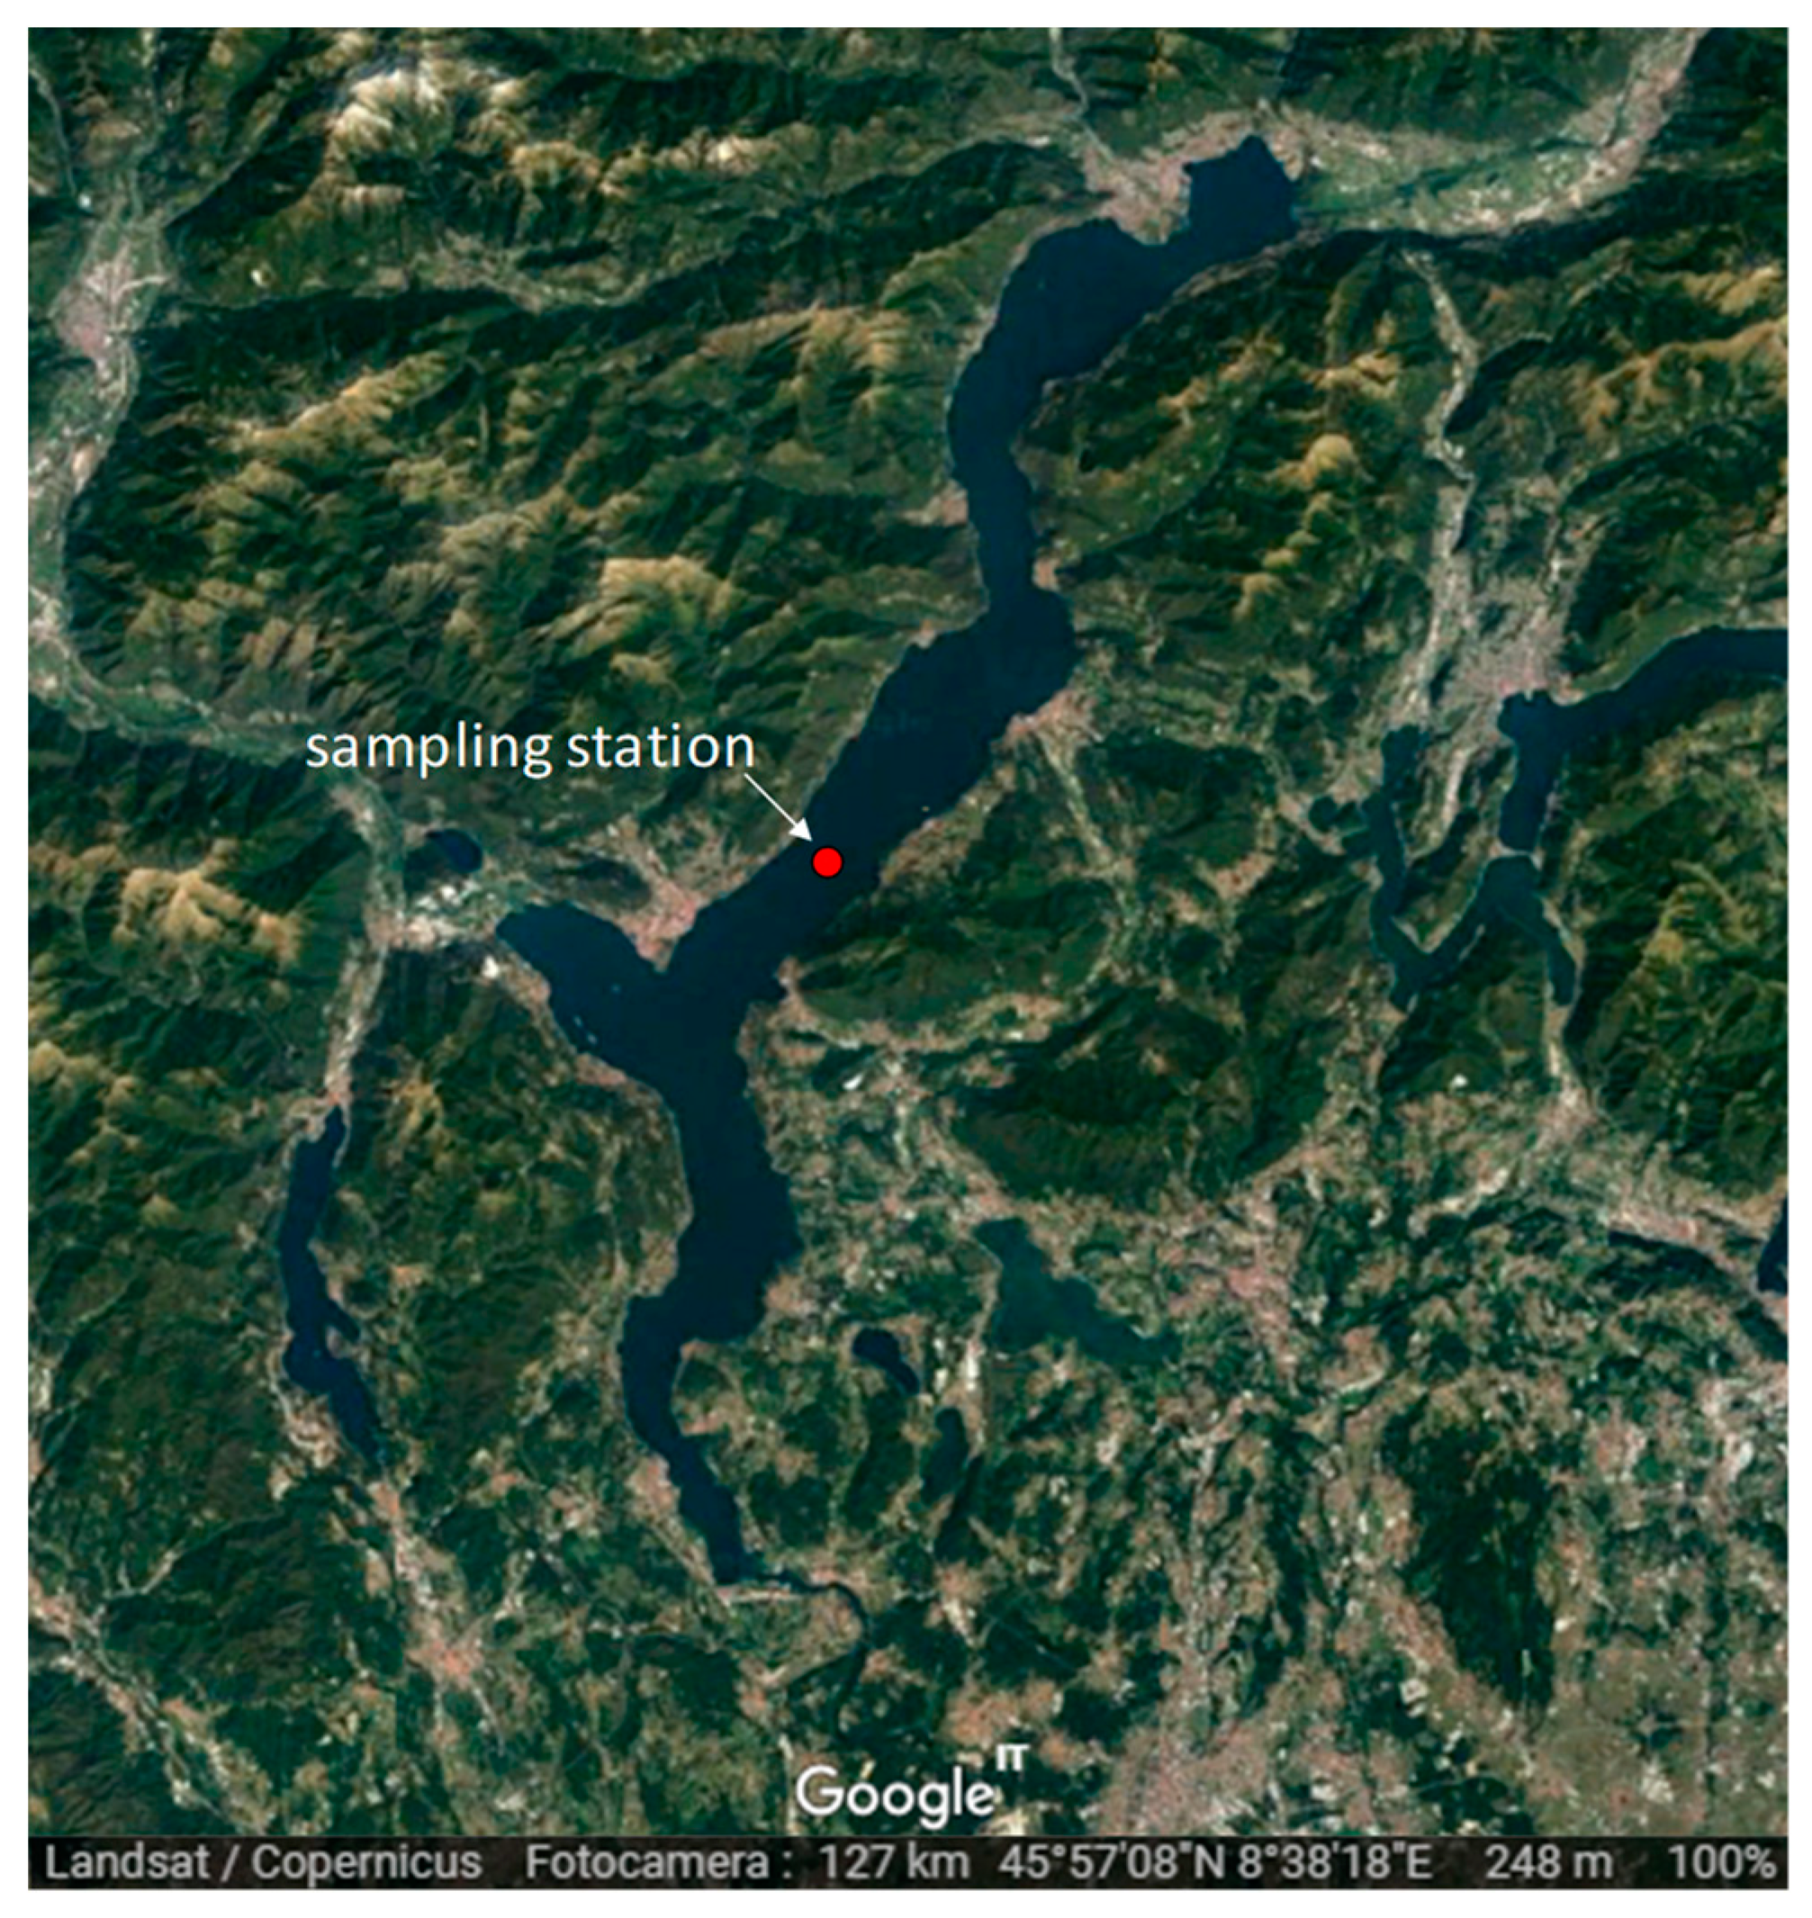
2. Study Site
3. Materials and Methods
4. Results
5. Discussion
6. Conclusions
Author Contributions
Funding
Conflicts of Interest
Appendix A

References
- Mazzoni, M.; Boggio, E.; Manca, M.; Piscia, R.; Quadroni, S.; Bellasi, A.; Bettinetti, R. Trophic transfer of persistent organic pollutants through a pelagic food web: The case of Lake Como (Northern Italy). Sci. Total Environ. 2018, 640, 98–106. [Google Scholar] [CrossRef] [PubMed]
- Bettinetti, R.; Manca, M. Understanding the role of zooplankton in transfer of pollutants through trophic food webs. In Zooplankton: Species Diversity, Distribution and Seasonal Dynamics; Kehayias, G., Ed.; Nova Science Publishers, Inc.: Hauppauge, NY, USA, 2013; pp. 1–18. [Google Scholar]
- Bettinetti, R.; Galassi, S.; Guzzella, L.; Quadroni, S.; Volta, P. The role of zooplankton in DDT biomagnification in a pelagic food web of Lake Maggiore (Northern Italy). Environ. Sci. Pollut. Res. 2010, 17, 1508–1518. [Google Scholar] [CrossRef] [PubMed]
- Loseto, L.L.; Stern, G.A.; Ferguson, S.H. Size and biomagnification: How habitat selection explains beluga mercury levels. Environ. Sci. Technol. 2008, 42, 3982–3988. [Google Scholar] [CrossRef] [PubMed]
- Forest, A.; Sampei, M.; Makabe, R.; Sasaki, H.; Barber, D.G.; Gratton, Y.; Wassmann, P.; Fortier, L. The annual cycle of particulate organic carbon export in Franklin Bay (Canadian Artica): Environmental control and food web implications. J. Geophys. Res. 2008, 113, C03S05. [Google Scholar] [CrossRef]
- Peduzzi, P.; Herndl, G.J. Zooplankton activity fueling the microbial loop: Differential growth response of bacteria from oligotrophic and eutrophic waters. Limnol. Oceanogr. 1992, 37, 1087–1092. [Google Scholar] [CrossRef]
- Zingel, P.; Agasild, H.; Karus, K.; Kangro, K.; Tammert, H.; Tõnno, I.; Tõnu, F.; Nõges, T. The influence of zooplankton enrichment on the microbial loop in a shallow, eutrophic lake. Eur. J. Protistol. 2016, 52, 22–35. [Google Scholar] [CrossRef] [PubMed]
- Confer, J.L.; Howick, G.L.; Corzette, M.H.; Kramer, S.L.; Fitzgibbon, S.; Landesberg, R. Visual predation by planktivores. Oikos 1978, 31, 27–37. [Google Scholar] [CrossRef]
- Bandara, K.; Varpe, Ø.; Ji, R.; Eiane, K. Artificial evolution of behavioral and life history strategies of high-latitude copepods in response to bottom-up and top-down selection pressures. Progr. Oceanogr. 2019, 173, 134–164. [Google Scholar] [CrossRef]
- de Bernardi, R.; Giussani, G.; Manca, M. Cladocera: Predators and prey. Hydrobiologia 1987, 145, 225–243. [Google Scholar] [CrossRef]
- Eljarrat, E.; Barcelo, D. Priority lists for persistent organic pollutants and emerging contaminants based on their relative toxic potency in environmental samples. TrAC Trends Anal. Chem. 2003, 22, 655–665. [Google Scholar] [CrossRef]
- Ruiz-Fernández, A.C.; Ontiveros-Cuadras, J.F.; Sericano, J.L.; Sanchez-Cabeza, J.A.; Kwong, L.L.W.; Dunbar, R.B.; Mucciarone, D.A.; Pérez-Bernal, L.H.; Páez-Osuna, F. Long-range atmospheric transport of persistent organic pollutants to remote lacustrine environments. Sci. Total Environ. 2014, 493, 505–520. [Google Scholar] [CrossRef]
- Pisanello, F.; Marziali, L.; Rosignoli, F.; Poma, G.; Roscioli, C.; Pozzoni, F.; Guzzella, L. In situ bioavailability of DDT and Hg in sediments of the Toce River (Lake Maggiore basin, Northern Italy): Accumulation in benthic invertebrates and passive samplers. Environ. Sci. Pollut. Res. 2016, 23, 10542–10555. [Google Scholar] [CrossRef]
- Tremolada, P.; Villa, S.; Bazzarin, P.; Bizzotto, E.; Comolli, R.; Vighi, M. POPs in mountain soils from the Alps and Andes: Suggestions for a ‘precipitation effect’on altitudinal gradients. Water Air Soil Pollut. 2008, 188, 93–109. [Google Scholar] [CrossRef]
- Hung, H.; Kallenborn, R.; Breivik, K.; Su, Y.; Brorström-Lundén, E.; Olafsdottir, K.; Thorlacius, J.M.; Leppänen, S.; Bossi, R.; Skov, H.; et al. Atmospheric monitoring of organic pollutants in the Arctic under the Arctic Monitoring and Assessment Programme (AMAP): 1993–2006. Sci. Total Environ. 2010, 408, 2854–2873. [Google Scholar] [CrossRef]
- van Drooge, B.; Garriga, G.; Koinig, K.; Psenner, R.; Pechan, P.; Grimalt, J. Sensitivity of a remote alpine system to the Stockholm and LRTAP regulations in POP emissions. Atmosphere 2014, 5, 198–210. [Google Scholar] [CrossRef]
- Guzzella, L.; Salerno, F.; Freppaz, M.; Roscioli, C.; Pisanello, F.; Poma, G. POP and PAH contamination in the southern slopes of Mt. Everest (Himalaya, Nepal): Long-range atmospheric transport, glacier shrinkage, or local impact of tourism? Sci. Total Environ. 2016, 544, 382–390. [Google Scholar] [CrossRef]
- Zhang, C.; Zhong, R.; Wang, Z.; Montaña, C.G.; Song, Y.; Pan, K.; Wang, S.; Wu, Y. Intra-annual variation of zooplankton community structure and dynamics in response to the changing strength of bio-manipulation with two planktivorous fishes. Ecol. Indic. 2019, 101, 670–678. [Google Scholar] [CrossRef]
- Perga, M.E.; Gerdeaux, D. Seasonal variability in the δ13C and δ15N values of the zooplankton taxa in two alpine lakes. Acta Oecol. 2006, 30, 69–77. [Google Scholar] [CrossRef]
- Hobson, K.A.; Fisk, A.; Karnovsky, N.; Holst, M.; Gagnon, J.M.; Fortier, M. A stable isotope (δ13C, δ15N) model for the North Water food web: Implications for evaluating trophodynamics and the flow of energy and contaminants. Deep Sea Res. Part II Top. Stud. Oceanogr. 2002, 49, 5131–5150. [Google Scholar] [CrossRef]
- Bettinetti, R.; Quadroni, S.; Manca, M.; Piscia, R.; Volta, P.; Guzzella, L.; Roscioli, C.; Galassi, S. Seasonal fluctuations of DDTs and PCBs in zooplankton and fish of Lake Maggiore (Northern Italy). Chemosphere 2012, 88, 344–351. [Google Scholar] [CrossRef]
- Romero-Romero, S.; Herrero, L.; Fernández, M.; Gómara, B.; Acuña, J.L. Biomagnification of persistent organic pollutants in a deep-sea, temperate food web. Sci. Total Environ. 2017, 605, 589–597. [Google Scholar] [CrossRef]
- Peterson, B.J.; Fry, B. Stable isotopes in ecosystem studies. Annu. Rev. Ecol. Syst. 1987, 18, 293–320. [Google Scholar] [CrossRef]
- Post, D.M. Using stable isotopes to estimate trophic position: Models, methods, and assumptions. Ecology 2002, 83, 703–718. [Google Scholar] [CrossRef]
- Minagawa, M.; Wada, E. Stepwise enrichment of 15N along food chains: Further evidence and the relation between 15N and animal age. Geochim. Cosmochim. Acta 1984, 48, 1135–1140. [Google Scholar] [CrossRef]
- Inger, R.; Bearhop, S. Applications of stable isotope analyses to avian ecology. IBIS 2008, 150, 447–461. [Google Scholar] [CrossRef]
- Piscia, R.; Boggio, E.; Bettinetti, R.; Mazzoni, M.; Manca, M. Carbon and Nitrogen Isotopic Signatures of Zooplankton Taxa in Five Small Subalpine Lakes along a Trophic Gradient. Water 2018, 10, 94. [Google Scholar] [CrossRef]
- Guzzella, L.M.; Novati, S.; Casatta, N.; Roscioli, C.; Valsecchi, L.; Binelli, A.; Parolini, M.; Solcà, N.; Bettinetti, R.; Manca, M.; et al. Spatial and temporal trends of target organic and inorganic micropollutants in Lake Maggiore and Lake Lugano (Italian-Swiss water bodies): Contamination in sediments and biota. Hydrobiologia 2018, 824, 271–290. [Google Scholar] [CrossRef]
- Nizzetto, L.; Gioia, R.; Li, J.; Borgå, K.; Pomati, F.; Bettinetti, R.; Dachs, J.; Jones, K.C. Biological pump control of the fate and distribution of hydrophobic organic pollutants in water and plankton. Environ. Sci. Technol. 2012, 46, 3204–3211. [Google Scholar] [CrossRef]
- Riva, C.; Binelli, A.; Parolini, M.; Provini, A. The case of pollution of Lake Maggiore: A 12-year study with the bioindicator mussel Dreissena polymorpha. Water Air Soil Pollut. 2010, 210, 75–86. [Google Scholar] [CrossRef]
- Guilizzoni, P. Indagini su DDT e sostanze pericolose nell’ecosistema del Lago Maggiore. In Rapporto Annuale 2012, Rapporto Finale 2008–2012; Commissione Internazionale per la protezione delle acque italo-svizzere, Ed.; C.N.R.-I.S.E. Sede di Verbania: Verbania, Italy, 2013; p. 151. [Google Scholar]
- Volta, P.; Tremolada, P.; Neri, M.C.; Giussani, G.; Galassi, S. Age-dependent bioaccumulation of organochlorine compounds in fish and their selective biotransformation in top predators from Lake Maggiore (Italy). Water Air Soil Pollut. 2009, 197, 193–209. [Google Scholar] [CrossRef]
- de Bernardi, R.; Giussani, G.; Manca, M.; Ruggiu, D. Long-term dynamics of plankton communities in Lago Maggiore (N. Italy). Verh. Int. Ver. Theor. Angew. Limnol. 1988, 23, 729–733. [Google Scholar] [CrossRef]
- Ruggiu, D.; Morabito, G.; Panzani, P.; Pugnetti, A. Trends and relations among basic phytoplankton characteristics in the course of the long-term oligotrophication of Lake Maggiore (Italy). In Phytoplankton and Trophic Gradients; Springer: Dordrecht, The Netherlands, 1998; pp. 243–257. [Google Scholar]
- McCauley, E. The estimation of the abundance and biomass of zooplankton in samples. In A Manual on Methods for the Assessment of Secondary Productivity in Fresh Waters; Downing, J.A., Rigler, F.H., Eds.; Blackwell Scientific Pubblication: Oxford, UK, 1984; Volume 17, pp. 228–265. [Google Scholar]
- Manca, M.; Comoli, P. Biomass estimates of freshwater zooplankton from length-carbon regression equations. J. Limnol. 2000, 59, 15–18. [Google Scholar] [CrossRef]
- Zaret, T.M. Predation and Freshwater Communities; Yale Univ. Press: New Haven, CT, USA, 1980; p. 187. [Google Scholar]
- Visconti, A.; Manca, M. Seasonal changes in the δ13C and δ15N signatures of the Lago Maggiore pelagic food web. J. Limnol. 2011, 70, 263–271. [Google Scholar] [CrossRef]
- Visconti, A.; Volta, P.; Fadda, A.; Di Guardo, A.; Manca, M. Seasonality, littoral versus pelagic carbon sources, and stepwise 15N-enrichment of pelagic food web in a deep subalpine lake: The role of planktivorous fish. Can. J. Fish. Aquat. Sci. 2013, 71, 436–446. [Google Scholar] [CrossRef]
- Fadda, A.; Manca, M.; Camin, F.; Ziller, L.; Buscarino, P.; Mariani, M.; Padedda, B.M.; Sechi, N.; Virdis, T.; Lugliè, A. Study on the suspended particulate matter of aMediterranean artificial lake (Sos Canales Lake) using Stable Isotope Analysis of carbon and nitrogen. Ann. Limnol. Int. J. Limnol. 2016, 52, 401–412. [Google Scholar] [CrossRef]
- Giussani, G.; de Bernardi, R. Food selectivity in Coregonus sp. of Lago Maggiore: An energetical approach. Mem. Ist. Ital. Idrobiol. 1977, 34, 121–130. [Google Scholar]
- Coulas, R.A.; Macisaac, H.J.; Dunlop, W. Selective predation on an introduced zooplankter (Bythotrephes cederstroemi) by lake herring (Coregonus artedii) in Harp Lake, Ontario. Freshwater Biol. 1998, 40, 343–355. [Google Scholar] [CrossRef]
- Manca, M.; Vijverberg, J.; Polishchuk, L.V.; Voronov, D.A. Daphnia body size and population dynamics under predation by invertebrate and fish predators in Lago Maggiore: An approach based on contribution analysis. J. Limnol. 2008, 67, 15–21. [Google Scholar] [CrossRef]
- Bonecker, C.C.; Azevedo, F.D.; Simões, N.R. Zooplankton body-size structure and biomass in tropical floodplain lakes: Relationship with planktivorous fishes. Acta Limnol. Bras. 2011, 23, 217–228. [Google Scholar] [CrossRef]
- Mackas, D.L. Seasonal cycle of zooplankton off southwestern British Columbia: 1979–89. Can. J. Fish. Aquat. Sci. 1992, 49, 903–921. [Google Scholar] [CrossRef]
- Kenitz, K.M.; Visser, A.W.; Mariani, P.; Andersen, K.H. Seasonal succession in zooplankton feeding traits reveals trophic trait coupling. Limnol. Oceanogr. 2017, 62, 1184–1197. [Google Scholar] [CrossRef]
- Manca, M.; Rogora, M.; Salmaso, N. Inter-annual climate variability and zooplankton: Applying teleconnection indices to two deep subalpine lakes in Italy. J. Limnol. 2015, 74, 123–132. [Google Scholar] [CrossRef]
- Manca, M.; DeMott, W.R. Response of the invertebrate predator Bythotrephes to a climate-linked increase in the duration of a refuge from fish predation. Limnol. Oceanogr. 2009, 54, 506–512. [Google Scholar] [CrossRef]
- Manca, M. Invasions and re-emergences: An analysis of the success of Bythotrephes in Lago Maggiore (Italy). J. Limnol. 2011, 70, 76–82. [Google Scholar] [CrossRef]
- Fadda, A.; Rawcliffe, R.; Padedda, B.M.; Luglié, A.; Sechi, N.; Camin, F.; Ziller, L.; Manca, M. Spatio-temporal dynamics of C and N isotopic signature of zooplankton: A seasonal study on a man-made lake in the Mediterranean region. Ann. Limnol. Int. J. Limnol. 2014, 50, 279–287. [Google Scholar] [CrossRef]
- Zohary, T.; Erez, J.; Gophen, M.; Berman-Frank, I.; Stiller, M. Seasonality of stable carbon isotopes within the pelagic food web of Lake Kinneret. Limnol. Oceanogr. 1994, 39, 1030–1104. [Google Scholar] [CrossRef]
- Leggett, M.F.; Servos, M.R.; Hesslein, R.; Johannsson, O.; Millard, E.S.; Dixon, D.G. Biogeochemical influences on the carbon isotope signatures of Lake Ontario biota. Can. J. Fish. Aquat. Sci. 2009, 56, 2211–2218. [Google Scholar] [CrossRef]
- Leggett, M.F.; Johannsson, O.; Hesslein, R.; Dixon, D.G.; Taylor, W.D.; Servos, M.R. Influence of inorganic nitrogen cycling on the δ15N of Lake Ontario biota. Can. J. Fish. Aquat. Sci. 2000, 57, 1489–1496. [Google Scholar] [CrossRef]
- Caroni, R.; Free, G.; Visconti, A.; Manca, M. Phytoplankton functional traits and seston stable isotopes signature: A functional-based approach in a deep, subalpine lake, Lake Maggiore (N. Italy). J. Limnol. 2012, 71, 84–94. [Google Scholar] [CrossRef]
- Geller, W.; Müller, H. The filtration apparatus of Cladocera: Filter mesh-sizes and their implications on food selectivity. Oecologia 1981, 49, 316–321. [Google Scholar] [CrossRef]
- France, R.L.; Peters, R.H. Ecosystem differences in the trophic enrichment of 13C in aquatic food webs. Can. J. Fish. Aquat. Sci. 1997, 54, 1255–1258. [Google Scholar] [CrossRef]
- Tewfik, A.; Bell, S.S.; McCann, K.S.; Morrow, K. Predator diet and trophic position modified with altered habitat morphology. PLoS ONE 2016, 11, e0147759. [Google Scholar] [CrossRef]
- Adams, T.S.; Sterner, R.W. The effect of dietary nitrogen content on trophic level 15N enrichment. Limnol. Oceanogr. 2000, 45, 601–607. [Google Scholar] [CrossRef]
- Gulati, R.; Demott, W. The role of food quality for zooplankton: Remarks on the state-of-the-art, perspectives and priorities. Freshw. Biol. 1997, 38, 753–768. [Google Scholar] [CrossRef]
- Elser, J.J.; Kyle, M.; Learned, J.; McCrackin, M.L.; Peace, A.; Steger, L. Life on the stoichiometric knife-edge: Effects of high and low food C: P ratio on growth, feeding, and respiration in three Daphnia species. Inland Waters 2016, 6, 136–146. [Google Scholar] [CrossRef]
- Leoni, B. Zooplankton predators and prey: Body size and stable isotope to investigate the pelagic food web in a deep lake (Lake Iseo, Northern Italy). J. Limnol. 2017, 76, 85–93. [Google Scholar] [CrossRef]
- Borgå, K.; Fisk, A.T.; Hoekstra, P.F.; Muir, D.C.G. Biological and chemical factors of importance in the bioaccumulation and trophic transfer of persistent organochlorine contaminants in arctic marine food webs. Environ. Toxicol. Chem. 2004, 23, 2367–2385. [Google Scholar] [CrossRef]
- Walters, D.M.; Jardine, T.D.; Cade, B.S.; Kidd, K.A.; Muir, D.C.G.; Leipzig-Scott, P. Trophic magnification of organic chemicals: A global synthesis. Environ. Sci. Technol. 2016, 50, 4650–4658. [Google Scholar] [CrossRef]


| DF | SS | MS | F | P | |
|---|---|---|---|---|---|
| DDTs | |||||
| Size | 1 | 3.672 | 3.672 | 58.456 | <0.001 |
| Season | 3 | 4.948 | 1.649 | 26.256 | <0.001 |
| Size X Season | 3 | 0.593 | 0.198 | 3.149 | 0.048 |
| PCBs | |||||
| Size | 1 | 0.002 | 0.002 | 0.011 | 0.918 |
| Season | 3 | 8.550 | 2.850 | 14.312 | <0.001 |
| Size X Season | 3 | 1.052 | 0.351 | 1.760 | 0.187 |
| δ15N‰ | |||||
| Size | 1 | 3.239 | 3.239 | 1.195 | 0.287 |
| Season | 3 | 7.226 | 79.075 | 26.169 | <0.001 |
| Size X Season | 3 | 5.229 | 1.743 | 0.643 | 0.596 |
© 2019 by the authors. Licensee MDPI, Basel, Switzerland. This article is an open access article distributed under the terms and conditions of the Creative Commons Attribution (CC BY) license (http://creativecommons.org/licenses/by/4.0/).
Share and Cite
Piscia, R.; Mazzoni, M.; Bettinetti, R.; Caroni, R.; Cicala, D.; Manca, M.M. Stable Isotope Analysis and Persistent Organic Pollutants in Crustacean Zooplankton: The Role of Size and Seasonality. Water 2019, 11, 1490. https://doi.org/10.3390/w11071490
Piscia R, Mazzoni M, Bettinetti R, Caroni R, Cicala D, Manca MM. Stable Isotope Analysis and Persistent Organic Pollutants in Crustacean Zooplankton: The Role of Size and Seasonality. Water. 2019; 11(7):1490. https://doi.org/10.3390/w11071490
Chicago/Turabian StylePiscia, Roberta, Michela Mazzoni, Roberta Bettinetti, Rossana Caroni, Davide Cicala, and Marina Marcella Manca. 2019. "Stable Isotope Analysis and Persistent Organic Pollutants in Crustacean Zooplankton: The Role of Size and Seasonality" Water 11, no. 7: 1490. https://doi.org/10.3390/w11071490
APA StylePiscia, R., Mazzoni, M., Bettinetti, R., Caroni, R., Cicala, D., & Manca, M. M. (2019). Stable Isotope Analysis and Persistent Organic Pollutants in Crustacean Zooplankton: The Role of Size and Seasonality. Water, 11(7), 1490. https://doi.org/10.3390/w11071490