Article

Development and Evaluation of an Agricultural Drought Index by Harnessing Soil Moisture and Weather Data

1
Department of Biosystems and Agricultural Engineering, Oklahoma State University, Stillwater, OK 74078, USA
2
USDA, Agricultural Research Service, Grazinglands Research Laboratory, El Reno, OK 73036, USA
3
USDA, Agricultural Research Service, Conservation and Production Research Laboratory, Bushland, TX 79012, USA
*
Author to whom correspondence should be addressed.
Water 2019, 11(7), 1375; https://doi.org/10.3390/w11071375
Submission received: 2 June 2019 / Revised: 28 June 2019 / Accepted: 2 July 2019 / Published: 4 July 2019
(This article belongs to the Section Water Resources Management, Policy and Governance)

Abstract

:
A new agricultural drought index was developed for monitoring drought impacts on agriculture in Oklahoma. This new index, called the Soil Moisture Evapotranspiration Index (SMEI), estimates the departure of aggregated root zone moisture from reference evapotranspiration. The SMEI was estimated at five locations across Oklahoma representing different climates. The results showed good agreement with existing soil moisture-based (SM) and meteorological drought indices. In addition, the SMEI had improved performance compared to other indices in capturing the effects of temporal and spatial variations in drought. The relationship with crop production is a key characteristic of any agricultural drought index. The correlations between winter wheat production and studied drought indices estimated during the growing period were investigated. The correlation coefficients were largest for SMEI (r > 0.9) during the critical crop growth stages when compared to other drought indices, and r decreased by moving from semi-arid to more humid regions across Oklahoma. Overall, the results suggest that the SMEI can be used effectively for monitoring the effects of drought on agriculture in Oklahoma.

1. Introduction

Drought events occur frequently in the Southern Great Plains of the United States, negatively impacting agricultural production and sustainability. This is mainly due to scarce surface water resources in this region. Groundwater resources, such as the Ogallala aquifer, help producers mitigate drought impacts [1]. However, these resources are being depleted at an unsustainable rate, especially during dry periods [2]. In Oklahoma, recorded drought history dates to the start of the 20th century, when major droughts were experienced in the decadal spans of 1910, 1930, 1950, 1960, and 1970. The beginning of the 21st century brought severe drought-related losses to Oklahoma’s agriculture. For instance, the drought episode of 2001–2002 cost $210 million to the state’s economy due to significant yield loss of winter wheat, alfalfa, and hay [2].
A more recent period of extreme and exceptional drought in Oklahoma was between 2011 and 2015, with devastating impacts on irrigated agriculture. As a result of this episode and consequent declines in reservoir water levels, the Luger-Altus Irrigation District in southwest Oklahoma could not deliver irrigation water during the 2011–2014 period [2]. In addition, groundwater resources experienced greater-than-usual depletions. The Ogallala aquifer underlying the Oklahoma Panhandle recorded a rate of decline that was 2.75 times larger than non-drought years. Recurrent dry periods along with low precipitation and consequent low agricultural production have been projected for the Southern Great Plains region under a changing climate [3,4]. Considering these existing and future challenges, managing and planning of limited agricultural water resources for sustainable agricultural production in the region should consider innovative approaches to improve drought monitoring and assessment.
Drought assessment is key to water resources management and planning [5]. Optimal selection of drought monitoring tools, such as drought indicators and indices, can elevate the drought mitigation measures [6,7]. Drought indices are the assimilation of single or multiple weather and/or hydrologic variables and are considered more pertinent for drought monitoring compared to standalone indicators (e.g., temperature, precipitation, etc.) [8]. Soil moisture is one of the variables used in drought monitoring and assessment, especially in the case of agricultural drought. This is mainly because soil moisture availability governs physiological processes in plants, and any paucity of water content in the crop root-zone can impede productivity [9,10]. A drought index using soil moisture would be directly related to crop growth potential and could provide a decision support tool.
There are typically four common approaches to development of drought indices that use measured or modeled soil moisture data. One approach compares the soil moisture with thresholds such as field capacity and wilting point [11,12,13]. The second approach applies statistical analysis (e.g., probability, probability density function, normalization, etc.) on soil moisture data and then quantifies drought intensity based on the attributes of the computed statistics [14,15,16,17]. The third approach combines the first two approaches [18,19], while the fourth one adds additional variables such as evapotranspiration (ET) to improve the sensitivity of the estimated drought index [20,21].
Regardless of the approach used, soil moisture (SM) based indices have had similar or improved performance compared to other indices. In addition, SM indices have been found to be highly correlated with crop yield [10,14] and in good agreement with the net difference between precipitation and potential ET at different time scales and lags [11,13,19]. Previously developed indices such as Z-Index [22] and Agriculture Reference Index for Drought (ARID) [21] have shown that calculations involving both SM and ET outperform conventional indices in tracking agricultural drought by approximating the water deficit and characterizing the moisture dynamics during transition between wet and dry conditions. Nonetheless, these indices have been identified with adaptability issues. For example, Keyantash and Dracup [23] ranked Z-Index low in terms of “tractability” and “transparency” due to its complicated formulation and computations. ARID was assigned the lowest rank in “ease of use” classifications of the World Meteorological Organization (WMO) and the Global Water Partnership (GWP) [24], as it requires advanced modeling efforts for site specific simulations [25]. The aforementioned limitations in drought indices reduce their acceptability among producers and reduce the effectiveness of outreach efforts to convey drought conditions to a larger audience [23].
In addition, the ability of a drought index to capture the impact of climate anomalies on the crop productivity is of crucial importance. Though the relationship of crop production and climate is non-linear and complex due to seasonal variability [26], a drought index capable of explaining a large part of variability in the anticipated crop yield would be potentially preferred by the farmers—especially in regions such as Oklahoma where agricultural economy depends significantly on a crop (dryland winter wheat) that is highly susceptible to drought [27]. Such an index could have a considerable economic impact, as the winter wheat growers have to make decisions about grazing in early crop stages based on expected yields and the dynamics of the market [28]. Testing the index’s performance against the crop production under rain-fed conditions could help with evaluating the efficacy of the index [11,14], and the dryland yield could be used as a benchmark to determine the suitability of agricultural drought index [21].
Consequently, there is a need for an agricultural drought index that not only harnesses the efficacy of high quality SM and ET databases but also holds the simplicity in design and computation, providing a decision making tool to end-users. The main goal of this study was to develop and evaluate a new agricultural drought index by utilizing daily SM and ET datasets in Oklahoma. More specific objectives were: i) to investigate the relationships between the new index and several previously developed SM-based and meteorological indices; ii) to study the spatial and the temporal variations in the new index across Oklahoma; and iii) to explore the response of winter wheat production to drought magnitude estimated by new and existing drought indices. The Oklahoma Mesonet [29], containing soil moisture and weather data across a range of climates, provided a unique opportunity to develop and evaluate the proposed new index.

2. Materials and Methods
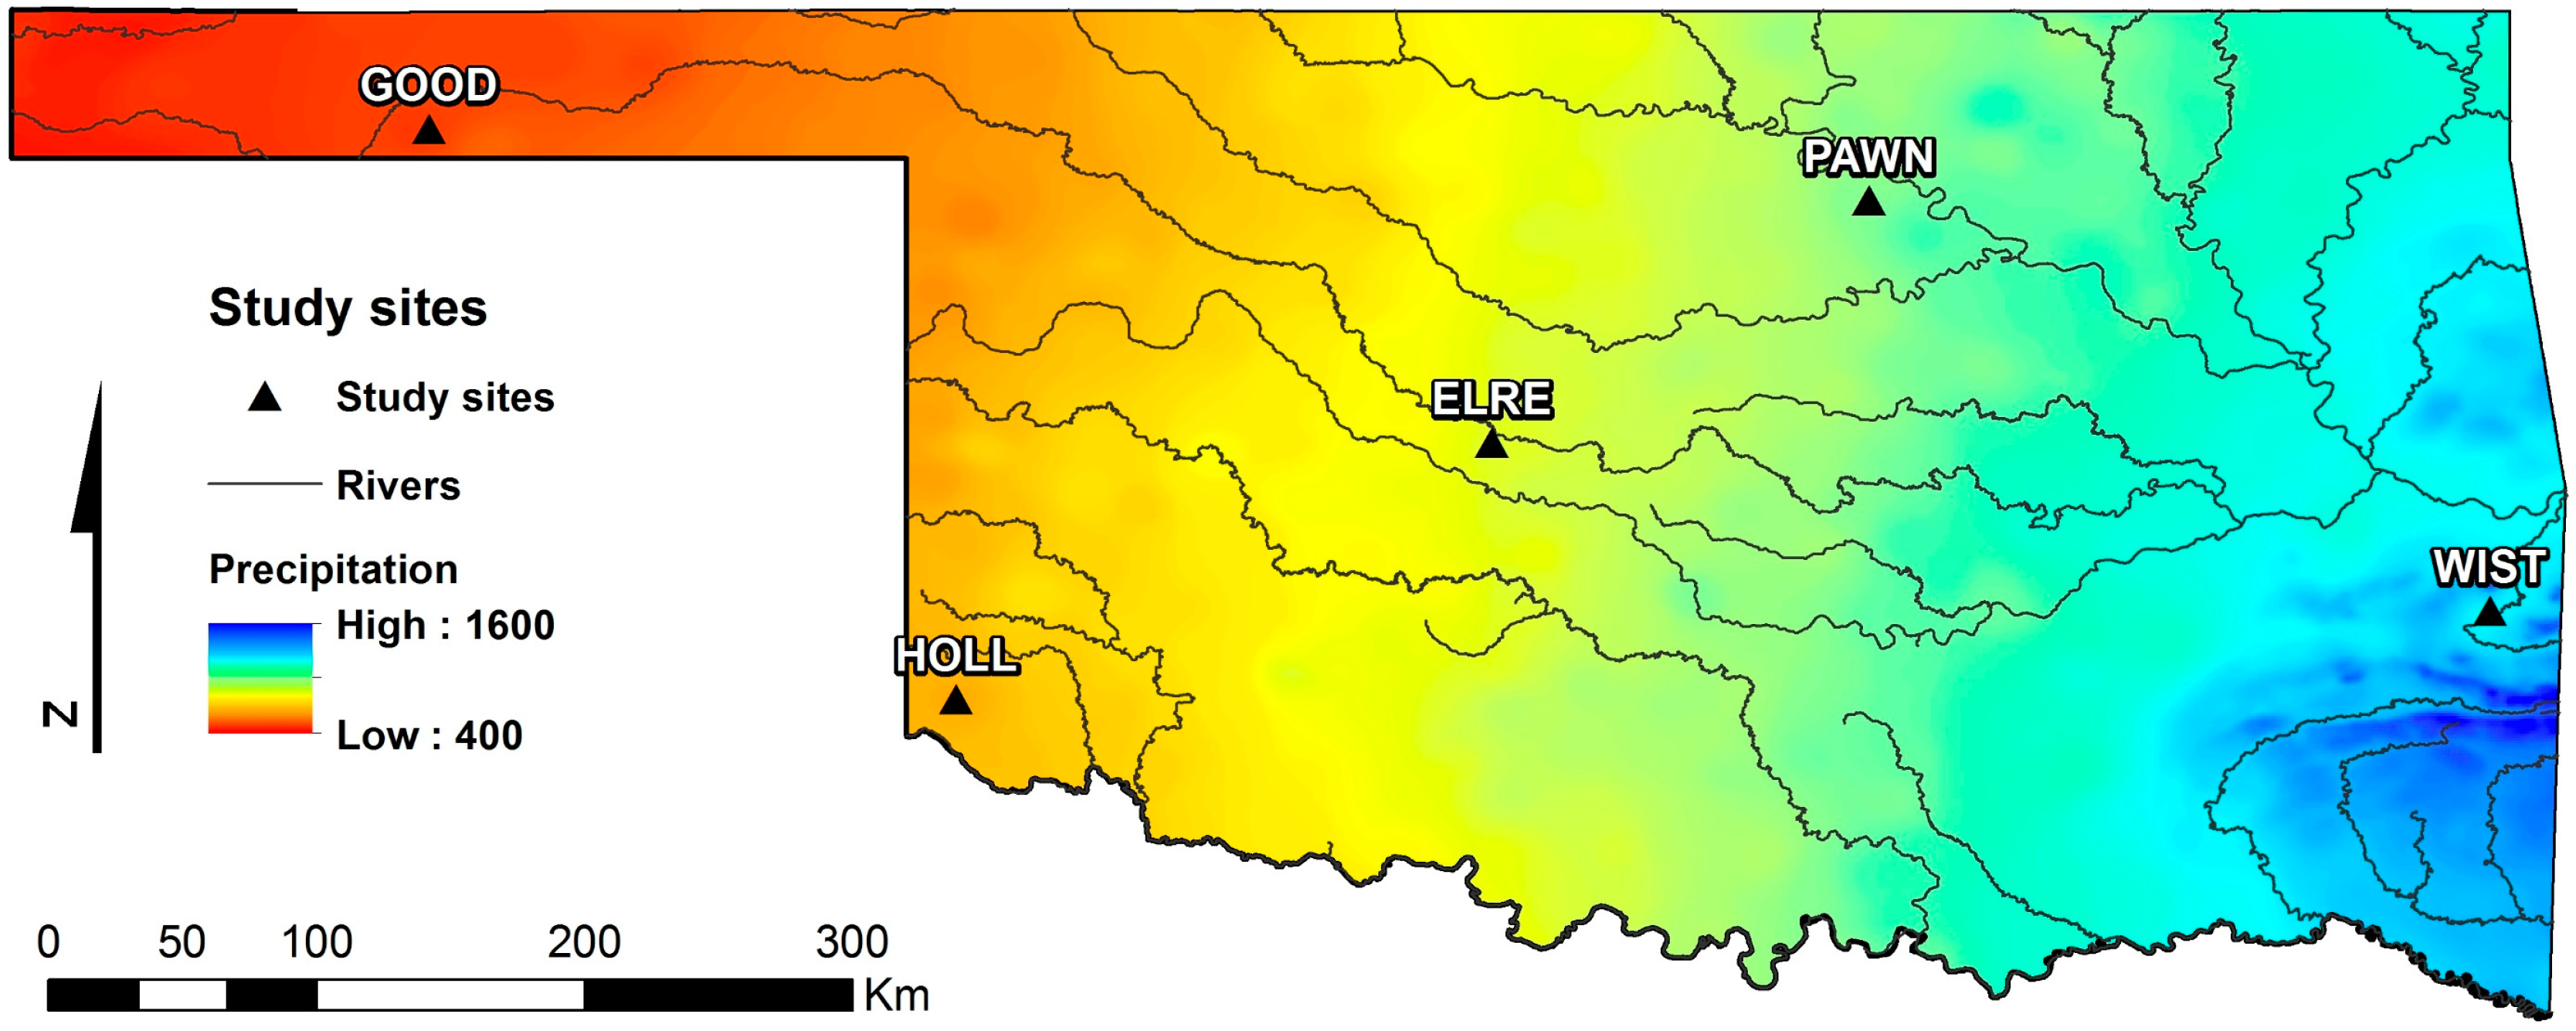
2.1. Study Sites

This study was conducted using data collected during a 17 year period from 2000 to 2016 at five Mesonet weather stations [29,30] under natural grassland across Oklahoma. These sites are located near the cities of Goodwell, Hollis, El Reno, Pawnee, and Wister, representing Panhandle, Southwest, Central, Northeast, and Southeast Oklahoma, respectively. The selected sites were spread across the precipitation gradient in Oklahoma, which increases approximately 250 mm for every 1° latitude from the Panhandle to southeast Oklahoma (Figure 1). Table 1 presents annual temperature, precipitation, and reference evapotranspiration data for each study site.

2.2. Input Data

Each Mesonet station was equipped with automated sensors to record precipitation, air temperature, relative humidity, wind speed, solar radiation, and soil moisture. Soil moisture was estimated using heat dissipation sensors (model 229-L, Campbell Scientific, Inc., Logan, UT, USA; accuracy < ± 0.5 °C) installed at three depths of 5, 25, and 60 cm below the soil surface [31]. Each sensor was calibrated before installation to obtain an accurate relationship between heat dissipation and soil matric potential, which was then converted to volumetric water content (VWC) based on the van Genuchten [32] method. Measurements from undisturbed soil cores at each site were used for determining water contents at field capacity (FC) and wilting point (WP) as well as the van Genuchten parameters [33]. Using accurate estimates of soil parameters based on in-situ measurements is a major requirement in obtaining reliable SM based drought indices, a point that was highlighted in previous studies [11,12,13,19]. Table 2 presents the soil texture and the VWC at FC and WP for the three sensor installation depths at each site.
Daily VWC data for the study period (2000–2016) collected at each of the three depths from the five sites were used in the analysis. The Mesonet soil moisture database had some missing values, but they accounted for only 3% of all collected data at each site on average. In addition, more than half of missing values occurred during periods with no measured precipitation. Thus, the gaps were filled using a linear interpolation technique. Meteorological data such as precipitation, air temperature, relative humidity, wind speed, and solar radiation were also measured by the Mesonet station at each site and were retrieved for the study period (2000–2016).
To investigate the impact of drought on crop yield, the relationship between drought indices and winter wheat production—a major crop in Oklahoma—was analyzed. County wise data on winter wheat production were downloaded from the website of the U.S. Department of Agriculture, National Agriculture Statistics Service (https://quickstats.nass.usda.gov/). The reported values represented both irrigated and non-irrigated winter wheat in Oklahoma. Segregated datasets of non-irrigated and irrigated winter wheat were not available for the complete study period. Furthermore, almost 96% of the winter wheat harvested area was non-irrigated in Oklahoma between 2001 and 2009. Hence, the obtained data can be safely assumed to represent dryland production, which is more susceptible to drought. Wister station (see Figure 1) was not included in the analysis due to insufficient data. Tian et al. [34] conducted a similar study in the same region under limitation of data availability and found the combined dataset of winter wheat yield (irrigated plus non-irrigated) suitable for such analysis based on the low percentage of irrigated area.

2.3. Soil Moisture Based Drought Indices

Three previously developed SM based drought indices and a new index were calculated for each site during the study period. The existing indices included Soil Water Deficit Index (SWDI), Water Deficit Index (d), and Normalized Soil Moisture (NSM), and the new index was called Soil Moisture Evapotranspiration Index (SMEI).

2.3.1. Soil Water Deficit Index

The SWDI was developed by Martínez-Fernández et al. [11] and was estimated as:
SWDI = ( θ θ FC θ AWC ) × 10
where θ is the aggregated VWC of soil profile, θFC is the VWC at FC, and θAWC is the available water content estimated as the difference between VWC at FC and WP (all in m3 m−3). The weighted average of θ was estimated using the following approach as suggested by [11]:
θ = ( θ 5 × 1 ) 5 + ( θ 25 × 2 ) 5 + ( θ 60 × 2 ) 5
where θ5, θ25, and θ60 are VWC at 5, 25, and 60 cm soil layers.

2.3.2. Water Deficit Index

This index was suggested by Cammalleri et al. [19]:
d = 1 1 + ( θ θ 50 ) n
where n is an empirical exponent (unitless) and θ50 is estimated by averaging VWC between soil moisture thresholds as described by [19]; θ was aggregated for the soil profile based on Equation (2).

2.3.3. Normalized Soil Moisture

The NSM was proposed by Dutra et al. [16] as:
NSM m , y = θ m , y θ ¯ m σ m
where θm,y is the VWC for the month m and the year y (m3 m−3), θ ¯ m is the mean monthly VWC (m3 m−3), and σm is the standard deviation for all study years. This index is a mathematical imitation of the standardized precipitation anomaly used by Jones and Hulme [35]. Modeled soil moisture estimates of the top 289 cm of soil were used by Dutra et al. [16]. In the present study, however, in-situ measurements of soil moisture were aggregated based on Equation (2) and used in calculating NSM at two different time scales—one month (NSM-1) and three months (NSM-3). For NSM-3, the average θm,y over three consecutive months was used in Equation (4) along with corresponding θ ¯ m and σm.

2.3.4. Soil Moisture Evapotranspiration Index

The SMEI is proposed in this study based on soil moisture and reference evapotranspiration (ETr) estimates. The SMEI estimation follows a three-step approach. At the first step, the aggregated daily root zone water storage (in units of water depth, such as mm) is calculated using a zone-weighted approach:
RZWS i = ( θ 5 × L 1 ) + ( θ 25 × L 2 ) + ( θ 60 × L 3 )
where RZWSi is the root zone water storage on day i and L1, L2, and L3 are the layers in the crop root zone represented by each soil moisture sensor. In this study, values of 10, 30, and 40 cm were used for L1, L2, and L3, respectively, assuming a root zone depth of 80 cm [36]. This aggregation of RZWS was in agreement with soil moisture sensor depths of Oklahoma Mesonet as discussed by Ochsner et al. [37]. The values of the L parameters can be modified in other applications based on the number and the depth of soil moisture sensors as well as the root zone.
In the second step, the difference between monthly average RZWS and monthly cumulative ETr (both in units of water depth) is estimated for each month during the study period:
D m , y = [ 1 n i = 1 n RZWS i ]   [ i = 1 n ET r i ]
where D m , y is the difference between monthly average of RZWSi and monthly sum of ETri for month m and year y, n is the number of days in each month, and ETri is the reference ET on day i. The standardized approach of the American Society of Civil Engineers (ASCE) outlined in [38] was adopted in estimating ETri using the REF-ET program [39], and Mesonet weather data were used as input. The ASCE standardized approach is based on the simplified ASCE Penman-Monteith equation for a tall agricultural crop as the reference surface. Detailed information on the required parameters and their units can be found in [38]. The final step involves standardizing D m , y using the average and standard deviation to estimate the drought index:
S M E I m , y = D m , y D m ¯ σ m
where D m ¯ is the monthly average, and σm is the monthly standard deviation of D m , y for the same month among all study years.
In essence, SMEI is similar to Palmer’s Z-Index where ET is subtracted from precipitation at a monthly time-step to model soil water deficit (explained later). In SMEI, however, precipitation is replaced with soil moisture since the latter parameter better represents the source of water available to agricultural crops [40]. This is because smaller amounts of precipitation evaporate from soil and plant surfaces before reaching the root zone, and larger amounts can generate runoff or deep percolation below the root zone. In either case, the precipitated water will not be available for crop consumption. The inclusion of a water consumption/demand parameter (ET) along with a water source parameter (soil moisture) in the same index can also augment the drought signal [41].
In estimating SMEI, the common approach of presenting drought indices as anomalies [42] was followed, and z-scores were calculated by normalizing Dm,y to a mean of zero and a standard deviation of one. Therefore, the SMEI values can be interpreted similar to the values of Standardized Precipitation Index (SPI) and Standardized Precipitation Evapotranspiration Index (SPEI, explained later), where negative values represent drought condition. In addition to monthly SMEI (SMEI-1), 3 month SMEI (SMEI-3) was calculated in order to understand the characteristics of drought events as drought recurrence decreases and its duration increases at longer time scales [43]. The 3 month SMEI was estimated by using the corresponding parameters over three consecutive months in Equations (7) and (8) (similar to NSM-3). Longer time scales (9 and 12 month) were not included, since the focus of this study was exclusively on agricultural drought, and the 3 month time scale was considered sufficient for this purpose [44].
One of the main merits of SMEI is the use of estimated soil moisture, which has been assigned with the highest ranking in terms of transparency of a drought index by Keyantash and Dracup [23]. In addition, the computational approach of SMEI is relatively simple. The tractability of this index may seem lower because soil moisture sensors have not been widely used by agricultural producers in the past. However, soil moisture sensing devices are becoming increasingly affordable [45], and their inclusion in public weather networks provides a valuable resource to all end-users.

2.4. Meteorological Drought Indices

Seven widely used meteorological drought indices were estimated in this study, including Atmospheric Water Deficit (AWD), Standardized Precipitation Index (SPI), Palmer’s Z-Index, Palmer Drought Severity Index (PDSI), Self-Calibrated PDSI (scPDSI), Standardized Precipitation Evapotranspiration Index (SPEI), and U.S. Drought Monitor (USDM). The calculation of SPI, Z-Index, PDSI, scPDSI, and SPEI requires time series data for a minimum of 30 years for a thorough drought analysis [46]. As mentioned before, the present study focused on the 17 year period of 2000–2016. Therefore, PRISM (Parameter-elevation Regressions on Independent Slopes Model) [47] and COOP (The National Weather Service Cooperative Observer Network) 4 × 4 km grid monthly datasets for precipitation and temperature were used for constructing the timeline before the year 2000. The PRISM data are available at https://wrcc.dri.edu/wwdt/time/. Schneider and Ford [48] found that the PRISM database was useful in developing “climate informed decision support” in case of non-availability of long-term precipitation data. The root mean square error (RMSE) for precipitation and temperature data collected from Mesnoet and PRISM-COOP for 2000–2016 was estimated as 18.33 mm and 0.70 °C, respectively.

2.4.1. Atmospheric Water Deficit

The AWD constitutes a simple calculation where weekly sums of precipitation are subtracted from weekly sums of ET [18]. In this study, the AWD was calculated reversely (precipitation—ET) similar to Martínez-Fernández et al. [11], and monthly sums were used as opposed to weekly. The ASCE standardized reference ET (ETr) was used in AWD estimations.

2.4.2. Standardized Precipitation Index

The SPI is based on long-term monthly precipitation data and is calculated by fitting the time series to a probability distribution [43]. This distribution is eventually converted into normal distribution to translate the anomalies of precipitation into a score range. In this study, SPI was calculated for one and three month periods using the SPI_SL_6 program (downloaded from http://drought.unl.edu/archive/Programs/SPI/spi_sl_6.exe). The purpose of the calculations that were based on different time scales was to compare the drought indices in regard to short- and long-term drought events [49].

2.4.3. Palmer’s Z-Index

Palmer’s Z-Index (hereinafter Z-Index) requires monthly precipitation and temperature along with the latitude and the available water capacity of the soil as input data. A two-layer soil model approach is used to calculate the water balance [22]. Hydrologic accounting is performed to compute the parameters including ET, recharge, run-off, and loss of moisture from soil along with their potential values. The potential values are further transformed using climate dependent weighting factors. These transformed values are then summed as an equivalent of precipitation required for maintaining the normal soil moisture, which is further subtracted from the actual precipitation in order to estimate the monthly moisture departure [50]. Subsequently, the moisture departure is multiplied with empirically derived climatic characteristic, and the monthly moisture anomaly index known as Z-Index is estimated. Z-Index is sensitive to abrupt variation in soil moisture and thus is considered an appropriate index for monitoring agricultural droughts [51].

2.4.4. Palmer Drought Severity Index

The PDSI relies heavily on Z-Index. With the purpose of integrating the drought magnitude with time, the empirically obtained duration factor was combined with Z-Index, and PDSI values were calculated. These values represented the drought severity and were suitable for quantifying long-term droughts.

2.4.5. Self-Calibrated PDSI

This index makes PDSI more consistent for spatial comparisons of drought through replacing the empirical constants of PDSI with location-specific values [50]. Z-Index, PDSI, and scPDSI were all calculated using the sc-PDSI program downloaded from the website of the GreenLeaf project at University of Nebraska–Lincoln (http://greenleaf.unl.edu/).

2.4.6. Standardized Precipitation Evapotranspiration Index

The SPEI works on the same principle as SPI. However, it includes the long-term variations in air temperature and follows the water balance approach by subtracting potential ET (based on the Thornthwaite method) from precipitation [52]. One and three month SPEI (SPEI-1 and SPEI-3) were obtained in this study using the SPEI calculator [53].

2.4.7. U.S. Drought Monitor

The USDM data were obtained by downloading weekly GIS layers from the web portal of the U.S. Drought Monitor (http://droughtmonitor.unl.edu/Data/GISData.aspx). The USDM reports drought severity in one of the following categories: abnormally dry (D0), moderate drought (D1), severe drought (D2), extreme drought (D3), and exceptional drought (D4). The drought category for each study sites was extracted from USDM layers. The categories were converted to numerical values of 0, 1, 2, 3, and 4 for D0, D1, D2, D3, and D4 categories, respectively. Finally, the median numerical value in each month was used as the monthly value.

2.5. Performance Analysis

In order to evaluate the performance of the newly developed index, its relationship with the existing SM and the meteorological indices was investigated. Correlation analysis is a widely used method for measuring the degree of association among two variables [54]. Pearson correlation analysis was employed, and the following categories of correlation coefficients (r) suggested by Mavromatis [55] were adopted in the present study: very high (>0.9), high (0.7–0.9), moderate (0.5–0.7), weak (0.3–0.5), and very weak (<0.3). The performance of the new index was also assessed by studying its ability to track temporal and spatial variations in drought as compared with several existing indices.
The last step of the performance analysis of the new drought index included investigating its potential for assessing the impact of agricultural drought on winter wheat production between 2000 and 2016. Winter wheat is Oklahoma’s largest crop with an average planted area of 2 to 2.4 million hectares every year [56]. This crop is usually planted in October and harvested in June of the next year, followed by a fallow period or a short-season summer cover crop. The spring period is considered critical due to the occurrence of jointing, heading, and flowering in winter wheat [57], and any water stress in these growth stages can cause significant fluctuations in crop yield [58]. Hence, the correlation between annual winter wheat production and the averaged drought indices was estimated both for the growing season (October to June) and for the critical period related to drought stress (March and April) similar to previous drought studies comparing the magnitude of drought and crop production [14,17,44,59].

3. Results and Discussion

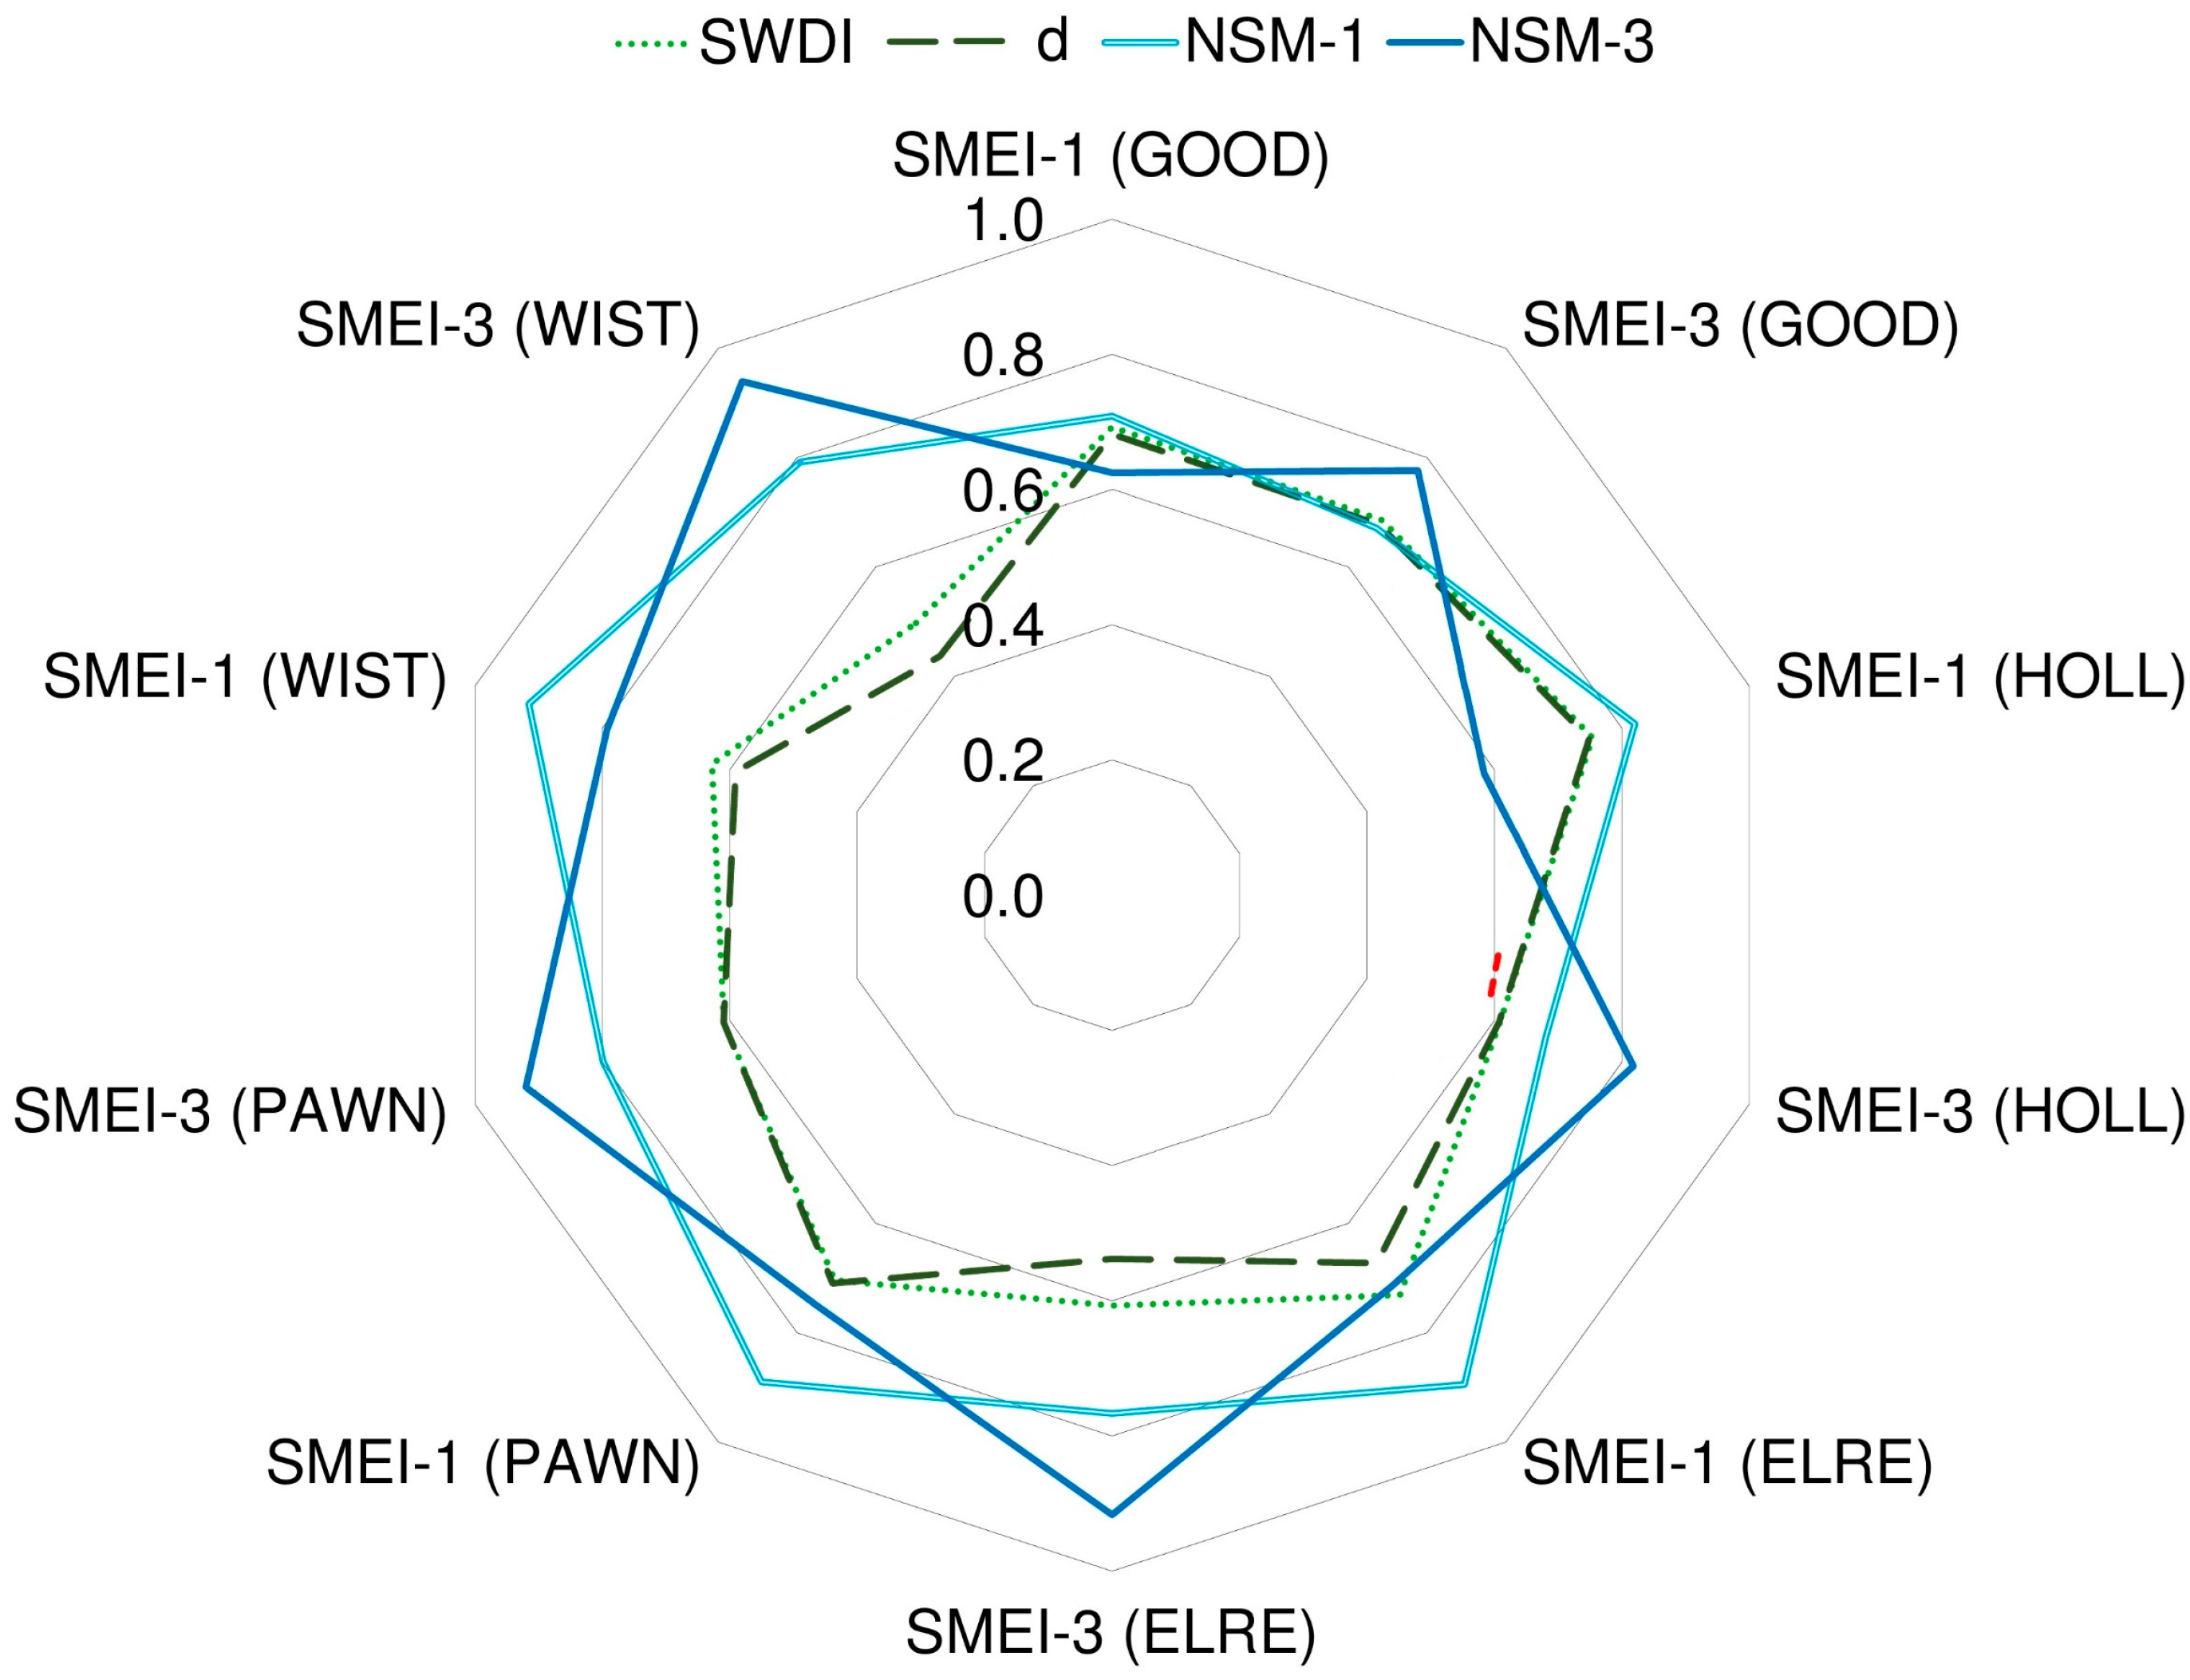
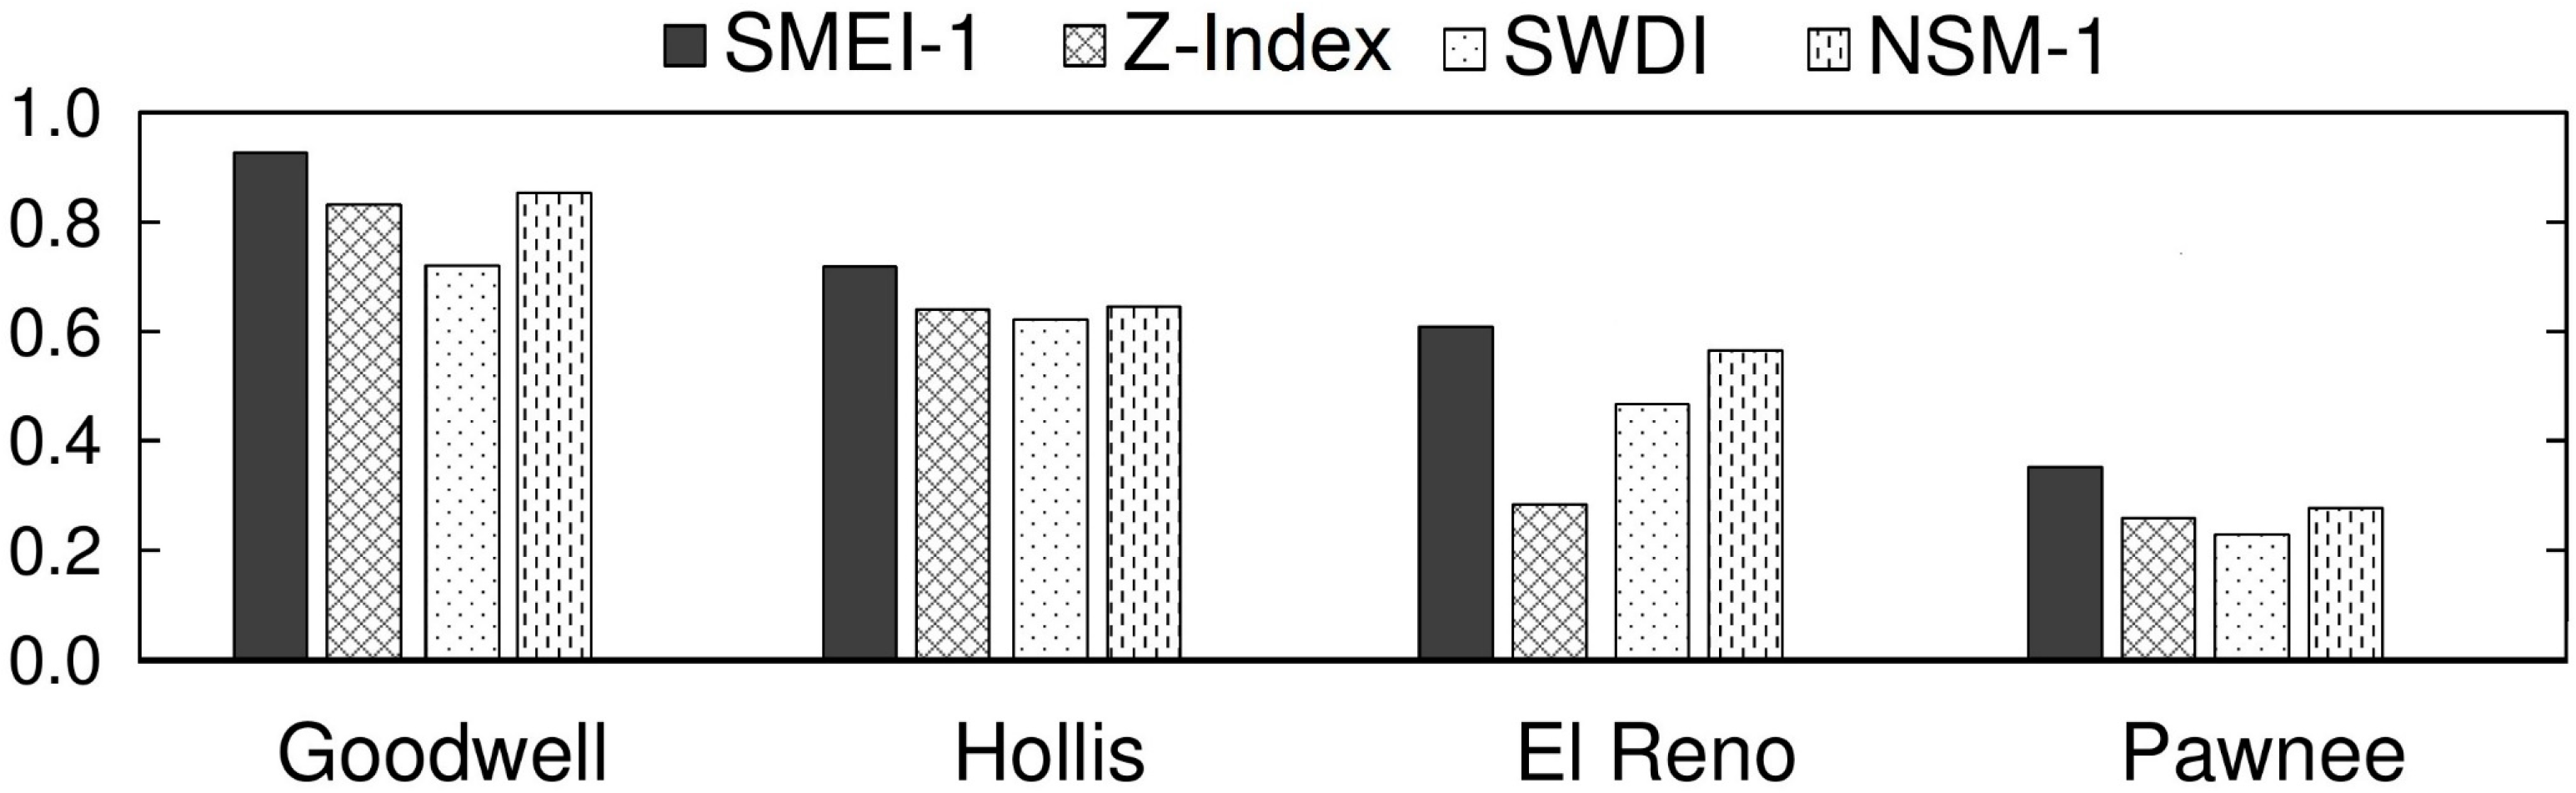
3.1. Comparison with SM Indices

Correlation coefficients of the new and the existing SM based indices for each study site are shown in Figure 2. The new index SMEI-1 had high to very high correlations with NSM-1, represented by r values ranging from 0.70 to 0.92. Moderate to high correlations were noted with SWDI and d, with r ranges of 0.62–0.75 and 0.60–0.75, respectively. In comparison to SMEI-1, SMEI-3 had similar or weaker correlations with existing SM indices, except NSM-3, where better correlations were found (most likely due to similarity in time scales).

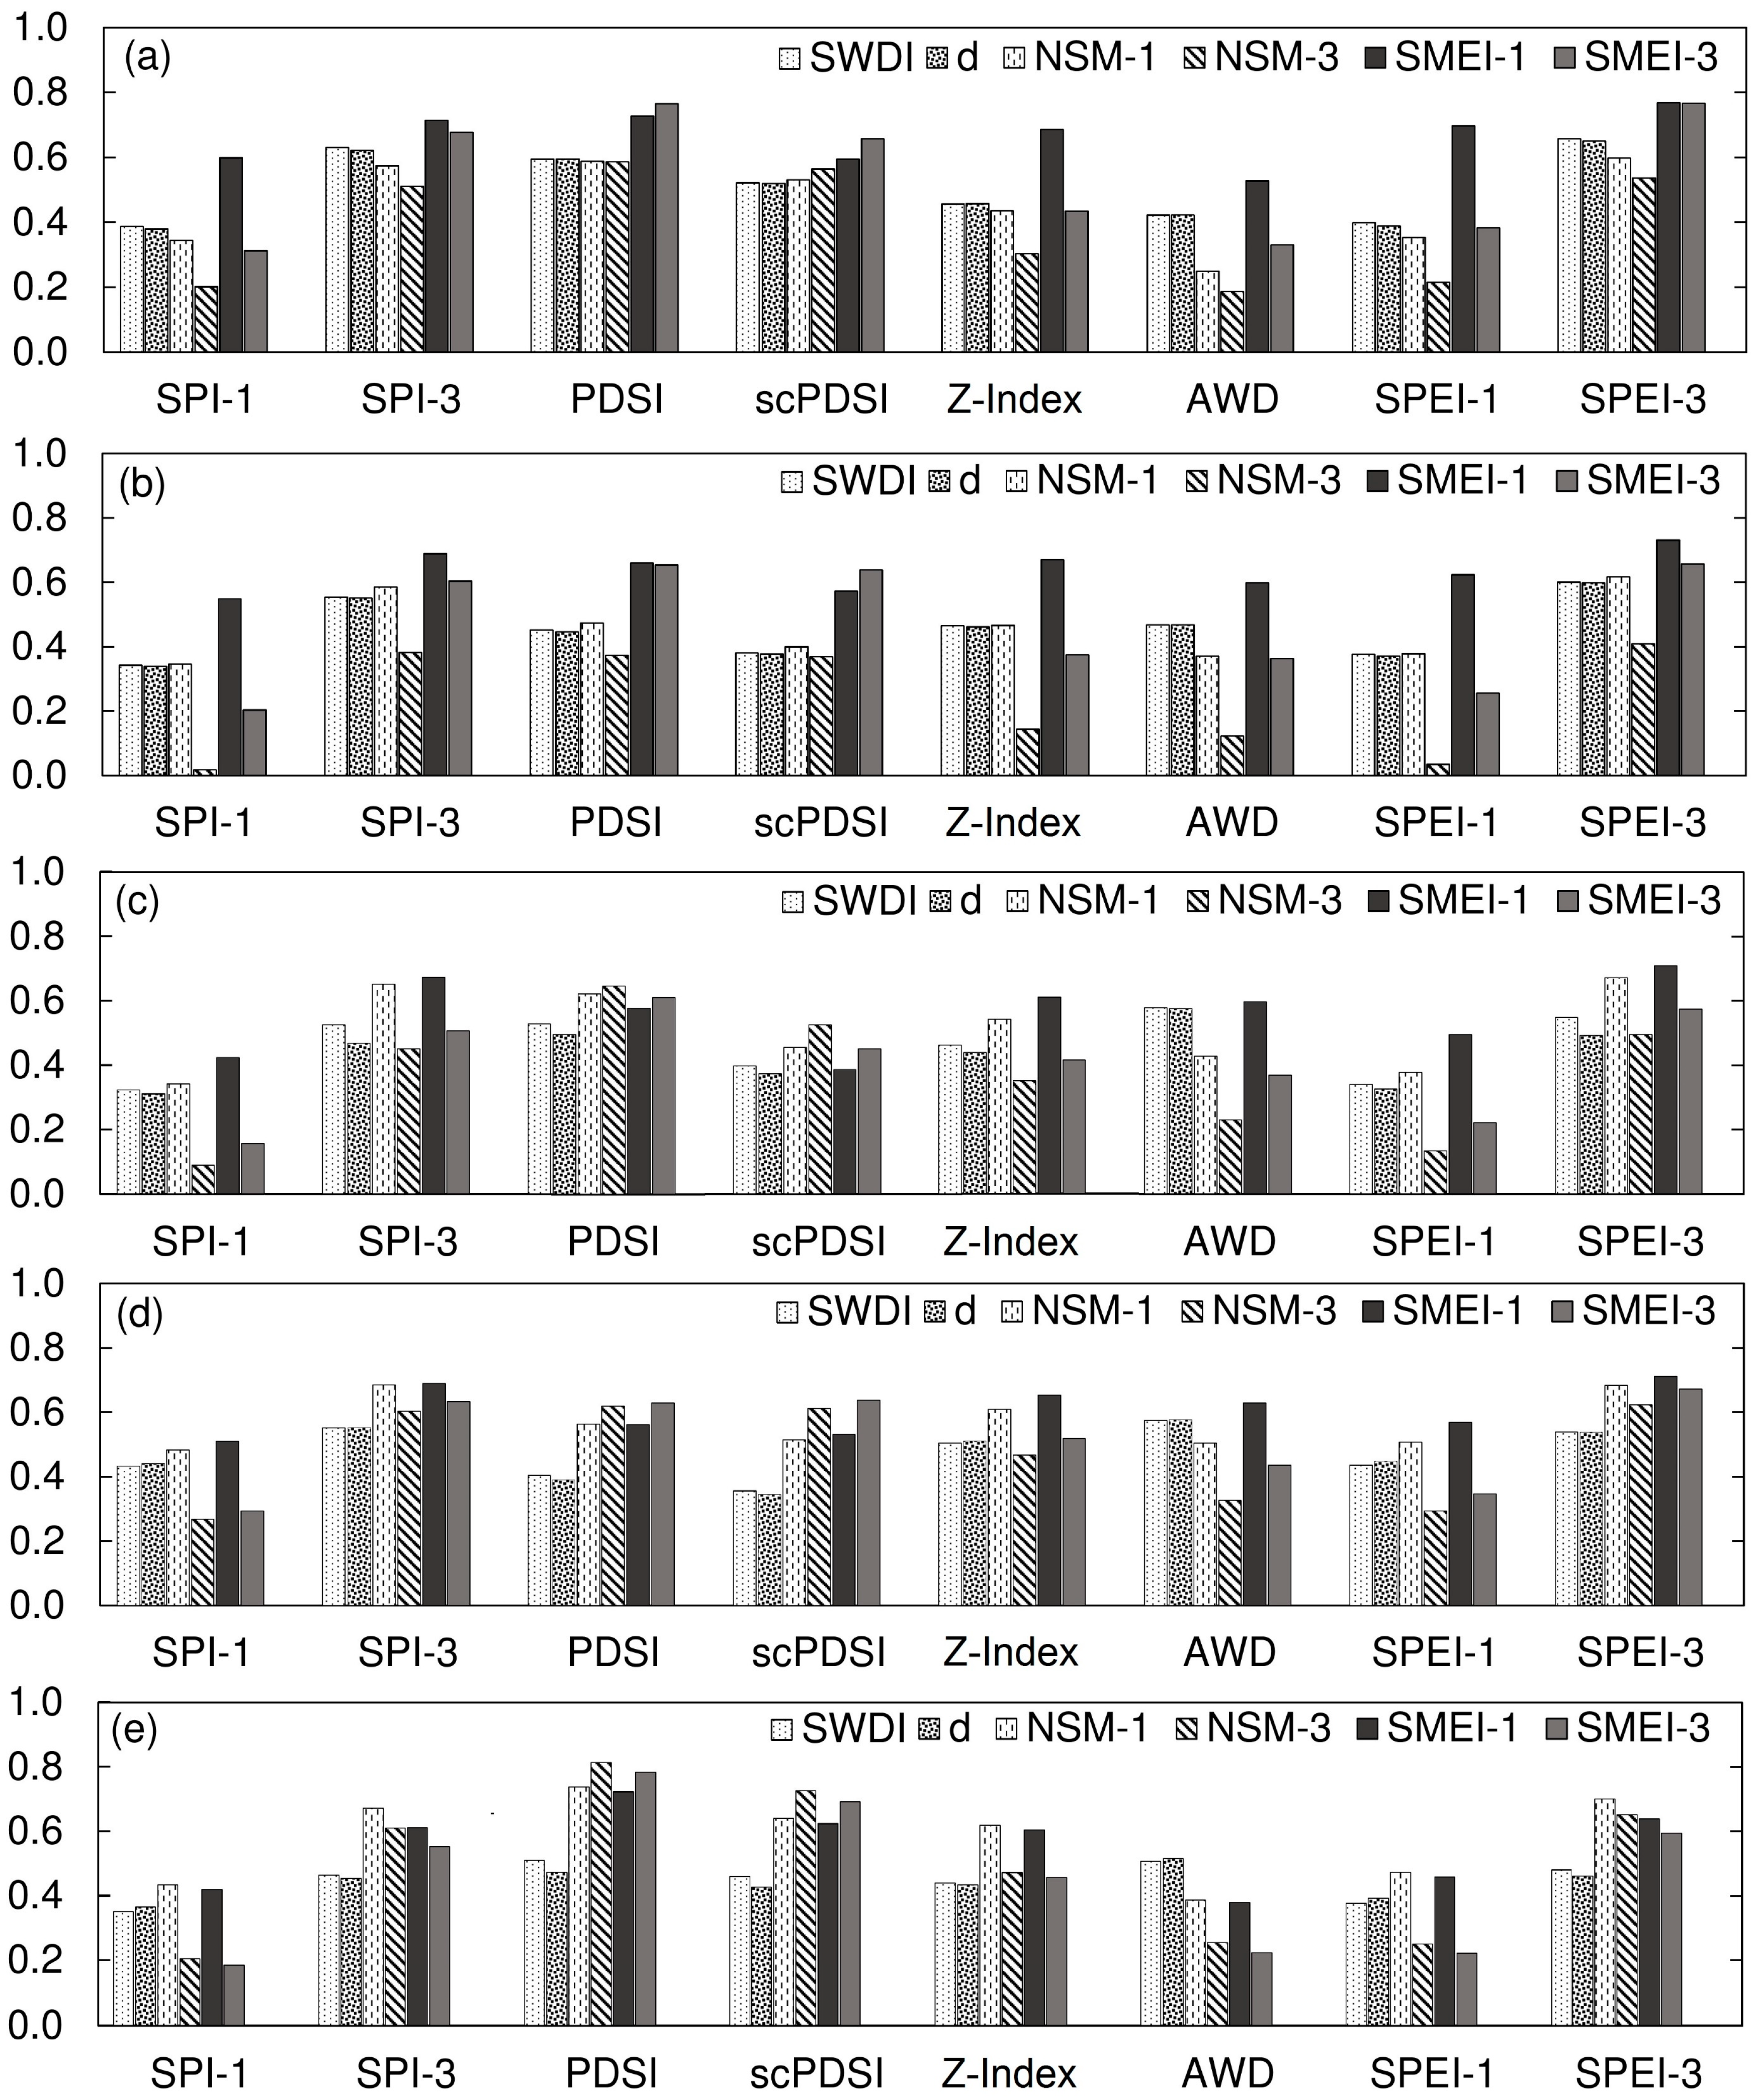
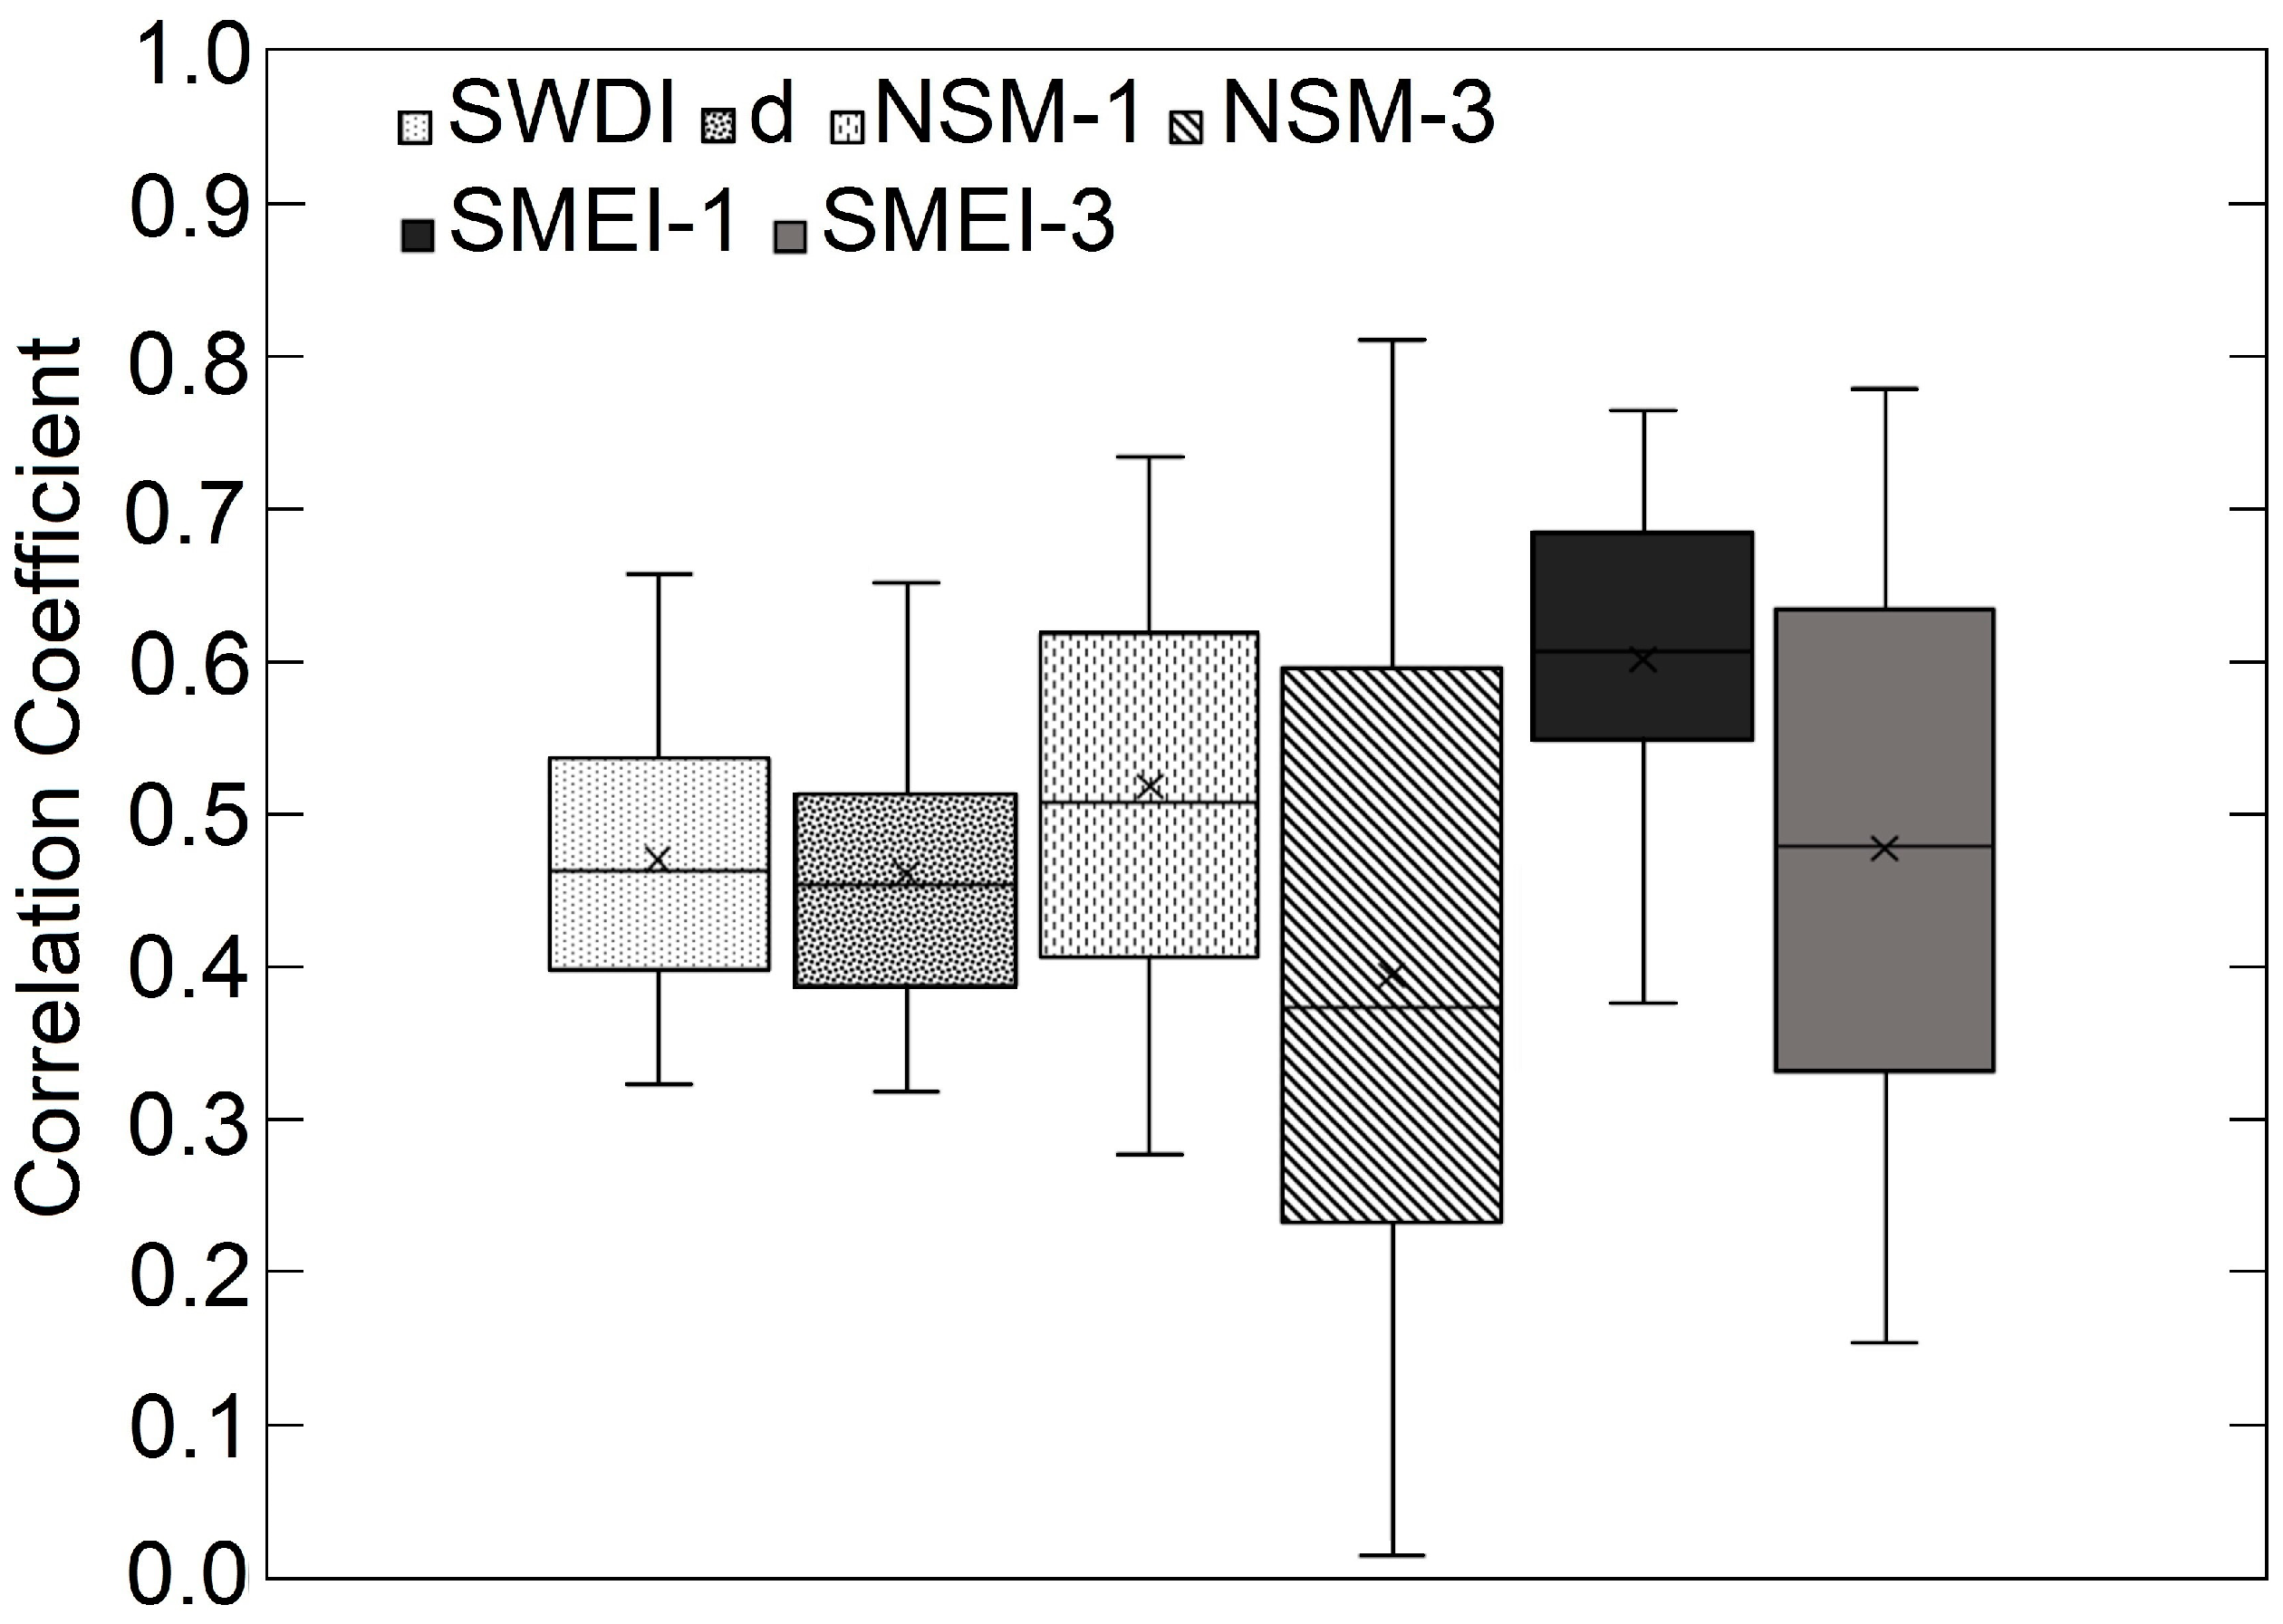
3.2. Comparison with Meteorological Indices

The correlation coefficients among all studied SM and meteorological indices are graphed in Figure 3. Compared to existing SM indices, SMEI-1 had similar or stronger correlations with meteorological indices. Weak to moderate correlations for SMEI-1 were found with SPI-1 (0.41–0.59) and SPEI-1 (0.45–0.69) at all sites. Increasing the time scale of these meteorological indices from one to three months (SPI-3 and SPEI-3) improved correlations (0.61–0.71 and 0.64–0.77, respectively). A similar trend was noted for SMEI-3 and other SM indices, where longer time scale SPI and SPEI had stronger correlations. In case of PDSI, the correlations were improved for SMEI-3 (0.61–0.78) compared to SMEI-1 (0.56–0.72), potentially because the PDSI represents medium to long-term drought conditions.
Weak to moderate correlations were found between SMEI-1 and AWD (0.37–0.62), but the values were comparable or stronger than those with existing SM indices. Moderate correlations between SMEI-1 and Z-Index (0.60–0.68) were found at all study sites. These results were expected, as Z-Index accounts for moisture departure from normal on a monthly basis, mainly in terms of ET and soil moisture losses [60]. As a result, Z-Index is more suitable for detecting variation in soil moisture over a short period of time [51,61], and the same applies to SMEI-1.
To help facilitate a better comparison between new and previously developed SM indices, box and whisker plots of their correlation coefficients with all meteorological indices at all sites are shown in Figure 4. The average correlation between SMEI and meteorological drought indices was 1.3 times higher in comparison to existing SM indices. The SMEI-1 had the largest mean r (0.60) among all SM indices followed by NSM-1 with 0.52. The SMEI-1 also had one of the smallest ranges (0.37–0.76), indicating relatively better performance under variable climatic conditions. In general, the r values had a larger range for longer time scales such as NSM-3 and SMEI-3. This was expected, since indices estimated on a scale of three months are likely to be more strongly correlated with medium to long-term meteorological drought indices but not with short-term indices.
The correlations between meteorological and existing SM drought indices found in this study were similar to those reported in previous studies. For example, the range of SWDI-AWD correlation coefficients was 0.42–0.58 in the present study. Martínez-Fernández et al. [11] found weak to moderate correlations (0.40–0.57) between weekly SWDI and AWD in a semi-arid region with heterogeneous soils. Mishra et al. [62] reported a correlation coefficient of 0.56 for the same indices under humid subtropical climate. In addition, moderate to high correlation coefficients (0.60–0.80) were reported for NSM-PDSI by Dutra et al. [16] for a Mediterranean region, and this study found similar r values ranging between 0.47 and 0.74.
Spatial variations in correlation strength between SMEI-1 and meteorological drought indices at different sites were in accordance with the available literature. The strongest correlations of SMEI-1 and PDSI were found at Goodwell and Wister (r > 0.72), whereas Hollis, El Reno, and Pawnee had r values of 0.66, 0.58, and 0.56, respectively. Greater correlations with PDSI at arid and humid sites were most likely due to the inherent calibration of PDSI in extreme climates [50]. The SMEI-1 showed the strongest correlation with SPEI-3 (r = 0.76) at Goodwell and comparatively weaker correlation at Wister (r = 0.63). This may have been due to overestimation of potential evapotranspiration (PET) by the Thornthwaite equation for SPEI in humid regions [63]. The SMEI correlations with SPEI would probably have been higher if the Penman-Monteith equation was used to estimate the reference ET in SPEI calculations, as recommended by Beguería et al. [64].

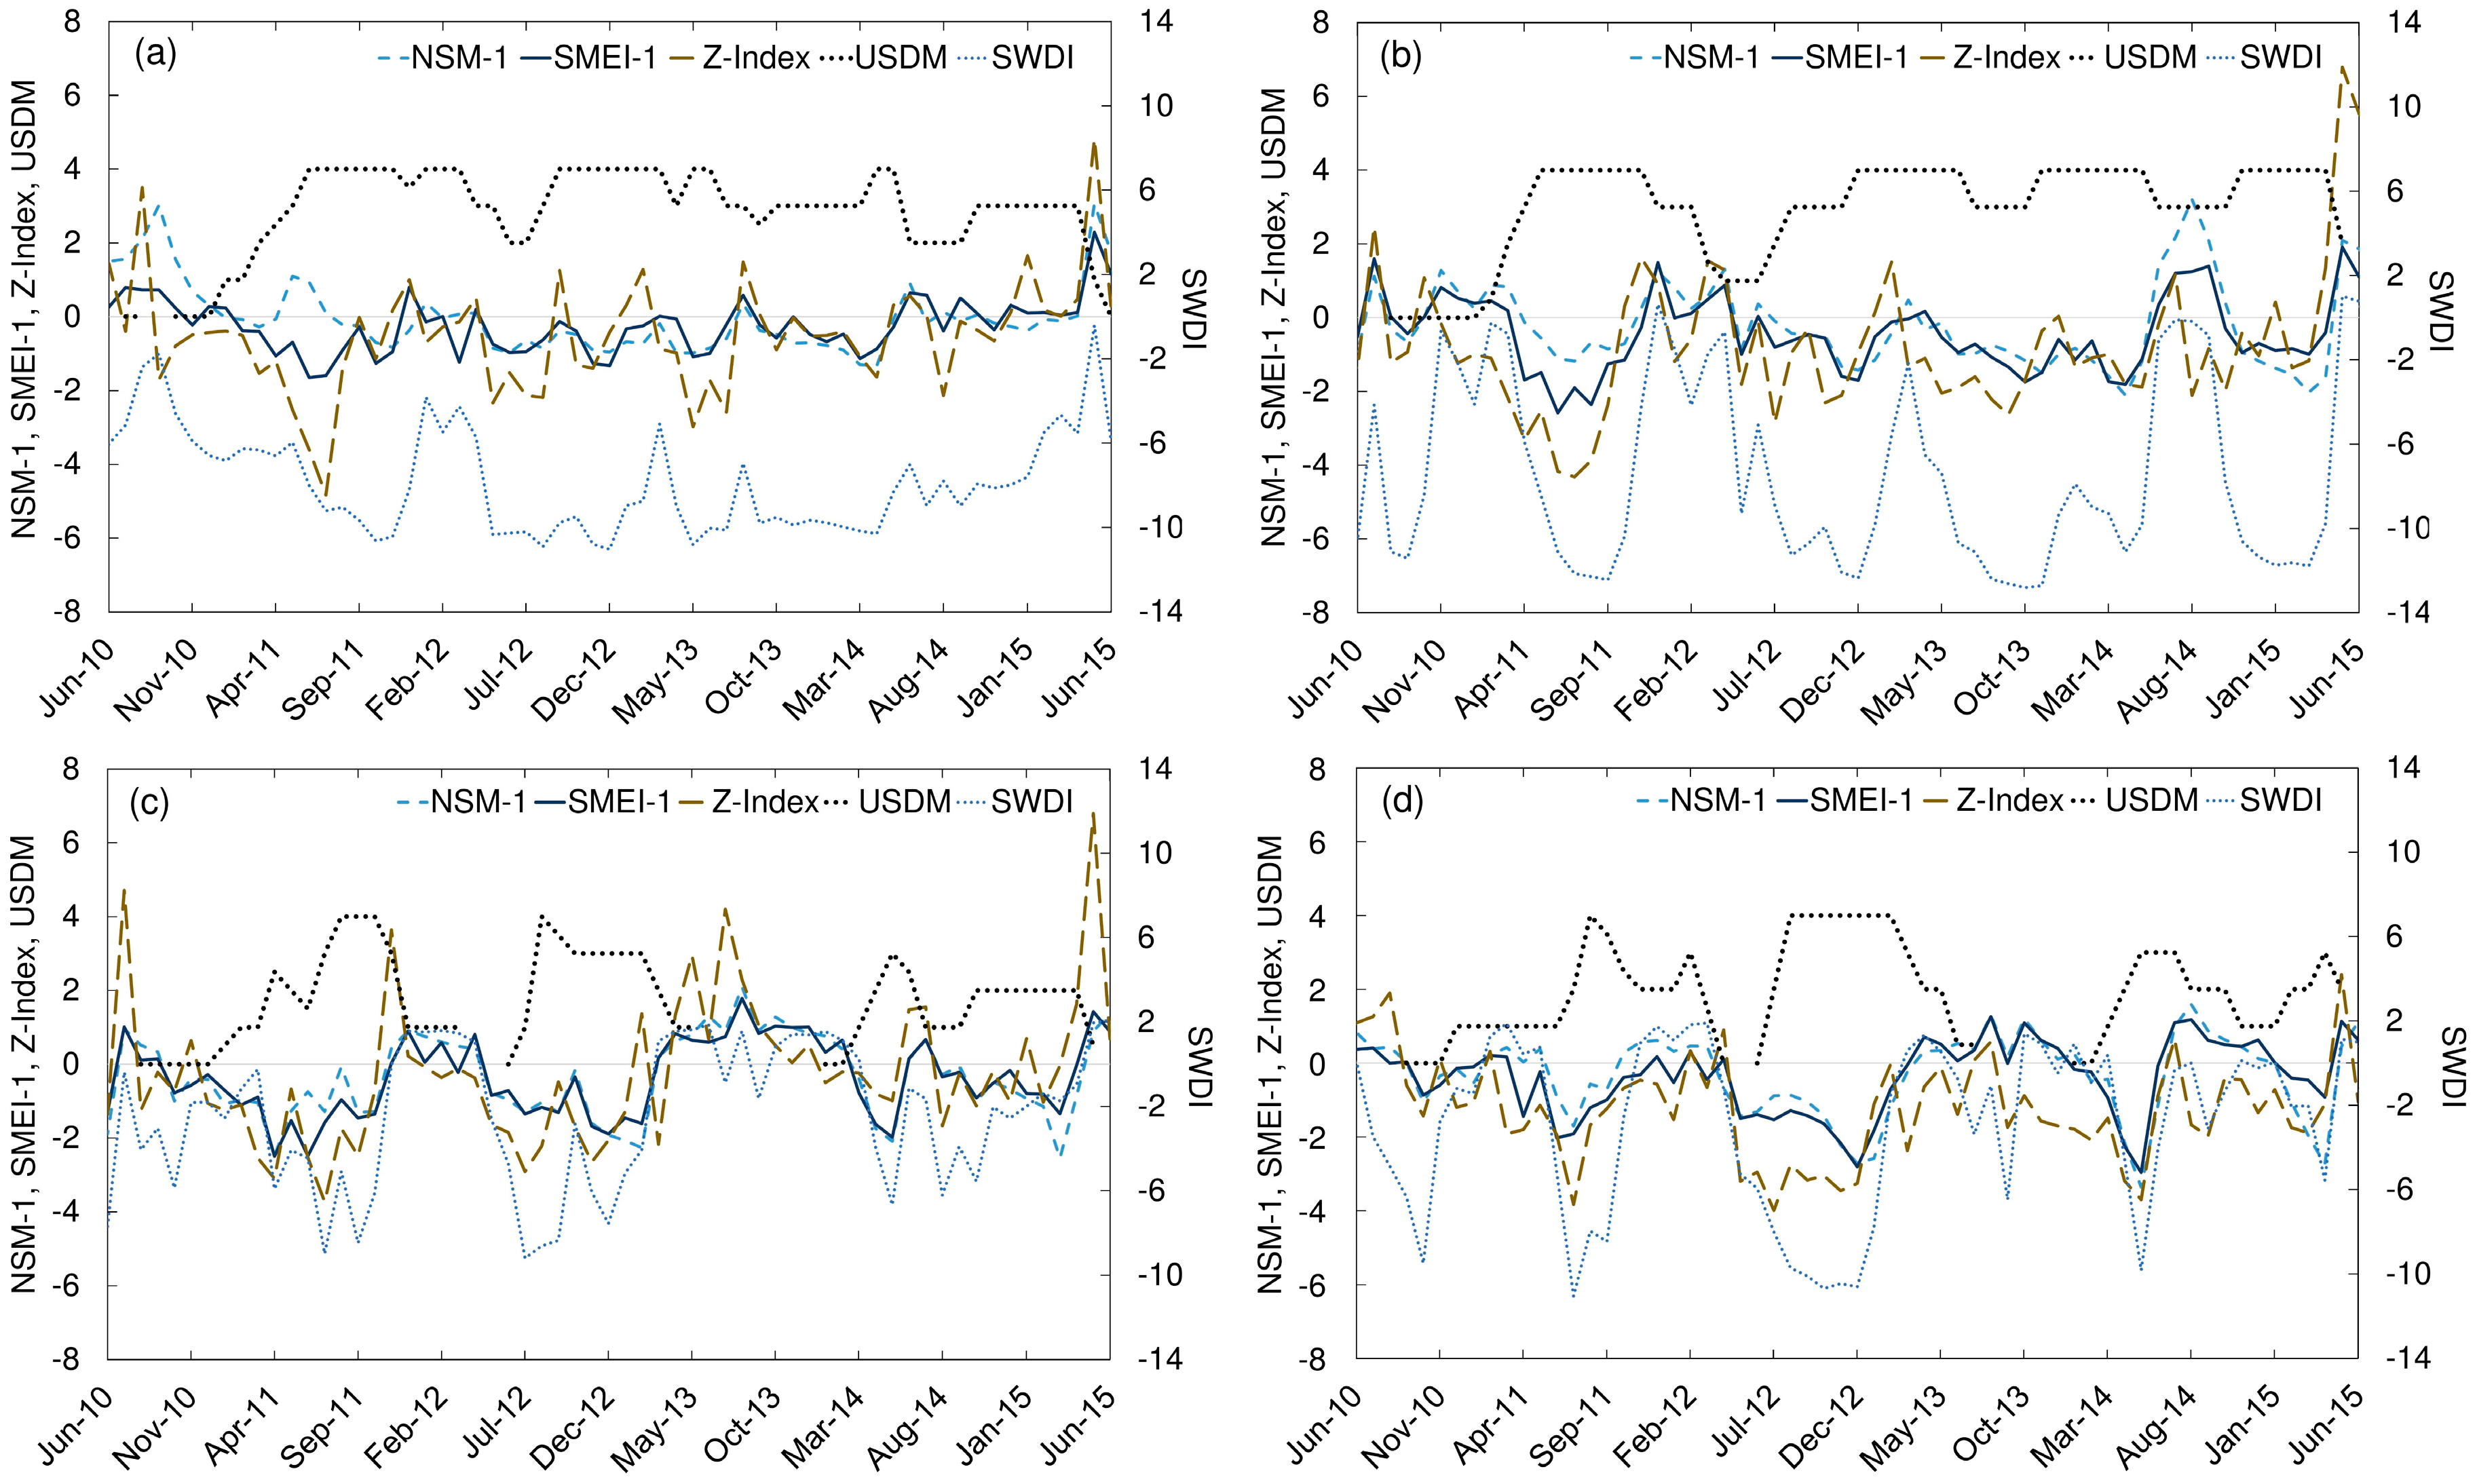
3.3. Temporal Tracking of Drought

Due to the occurrence of multiple droughts of varying magnitudes between 2010 and 2015, this period was selected to further evaluate the performance of newly developed SMEI in tracking temporal variations in drought. Changes in SMEI-1 during the selected period were compared against fluctuations in USDM, two SM drought indices, and one meteorological drought index. The two SM indices were NSM-1 and SWDI. The d index was excluded from the comparison because it had the smallest average r (Figure 4). The single meteorological index used in comparison was the Z-Index, since it incorporates the soil–water balance in its calculations. The USDM timeline was included for comparison with the overall drought conditions. It should be noted that USDM estimates are based on a combination of meteorological drought indices, field observations, and stakeholder feedback [8].
According to USDM, the drought condition gradually started progressing between October 2010 and June 2011 at Goodwell, starting from D0 and reaching at D4 (Figure 5a). The drought continued for almost five years and eventually ended by June 2015. All drought indices showed multiple episodes of severe droughts during this period. The SMEI-1 and the Z-Index compared well with each other, and both indices captured the months of June and July 2011 as the worst drought-stricken months. The Z-Index values had a more rapid fluctuation, mainly due to the sensitivity of this index to unusually dry or wet months [50]. The NSM-1 had a relatively slow response, indicating wet conditions during peak drought months and gradually transforming into drought conditions. This shows the advantage of amplifying drought response by including ET in drought indices [41]. The SWDI trended similar to NSM-1 and signaled decreases in drought magnitude; however, it never confirmed a non-drought period. Almost all indices clearly indicated a significant wet period in May 2015, which marked the end of the drought.
During all major drought episodes at Hollis, El Reno, and Pawnee sites, the SMEI-1 values declined in correspondence with other drought indices (Figure 5b–d). In general, both SMEI-1 and Z-Index had similar trends in tracking drought intensification and reliefs during the 2010–2015 period, whereas NSM-1 and SWDI showed damped response towards short-term variations in drought condition. Since SMEI-1 is based on measured daily soil moisture and ET, its capability to identify the drought is more rigorous in comparison to Z-Index. In addition, SMEI relies on the ASCE Standardized Penman-Monteith method for estimating ETr, while Z-Index uses the less sophisticated but also less accurate Thornthwaite method [65].

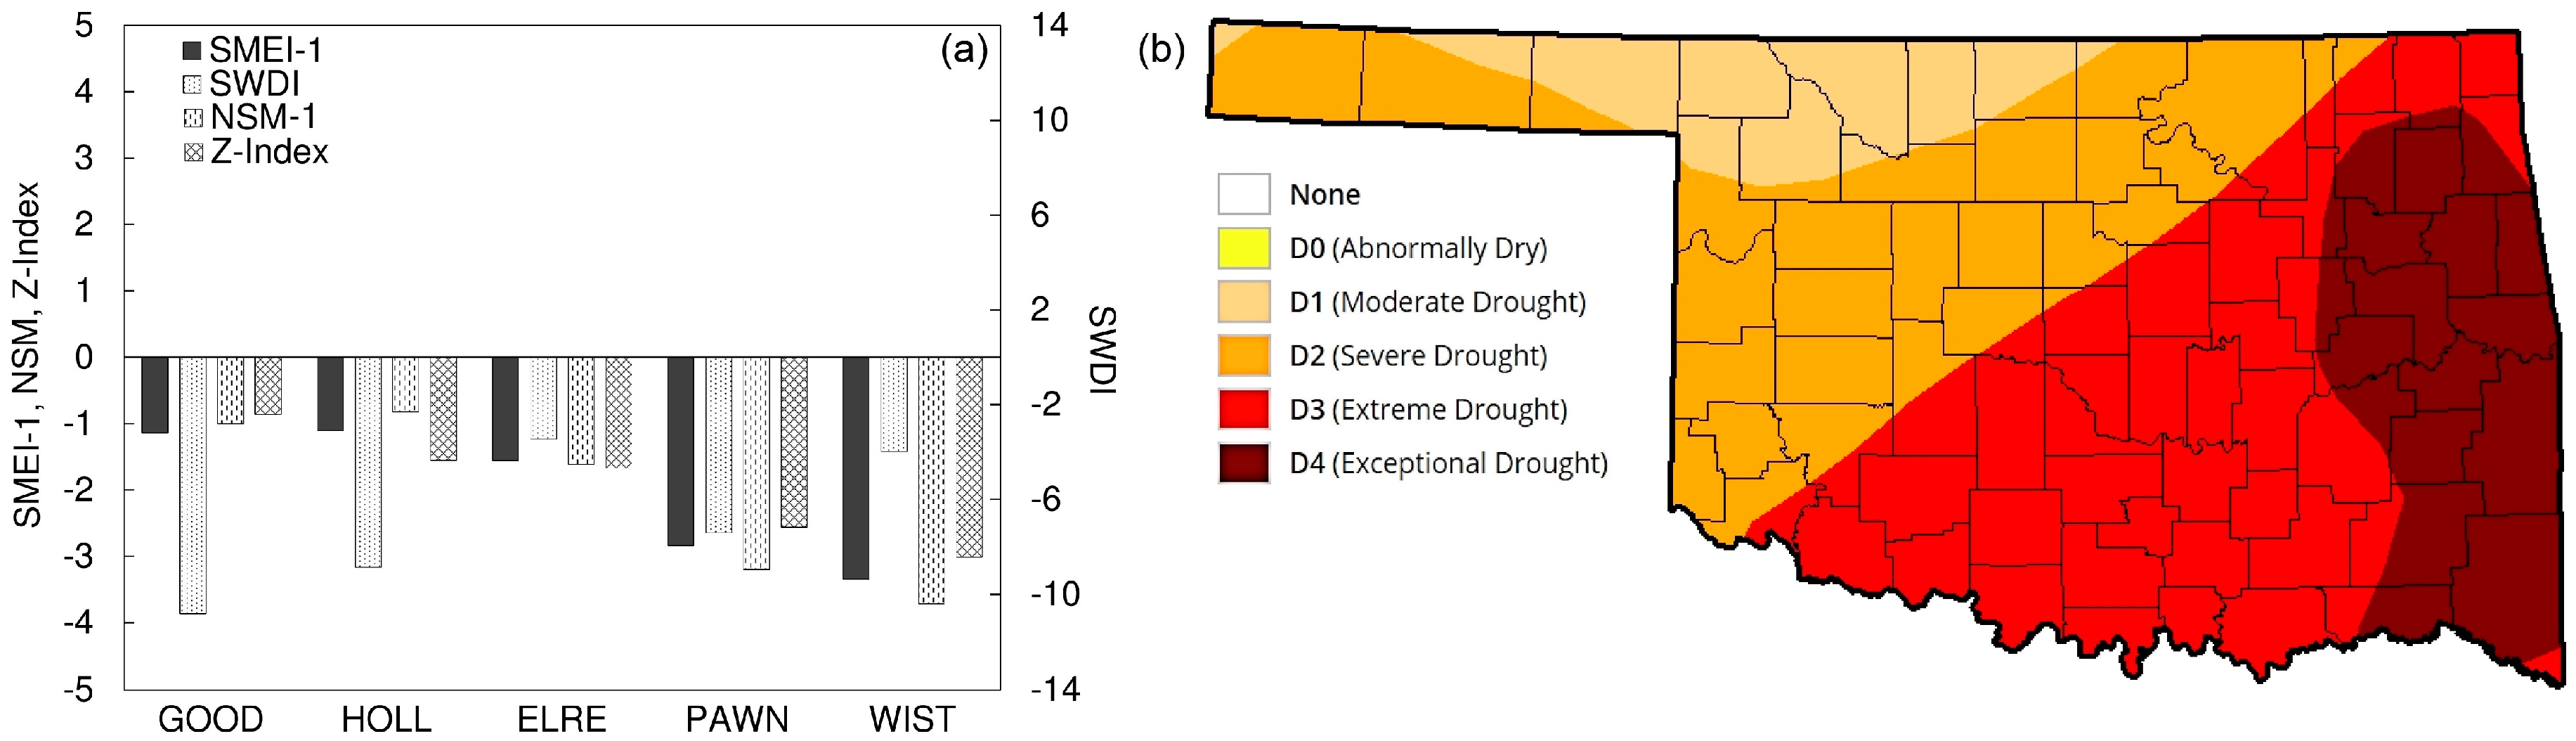
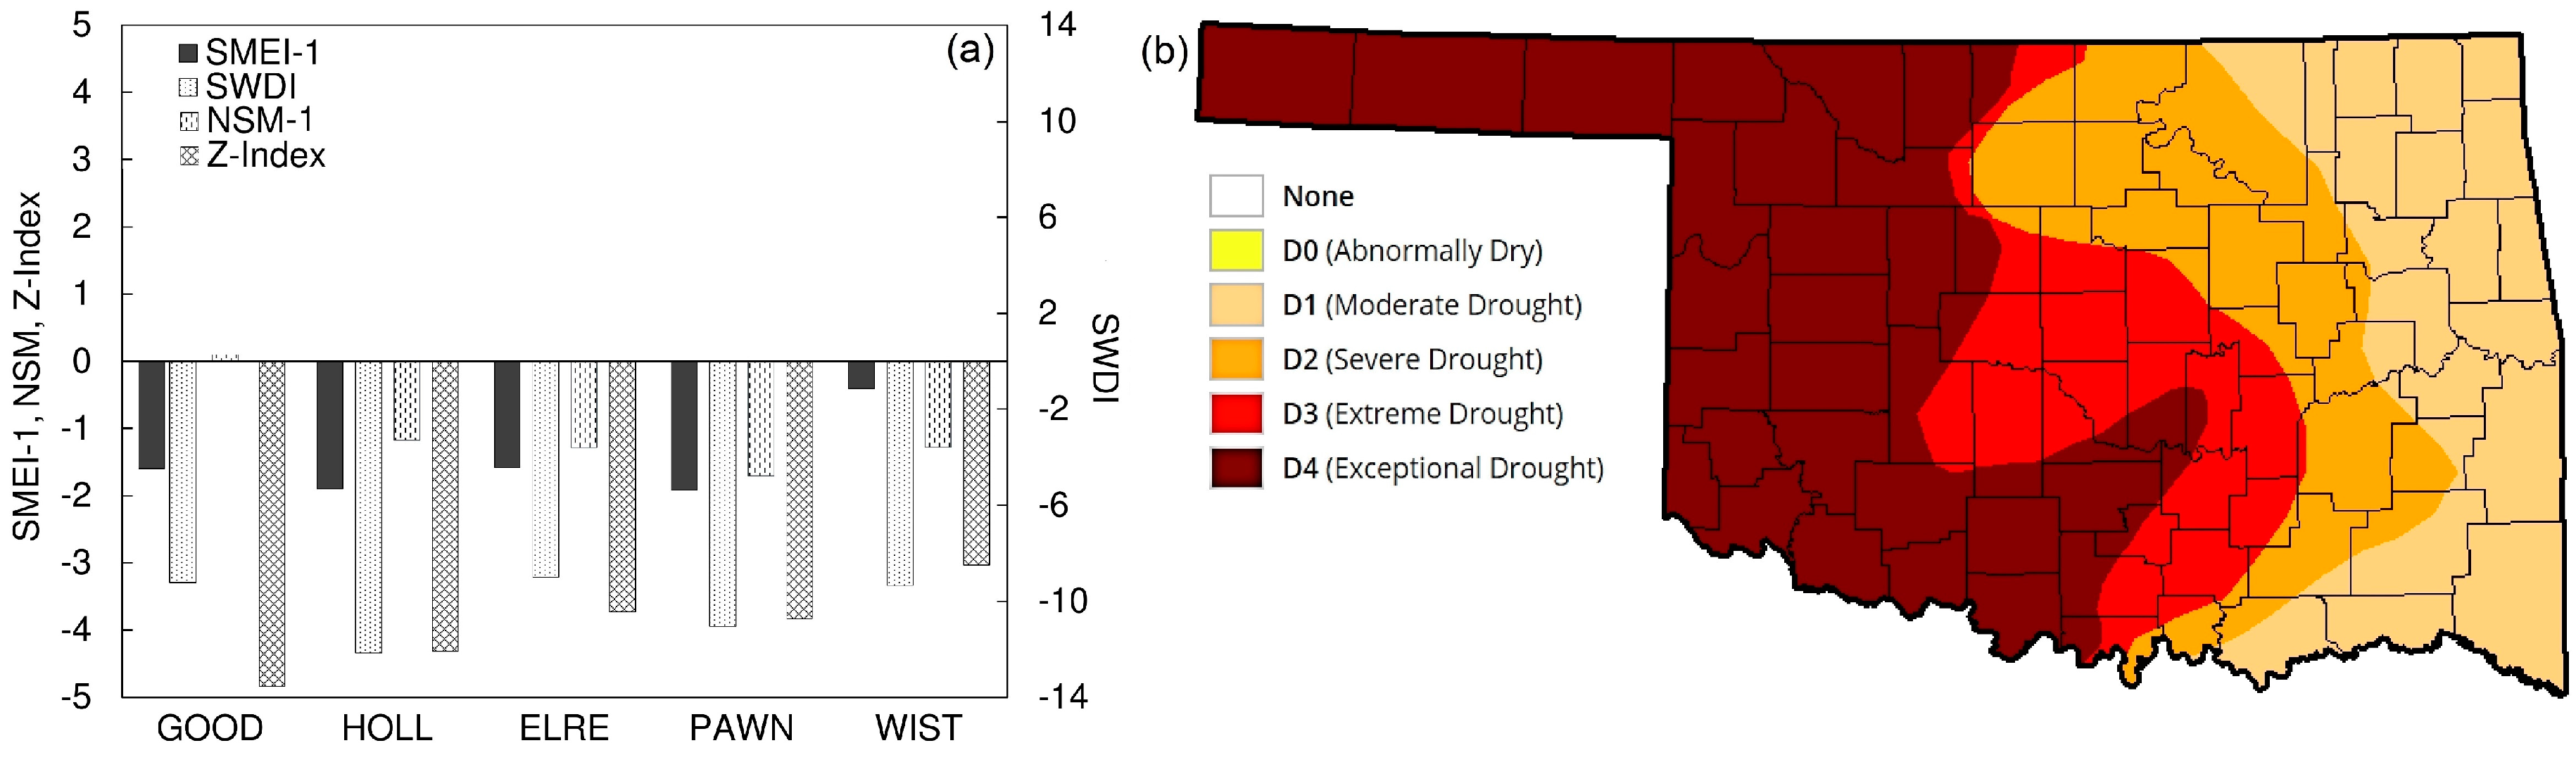
3.4. Spatial Tracking of Drought

Two drought episodes in February 2006 and July 2011 were selected to investigate spatial variability in drought indices. The corresponding USDM maps were used in the analysis. According to Oklahoma Water Resources Board [66], the period of September 2005 to March 2006 was the driest cool growing season in Oklahoma since 1921. The departure from the normal precipitation during this season ranged from −366 mm for the Southeast division (Wister) to −105 mm for the Panhandle region (Goodwell), and the severity of drought gradually reduced from east to west. In February 2006, Wister and Pawnee were under D4 and D3 categories, respectively. The remaining sites were facing D2 category. The spatial variability of SMEI-1 was in agreement with USDM (Figure 6), ranging from −3.34 at Wister to −1.14 at Goodwell. NSM and Z-Index also showed a similar pattern. However, SWDI had a nearly opposite trend, showing an increase in drought severity from east to west. This was most probably because this index is solely based on soil moisture availability in the root zone and does not include other parameters. In addition, it is not normalized based on the past data at each site. Despite having smaller departures of soil moisture from average, the magnitude of soil moisture was smaller in western sites compared to eastern ones due to their natural aridity. Hence, SWDI signaled a more severe drought. Keyantash and Dracup [23] mentioned that indices that are normalized are more appropriate for comparing across locations.
An opposite spatial trend occurred in July 2011, and drought severity gradually decreased from Panhandle and Northwest regions towards the southeast. Based on USDM, Goodwell and Hollis experienced D4, El Reno was near the transition zone between D3 and D4, Pawnee was under D3, and Wister was under D1. The spatial pattern of SMEI-1 was in general compliance with the USDM, with the largest values of −0.41 estimated at Wister (Figure 7). The Z-Index followed a similar trend. However, the Z-Index had a value of −3.0 at Wister, indicating extreme drought conditions [51]. SWDI reflected an intensification of drought moving from Wister to Hollis but a less severe drought for Goodwell. The NSM showed non-drought condition at Goodwell, mainly due to the fact that aggregated soil moisture for July 2011 merely deviated from the long-term mean. Therefore, it was not able to detect the drought.

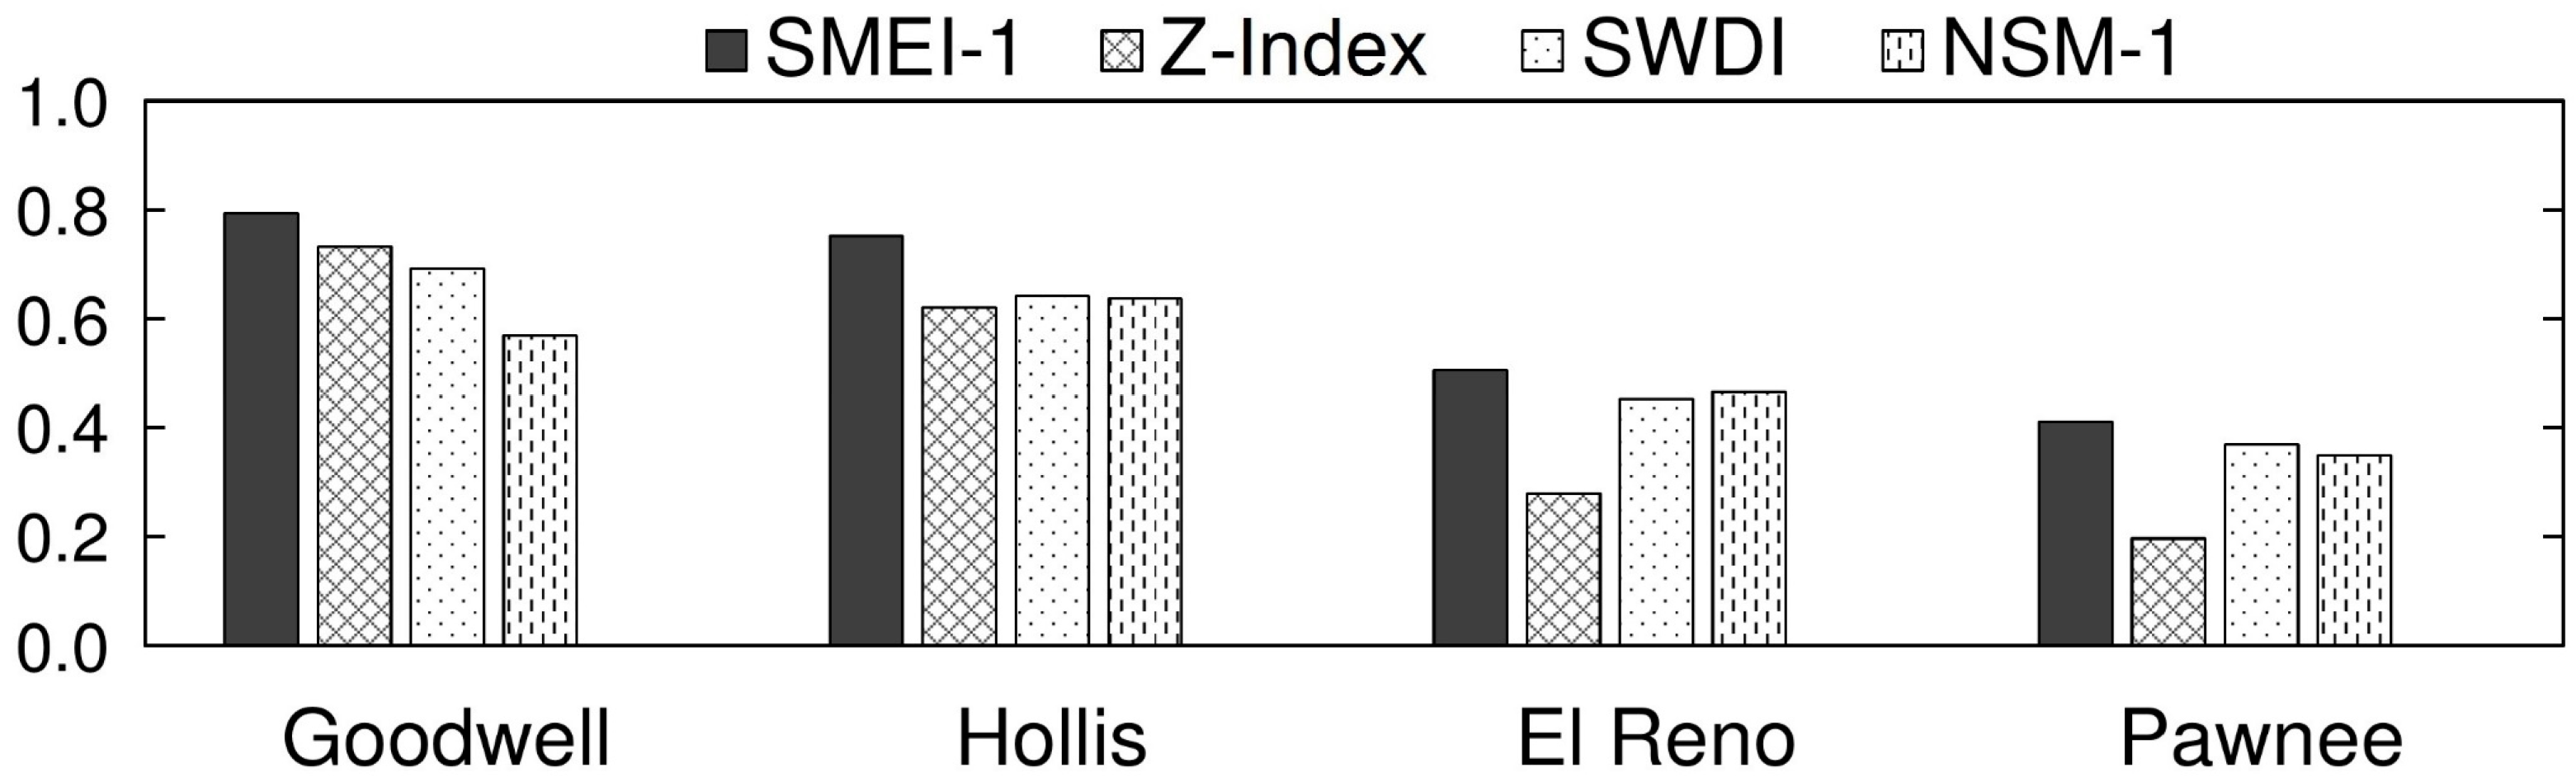
3.5. Comparison with Crop Production

When considering the entire winter wheat growing season, SMEI had the strongest correlations with crop yield in comparison to existing drought indices at all sites (Figure 8). The ranges of r were 0.41–0.79, 0.20–0.73, 0.37–0.69, and 0.35–0.64 for SMEI-1, Z-Index, SWDI, and NSM-1, respectively. These results were in agreement with previous studies. For example, Z-Index had r values as high as 0.65 when compared with the wheat yield in varying climates using modeled data embedded in the 0.5° grid [67]. In addition, Carrão et al. [14] compared the remote sensing-based SM drought index with non-irrigated wheat yield from a humid region in South America for a complete growing season and found an r value of 0.82. Also, a general spatial trend was noted in examining correlation coefficients among drought indices and winter wheat yields, indicating a weakening of the correlation moving from the semi-arid Panhandle to more humid regions (Figure 8). This spatial variation was most probably due to the fact that winter wheat production is more sensitive to drought conditions in water limited environments, as root zone water availability is the major limiting factor for crop growth in rain-fed agriculture [68]. The spatial trend was in accordance with the findings of Tian et al. [34] who compared the winter wheat yield from Texas and Oklahoma with multiple drought indices (including Z-Index) and found stronger correlations (r > 0.5) in the western parts of the study area and weaker correlations towards the east.
Comparatively larger correlations of SMEI-1 showed that the newly developed index is a useful tool for decision makers and growers to monitor drought variability and its effect on the production of winter wheat. However, the winter wheat farmers in Oklahoma would also be interested to know if they possibly could predict the anticipated yield in case of occurrence of droughts in those months that are critical for the crop growth, as they have to make important decisions by the spring period regarding grain production or utilizing the crop for grazing [28]. The correlation analysis conducted between winter wheat production and the spring period’s (March and April) drought indices values showed that the SMEI-1 had the largest correlations (Figure 9). For example, very high correlation was found at Goodwell with an r value of 0.92, whereas high (0.72) to moderate (0.61) correlations were noted for Hollis and El Reno, respectively, and weaker correlations (0.35) were noted for Pawnee. Narasimhan and Srinivasan [17] also analyzed the impact of drought on the winter wheat yield for the same crop growth period in Texas by using SM and ET deficit based indices and found high correlations (r > 0.75). These findings suggest that SMEI-1 could be suitable for predicting winter wheat production in drought-prone areas of Oklahoma.

4. Conclusions

Considering the need for an improved drought monitoring tool for Oklahoma, a new agricultural drought index—the Soil Moisture Evapotranspiration Index (SMEI)—was introduced and evaluated in this study. It was estimated as the normalized difference of monthly root-zone soil moisture and reference evapotranspiration (ETr). The SMEI was estimated along with several existing soil moisture (SM) based and meteorological indices during the 2000–2016 period at five sites across Oklahoma, U.S., with variable climatic conditions. The SMEI had strong correlations with existing SM indices. The correlations between SMEI and meteorological drought indices were 33% stronger on average when compared to existing SM indices. Higher correlation coefficients of SMEI were observed at all study sites, suggesting that SMEI performs well under variable climatic conditions experienced across Oklahoma. The correlation coefficients between existing SM and meteorological indices found in the present study were similar to those reported previously.
The SMEI could capture temporal variations in drought and provided better response to the variation in drought magnitude in Oklahoma when compared to other indices. This can be attributed to the inclusion of ET with soil moisture, which improved the drought sensitivity of the index. In addition, SMEI had a better performance capturing the spatial variations in drought when compared to other indices and the maps developed by the U.S. Drought Monitor.
In general, the correlation of drought indices with the yield of winter wheat gradually reduced when moving from the semi-arid Panhandle to more humid southeast. In comparison to other indices, however, the SMEI had the strongest correlations during the critical wheat growth stages in spring (r > 0.9). These results suggest that SMEI can be used more effectively to demonstrate the progress of agricultural drought under varying climates and its impacts on the crop yields. Farmers could also potentially optimize their decision making for the best use of their crops according to the predicted yield beforehand during the early crop growth stages.
The newly introduced index (SMEI) in this study was calculated using in-situ soil moisture measurements and weather data. Measured soil moisture data may not be available for all places and periods of interest. However, widely available remotely sensed and/or modeled soil moisture data can be used in calculating SMEI if measured data are not available. Future studies must analyze the effectiveness and the sensitivity of SMEI over longer periods and under different climatic conditions than those of this study.

Author Contributions

Conceptualization, A.A. and S.T.; methodology, A.A. and S.T.; formal analysis, A.A. and S.T.; resources, S.T.; data curation, A.A. and S.T.; writing—original draft preparation, A.A. and S.T.; writing—review and editing, A.A., S.T., K.K., P.H.G., and J.E.M.; visualization, A.A. and S.T.; supervision, S.T. and P.H.G.; project administration, S.T.; funding acquisition, S.T.

Funding

This work was supported by a joint research and extension program funded by the Oklahoma Agricultural Experiment Station (Hatch funds) and Oklahoma Cooperative Extension (Smith Lever funds) received from the National Institutes for Food and Agriculture, U.S. Department of Agriculture. Additional support was provided by the Oklahoma Water Resources Center through the U.S. Geological Survey 104(b) grants program.

Acknowledgments

Authors would like to acknowledge Oklahoma Mesonet for the soil moisture and weather datasets. We are thankful to Dr. Tyson Ochsner and Briana Wyatt from the Plant and Soil Science Department, Oklahoma State University, for sharing the Mesonet sites’ soil properties data with us.

Conflicts of Interest

The authors declare no conflict of interest.

References

  1. Taghvaeian, S.; Fox, G.; Boman, R.; Warren, J. Evaluating the impact of drought on surface and groundwater dependent irrigated agriculture in western Oklahoma. In Proceedings of the 2015 ASABE/IA Irrigation Symposium: Emerging Technologies for Sustainable Irrigation, Long Beach, CA, USA, 10–12 November 2015; ASABE: St. Jospeh, MI, USA, 2015; pp. 1–8. [Google Scholar]
  2. Khand, K.; Taghvaeian, S.; Ajaz, A. Drought and Its Impact on Agricultural Water Resources in Oklahoma. Oklahoma Coop Ext Ser.; Oklahoma State University: Stillwater, OK, USA, 2017; Available online: http://pods.dasnr.okstate.edu/docushare/dsweb/Get/Document-10705/BAE-1533web.pdf (accessed on 5 January 2018).
  3. Reilly, J.; Tubiello, F.; McCarl, B.; Abler, D.; Darwin, R.; Fuglie, K.; Mearns, L. U.S. agriculture and climate change: New results. Clim. Change 2003, 57, 43–67. [Google Scholar] [CrossRef]
  4. Rosenzweig, C.; Hillel, D. The Dust Bowl of the 1930s: Analog of greenhouse effect in the Great Plains? J. Environ. Qual. 1993, 22, 9–22. [Google Scholar] [CrossRef]
  5. Mishra, A.K.; Singh, V.P. A review of drought concepts. J. Hydrol. 2010, 391, 202–216. [Google Scholar] [CrossRef]
  6. Hayes, M.; Svoboda, M.; Wall, N.; Widhalm, M. The lincoln declaration on drought indices: Universal meteorological drought index recommended. Bull. Am. Meteorol. Soc. 2011, 92, 485–488. [Google Scholar] [CrossRef]
  7. Moorhead, J.E.; Marek, G.W.; Gowda, P.H.; Marek, T.H.; Porter, D.O.; Singh, V.P.; Brauer, D.K. Exceedance probability of the standardized precipitation-evapotranspiration index in the Texas High Plains. Agric. Sci. 2017, 8, 783–800. [Google Scholar] [CrossRef]
  8. Zargar, A.; Sadiq, R.; Naser, B.; Khan, F.I. A review of drought indices. Environ. Rev. 2011, 19, 333–349. [Google Scholar] [CrossRef]
  9. Wang, A.; Lettenmaier, D.P.; Sheffield, J. Soil moisture drought in China, 1950–2006. J. Clim. 2011, 24, 3257–3271. [Google Scholar] [CrossRef]
  10. Mannocchi, F.; Todisco, F.; Vergni, L. Agricultural Drought: Indices, Definition and Analysis. Basis Civ. Water Sci. 2004, 286, 246–254. Available online: http://hydrologie.org/redbooks/a286/iahs_286_0246.pdf (accessed on 12 September 2018).
  11. Martínez-Fernández, J.; González-Zamora, A.; Sánchez, N.; Gumuzzio, A. A soil water based index as a suitable agricultural drought indicator. J. Hydrol. 2015, 522, 265–273. [Google Scholar] [CrossRef]
  12. Sridhar, V.; Hubbard, K.G.; You, J.; Hunt, E. Development of the soil moisture index to quantify agricultural drought and its “user friendliness” in severity-area-duration assessment. J. Hydrometeorol. 2007, 9, 660–676. [Google Scholar] [CrossRef]
  13. Hunt, E.D.; Hubbard, K.G.; Wilhite, D.A.; Arkebauer, T.J.; Dutcher, A.L. The development and evaluation of a soil moisture index. Int. J. Climatol. 2008, 29, 747–759. [Google Scholar] [CrossRef]
  14. Carrão, H.; Russo, S.; Sepulcre-canto, G.; Barbosa, P. An empirical standardized soil moisture index for agricultural drought assessment from remotely sensed data. Int. J. Appl. Earth Obs. Geoinf. 2016, 48, 74–84. [Google Scholar] [CrossRef]
  15. Li, Z.; Hao, Z.; Shi, X.; Déry, S.J.; Li, J.; Chen, S.; Li, Y. An agricultural drought index to incorporate the irrigation process and reservoir operations: A case study in the Tarim River Basin. Glob. Planet. Change 2016, 143, 10–20. [Google Scholar] [CrossRef]
  16. Dutra, E.; Viterbo, P.; Miranda, P.M.A. ERA-40 reanalysis hydrological applications in the characterization of regional drought. Geophys. Res. Lett. 2008, 35, 2–6. [Google Scholar] [CrossRef]
  17. Narasimhan, B.; Srinivasan, R. Development and evaluation of Soil Moisture Deficit Index (SMDI) and Evapotranspiration Deficit Index (ETDI) for agricultural drought monitoring. Agric. For. Meteorol. 2005, 133, 69–88. [Google Scholar] [CrossRef]
  18. Torres, G.M.; Lollato, R.P.; Ochsner, T.E. Comparison of drought probability assessments based on atmospheric water deficit and soil water deficit. Agron. J. 2013, 105, 428–436. [Google Scholar] [CrossRef]
  19. Cammalleri, C.; Micale, F.; Vogt, J. A novel soil moisture-based drought severity index (DSI) combining water deficit magnitude and frequency. Hydrol. Process. 2016, 30, 289–301. [Google Scholar] [CrossRef]
  20. Sohrabi, M.M.; Ryu, J.H.; Abatzoglou, J.; Tracy, J. Development of soil moisture drought index to characterize droughts. J. Hydrol. Eng. 2015, 20, 04015025. [Google Scholar] [CrossRef]
  21. Woli, P.; Jones, J.W.; Ingram, K.T.; Fraisse, C.W. Agricultural reference index for drought (ARID). Agron. J. 2012, 104, 287–300. [Google Scholar] [CrossRef]
  22. Palmer, W.C. Meteorological Drought. US Weather Bur. Res. Pap. 1965, 58, 45. Available online: https://www.ncdc.noaa.gov/temp-and-precip/drought/docs/palmer.pdf (accessed on 3 June 2018).
  23. Keyantash, J.; Dracup, J.A. The quantification of drought: An evaluation of drought indices. Bull. Am. Meteorol. Soc. 2002, 83, 1167–1180. [Google Scholar] [CrossRef]
  24. WMO (World Meteorological Organization); GWP (Global Water Partnership). Handbook of Drought Indicators and Indices. 2016. Available online: http://www.droughtmanagement.info/literature/GWP_Handbook_of_Drought_Indicators_and_Indices_2016.pdf (accessed on 14 January 2019).
  25. Woli, P.; Jones, J.W.; Ingram, K.T. Assessing the Agricultural Reference Index for Drought (ARID) using uncertainty and sensitivity analyses. Agron. J. 2013, 105, 150. [Google Scholar] [CrossRef]
  26. Mladenova, I.E.; Bolten, J.D.; Crow, W.T.; Anderson, M.C.; Hain, C.R.; Johnson, D.M.; Mueller, R. Intercomparison of soil moisture, evaporative stress, and vegetation indices for estimating corn and soybean yields over the U.S. IEEE J. Sel. Top. Appl. Earth Obs. Remote Sens. 2017, 10, 1328–1343. [Google Scholar] [CrossRef]
  27. Arndt, D.S. The Oklahoma Drought of 2001–2002 (Oklahoma Event Summary); Oklahoma Climatol Survey: Oklahoma City, OK, USA, 2002. Available online: http://xocs.mesonet.org/summaries/event/Drought_of_2001-2002.pdf (accessed on 2 November 2018).
  28. Doye, D.; Sahs, R. Wheat Grazeout Versus Harvest for Grain. Oklahoma Coop Ext Serv.; Oklahome State Universty: Stillwater, OK, USA, 2018; AFEC-241:1–4; Available online: http://pods.dasnr.okstate.edu/docushare/dsweb/Get/Rendition-17868/ (accessed on 17 January 2019).
  29. McPherson, R.A.; Fiebrich, C.A.; Crawford, K.C.; Elliott, R.L.; Kilby, J.R.; Grimsley, D.L.; Martinez, J.E.; Melvin, A.D. Statewide monitoring of the mesoscale environment: A technical update on the Oklahoma Mesonet. J. Atmos. Ocean. Technol. 2007, 24, 301–321. [Google Scholar] [CrossRef]
  30. Brock, F.V.; Crawford, K.C. The Oklahoma Mesonet: A technical overview. J. Atmos. Ocean. Technol. 1995, 12, 5–19. [Google Scholar] [CrossRef]
  31. Illston, B.G.; Basara, J.B.; Fiebrich, C.A.; Crawford, K.C.; Hunt, E.; Fisher, D.K.; Humes, K. Mesoscale monitoring of soil moisture across a statewide network. J. Atmos. Ocean. Technol. 2008, 25, 167–182. [Google Scholar] [CrossRef]
  32. Van Genuchten, M.T. A closed-form equation for predicting the hydraulic conductivity of unsaturated soils. Soil Sci. Soc. Am. J. 1980, 8, 892–898. [Google Scholar] [CrossRef]
  33. Scott, B.L.; Ochsner, T.E.; Illston, B.G.; Basara, J.B.; Sutherland, A.J. New soil property database improves Oklahoma Mesonet soil moisture estimates. J. Atmos. Ocean. Technol. 2013, 30, 2585–2595. [Google Scholar] [CrossRef]
  34. Tian, L.; Yuan, S.; Quiring, S.M. Evaluation of six indices for monitoring agricultural drought in the south- central United States. Agric. For. Meteorol. 2018, 249, 107–119. [Google Scholar] [CrossRef]
  35. Jones, P.D.; Hulme, M. Calculating regional climatic time series for temperature and precipitation: Methods and illustrations. Int. J. Climatol. 1996, 16, 361–377. [Google Scholar] [CrossRef]
  36. Miller, G.R.; Baldocchi, D.D.; Law, B.E.; Meyers, T. An analysis of soil moisture dynamics using multi-year data from a network of micrometeorological observation sites. Adv. Water Resour. 2007, 30, 1065–1081. [Google Scholar] [CrossRef] [Green Version]
  37. Ochsner, T.E.; Cosh, M.H.; Cuenca, R.H.; Dorigo, W.A.; Draper, C.S.; Hagimoto, Y.; Larson, K.M. State of the art in large-scale soil moisture monitoring. Soil Sci. Soc. Am. J. 2013, 77, 1888. [Google Scholar] [CrossRef]
  38. Allen, R.G.; Walter, I.A.; Elliott, R.; Howell, T.; Itenfisu, D.; Jensen, M. The ASCE Standardized Reference Evapotranspiration Equation. 2005. Available online: https://www.kimberly.uidaho.edu/water/asceewri/ascestzdetmain2005.pdf (accessed on 11 February 2018).
  39. Allen, R.G. REF-ET: Reference Evapotranspiration Calculator, Version 4.1; Idaho Idaho University: Moscow, ID, USA, 2015; Available online: https://www.uidaho.edu/cals/kimberly-research-and-extension-center/research/water-resources/ref-et-software (accessed on 11 February 2018).
  40. Tigkas, D.; Vangelis, H.; Tsakiris, G. Drought characterisation based on an agriculture-oriented standardised precipitation index. Theor. Appl. Climatol. 2018, 135, 1–13. [Google Scholar] [CrossRef]
  41. Tsakiris, G.; Vangelis, H. Establishing a drought index incorporating evapotranspiration. Eur. Water 2005, 9, 3–11. [Google Scholar]
  42. Anderson, M.C.; Hain, C.; Wardlow, B.; Pimstein, A.; Mecikalski, J.R.; Kustas, W.P. Evaluation of drought indices based on thermal remote sensing of evapotranspiration over the continental United States. J. Clim. 2011, 24, 2025–2044. [Google Scholar] [CrossRef]
  43. Mckee, T.B.; Doesken, N.J.; Kleist, J. The Relationship of Drought Frequency and Duration to Time Scales. In Proceedings of the AMS 8th Conference on Applied Climatology, Anaheim, CA, USA, 17–22 January 1993; pp. 179–184. Available online: http://www.droughtmanagement.info/literature/AMS_Relationship_Drought_Frequency_Duration_Time_Scales_1993.pdf (accessed on 22 March 2018).
  44. Rhee, J.; Im, J.; Carbone, G.J. Monitoring agricultural drought for arid and humid regions using multi-sensor remote sensing data. Remote Sens. Environ. 2010, 114, 2875–2887. [Google Scholar] [CrossRef]
  45. Paul, J.D.; Buytaert, W. Citizen science and low-cost sensors for integrated water resources management. In Advanced Tools for Integrated Water Resources Management, 1st ed.; Friesen, J., Rodríguez-Sinobas, L., Eds.; Academic Press: London, UK, 2018; p. 8. Available online: https://www.elsevier.com/books/advanced-tools-for-integrated-water-resources-management/friesen/978-0-12-814299-8 (accessed on 7 January 2019).
  46. Ahmadalipour, A.; Moradkhani, H.; Yan, H.; Zarekarizi, M. Remote sensing of drought: Vegetation, soil moisture, and data assimilation. In Remote Sensing of Hydrological Extremes; Lakshmi, V., Ed.; Springer International Publishing: Berlin, Germany, 2017; pp. 121–149. [Google Scholar]
  47. Daly, C.; Neilson, R.P.; Phillips, D.L. A statistical-topographic model for mapping climatological precipitation over mountainous terrain. J. Clim. 1994, 33, 140–158. [Google Scholar] [CrossRef]
  48. Schneider, J.M.; Ford, D.L. An independent assessment of the monthly prism gridded precipitation product in central Oklahoma. Atmos. Clim. Sci. 2013, 3, 249. [Google Scholar] [CrossRef]
  49. Sehgal, V.; Sridhar, V.; Tyagi, A. Stratified drought analysis using a stochastic ensemble of simulated and in-situ soil moisture observations. J. Hydrol. 2017, 545, 226–250. [Google Scholar] [CrossRef] [Green Version]
  50. Wells, N.; Goddard, S.; Hayes, M.J. A self-calibrating Palmer Drought Severity Index. J. Clim. 2004, 17, 2335–2351. [Google Scholar] [CrossRef]
  51. Karl, T.R. The sensitivity of the Palmer Drought Severity Index and Palmer’s Z-Index to their calibration coefficients including potential evapotranspiration. J. Clim. Appl. Meteorol. 1986, 25, 77–86. [Google Scholar] [CrossRef]
  52. Vicente-Serrano, S.M.; Beguería, S.; López-Moreno, J.I. A multiscalar drought index sensitive to global warming: The standardized precipitation evapotranspiration index. J. Clim. 2010, 23, 1696–1718. [Google Scholar] [CrossRef]
  53. Beguería, S.; Vicente-Serrano, S.M. SPEI Calculator. 2009. Available online: http://hdl.handle.net/10261/10002 (accessed on 11 February 2018).
  54. Zhao, W.; Khalil, M.A.K. The relationship between precipitation and temperature over the contiguous United States. J. Clim. 1993, 6, 1232–1236. [Google Scholar] [CrossRef]
  55. Mavromatis, T. Use of drought indices in climate change impact assessment studies: An application to Greece. Int. J. Climatol. 2010, 30, 1336–1348. [Google Scholar] [CrossRef]
  56. Marburger, D. Wheat, Department of Plant and Soil Sciences. 2018. Available online: http://wheat.okstate.edu/ (accessed on 19 October 2018).
  57. Zhang, N.; Zhao, C.; Quiring, S.M.; Li, J. Winter wheat yield prediction using normalized difference vegetative index and agro-climatic parameters in oklahoma. Agron. J. 2017, 109, 2700–2713. [Google Scholar] [CrossRef]
  58. Hane, D.C.; Pumphrey, F.V.; Floyd, V. Crop Water Use Curves for Irrigation Scheduling. 1984. Available online: http://ir.library.oregonstate.edu/xmlui/handle/1957/4991 (accessed on 7 January 2018).
  59. Xu, X.; Gao, P.; Zhu, X.; Guo, W.; Ding, J.; Li, C. Estimating the responses of winter wheat yields to moisture variations in the past 35 years in Jiangsu Province of China. PLoS ONE 2018, 13, e0191217. [Google Scholar] [CrossRef]
  60. Quiring, S.M.; Papakryiakou, T.N. An evaluation of agricultural drought indices for the Canadian prairies. Agric. For. Meteorol. 2003, 18, 49–62. [Google Scholar] [CrossRef]
  61. Moorhead, J.E.; Gowda, P.H.; Singh, V.P.; Porter, D.O.; Marek, T.H.; Howell, T.A.; Stewart, B.A. Identifying and evaluating a suitable index for agricultural drought monitoring in the Texas High Plains. J. Am. Water Resour. Assoc. 2015, 51, 807–820. [Google Scholar] [CrossRef]
  62. Mishra, A.; Vu, T.; ValiyaVeettil, A.; Entekhabi, D. Drought monitoring with Soil Moisture Active Passive (SMAP) Measurements. J. Hydrol. 2017, 552, 620–632. [Google Scholar] [CrossRef]
  63. Van der Schrier, G.; Jones, P.D.; Briffa, K.R. The sensitivity of the PDSI to the Thornthwaite and Penman-Monteith parameterizations for potential evapotranspiration. J. Geophys. Res. Atmos. 2011, 116, 1–16. [Google Scholar] [CrossRef]
  64. Beguería, S.; Vicente-Serrano, S.M.; Reig, F.; Latorre, B. Standardized precipitation evapotranspiration index (SPEI) revisited: Parameter fitting, evapotranspiration models, tools, datasets and drought monitoring. Int. J. Climatol. 2014, 34, 3001–3023. [Google Scholar] [CrossRef]
  65. Chen, D.; Gao, G.; Xu, C.Y.; Guo, J.; Ren, G. Comparison of the Thornthwaite method and pan data with the standard Penman-Monteith estimates of reference evapotranspiration in China. Clim. Res. 2005, 28, 123–132. [Google Scholar] [CrossRef]
  66. Oklahoma Water Resources Board. Oklahoma Water Resources Bulletin & Summary of Current Conditions. 2006. Available online: https://www.owrb.ok.gov/supply/drought/pdf_dro/2006/195_0315_2006.pdf (accessed on 9 March 2018).
  67. Vicente-Serrano, S.M.; Beguería, S.; Lorenzo-Lacruz, J.; Camarero, J.J.; López-Moreno, J.I.; Azorin-Molina, C.; Sanchez-Lorenzo, A. Performance of drought indices for ecological, agricultural, and hydrological applications. Earth Interact. 2012, 16, 1–27. [Google Scholar] [CrossRef]
  68. Aggarwal, P.K. Determinants of Crop Growth and Yield in a Changing Climate. In Rainfed Agriculture: Unlocking the Potential; Wani, S.P., Johan Rockström, T.O., Eds.; CABI: Wallingford, UK, 2009; Available online: http://www.iwmi.cgiar.org/Publications/CABI_Publications/CA_CABI_Series/Rainfed_Agriculture/Protected/Rainfed_Agriculture_Unlocking_the_Potential.pdf (accessed on 17 May 2018).
Figure 1. Normal annual precipitation in Oklahoma (1981–2010). Source: PRISM raster map. The locations of study sites and major rivers are also demonstrated.
Water 11 01375 g001
Figure 2. Radar plots of correlation coefficients for new and existing soil moisture-based indices.
Water 11 01375 g002
Figure 3. Correlation coefficients among soil moisture based and meteorological drought indices at Goodwell (a); Hollis (b); El Reno (c); Pawnee (d); and Wister (e).
Water 11 01375 g003
Figure 4. Box and whisker plots of correlation coefficients between SM and meteorological indices at all sites. Whiskers indicate the full range of estimated coefficients and crosses represent the mean.
Water 11 01375 g004
Figure 5. Time series of drought indices at Goodwell (a); Hollis (b); El Reno (c); and Pawnee (d).
Water 11 01375 g005
Figure 6. Magnitudes of selected drought indices for February 2006 at study sites (a) and the corresponding U.S. Drought Monitor (USDM) map (b).
Water 11 01375 g006
Figure 7. Magnitudes of selected drought indices for July 2011 at five individual study sites (a) and the corresponding USDM map (b).
Water 11 01375 g007
Figure 8. Correlation coefficients of existing indices and Soil Moisture Evapotranspiration Index (SMEI) with winter wheat production during the growing season at Goodwell (a), Hollis (b), El Reno (c), and Pawnee (d).
Water 11 01375 g008
Figure 9. Correlation coefficients of existing indices and SMEI with winter wheat production during the spring period (months of March and April) at Goodwell (a), Hollis (b), El Reno (c), and Pawnee (d).
Water 11 01375 g009
Table 1. Annual average daily air temperature, total precipitation, and total reference evapotranspiration (ETr) measured at each study site over the study period (2000–2016).
SITEAbbreviationRegionTemperature (°C)Precipitation (mm)ETr (mm)
GoodwellGOODPanhandle13.424352675
HollisHOLLSouthwest16.326602355
El RenoELRECentral15.668711997
PawneePAWNNortheast15.4410101871
WisterWISTSoutheast16.4212521542
Table 2. Soil texture and volumetric water content (VWC) (m3 m−3) at field capacity (FC) and wilting point (WP) thresholds for the three sensor installation depths of 5, 25, and 60 cm at each study site.
SITETextureVWC at FC
(m3 m−3)
VWC at WP
(m3 m−3)
5 cm25 cm60 cm5256052560
GOODClay loamClay loamClay loam0.250.290.210.130.170.14
HOLLClayClayClay0.330.350.350.210.250.25
ELRESilty loamSilty clay loamSilty clay0.410.290.330.110.120.21
PAWNSilty clay loamSilty clayClay0.390.430.420.230.270.27
WISTSilty loamSilty clay loamClay0.320.270.420.120.130.28

