Study on Pipe Burst Detection Frame Based on Water Distribution Model and Monitoring System

Abstract
1. Introduction
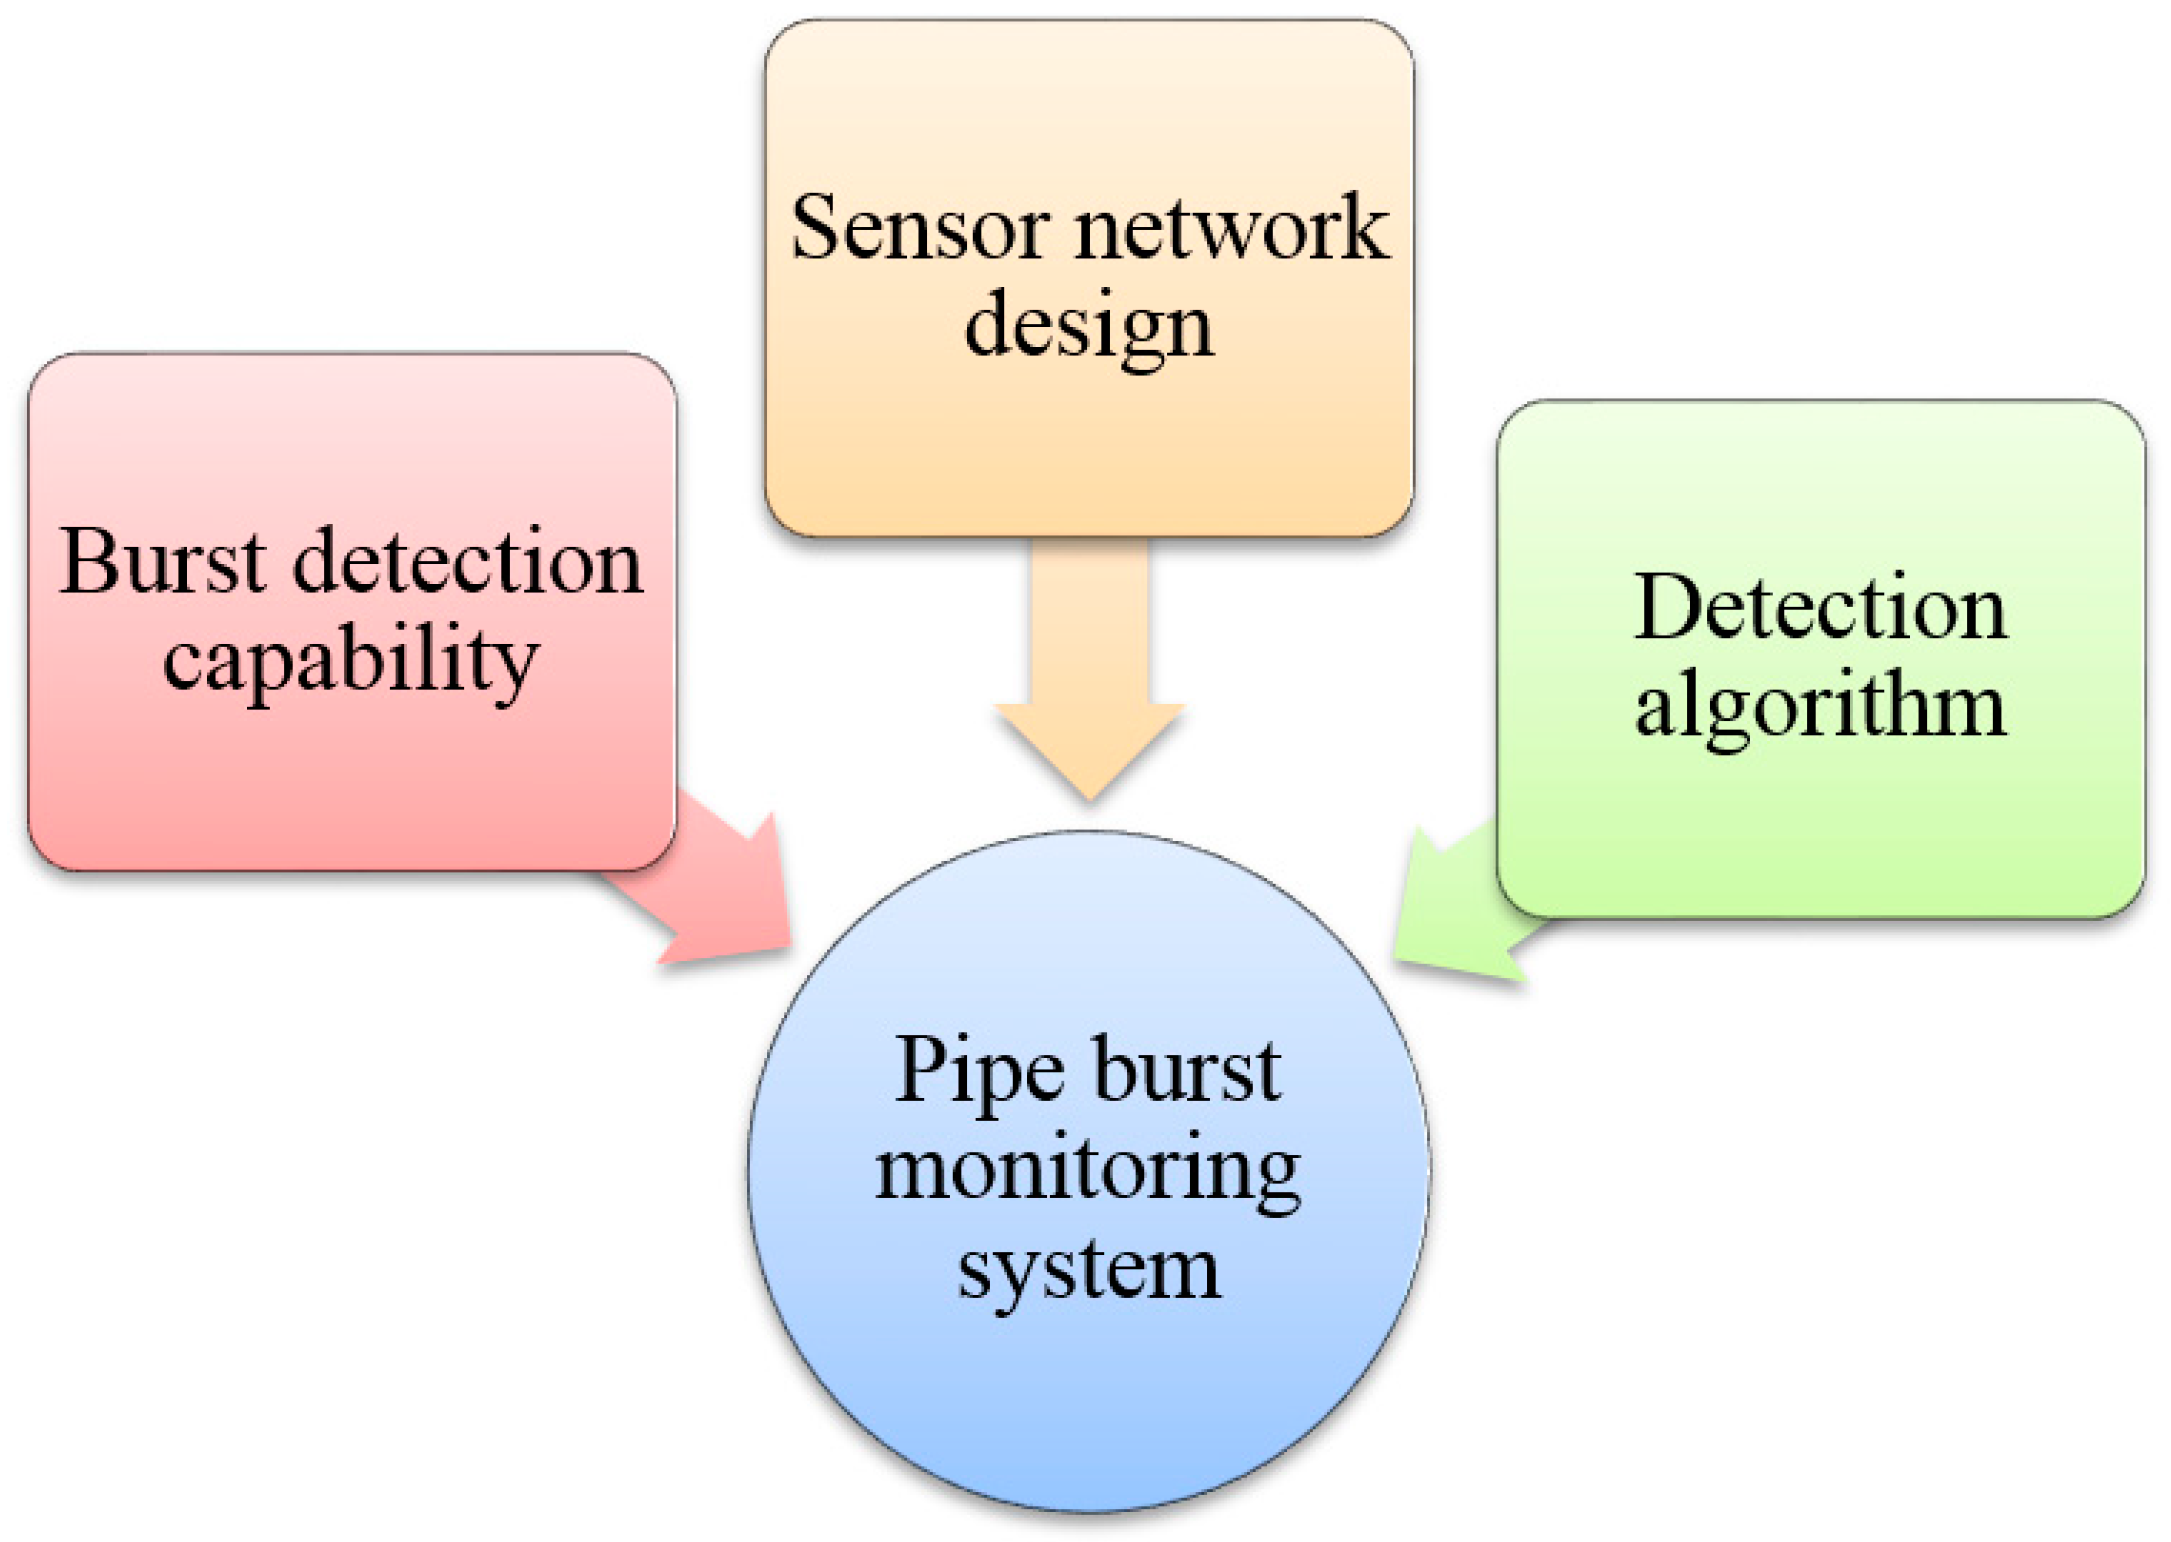
2. Framework of the Burst Detection System
- (1)
- Burst detection capability: What is the minimum burst that the monitoring system can detect? For example, a burst in a 1200 mm diameter pipe may easily be detected whereas a burst in a 50 mm diameter pipe may be undetected. Specifically, what pipe diameter is the minimum for burst events to be detectable?
- (2)
- Sensor network design: How many pressure sensors and flow meters are needed, and where should they be installed?
- (3)
- Detection algorithm: How do we analyze the monitoring data and determine the probability that a burst event has occurred?
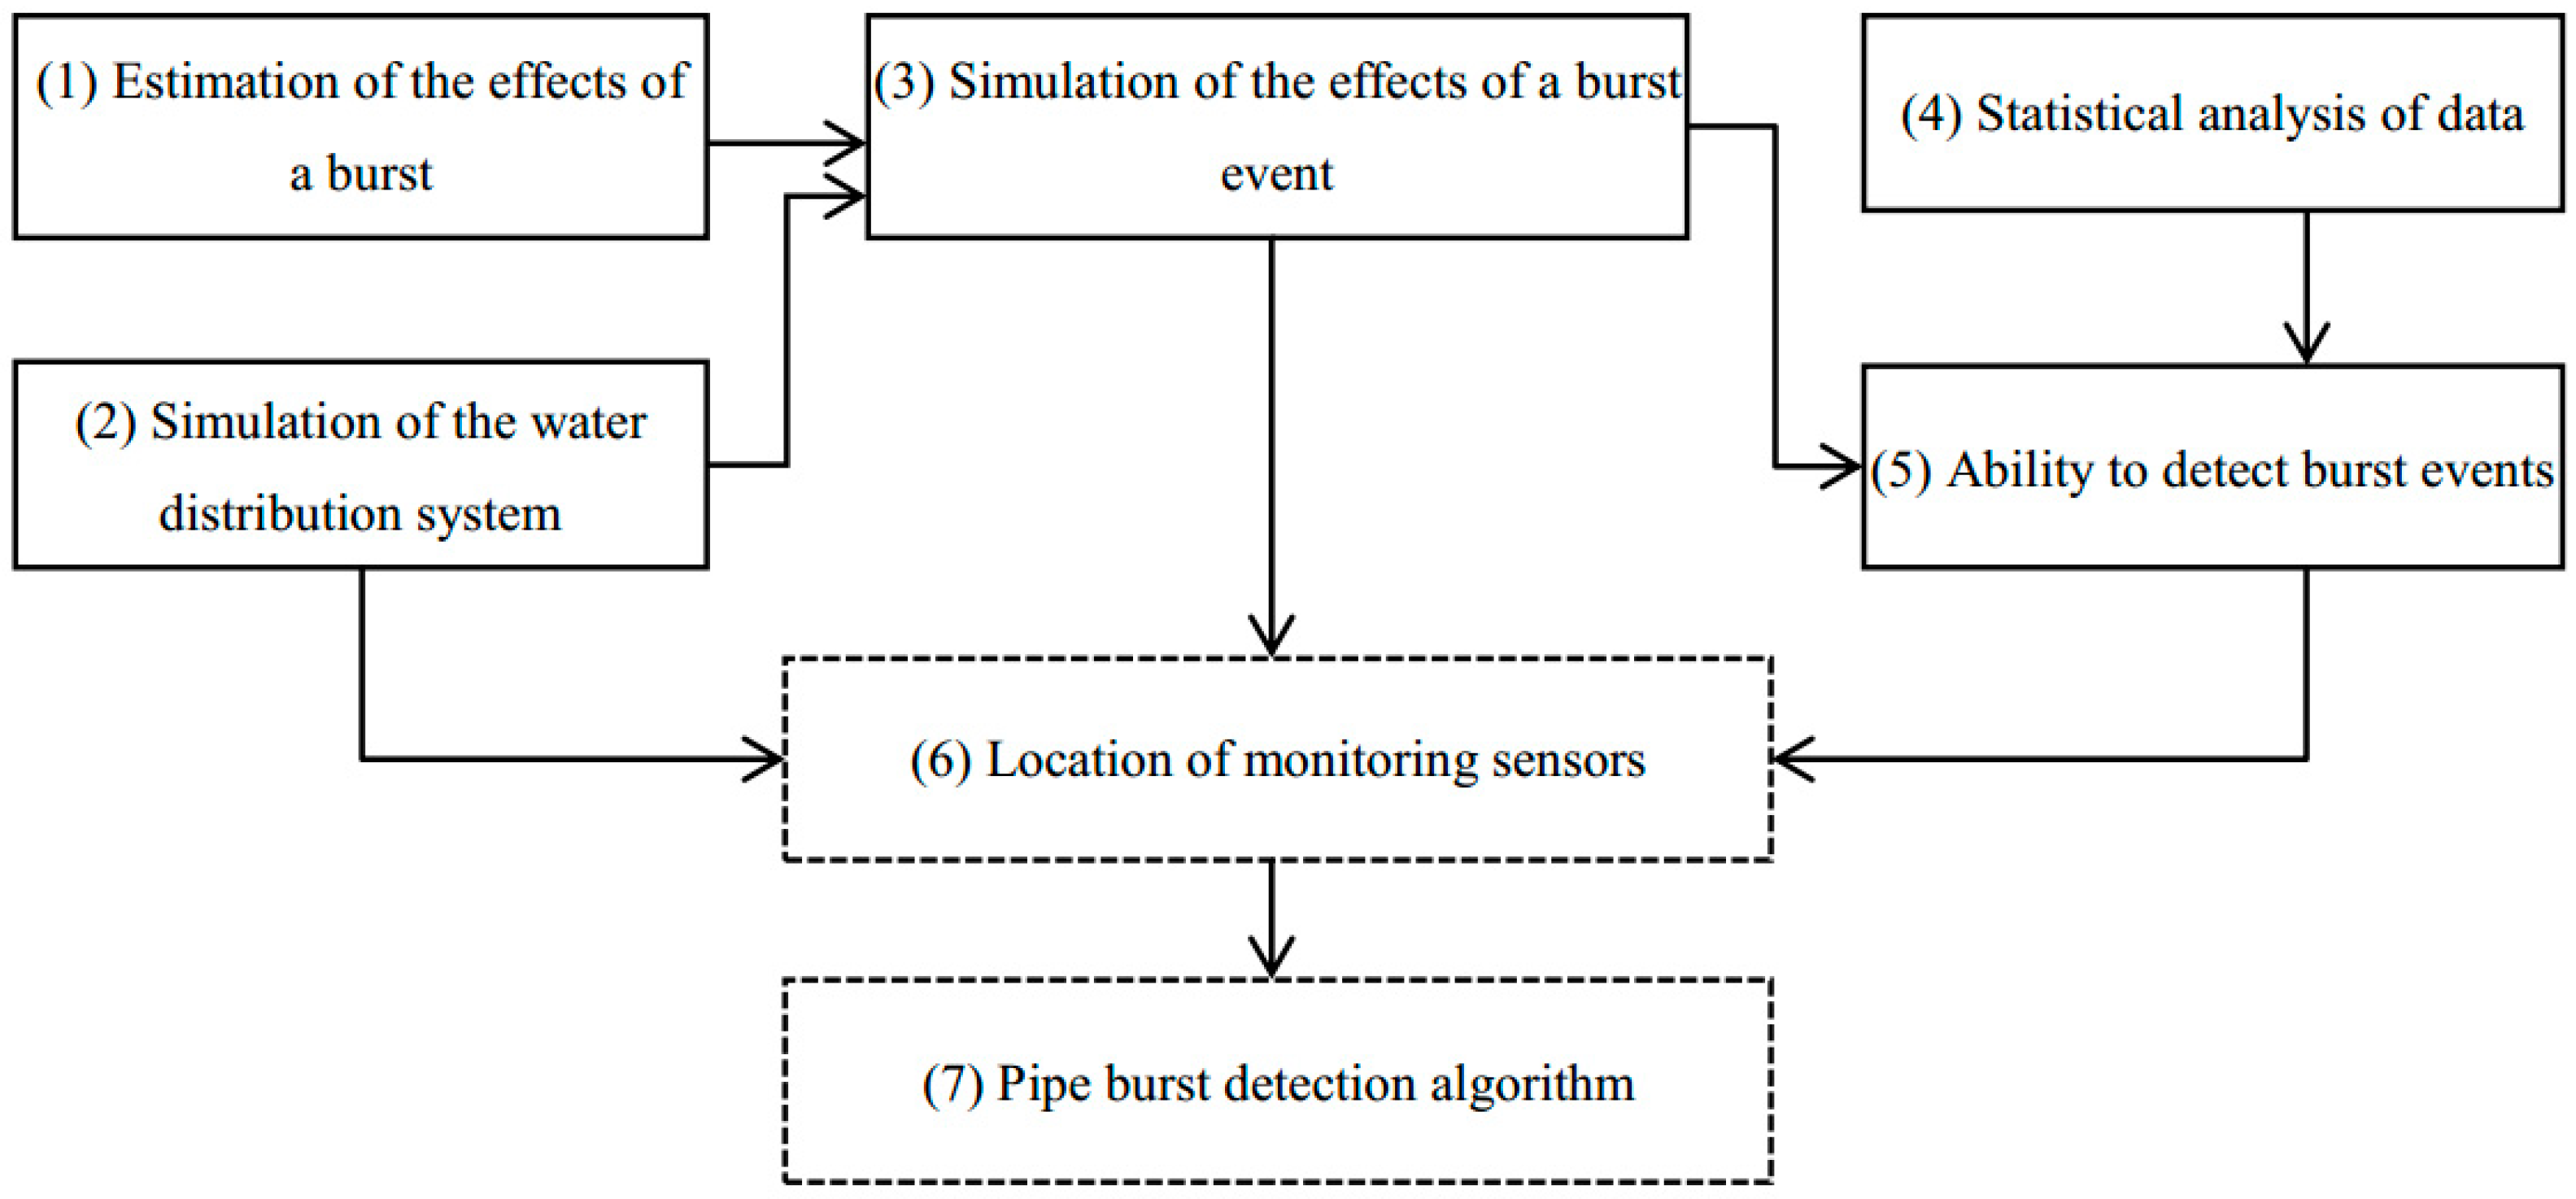
- Estimation of the effects of a burst: When a burst event occurs, how much flow will be lost through the leak?
- Simulation of the water distribution system: A quantitative hydraulic model is used to represent the WDS.
- Simulation of the effects of a burst event: A pipe burst is a random event that may occur anywhere and anytime. The WDS model should predict the probable impact of a pipe burst.
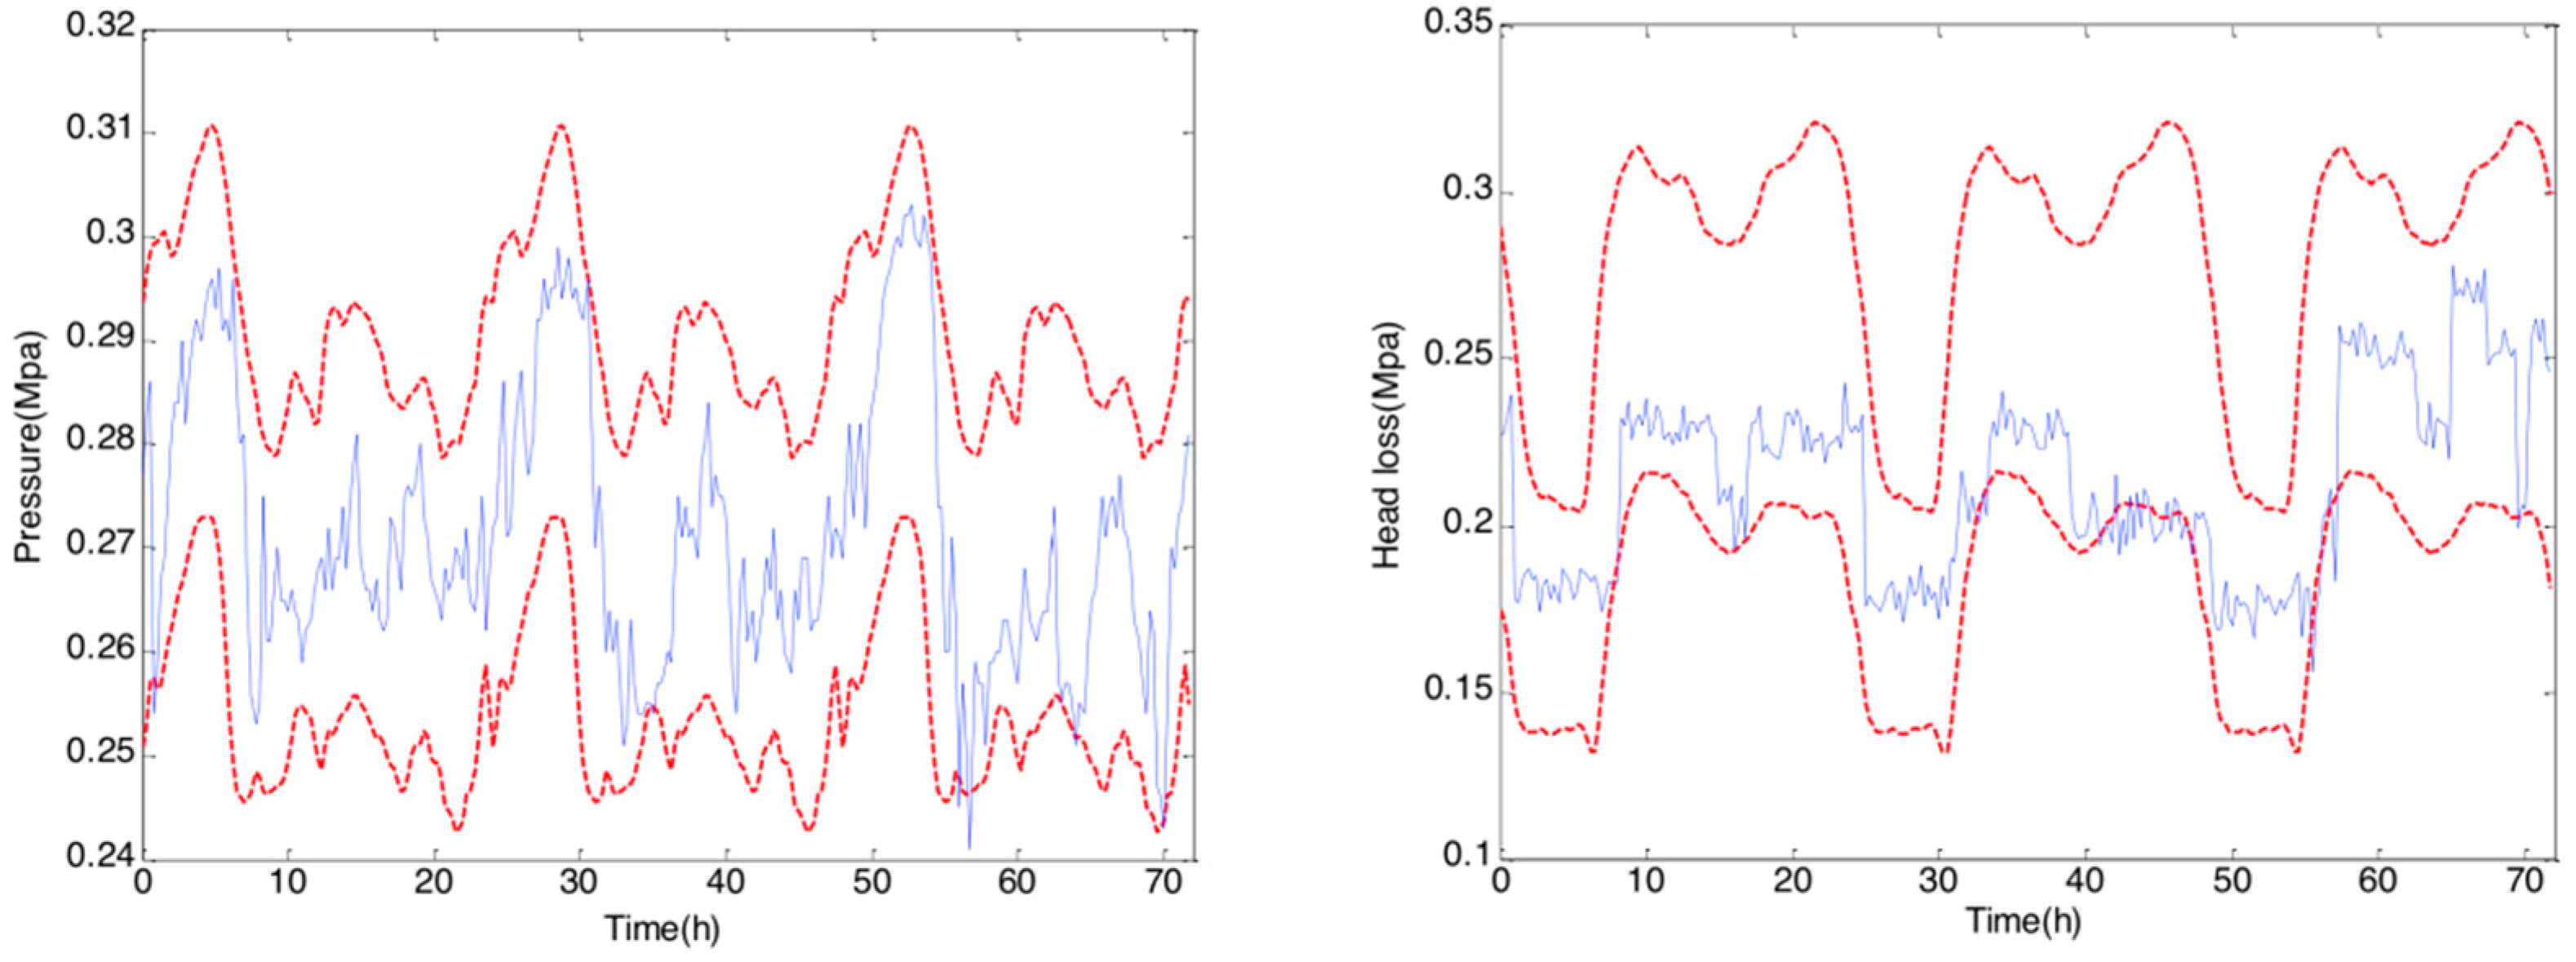
- Statistical analysis of data: A WDS is dynamic; there are periodic patterns in its operation; and its periodic pressure and flow can be easily monitored. However, water consumption changes randomly, causing synchronous fluctuations in pressure and flow. Electromagnetic interference may also randomly distort monitoring data and create background noise. Hence, recognizing the statistical characteristics of data and background noise help to identify abnormal events.
- Ability to detect burst events: Few instruments can measure the water loss from a leak in a 15 mm pipe because the flow is so small that the impact of a leak will be seen as background noise. This leads to an interesting question (discussed in Section 4.2): What is the minimum diameter of pipe for which a burst event can be accurately detected (minimum detectable diameter of pipe burst, MDDPB).
- Location of monitoring sensors: The placement of sensors in a WDS is widely debated, and they can be used for different purposes, such as burst detection, contamination detection, and model calibration [15,16]. Sensor placement can be optimized by using multi-objective models. In this paper, the purpose of the monitoring network is to detect burst events.
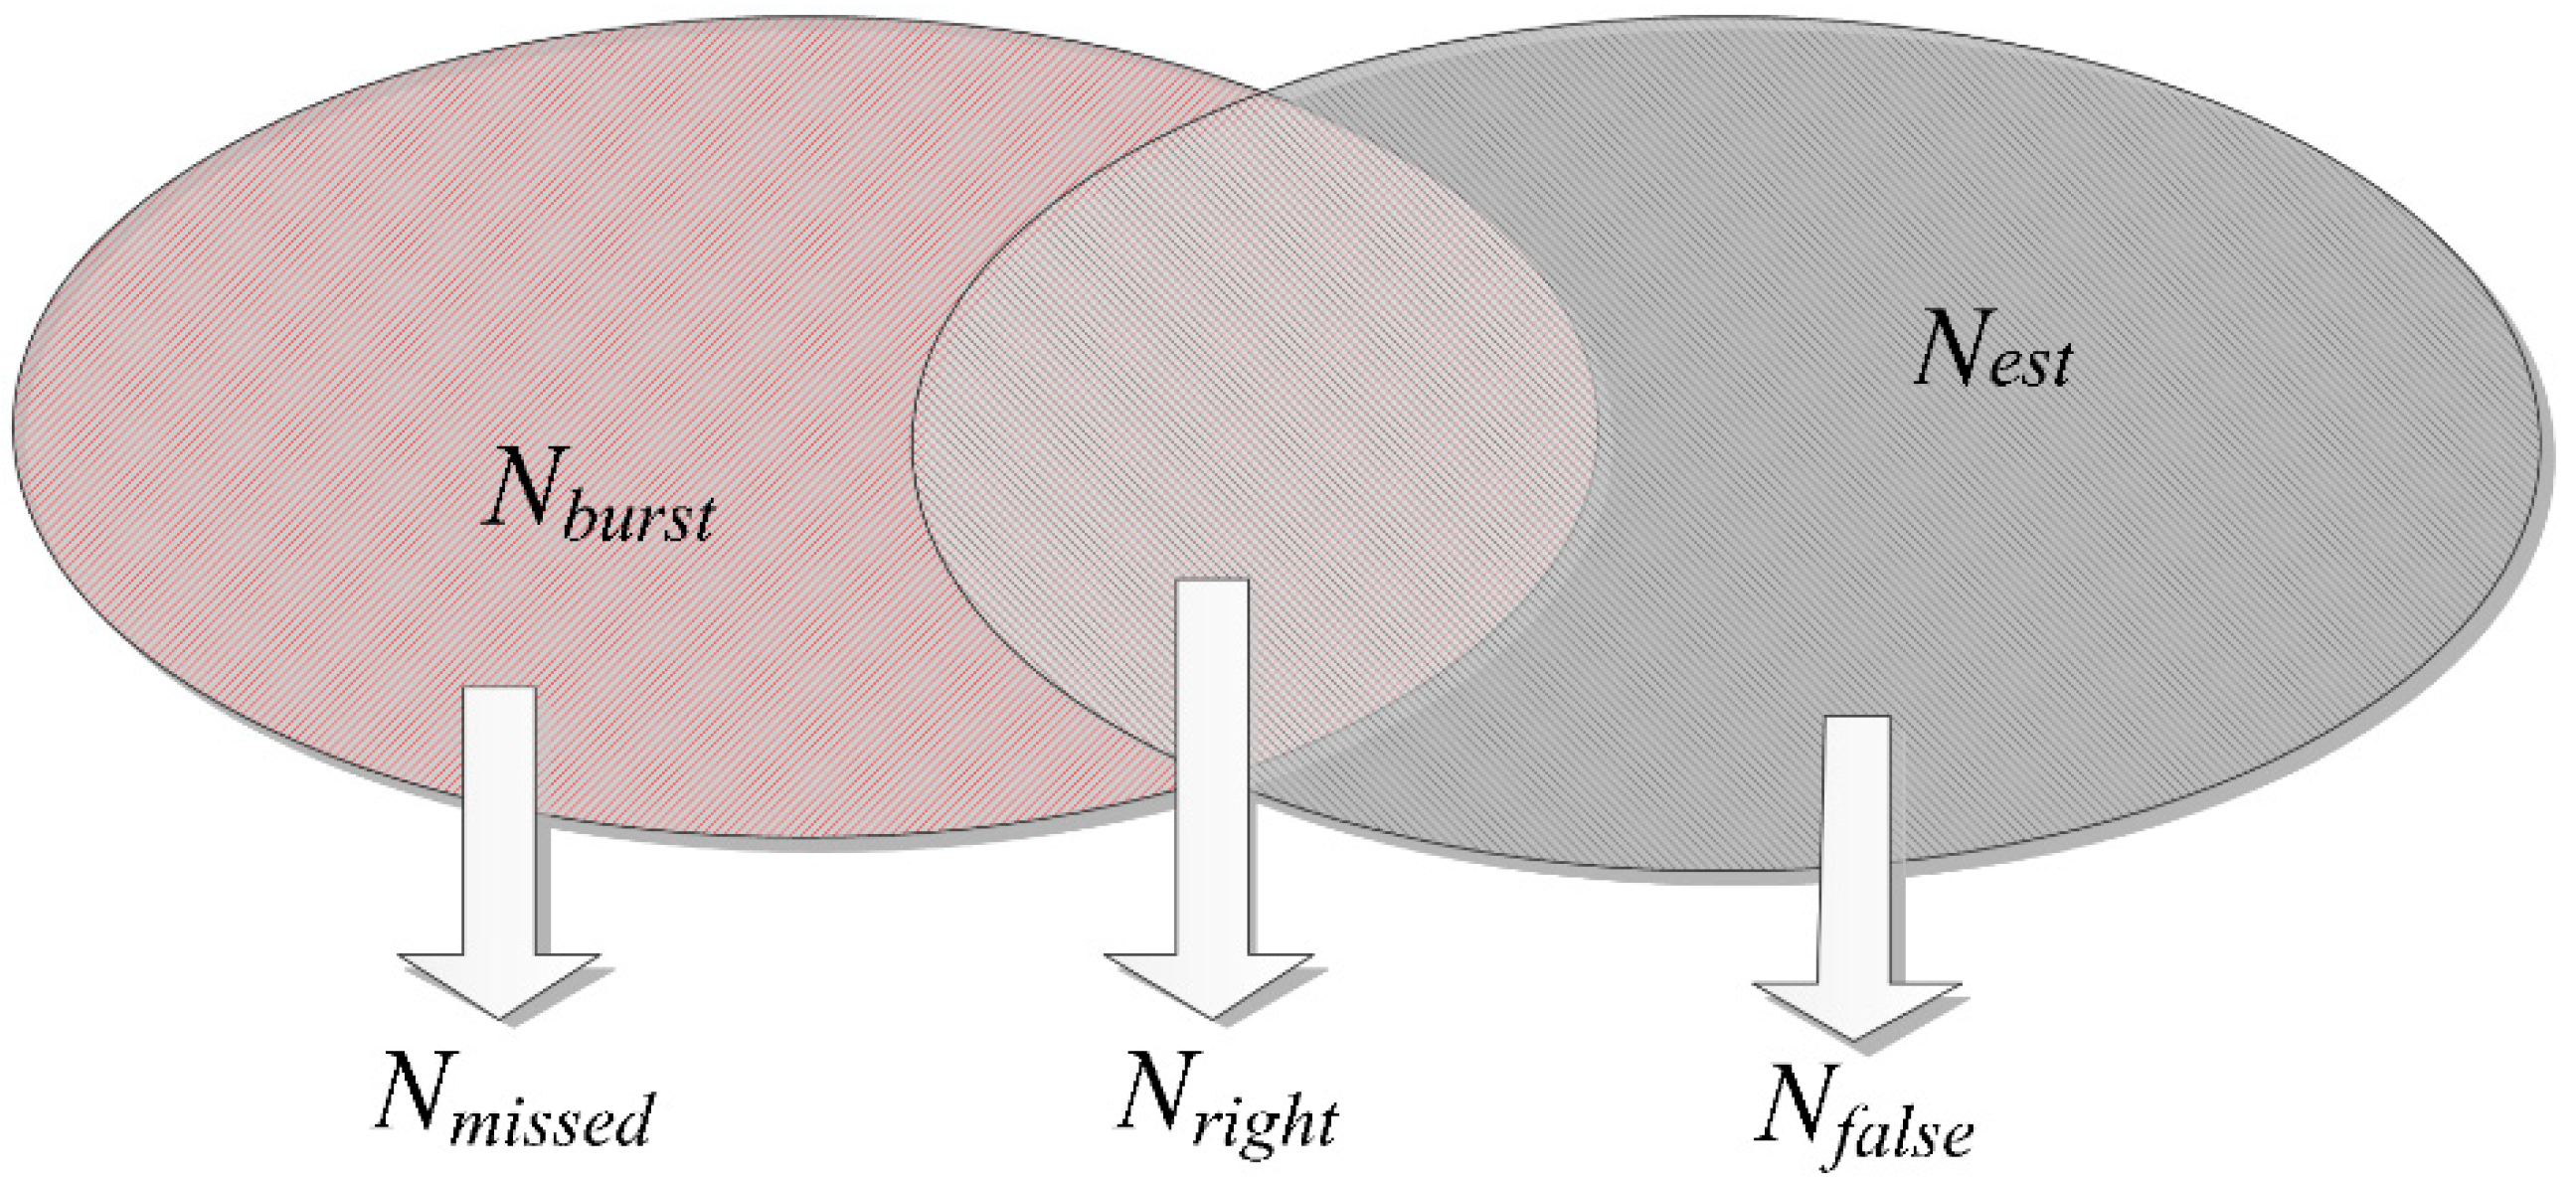
- Pipe burst detection algorithm: There is no consensus concerning the best algorithm. Any algorithm used in modelling a WDS should be validated against real burst events. An ideal algorithm will be 100% accurate: it will detect all leaks that do occur and will not falsely detect leaks that have not occurred. An effective algorithm will be close to ideal.
3. Statistical Characteristics of Observed Data
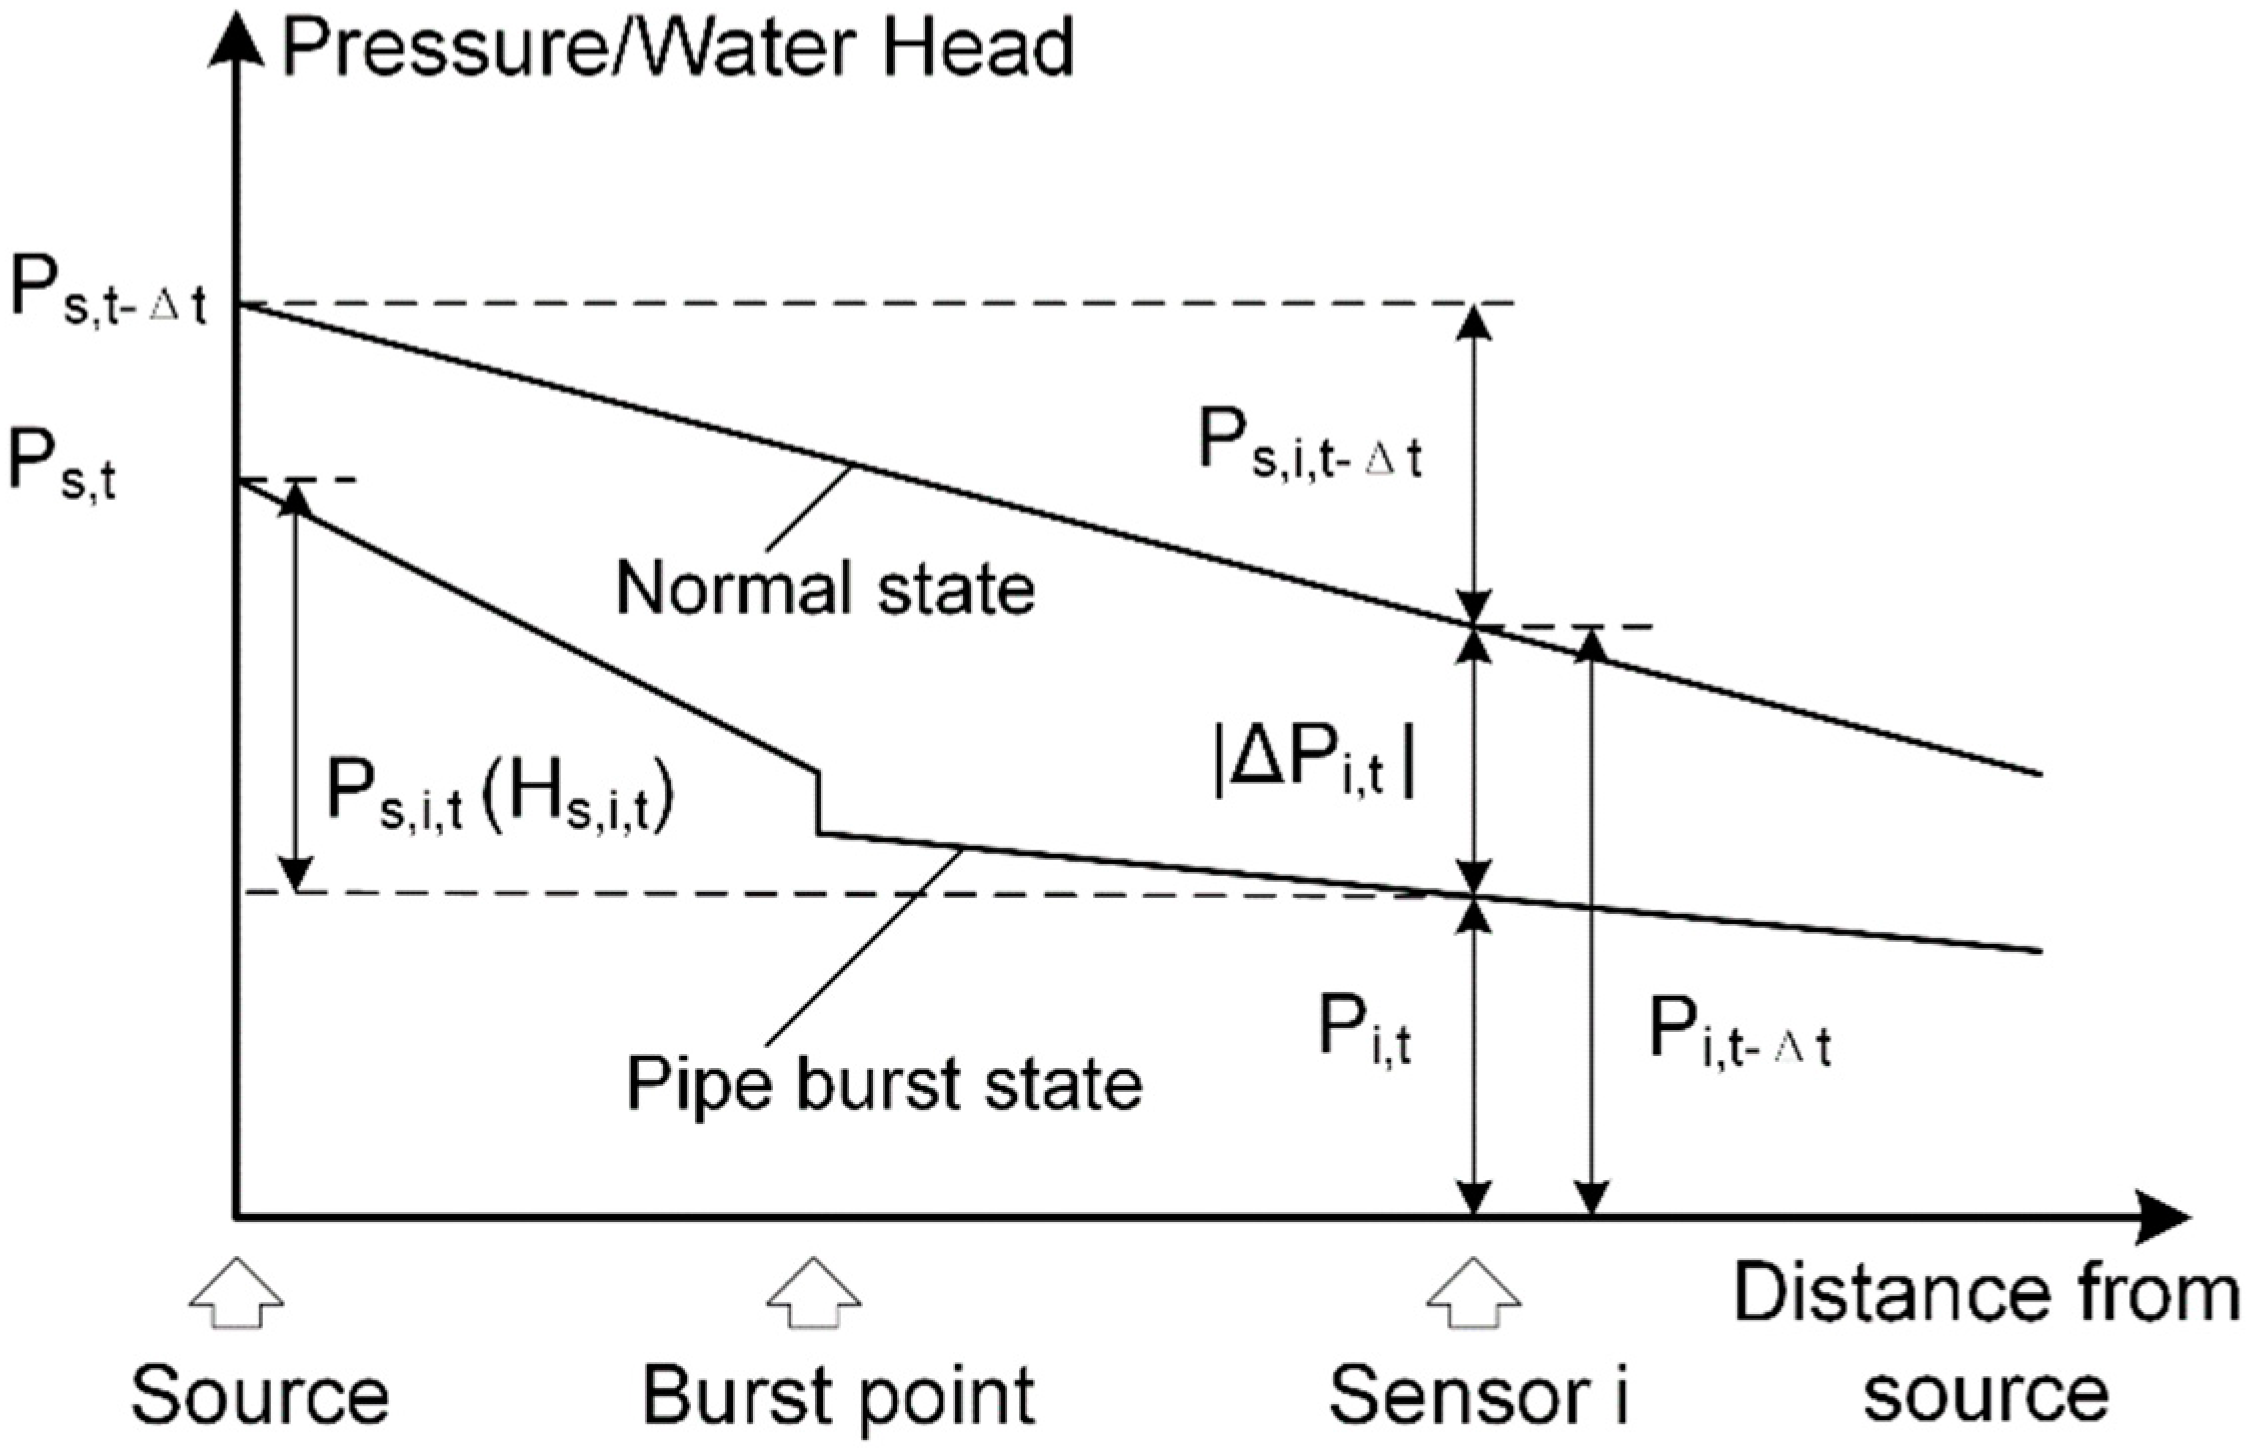
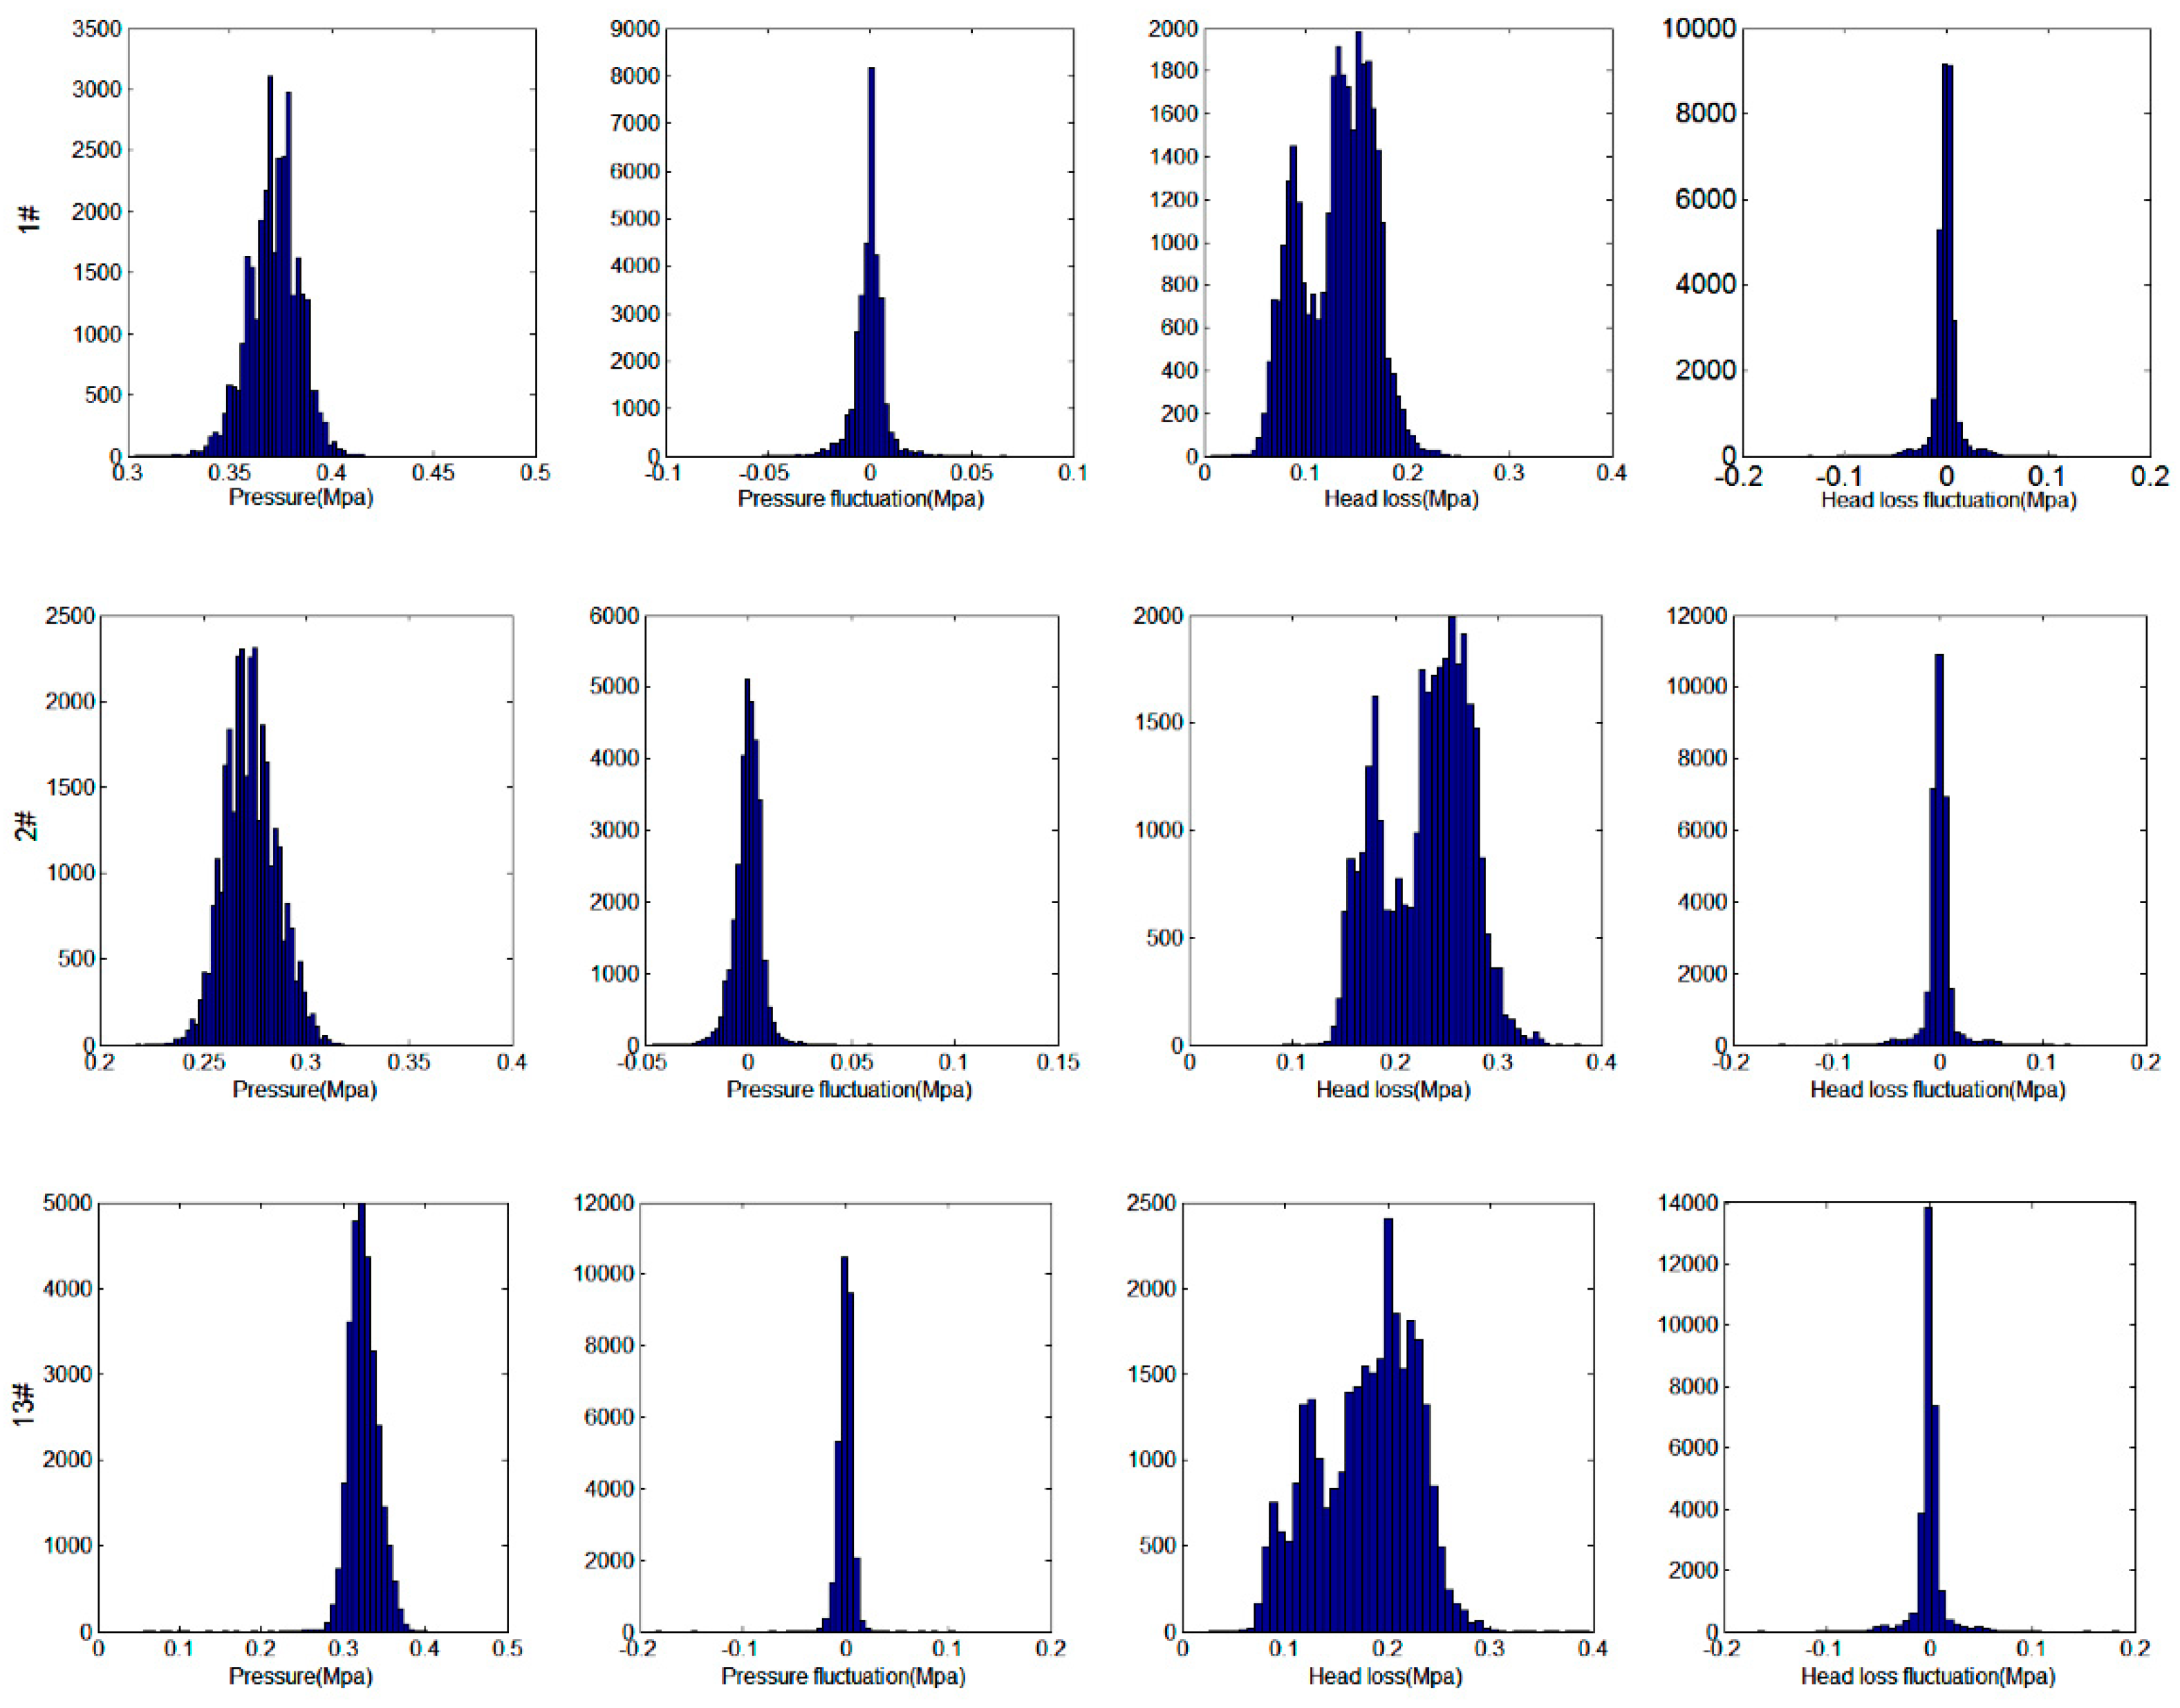
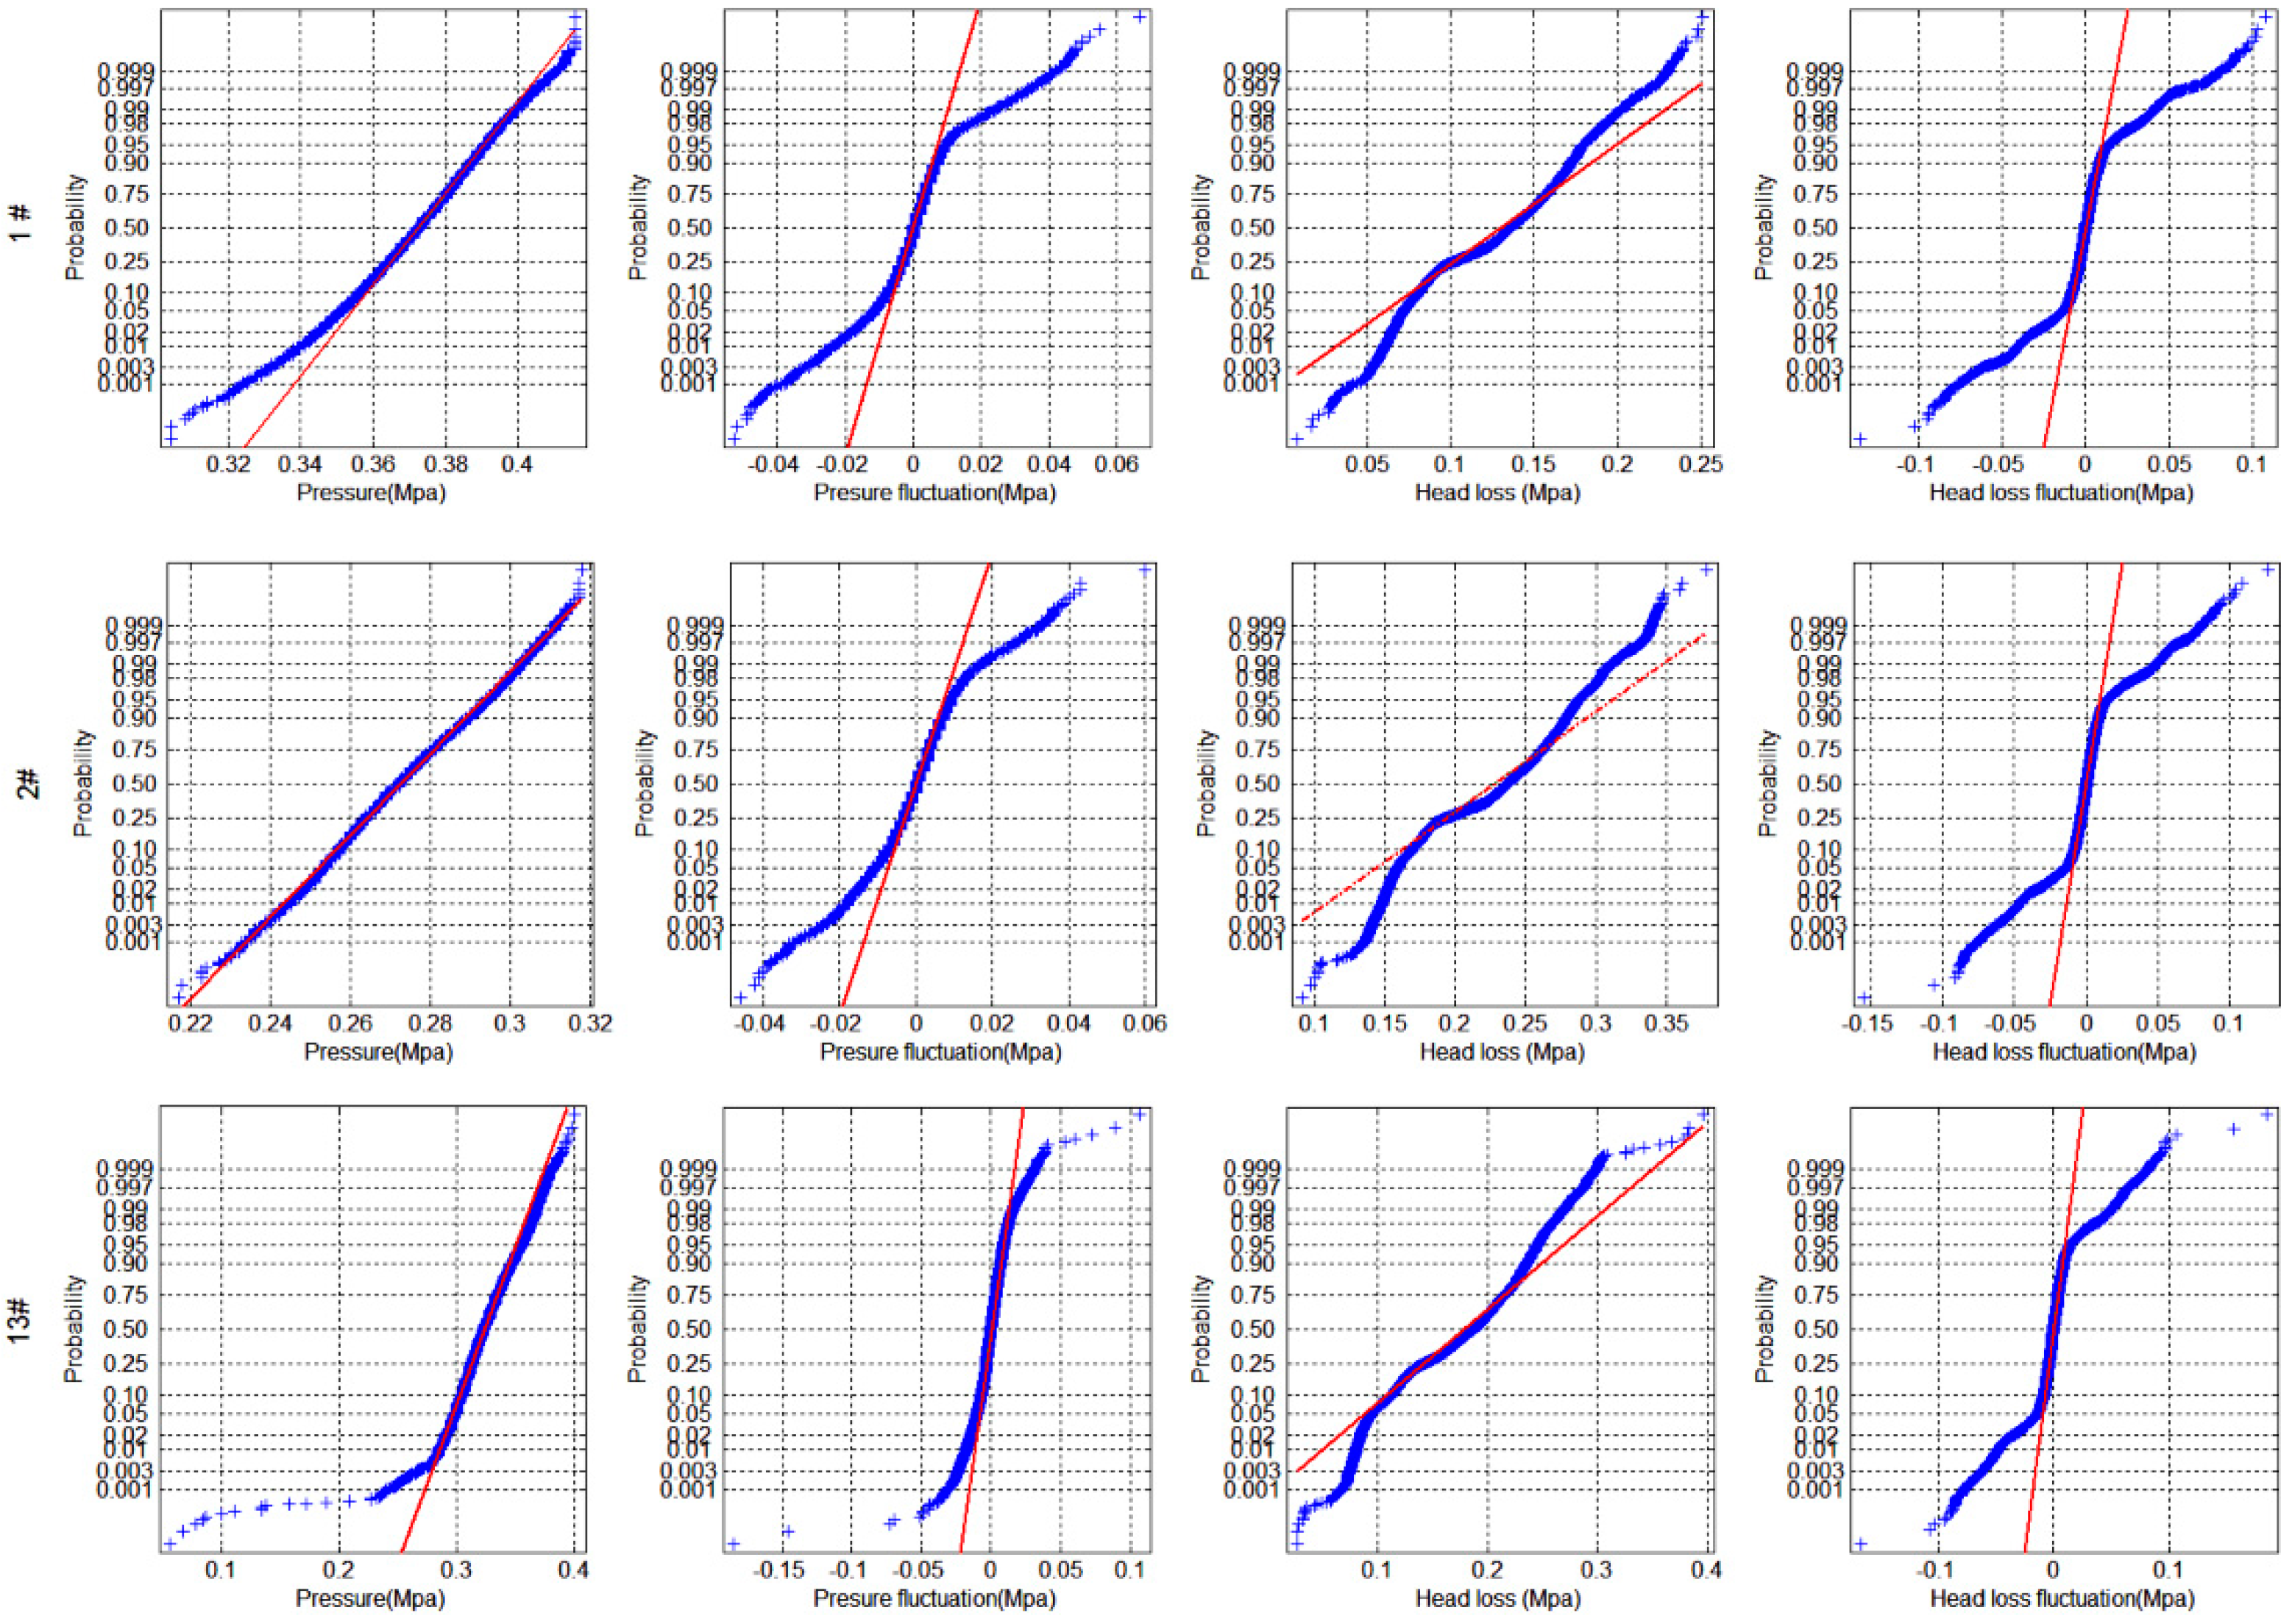
3.1. Pressure Fluctuation in WDS
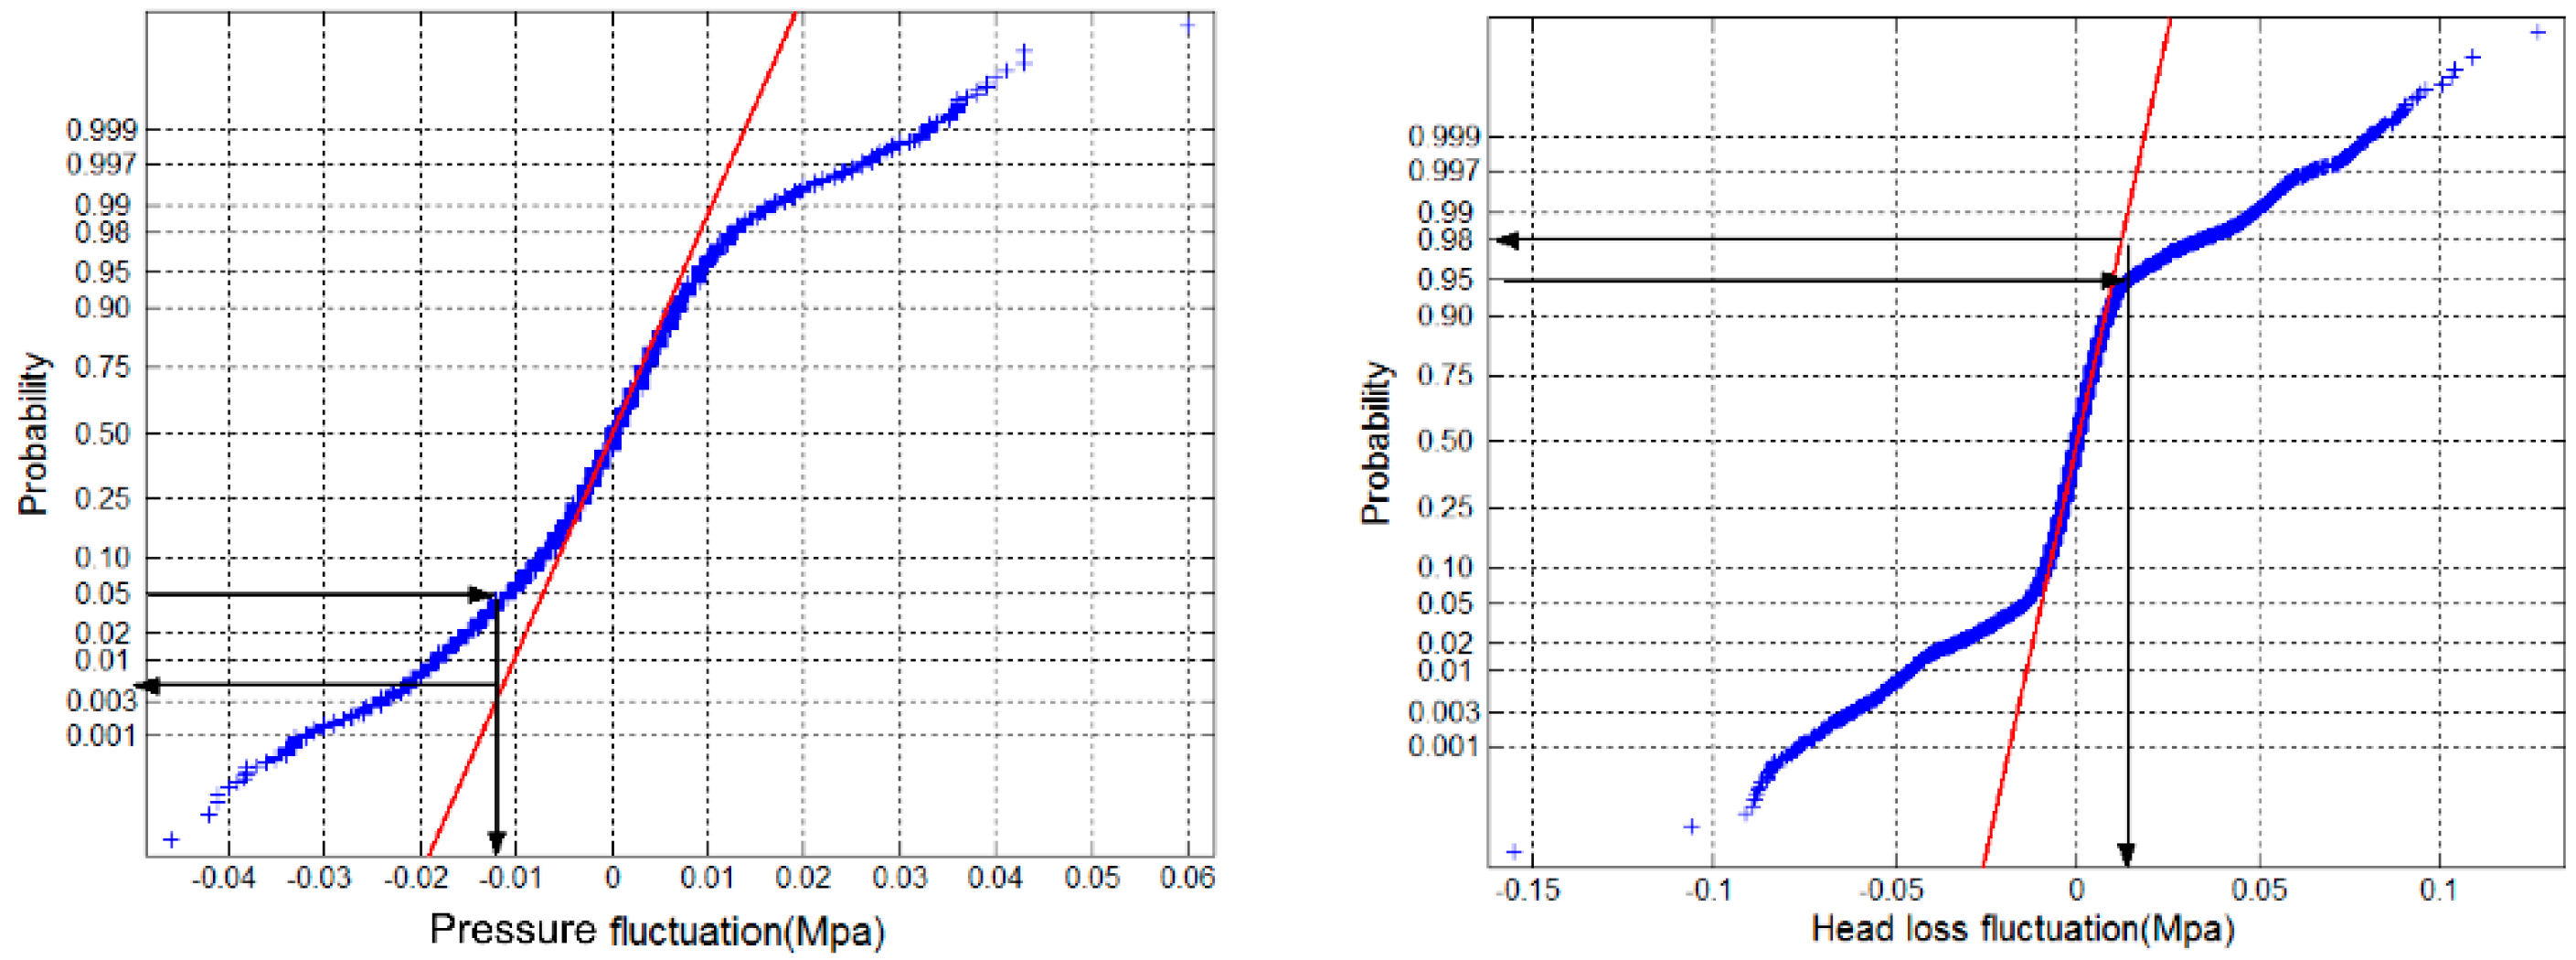
3.2. Thresholds of Abnormal Pressure Fluctuation
4. Impact of Burst Events on WDS
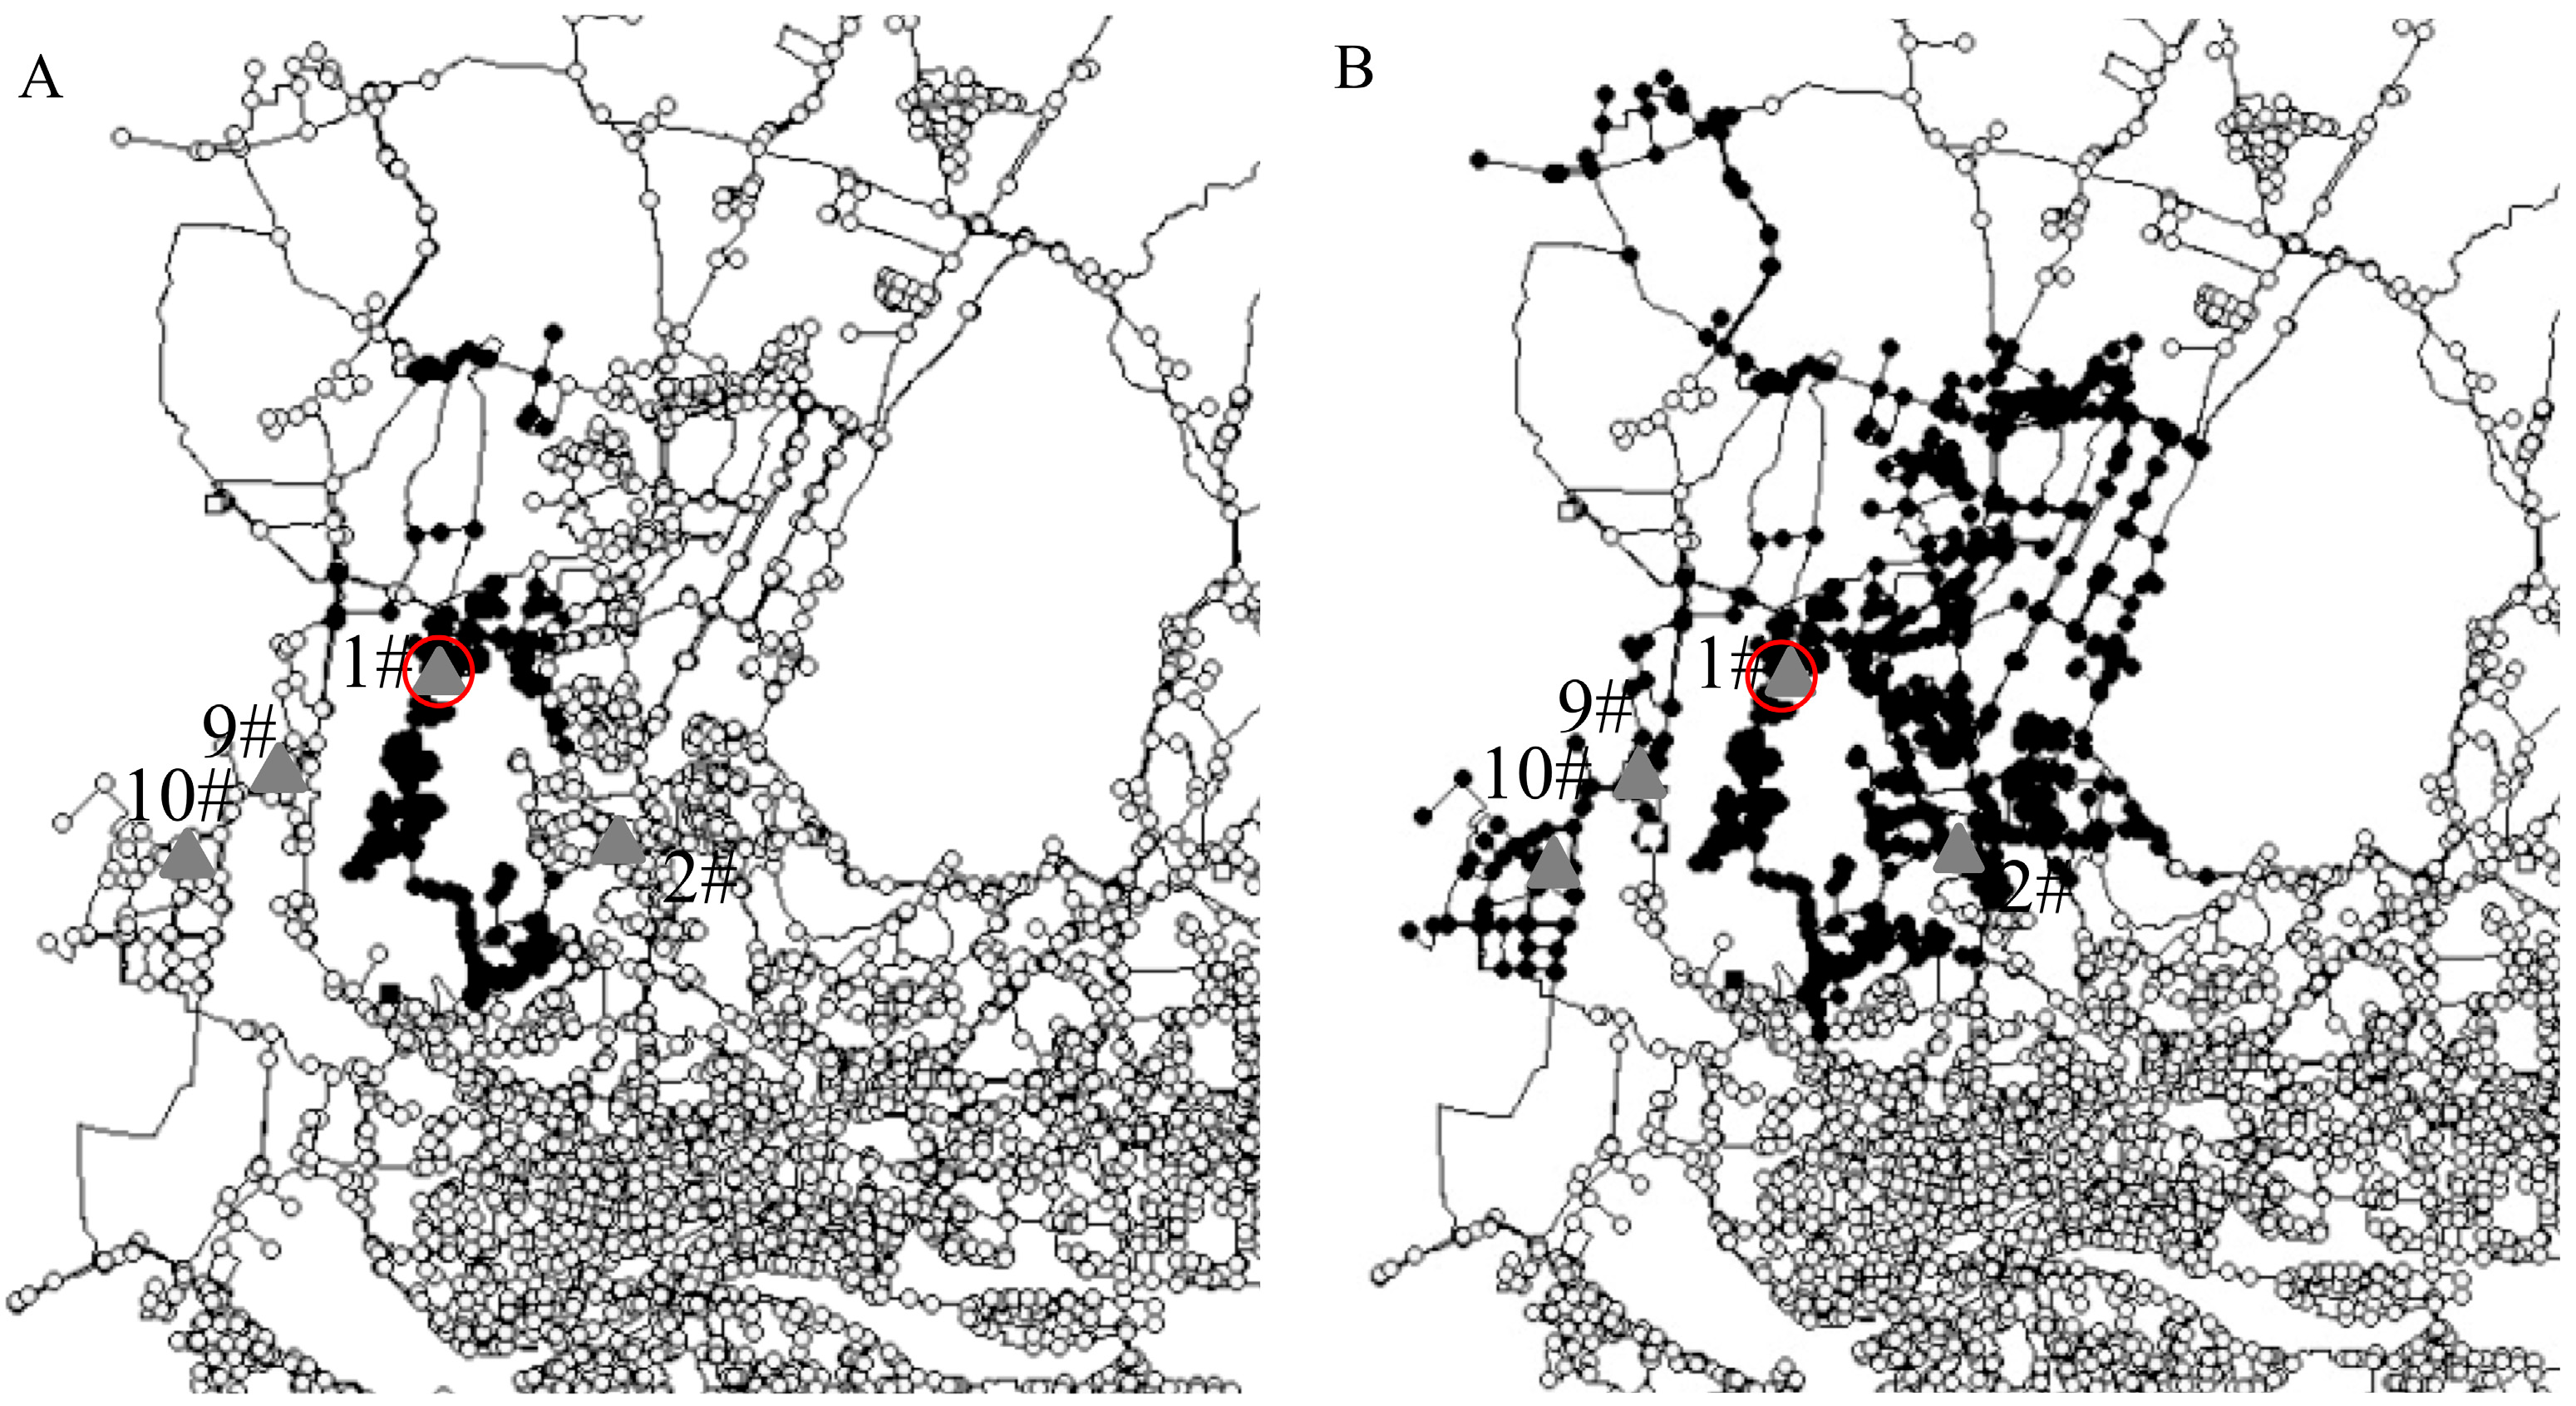
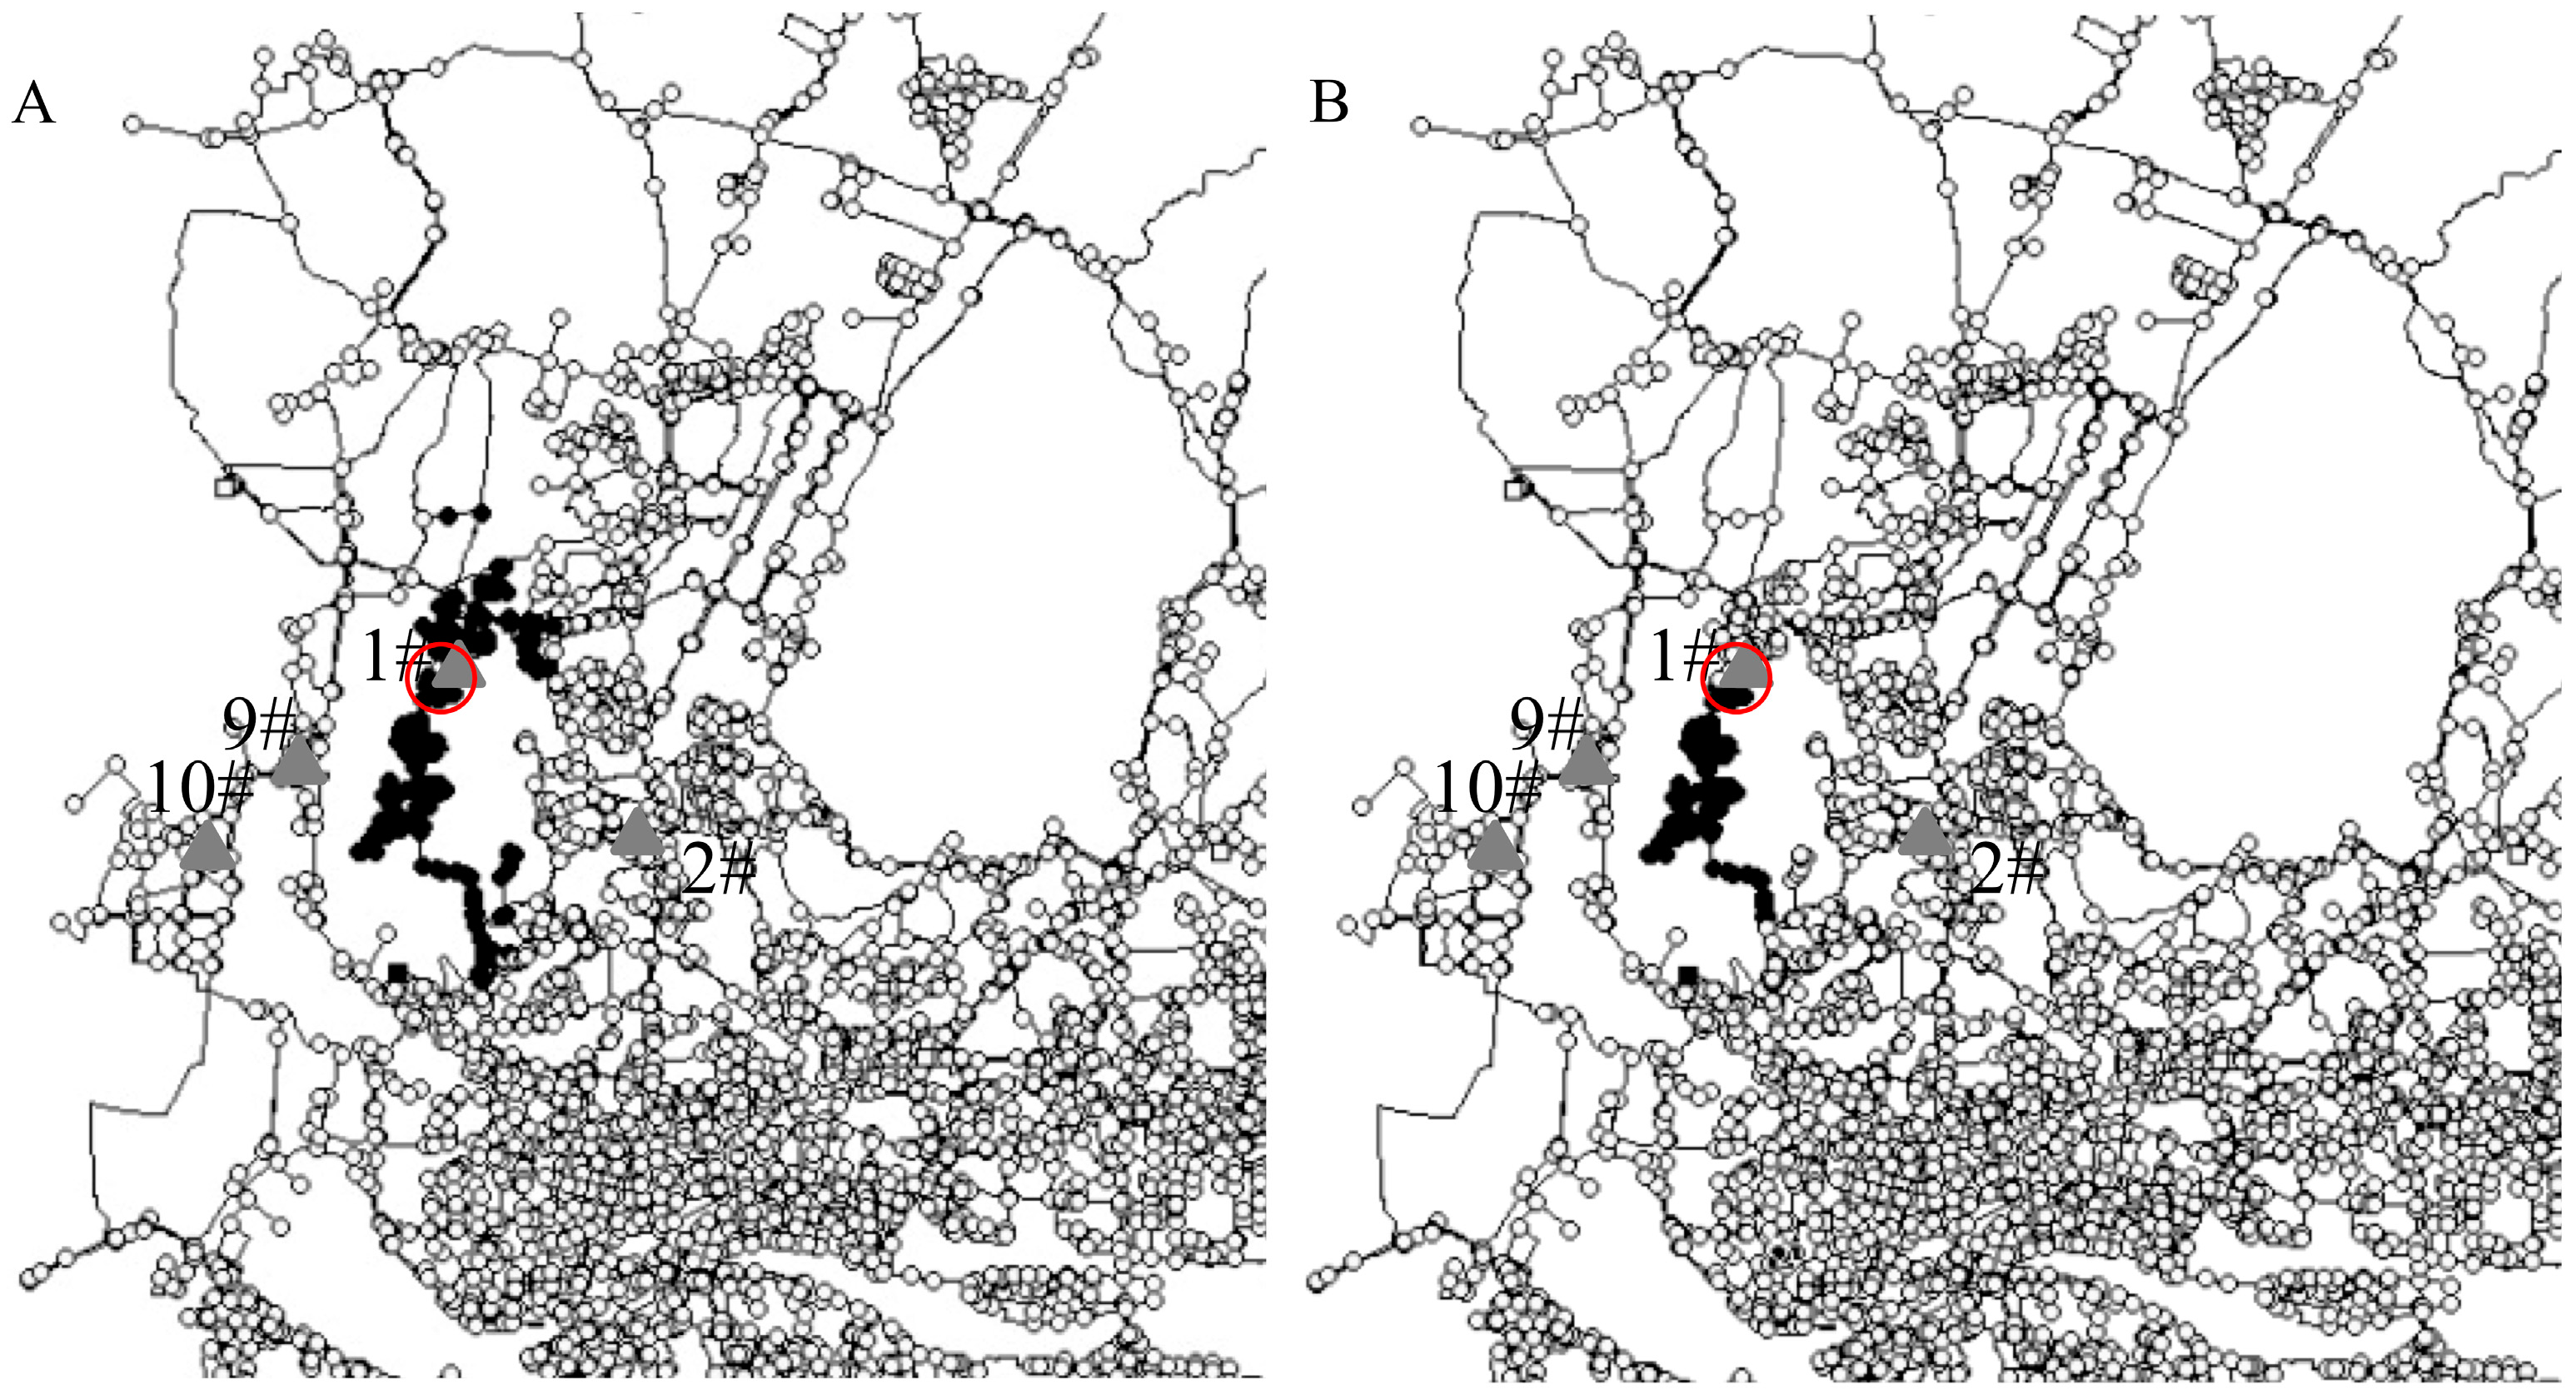
4.1. Simulation of Burst Event
4.2. Minimum Pipe Diameter for Burst Detection
5. Pipe Burst Detection
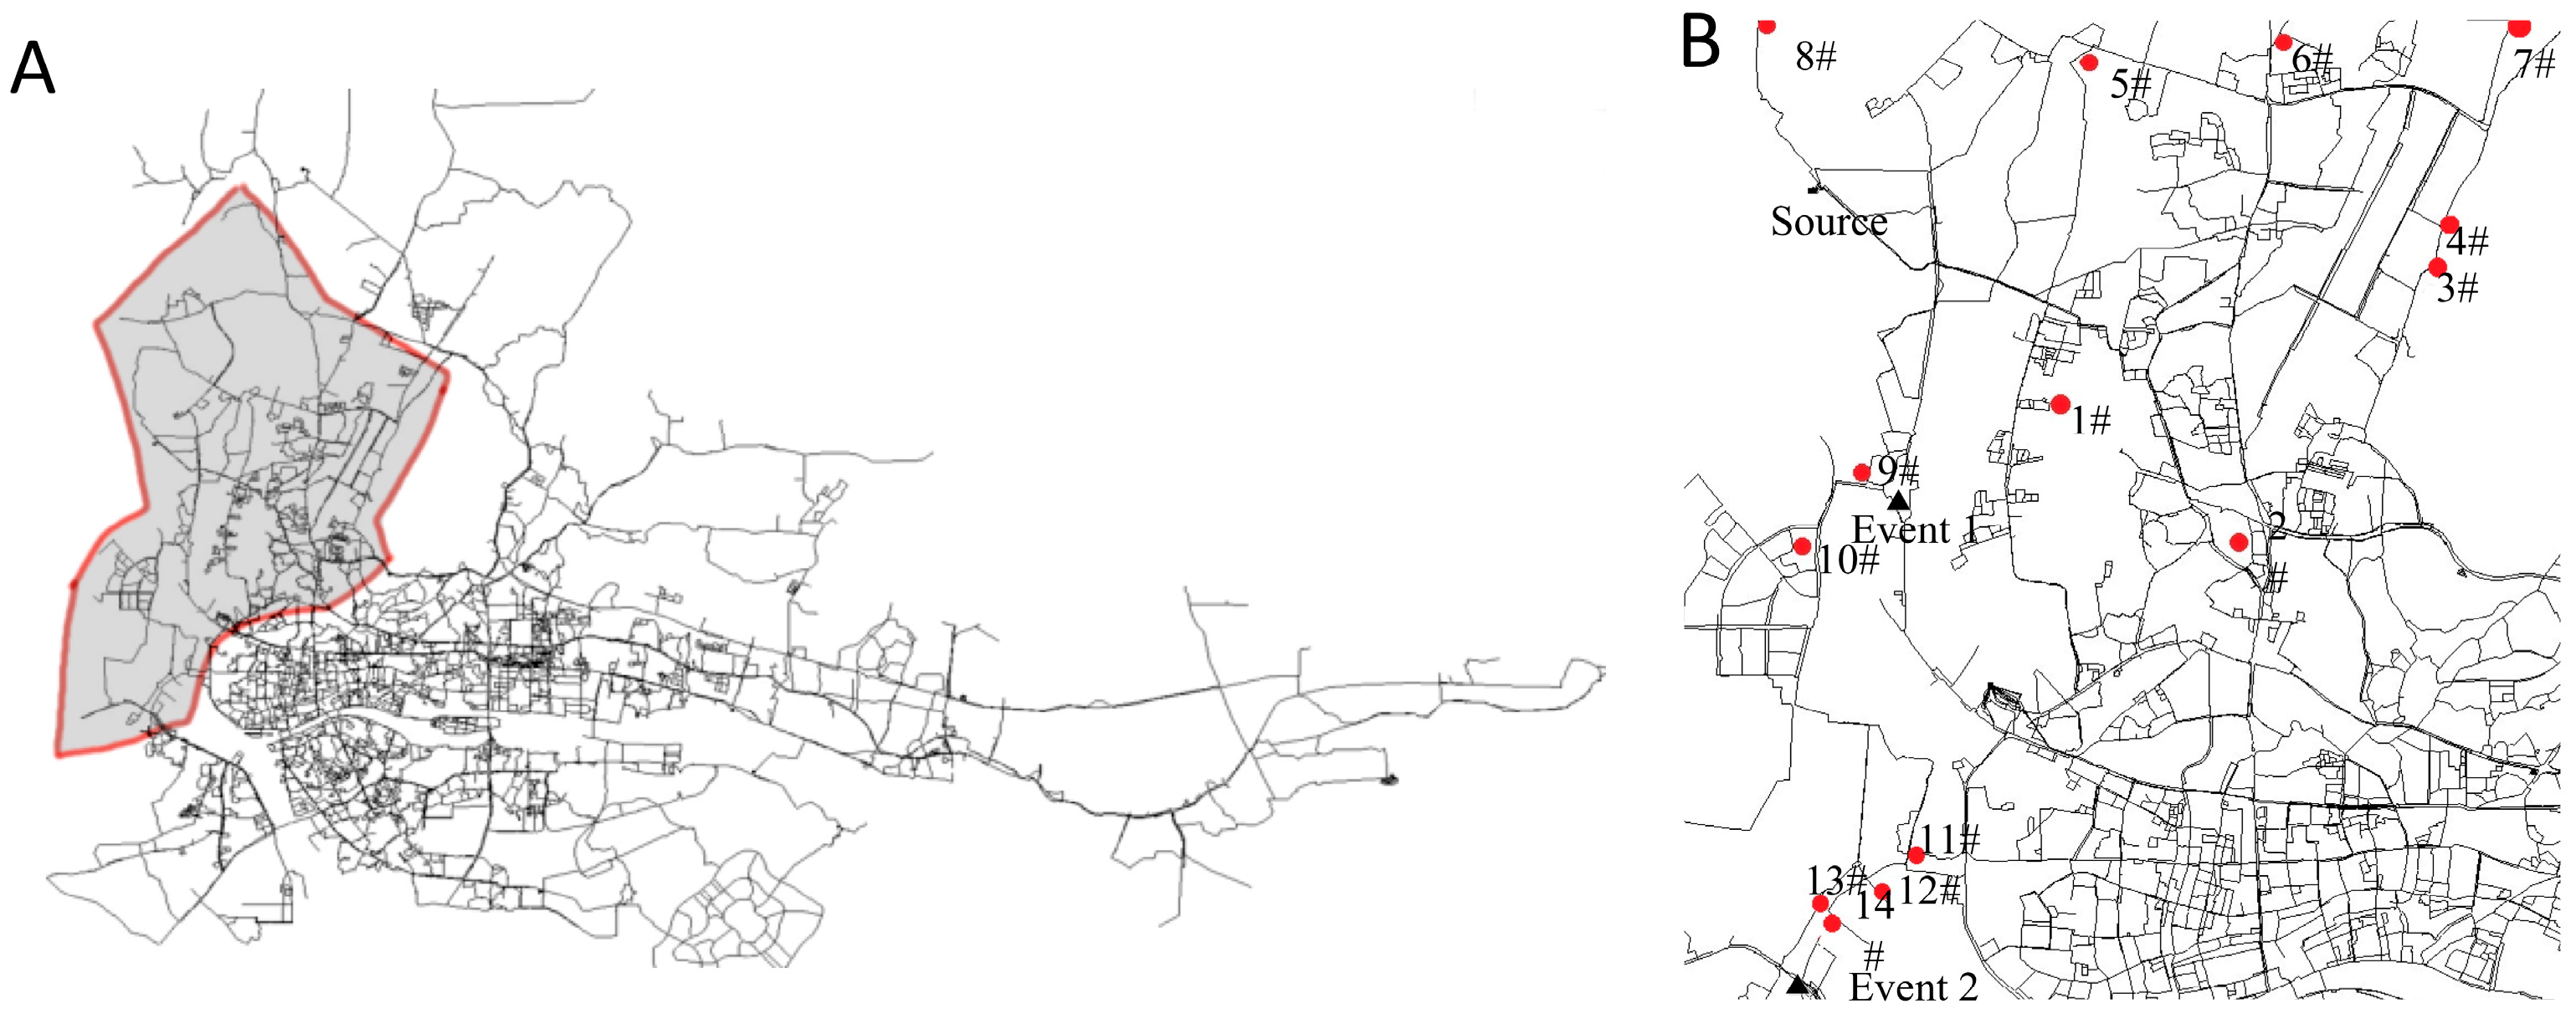
5.1. Pipe Burst Event
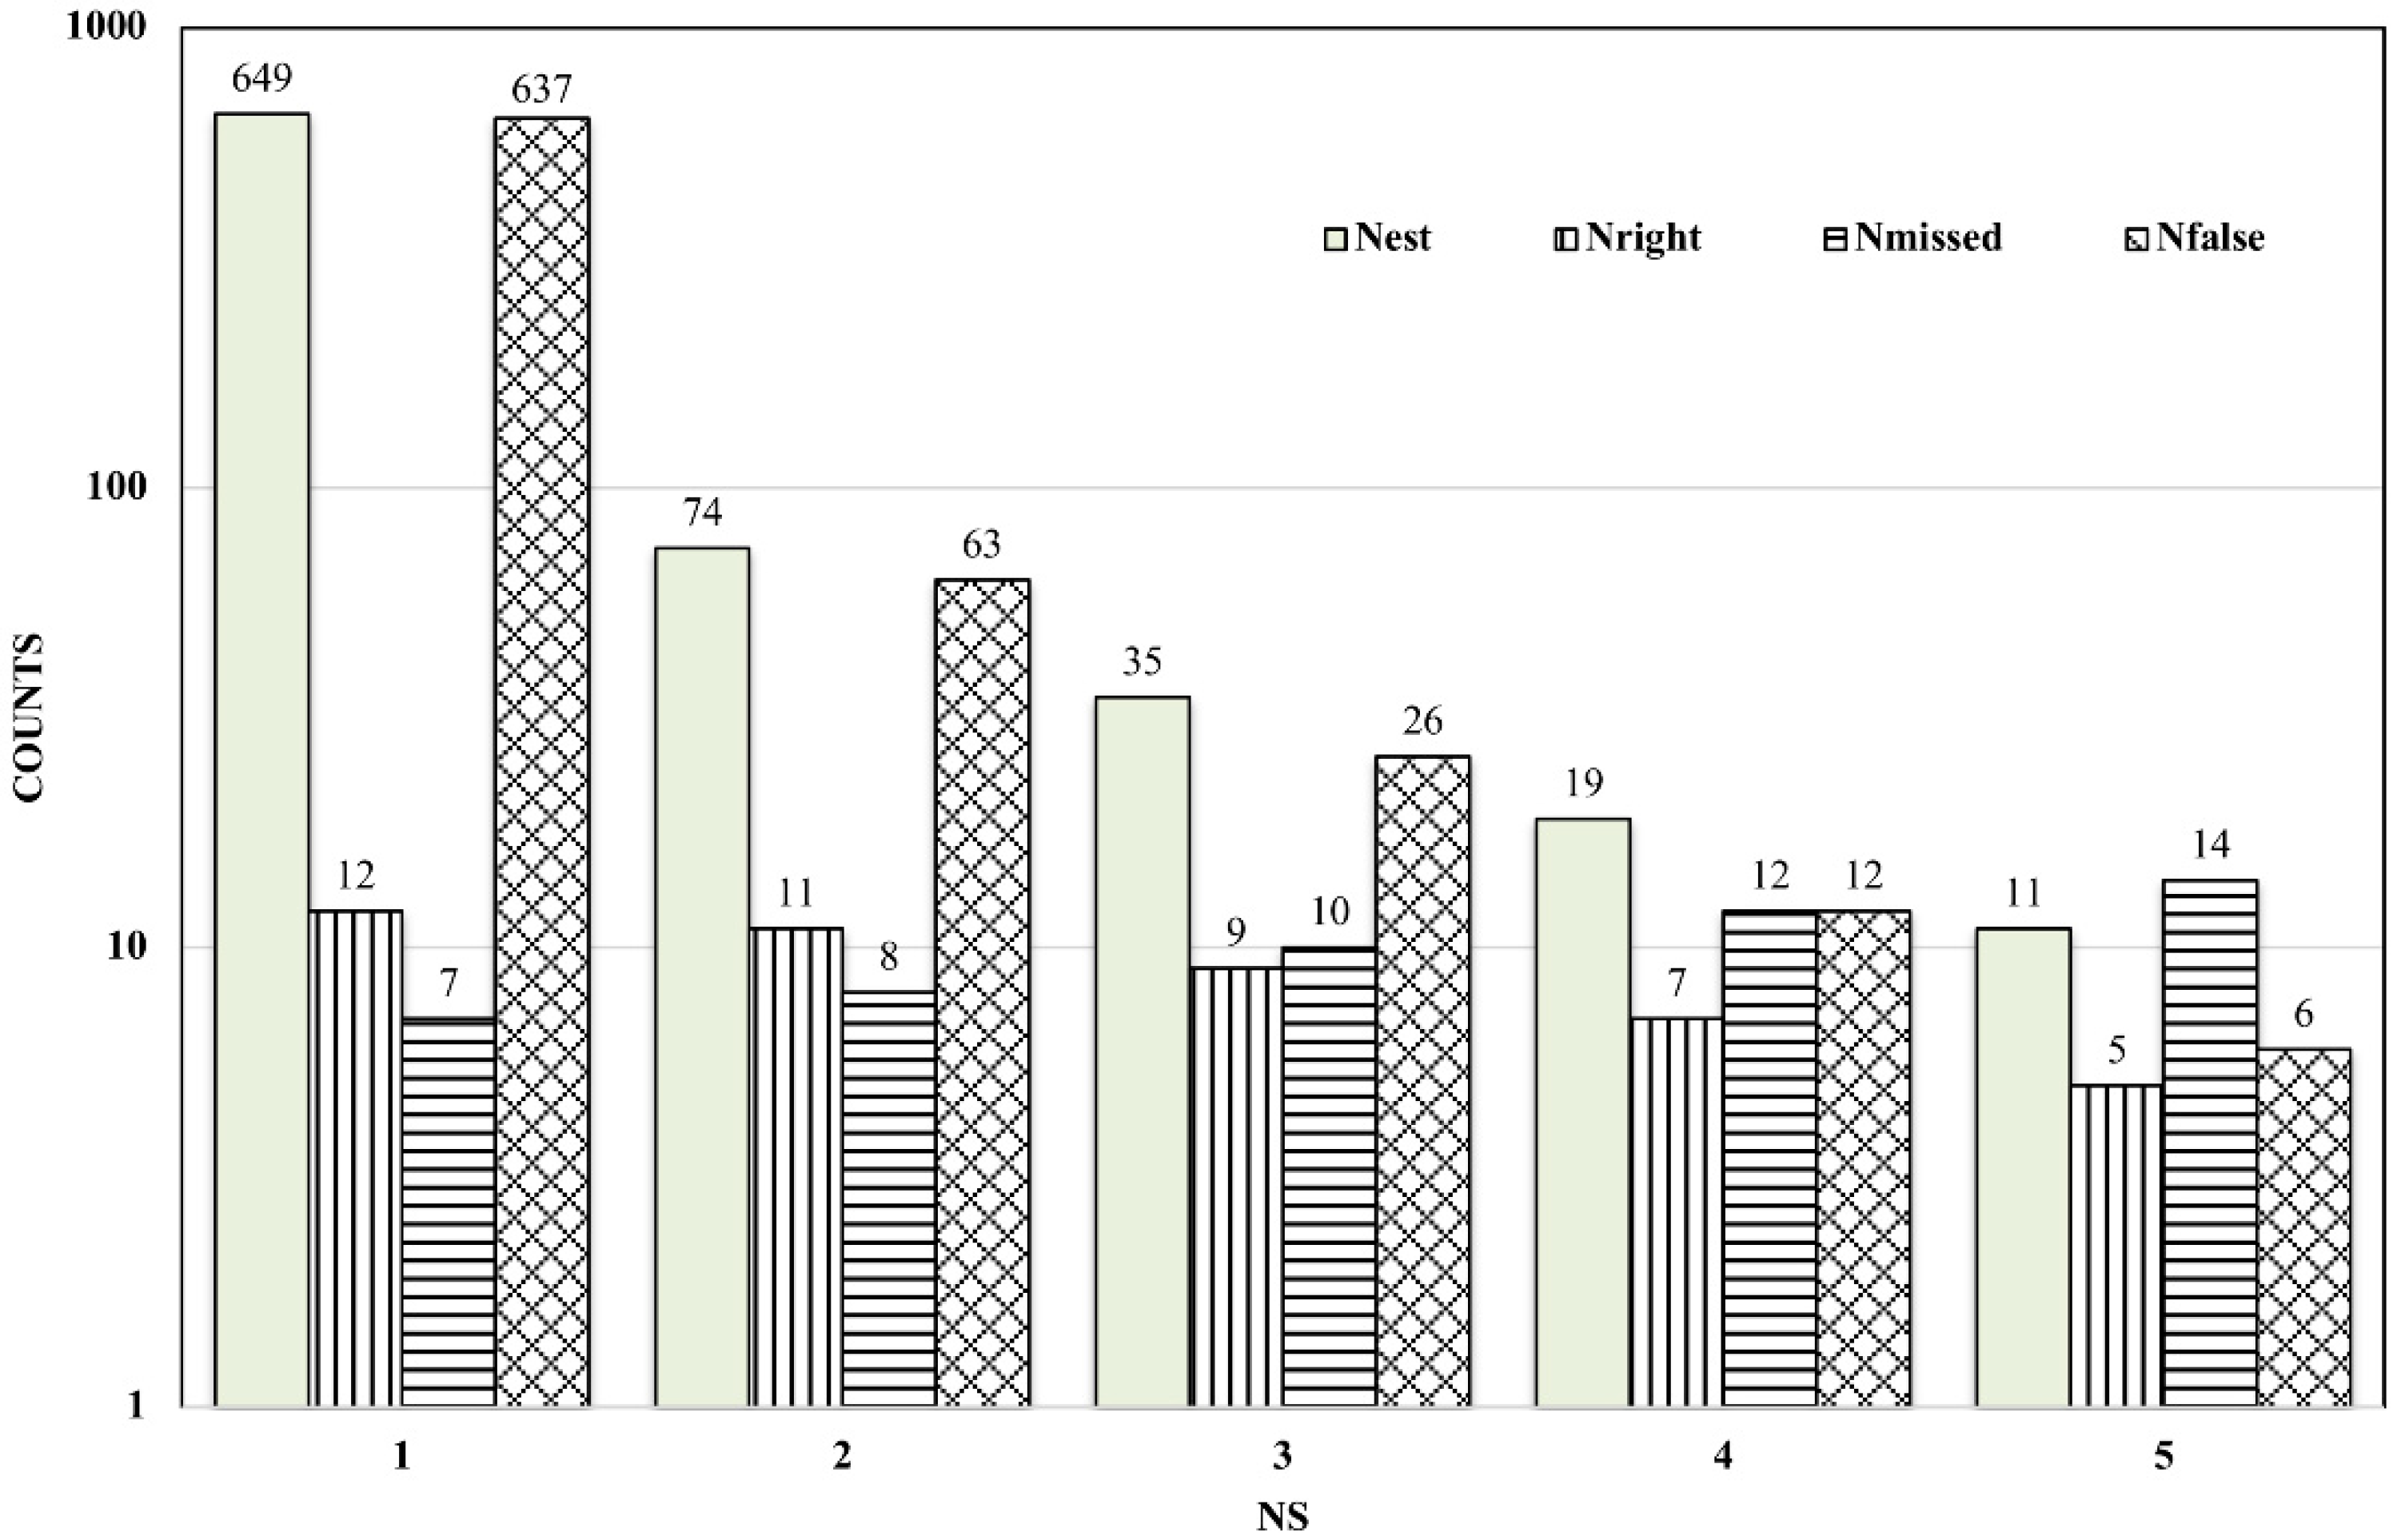
5.2. Suggested Sensor Numbers for Burst Detection
6. Conclusions
- (1)
- Monitoring data contain background noise from WDS consumption use and from monitoring equipment. The effect of a detectable burst event should be greater than the level of background noise for a burst event to be correctly identified. The background noise of a pipe system can be determined by statistical analysis of the monitored data using the 3-sigma rule.
- (2)
- The minimum pipe diameter for which a burst event is detectable can be determined by model simulation. Monitoring burst events in pipes of greater than the minimum diameter will improve the burst detection and reduce monitoring costs.
- (3)
- In a detection zone (i.e., the part of the network close to and containing the burst event), a minimum number of sensors is necessary for an acceptable rate of correctly detected burst events. We found that data from two or more sensors close to the burst event location are required to reduce errors due to undetected events and false alarms.
Author Contributions
Funding
Conflicts of Interest
References
- Li, R.; Huang, H.; Xin, K.; Tao, T. A review of methods for burst/leakage detection and location in water distribution systems. Water Sci. Technol. Water Suppl. 2014, 15, 429–441. [Google Scholar] [CrossRef]
- Pudar, R.S.; Liggett, J.A. Leaks in pipe networks. J. Hydraul. Eng. 1992, 118, 1031–1046. [Google Scholar] [CrossRef]
- Vítkovský, J.P.; Simpson, A.R.; Lambert, M.F. Minimization algorithms and experimental inverse transient leak detection. In Proceedings of the 2002 Water Resources Planning and Management Conference, Roanoke, VA, USA, 1 January 2002. [Google Scholar]
- Misiunas, D.; Vitkovsky, J.; Olsson, G.; Simpson, A.R.; Lambert, M.F. Pipeline Burst Detection and Location Using a Continuous Monitoring Technique; Lund University: Lund, Sweden, 2003; pp. 89–96. [Google Scholar]
- Kapelan, Z.; Savic, D.; Walters, G. Incorporation of prior information on parameters in inverse transient analysis for leak detection and roughness calibration. Urban Water J. 2004, 1, 129–143. [Google Scholar] [CrossRef]
- Lee, P.J.; Vítkovský, J.P.; Lambert, M.F.; Simpson, A.R.; Liggett, J.A. Leak location using the pattern of the frequency response diagram in pipelines: A numerical study. J. Sound Vib. 2005, 284, 1051–1073. [Google Scholar] [CrossRef]
- Mounce, S.; Machell, J. Burst detection using hydraulic data from water distribution systems with artificial neural networks. Urban Water J. 2006, 3, 21–31. [Google Scholar] [CrossRef]
- Bicik, J.; Kapelan, Z.; Makropoulos, C.; Savic, D.A. Pipe burst diagnostics using evidence theory. J. Hydroinform. 2011, 13, 596–608. [Google Scholar] [CrossRef]
- Cheng, W.; Fang, H.; Xu, G.; Chen, M. Using SCADA to Detect and Locate Bursts in a Long-Distance Water Pipeline. Water 2018, 10, 1727. [Google Scholar] [CrossRef]
- Ye, G.; Fenner, R.A. Kalman Filtering of Hydraulic Measurements for Burst Detection in Water Distribution Systems. J. Pipeline Syst. Eng. Pract. 2011, 2, 14–22. [Google Scholar] [CrossRef]
- Jung, D.; Lansey, K. Water distribution system burst detection using a nonlinear Kalman filter. J. Water Resour. Plan. Manag. 2014, 141, 04014070. [Google Scholar] [CrossRef]
- Palau, C.V.; Arregui, F.J.; Carlos, M. Burst Detection in Water Networks Using Principal Component Analysis. J. Water Resour. Plan. Manag. 2012, 138, 47–54. [Google Scholar] [CrossRef]
- Romano, M.; Kapelan, Z.; Savić, D.A. Automated detection of pipe bursts and other events in water distribution systems. J. Water Resour. Plan. Manag. 2012, 140, 457–467. [Google Scholar] [CrossRef]
- Jung, D.; Kang, D.; Liu, J.; Lansey, K. Improving the rapidity of responses to pipe burst in water distribution systems: A comparison of statistical process control methods. J. Hydroinform. 2015, 17, 307–328. [Google Scholar] [CrossRef]
- Hagos, M.; Jung, D.; Lansey, K.E. Optimal meter placement for pipe burst detection in water distribution systems. J. Hydroinform. 2016, 18, 741–756. [Google Scholar] [CrossRef]
- Jung, D.; Kim, J.H. Using Mechanical Reliability in Multiobjective Optimal Meter Placement for Pipe Burst Detection. J. Water Resour. Plan. Manag. 2018, 144, 04018031. [Google Scholar] [CrossRef]
- Wang, Y. Study of Pipe Hole Leakage Experiment and Numerical Simulation; Zhejiang University: Hangzhou, China, 2015. [Google Scholar]
- Koch, M.W.; Mckenna, S.A. Distributed Sensor Fusion in Water Quality Event Detection. J. Water Resour. Plan. Manag. 2011, 137, 10–19. [Google Scholar] [CrossRef]


| D (mm) | n | ||||||||
|---|---|---|---|---|---|---|---|---|---|
| 2 | 1 | 1/2 | 1/4 | 1/8 | 1/16 | 1/32 | |||
| 1200 | C | 14,410 | 7200 | 3600 | 1800 | 900 | 450 | 225 | |
| |ΔP|/m | BEP * | 36.435 | 24.783 | 12.749 | 5.939 | 2.726 | 1.304 | 0.674 | |
| 1 | 30.099 | 20.77 | 11.011 | 5.32 | 2.488 | 1.145 | 0.577 | ||
| 9 | 11.232 | 8.086 | 4.823 | 2.439 | 1.157 | 0.562 | 0.274 | ||
| 10 | 8.795 | 6.518 | 3.807 | 1.984 | 0.982 | 0.496 | 0.251 | ||
| 800 | C | 6400 | 3200 | 1600 | 800 | 400 | 200 | 100 | |
| |ΔP|/m | BEP * | 37.599 | 26.622 | 13.414 | 5.988 | 2.707 | 1.468 | 0.99 | |
| 1 | 12.137 | 9.133 | 5.248 | 3.156 | 1.764 | 1.136 | 0.85 | ||
| 9 | 3.973 | 3.142 | 1.934 | 1.328 | 0.794 | 0.532 | 0.403 | ||
| 10 | 2.822 | 2.27 | 1.455 | 1.048 | 0.656 | 0.458 | 0.355 | ||
| 600 | C | 3600 | 1800 | 900 | 450 | 225 | 112 | ||
| |ΔP|/m | BEP * | 23.27 | 11.018 | 4.405 | 2.369 | 1.355 | 0.946 | ||
| 1 | 8.956 | 5.02 | 2.402 | 1.768 | 1.143 | 0.852 | |||
| 9 | 4.141 | 2.373 | 1.209 | 0.883 | 0.576 | 0.425 | |||
| 10 | 3.039 | 1.832 | 0.959 | 0.733 | 0.495 | 0.374 | |||
| 400 | C | 1600 | 800 | 400 | 200 | 100 | |||
| |ΔP|/m | BEP * | 19.966 | 15.887 | 6.182 | 2.667 | 1.306 | |||
| 1 | 4.725 | 2.899 | 1.468 | 1.253 | 0.903 | ||||
| 9 | 1.261 | 0.845 | 0.468 | 0.525 | 0.401 | ||||
| 10 | 0.877 | 0.601 | 0.339 | 0.438 | 0.346 | ||||
| 300 | C | 1600 | 800 | 400 | 200 | ||||
| |ΔP|/m | BEP * | 21.78 | 9.517 | 3.467 | 1.622 | ||||
| 1 | 1.851 | 1.098 | 0.6 | 0.347 | |||||
| 9 | 0.943 | 0.579 | 0.31 | 0.16 | |||||
| 10 | 0.672 | 0.419 | 0.227 | 0.128 | |||||
| Sensor | 1# | 2# | 3# | 4# | 5# | 6# | 7# | 8# | 9# | 10# | 11# | 12# | 13# | 14# | Average |
|---|---|---|---|---|---|---|---|---|---|---|---|---|---|---|---|
| ΔPc i,t (m) | −1.15 | −1.8 | −1.1 | −1.4 | −1.0 | −1.2 | −1.3 | −1.9 | −1.2 | −1.2 | −1.1 | −1.0 | −1.0 | −1.0 | −1.24 |
| ΔPc s,i,t (m) | 1.38 | 1.45 | 1.4 | 1.8 | 1.4 | 1.6 | 1.9 | 2.0 | 1.4 | 1.6 | 1.4 | 1.5 | 1.5 | 1.6 | 1.57 |
| Node | 1# | 2# | 3# | 4# | 5# | 6# | 7# | 8# | 9# | 10# | 11# | 12# | 13# | 14# |
|---|---|---|---|---|---|---|---|---|---|---|---|---|---|---|
| Prc′ | 0.04 | 0.02 | 0.001 | 0.05 | 0.01 | – | 0.08 | 0.04 | 0.007 | 0.007 | 0.003 | 0.001 | 0.003 | – |
| Prc | 0.98 | 0.98 | 0.80 | 0.93 | 0.97 | – | 0.93 | 0.97 | 0.985 | 0.98 | 0.98 | 0.98 | 0.97 | – |
| ΔPi,t (m) | −3 | −2.9 | −0.4 | −1.4 | −2.3 | – | −1 | −2.4 | −3.3 | −2.9 | −2.7 | −3.3 | −2.4 | – |
| ΔPs,i,t (m) | 3.2 | 3.1 | 0.6 | 1.6 | 2.5 | – | 1.2 | 2.6 | 3.5 | 3.1 | 2.9 | 3.5 | 2.6 | – |
| mark | 1 | 1 | 0 | 0 | 1 | – | 0 | 1 | 1 | 1 | 1 | 1 | 1 | – |
© 2019 by the authors. Licensee MDPI, Basel, Switzerland. This article is an open access article distributed under the terms and conditions of the Creative Commons Attribution (CC BY) license (http://creativecommons.org/licenses/by/4.0/).
Share and Cite
Cheng, W.; Xu, G.; Fang, H.; Zhao, D. Study on Pipe Burst Detection Frame Based on Water Distribution Model and Monitoring System. Water 2019, 11, 1363. https://doi.org/10.3390/w11071363
Cheng W, Xu G, Fang H, Zhao D. Study on Pipe Burst Detection Frame Based on Water Distribution Model and Monitoring System. Water. 2019; 11(7):1363. https://doi.org/10.3390/w11071363
Chicago/Turabian StyleCheng, Weiping, Gang Xu, Hongji Fang, and Dandan Zhao. 2019. "Study on Pipe Burst Detection Frame Based on Water Distribution Model and Monitoring System" Water 11, no. 7: 1363. https://doi.org/10.3390/w11071363
APA StyleCheng, W., Xu, G., Fang, H., & Zhao, D. (2019). Study on Pipe Burst Detection Frame Based on Water Distribution Model and Monitoring System. Water, 11(7), 1363. https://doi.org/10.3390/w11071363