Article

Hybrid Methodology for the Estimation of Crop Coefficients Based on Satellite Imagery and Ground-Based Measurements

by
Marios Spiliotopoulos
1,* and
Athanasios Loukas
2
1
Laboratory of Hydrology and Aquatic Systems Analysis, Department of Civil Engineering, University of Thessaly, 383 34 Volos, Greece
2
Department of Rural and Surveying Engineering, Aristotle University of Thessaloniki, 541 24 Thessaloniki, Greece
*
Author to whom correspondence should be addressed.
Water 2019, 11(7), 1364; https://doi.org/10.3390/w11071364
Submission received: 4 April 2019 / Revised: 13 June 2019 / Accepted: 25 June 2019 / Published: 30 June 2019

Abstract

:
The objective of the current study was the investigation of specific relationships between crop coefficients and vegetation indices (VI) computed at the water-limited environment of Lake Karla Watershed, Thessaly, in central Greece. A Mapping ET (evapotranspiration) at high Resolution and with Internalized Calibration (METRIC) model was used to derive crop coefficient values during the growing season of 2012. The proposed methodology was developed using medium resolution Landsat 7 ETM+ images and meteorological data from a local weather station. Cotton, sugar beets, and corn fields were utilized. During the same period, spectral signatures were obtained for each crop using the field spectroradiometer GER1500 (Spectra Vista Corporation, NY, U.S.A.). Relative spectral responses (RSR) were used for the filtering of the specific reflectance values giving the opportunity to match the spectral measurements with Landsat ETM+ bands. Normalized Difference Vegetation Index (NDVI), Soil Adjusted Vegetation Index (SAVI) and Enhanced Vegetation Index 2 (EVI2) were then computed, and empirical relationships were derived using linear regression analysis. NDVI, SAVI, and EVI2 were tested separately for each crop. The resulting equations explained those relationships with a very high R2 value (>0.86). These relationships have been validated against independent data. Validation using a new image file after the experimental period gives promising results, since the modeled image file is similar in appearance to the initial one, especially when a crop mask is applied. The CROPWAT model supports those results when using the new crop coefficients to estimate the related crop water requirements. The main benefit of the new approach is that the derived relationships are better adjusted to the crops. The described approach is also less time-consuming because there is no need for atmospheric correction when working with ground spectral measurements.

1. Introduction

Vegetation indices (VIs) using a combination of surface reflectance values between two or more spectral bands have been introduced for many decades in the literature [1]. More than 150 VIs have been published until now, but only a small part of them has been systematically studied [2,3,4]. A very detailed presentation of the most important categories of VI was performed by Asner et al. [5]. Studying various VIs, and correlating them to known measurements, it is feasible to assess the most appropriate set of VIs for any application [3,4,6].
Crop water use information is very crucial for irrigation water supply scheduling and is directly related to evapotranspiration (ET).
ET is a combination of the water evaporated from the soil surface and transpired through the plant [7] and it can be measured using lysimeters, evaporation pans, and atmometers incorporating climate data. The problem is that ET information must be adjusted every time to correspond to each crop and climate, and that is why the concept of reference ET (ETr) is introduced in the literature [7]. Once ETr has been determined, a crop coefficient (Kc) value must be applied to adjust the ETr value for the type of crop being irrigated according to the local climate and soil conditions. For the computation of Kc, the following formula is generally applied [7]:
Kc = ETc/ETr,
where ETc is the crop ET or crop water use in mm (ET from now on), ETr is the calculated reference ET for grass (mm) and Kc is the crop coefficient (unitless). The crop coefficient adjusts the calculated ETr to obtain the crop ET. Different crops result to different crop coefficients and variable water use. Crop coefficients primarily depend on the dynamics of canopies, light absorption by the canopy, and canopy roughness, which affects turbulence, crop physiology, leaf age, and surface wetness [8].
Many studies estimating the correlation between ET and VIs have been implemented, until now [9,10,11,12,13]. Many remote sensing-based VIs have estimated crop coefficient values (Kc) at the field scale for cotton [14], beans [14,15] maize [9,13,14,15,16,17], or wheat [18], among others. The related procedure for the assessment of the relationships between VIs and Kc is highly recommended today [13,19,20,21,22,23]. One of the most prevalent remote sensing approaches for the assessment of Kc by utilizing Normalized Difference Vegetation Index (NDVI) is called the Kc–NDVI approach [24,25]. With the Kc–NDVI approach, the effect of crop transpiration and soil evaporation is combined into a single Kc. Linear relationships are then derived, estimating Kc from remotely sensed NDVI [24]. High NDVI values generally indicate a greater level of photosynthetic activity, and this is the reason why several researchers [9,11,26,27,28,29,30,31,32] have proposed that NDVI could be used to satisfactorily predict “basal” crop coefficients. NDVI has been also widely used for crop yield assessment and vegetation monitoring, as well as drought detection [8,28,32,33,34,35,36]. That is why NDVI, applied also at this work, is one of the most prevailing VIs worldwide today [8,21,37].

1.1. Field Spectroscopy

Field spectroscopy, also utilized in the present work, measures the spectral characteristics of ground surfaces in the natural environment [38,39,40], and can be used for the study of temporal spectral behavior of crops. The science of spectroscopy has been also used for the combination of data originating from different platforms [41]. Practically speaking, battery powered spectroradiometers measure radiance, irradiance and reflectance in the field. For this study, a GER1500 (Spectra Vista Corporation, NY, U.S.A.) instrument was used, kindly provided by the Cyprus University of Technology. The specific instrument (Figure 1) [42] is a high-performance instrument covering 512 spectral bands in wavelengths from 350 nm to 1050 nm. The instrument utilizes a “Lambertian” surface as a reference panel, where reflectance is generally >99 percent over a range from 400 to 1500 nm [42]. More details about the specific instrument can be found at [41,42]. The reflectance value for each channel can then be simply obtained just by applying the ratio of reflected radiance from the crops to the reflectance radiance from the reference panel.

1.2. METRIC Model

Mapping ET at high Resolution and with Internalized Calibration (METRIC) [43,44,45] is one of the most prevalent energy balance (EB) models today [45,46]. The METRIC model was used at the current study for the computation of ET fraction (ETrF). ETrF is defined as the ratio of satellite image ET to ETr, and it corresponds to the crop coefficient (Kc) [46]. ETrF generally varies with the crop type and the development stage of the crop [46].
The basic concept of METRIC methodology is the estimation of actual ET (ETa) as a residual of the land surface EB [43,44,45]:
λETa = RnGH,
where λETa is the latent heat flux (W/m2), Rn is net radiation (W/m2), G is soil heat flux (W/m2), and H is sensible heat flux (W/m2).
Rn can be computed from the land surface radiation balance as:
Rn = RS − α RS + RLRL − (1 − εo)RL,
where α is surface albedo, RS (W/m2) is the incoming solar radiation, RL (W/m2) is incoming long wave radiation, RL (W/m2) is the outgoing long wave radiation, and εo is the broad band surface emissivity [43,44,45]. In this study, G (W/m2) was empirically estimated using the function of Bastiaanssen et al. [43,44]:
G R n = L S T α ( 0.0038 α + 0.0074 α 2 ) × ( 1 0.98 ×   N D V I 4 ) ,
where LST is land surface temperature (K). The rate of heat flux to air by conduction and convection H (W/m2) for neutral atmospheric conditions can be calculated by [44,45,46]:
H = ( ρ × c p × d T ) r a h ,
where ρ is air density (kg/m3), cp is air specific heat capacity (1004 J·kg−1·K−1), dT (K) is the temperature difference (T1T2) between two specific reference heights (z1 and z2), and rah is aerodynamic resistance to heat transport (s·m−1). rah is the first unknown parameter of Equation (5) and can be computed (Equation (6)) for neutral stability applying the following:
r a h = ( ln z 2 z 1 ) u × k   ,
where z1 and z2 are heights (m) above the zero-plane displacement, u* is friction velocity (m/s), and k is von Karman’s constant (0.41) [43,44,45]. Friction velocity (u*) can be computed using the logarithmic wind law (Equation (7)) for neutral atmospheric conditions:
u = ( k × u x ) ( ln z x z o m ) ,
where k is von Karman’s constant, ux is the wind speed (m/s) at height zx, and zom is the momentum roughness length (m). Roughness length is a very important parameter because is a measure of interaction between the surface and the adjacent layer of air above. Wind speed at 200 m above the weather station (u200) was finally calculated using:
u 200 = u × ( ln 200 z o m ) k ,
where u* is the friction velocity measured at the weather station. This calculation can be done on a spreadsheet. Momentum roughness length (zom) at the station can be empirically estimated using the following formula [47]:
z o m = 0.12 × h ,
where h is the vegetation height (m).
Friction velocity (u*) for each pixel was finally computed using:
u = ( k × u 200 ) ( ln 200 z o m ) ,
where zom is the particular momentum roughness length defined for each pixel. u200 is assumed to be constant for all the pixels of the image since it is unaffected by surface features [43,44,45]. For the study area, which is a typical agricultural region, zom can be calculated as a function of LAI [43,44,45]:
z o m = 0.018 × L A I .
For the second unknown parameter of Equation (5), METRIC methodology suggests a linear change in dT with LST:
d T = a × L S T +   b   ,
where a and b are correlation coefficients, while dT is defined as the difference between the air temperature very near the surface (at 0.1 m above the zero-plane displacement height) and the air temperature at 2.0 m above the zero-plane displacement height [47,48]. In order to estimate the constants a and b, “cold” and “hot” pixels are selected from the satellite image. METRIC methodology suggests that a “cold” pixel is a pixel representing a wet, well-irrigated crop surface with full vegetation cover [43]. A pixel having a high value of LAI and low LST is a very good candidate for a “cold” pixel. In contrast, a “hot” pixel is a pixel representing a dry region, a typical case of a harvested agricultural field. That is a field where all the energy is used for heating the surface (ET = 0). A pixel having low LAI and high LST values is a very good candidate for a “hot” pixel [43]. For the assessment of that pixels, a pseudo-color image was created for each of the LAI and LST maps in order to acquire a better visualization of the prevailing differences between the images. METRIC methodology suggests that those two reference pixels must be located near the reference weather station situated in the Karla watershed. After applying that procedure, cold and hot pixel candidates were recorded and carefully selected for each image according to the above criteria. Finally, H values can be computed fitting a line, according to Equation (12) and solving Equation (5) assuming neutral atmospheric conditions, meaning that no atmospheric stability or instability existed in the region. METRIC finally suggests an iterative process for the correction of possible atmospheric instability applying Monin–Obukhov theory [48]. New dT values, applying Equation (12), can then be computed for the “cold” and “hot” pixels according to the estimated values of a and b, and a new corrected value for H can be repeatedly computed. This procedure is applied until H stabilizes. A more detailed description of the whole procedure can be found in Bastiaanssen et al. [43]. The final step of METRIC is the computation of ETrF, assuming that is constant over the day, using the ETa in mm and:
ET r F = ET a / ET r .
METRIC, as well as all current EB methodologies, usually require complex computational techniques and trained personnel. ETrF values at this study were initially derived from METRIC methodology, and were then modeled through linear regression analysis. The ETrF–NDVI approach can be much simpler than any EB models, less data intensive, and, most importantly, can be completed within a shorter period of time [26]. The objective of the current study was to take advantage of VI values derived from ground spectroradiometer and test the prevailing accuracy of the ETrF–VI approach.

1.3. Study Area

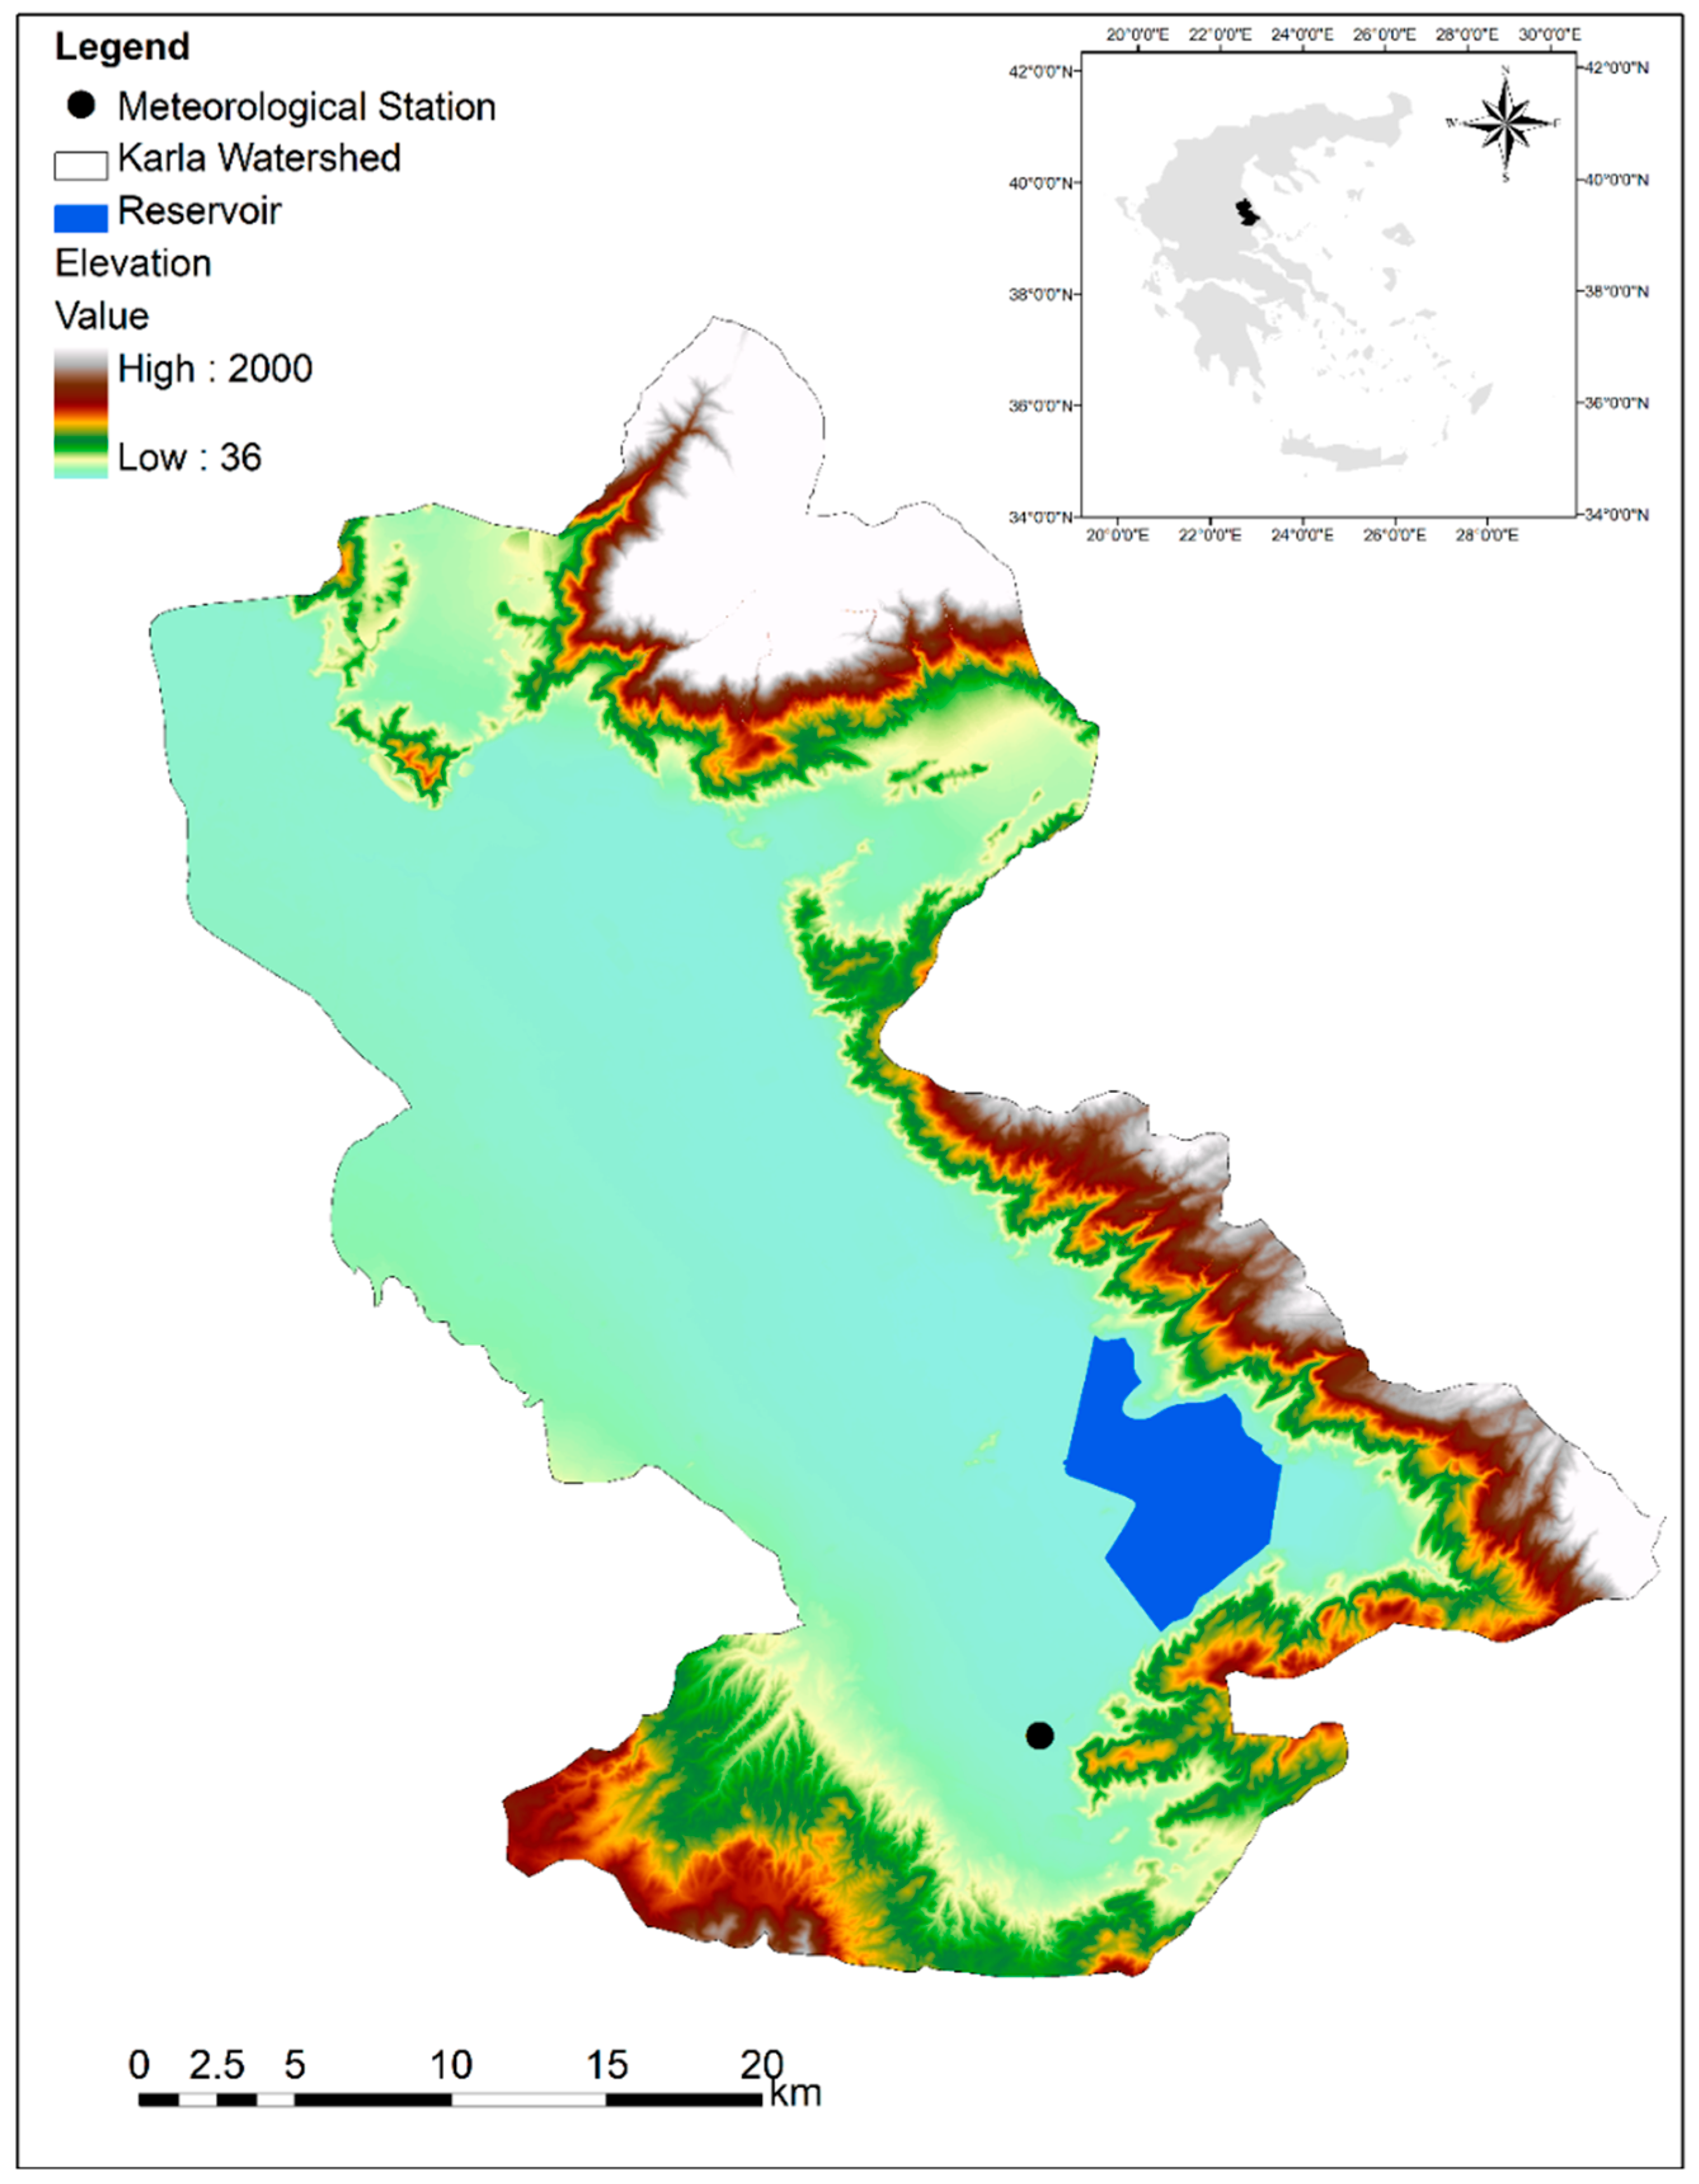
Lake Karla watershed (Figure 2) is a typical Mediterranean agricultural region, located at the eastern part of Thessaly (39°21′ to 39°45′ N and 22°26′ to 23°0′ E). Mild but rainy winter seasons, and relatively warm and dry summer seasons, are the most common situations in the region, while extended periods of sunshine do occur throughout most of the year. The average temperature is about 17 °C, the mean annual relative humidity is about 67–72 percent, and the average annual precipitation is about 500–700 mm [49,50]. Most of the area is plain, with an altitude ranging from 45 to 65 m a.s.l. Cultivated crops in Lake Karla occupy an area of 375.000 km2 [50].

2. Materials and Methods

Twenty-one cloud-free Landsat ETM+ images, along with a series of GER1500 in-situ data, were utilized in the current study (Table 1). Satellite data were downloaded using the GloVis tool from the U.S. Geological Survey (USGS), and they were adjusted to the Greek EGSA 87 coordinate system. ENVI 5.0 and ERDAS Imagine 9.2 Modeler software were used for the appropriate interpretation and analysis of the remote sensing images. Data related with spatial gaps of Landsat 7 imagery due to the failure of scan line correction were not utilized in this study.
Air temperature, wind, relative humidity, and radiation values were collected from a meteorological station of Karla area (Figure 2) for the growing season (April–October) of 2012. Meteorological data were used as input parameters for the application of METRIC, as well as for the computation of ETr. REF-EF (Reference Calculation) software has also been utilized [51], considering ASCE Penman–Monteith Standardized Form, as it represents a tall alfalfa surface that best represents the ET from highly vegetated pixels [47,52].
Table 1 presents the specific field experiment days. Cotton, sugar beet, and corn fields were utilized, and all in-situ measurements using GER1500 instrument were repetitive over the same fields for the whole growing season, for consistency reasons. A few time gaps may be found between in-situ measurements and the available satellite data due to the availability of the device. This adversity has been overtaken by applying cubic splines [53].
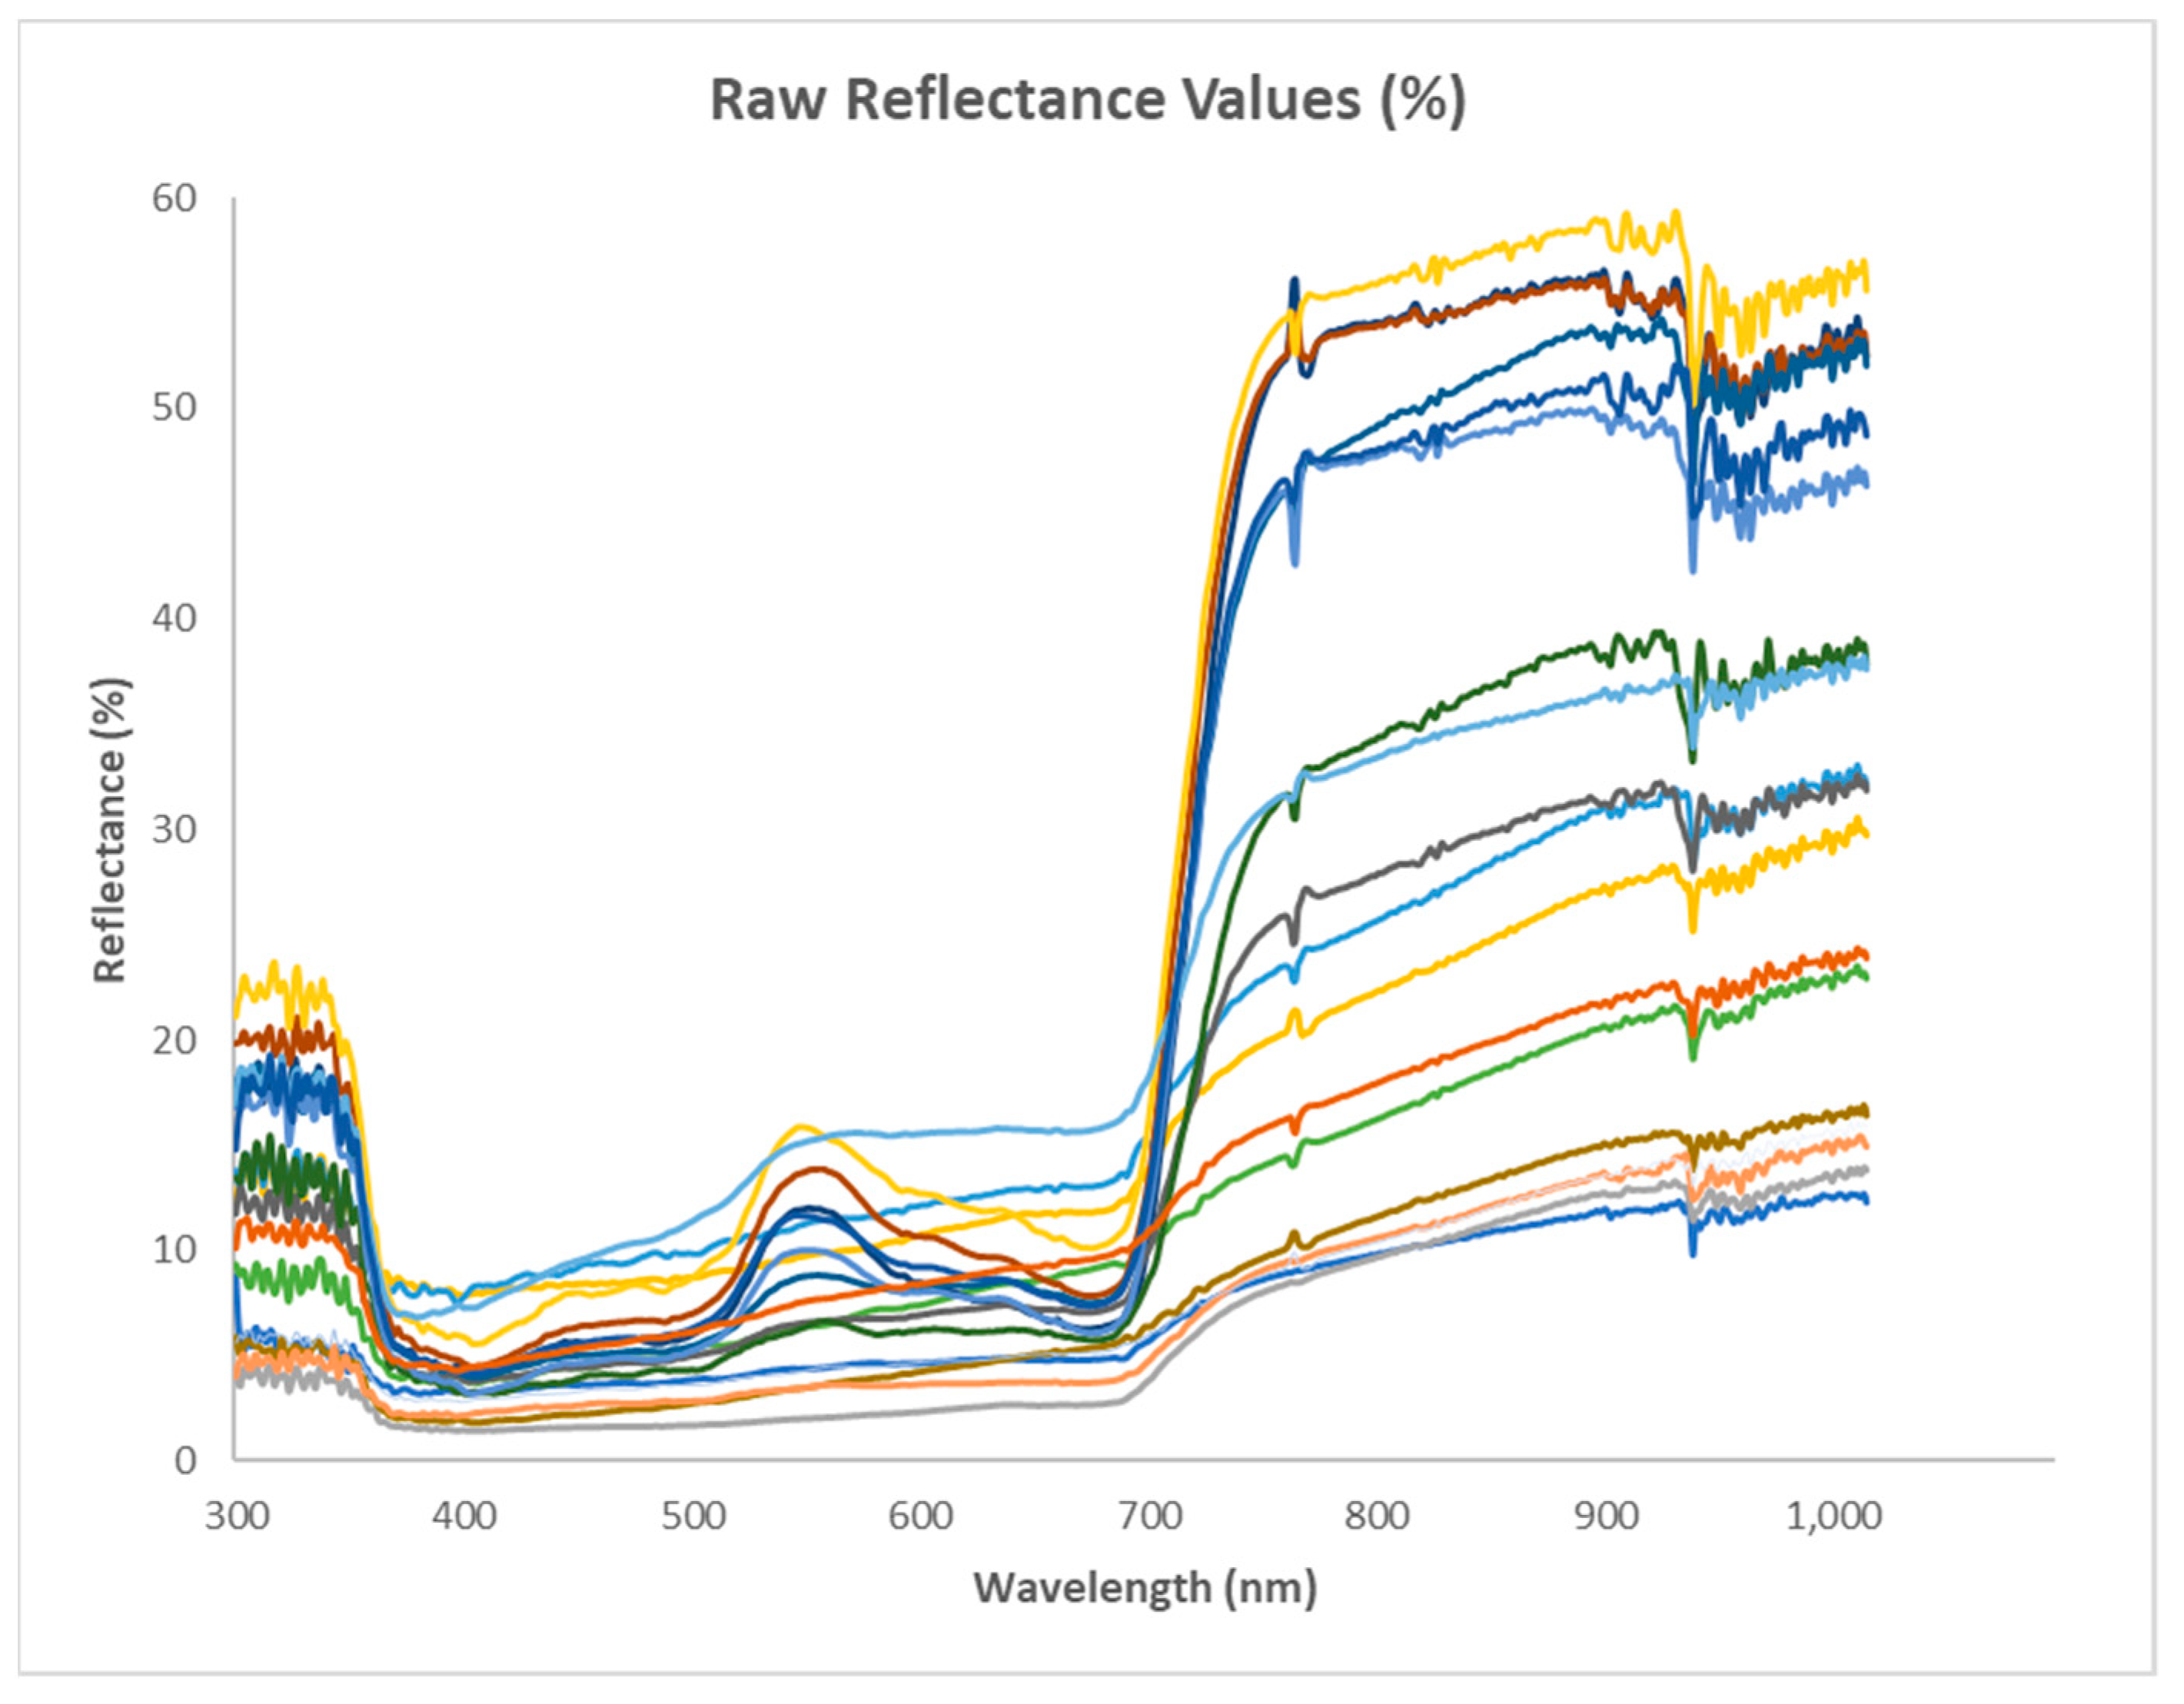
An average of twenty separate in-situ measurements for each experiment day was implemented for each crop (Figure 3). The recorded reflectance values refer to point measurements at the experiment fields. Those points are assigned to geographically corresponding 30 m × 30 m pixels recorded from ETM+, which are representative of 100% coverage of a specific crop. Surface reflectance values were then retrieved for the calculation of VIs.
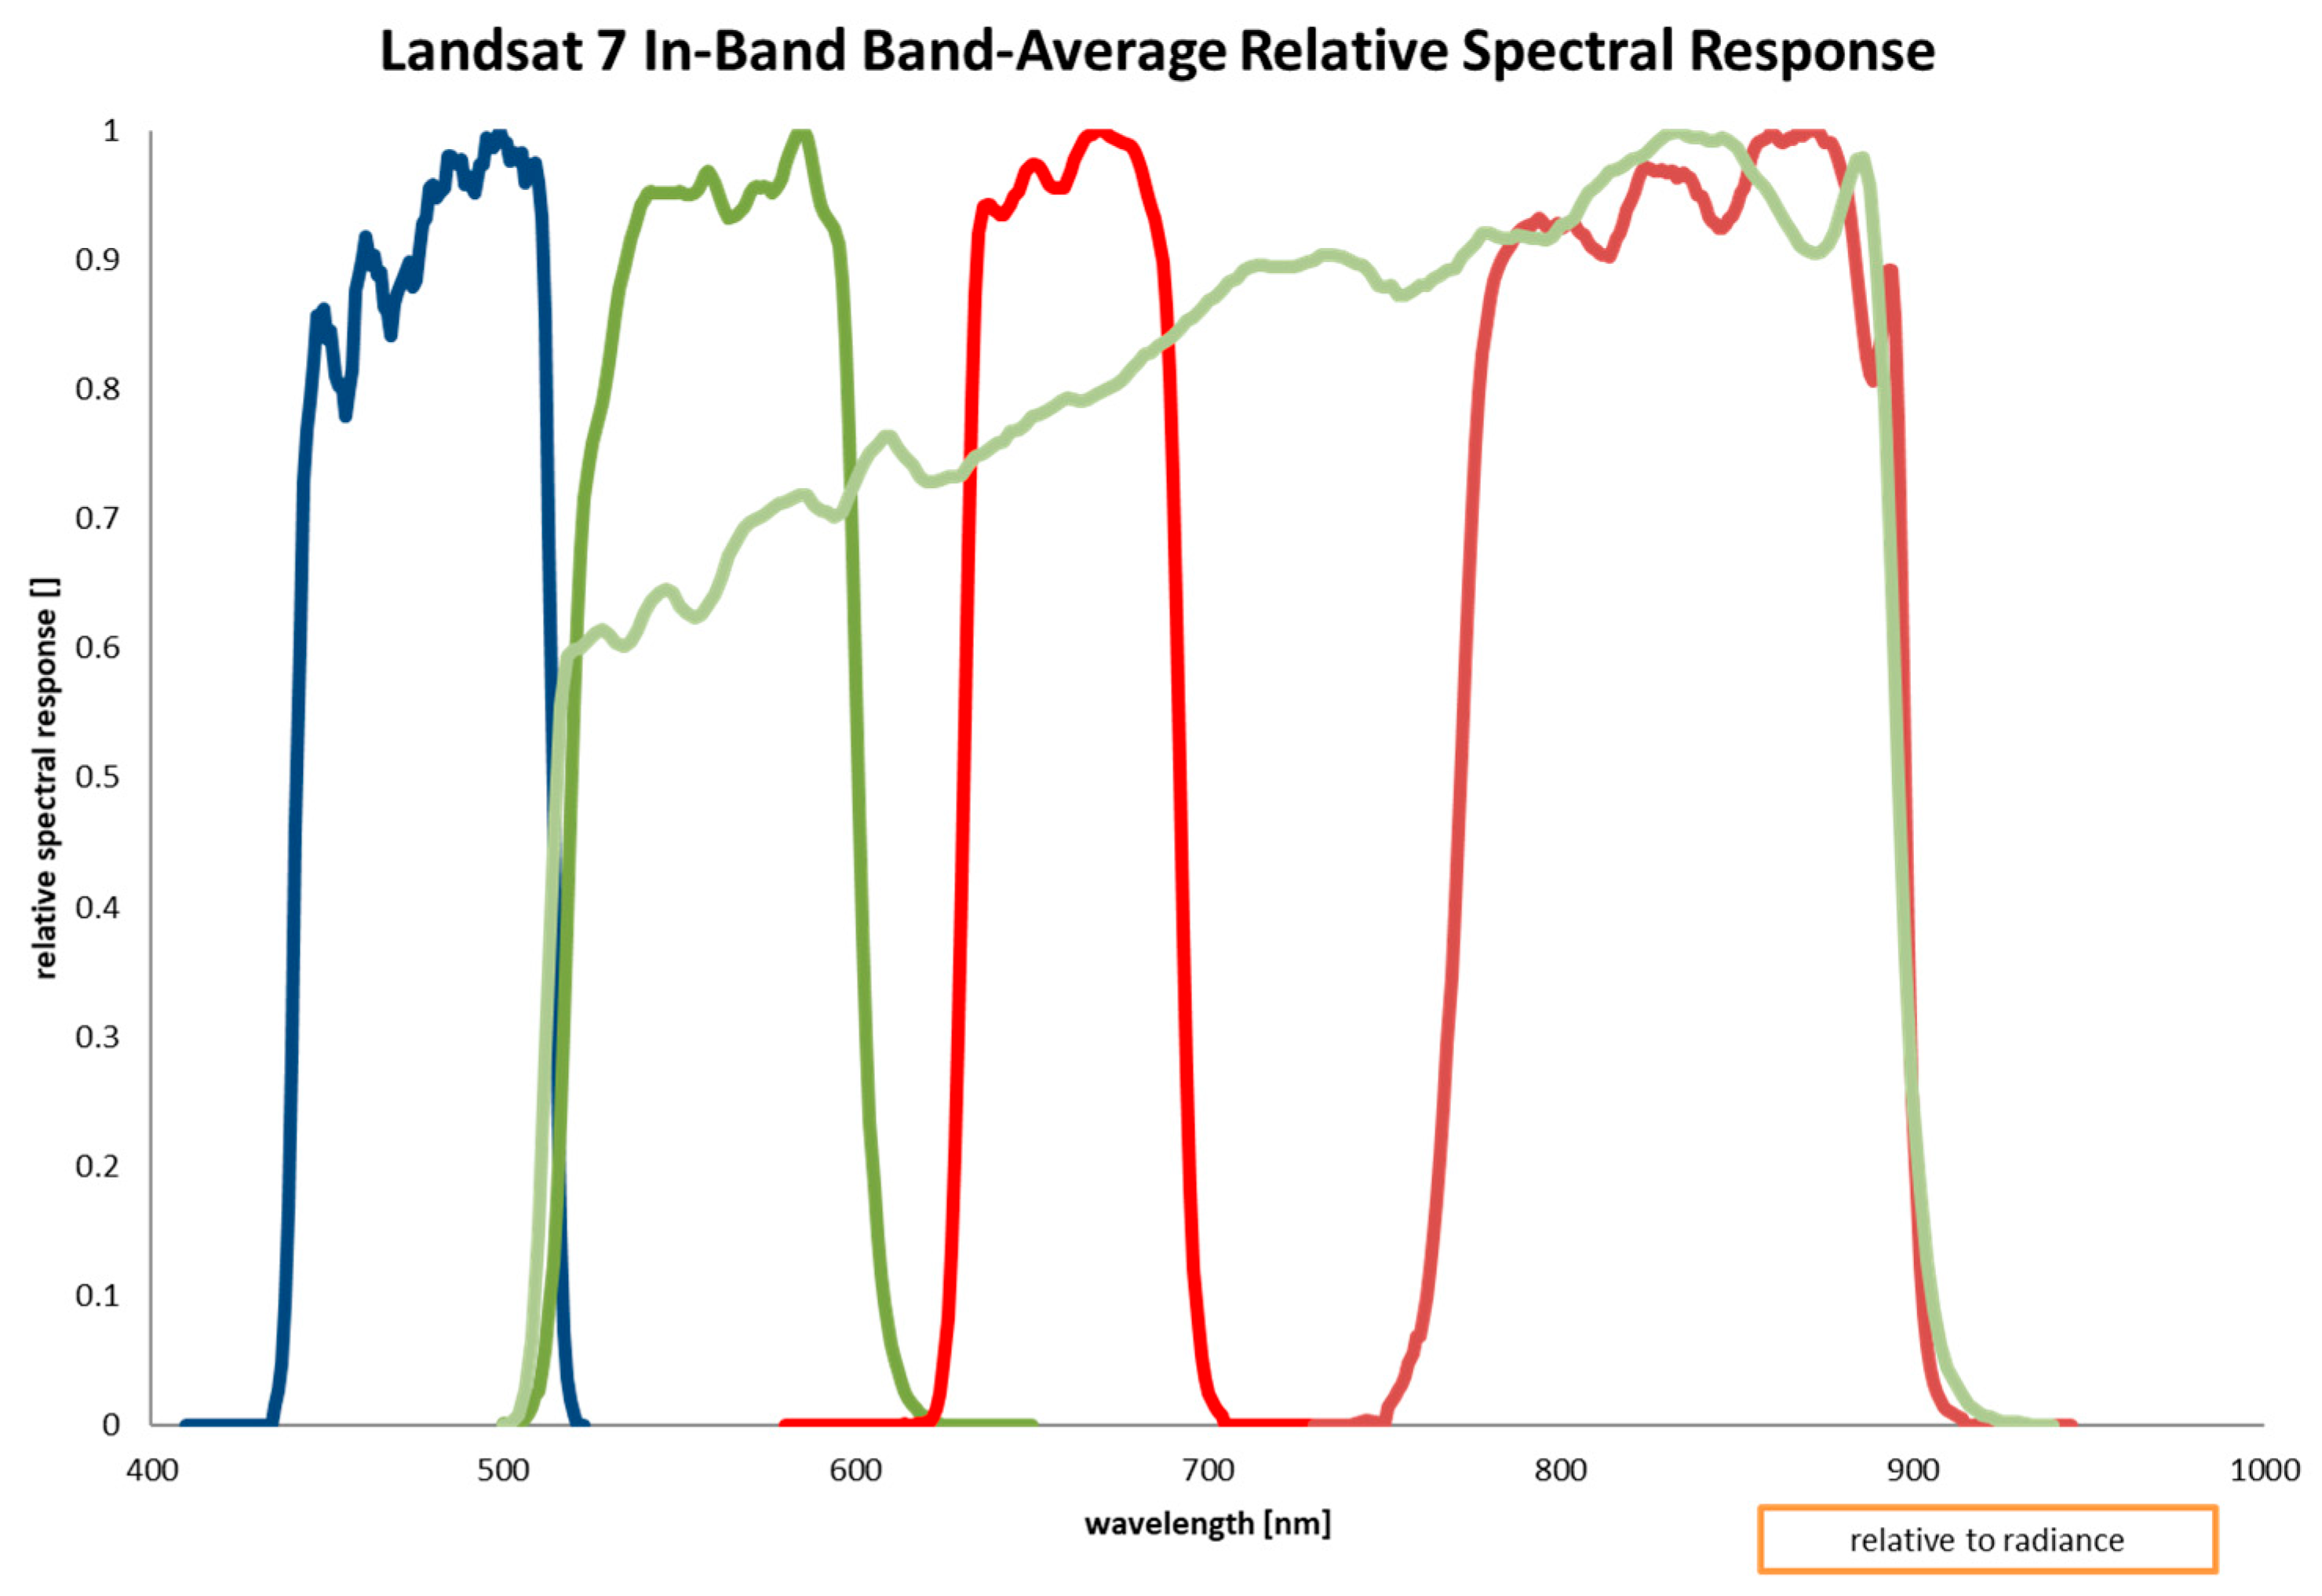
The problem faced is that the specific in-situ reflectance values were recorded at a non-integer wavelength scale (e.g., 449.81, 451.48, 453.15 nm) in 512 channels, while Landsat-based reflectance values were given in the usual wavelength scale (specific bands as visible, infrared, etc.). It was then necessary to generate adjusted values as integers (450, 451, 452 nm, etc.), using interpolation and applying filtering through the relative spectral response (RSR) functions (Figure 4) [54]. Using ETM+ RSR functions (SRF) [54] and computing the average within the range of wavelengths of every ETM+ band, it was easy then to obtain the equivalent in-band reflectance values [41,55].
After calculating raw reflectance values using ground measurements, the next step was the calculation of VIs. NDVI, SAVI, and EVI2 were selected for the final processing [5]. EVI2 is a very convenient variation of Enhanced Vegetation Index (EVI) as explained in [49,56,57]. Those indices use only two spectral bands for their formulation, resulting in relatively easy processing, which is a very important parameter in choosing them for processing, along with previous experience [33,36,58]. The related formulas used for the computations of the above indices are:
N D V I = N I R R E D N I R + R E D ,
S A V I = ( 1 + L ) × N I R R E D ( N I R + R E D + L ) ,
E V I 2 = 2.5 × N I R R E D ( N I R + 2 R E D + 1 ) ,
where NIR and RED refer to reflectance at the Near Infrared and Red spectral bands respectively, and L is a constant [5].
After computing VIs, the METRIC model was employed, using all available satellite data (Table 1). The final products of METRIC were ETa and ETrF file maps with the typical 30 m × 30 m Landsat spatial resolution. ETrF values were computed on a pixel-by-pixel basis, being easy enough to find the coordinates of the ground measurements and plot the related ETrF values against VI throughout the growing season of 2012. The same procedure was repeated for all the examined crops, and then empirical relationships between ETrF and VI were obtained using linear regression analysis [13,19,20,21,22,23]. A general relationship was finally established, incorporating the effects of all the examined crops for NDVI, SAVI, and EVI2.
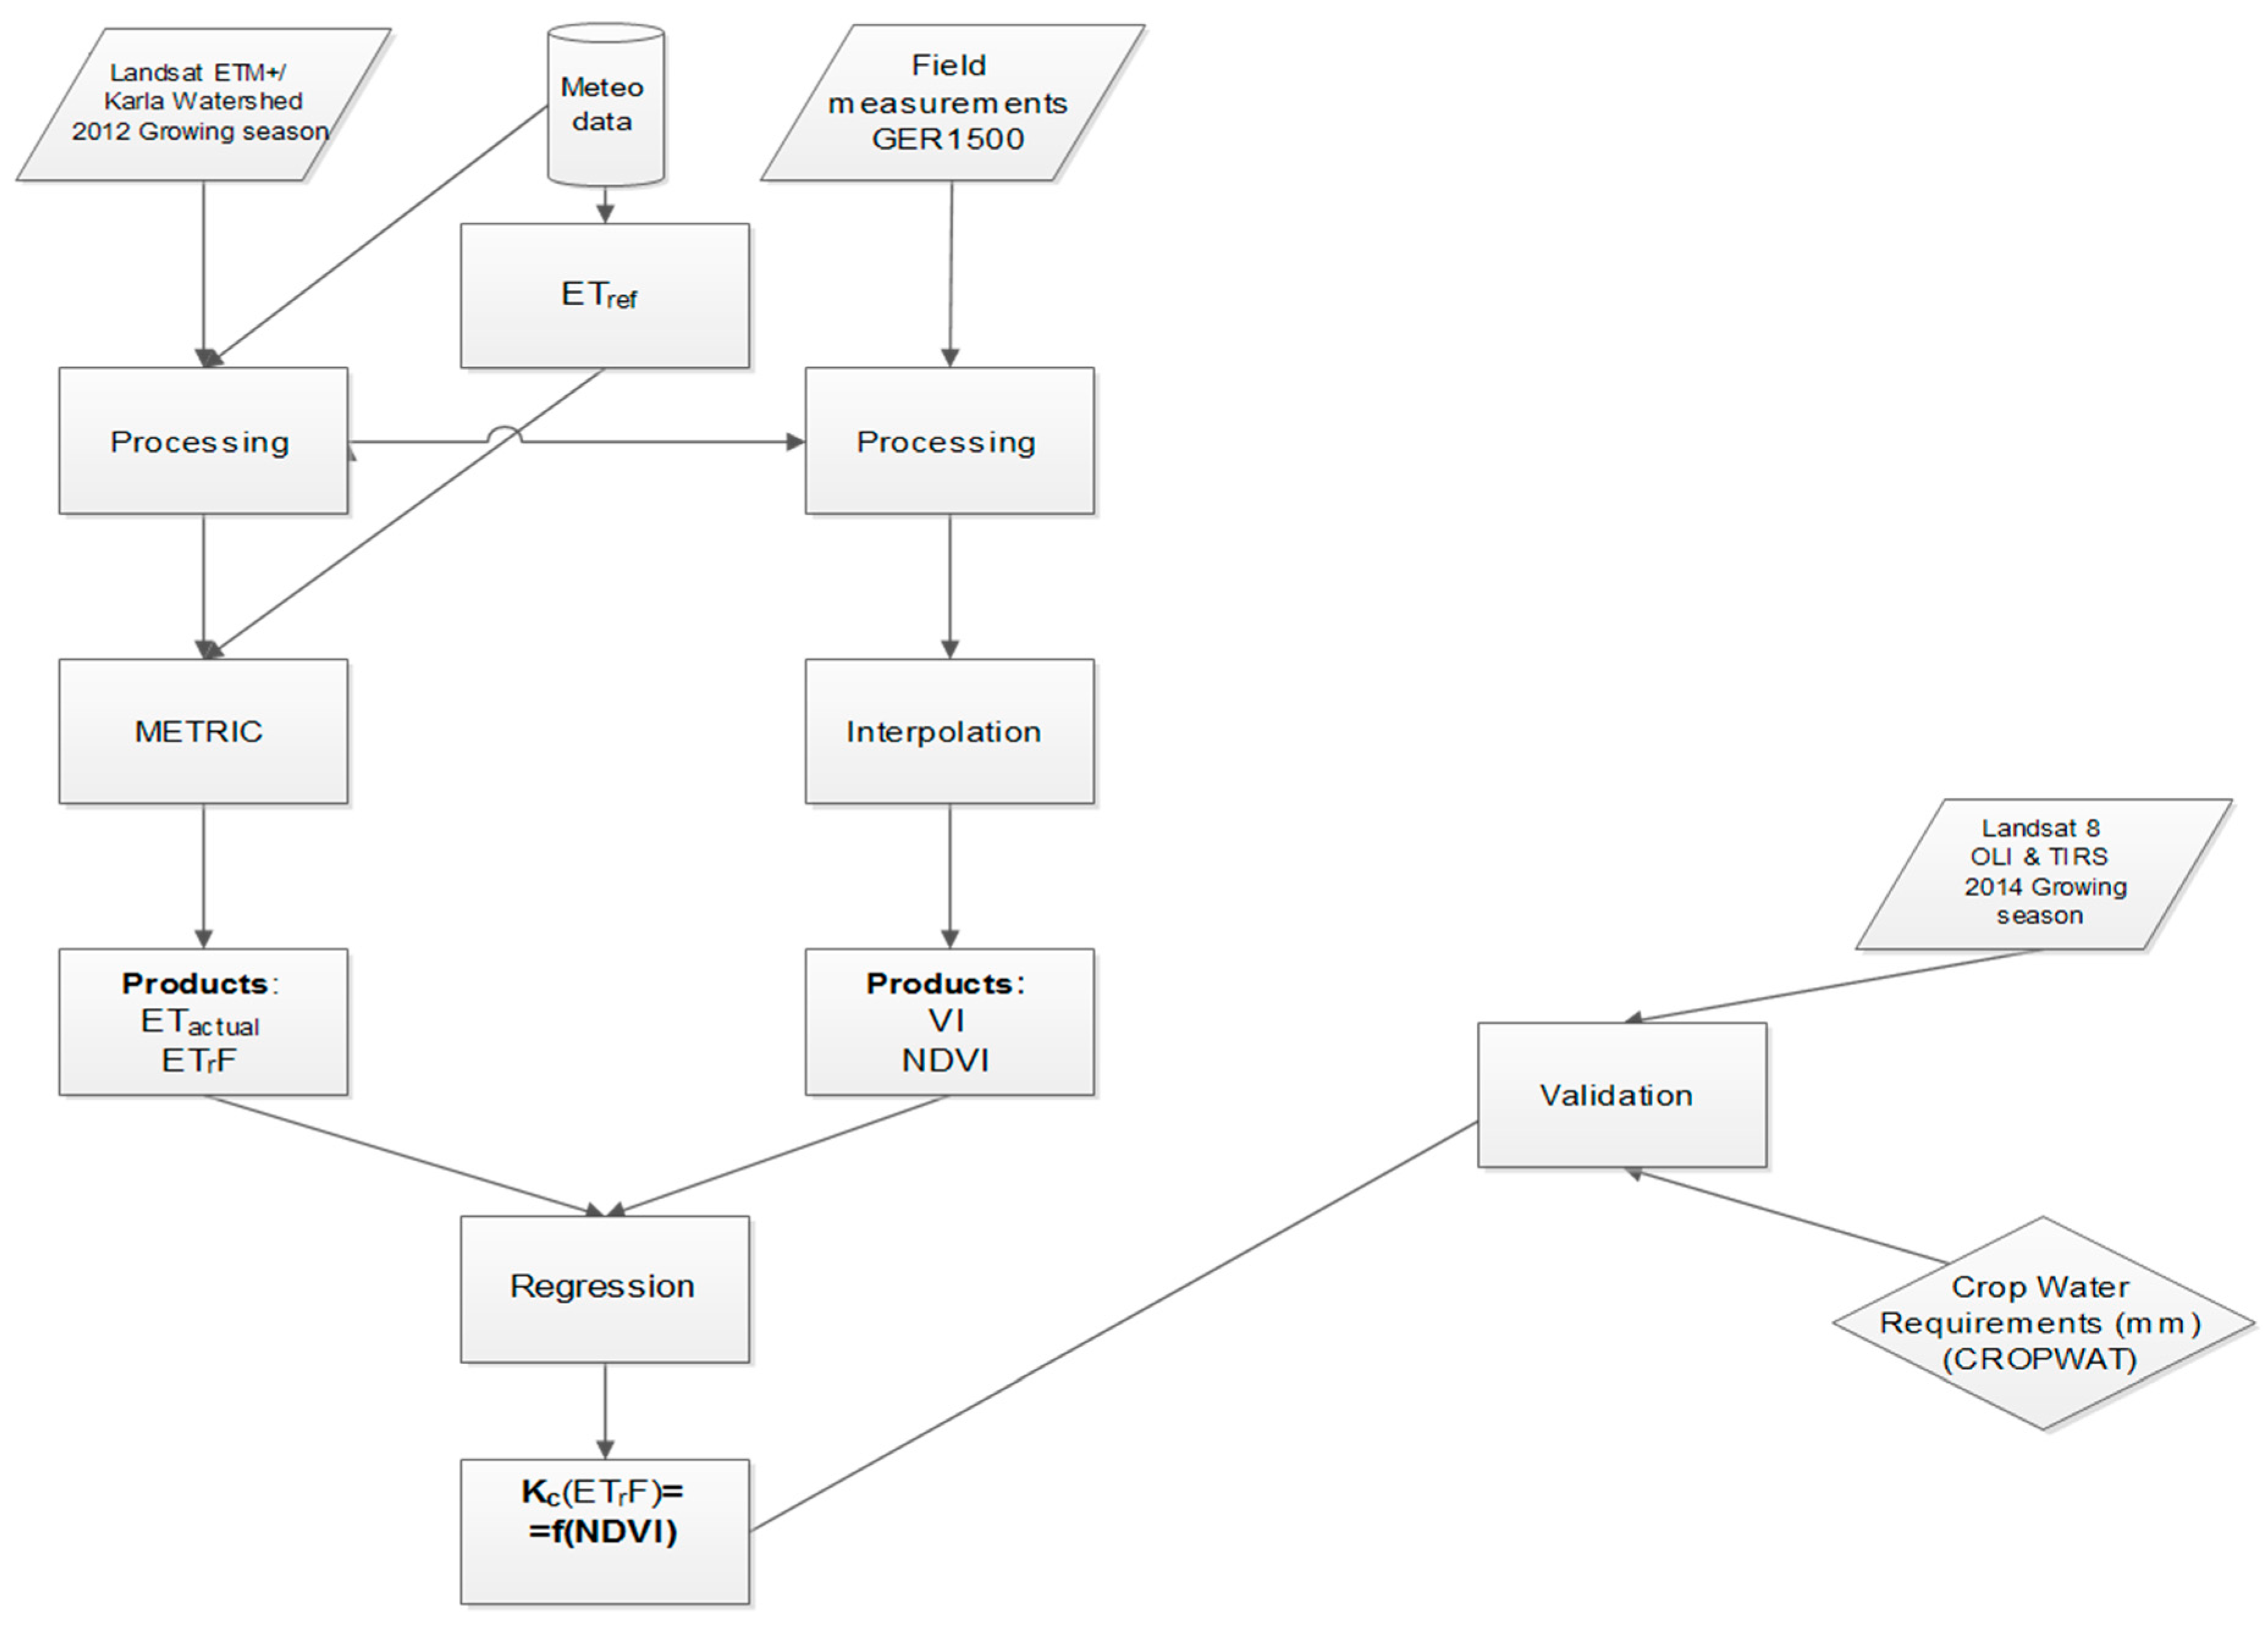
A new image file from the same region during 14 June of 2015 was then utilized for the validation of the previous derived relationships. A similar methodology related with the initial 2012 images was followed. Landsat 8 Operational Land Imager (OLI) and Thermal Infrared Sensor (TIRS) imagery has been utilized for that reason. A new METRIC-based ETrF map and the related VI values were then computed for the new date. The derived linear equations were applied to that case, and a new modeled ETrF image file was generated. Modeled ETrF values and METRIC ETrF values were finally compared, applying statistics. Finally, a CROPWAT model developed by the Land and Water Development Division of FAO [59] was tested for the validation of the previous results. CROPWAT, based on soil, climate, and crop data, is a well-known decision support tool for the calculation of crop water requirements and irrigation requirements [59]. Satellite-based crop data were incorporated into CROPWAT for the computing methodology, giving daily crop water requirements. The methodology followed is illustrated in Figure 5.

3. Results and Discussion

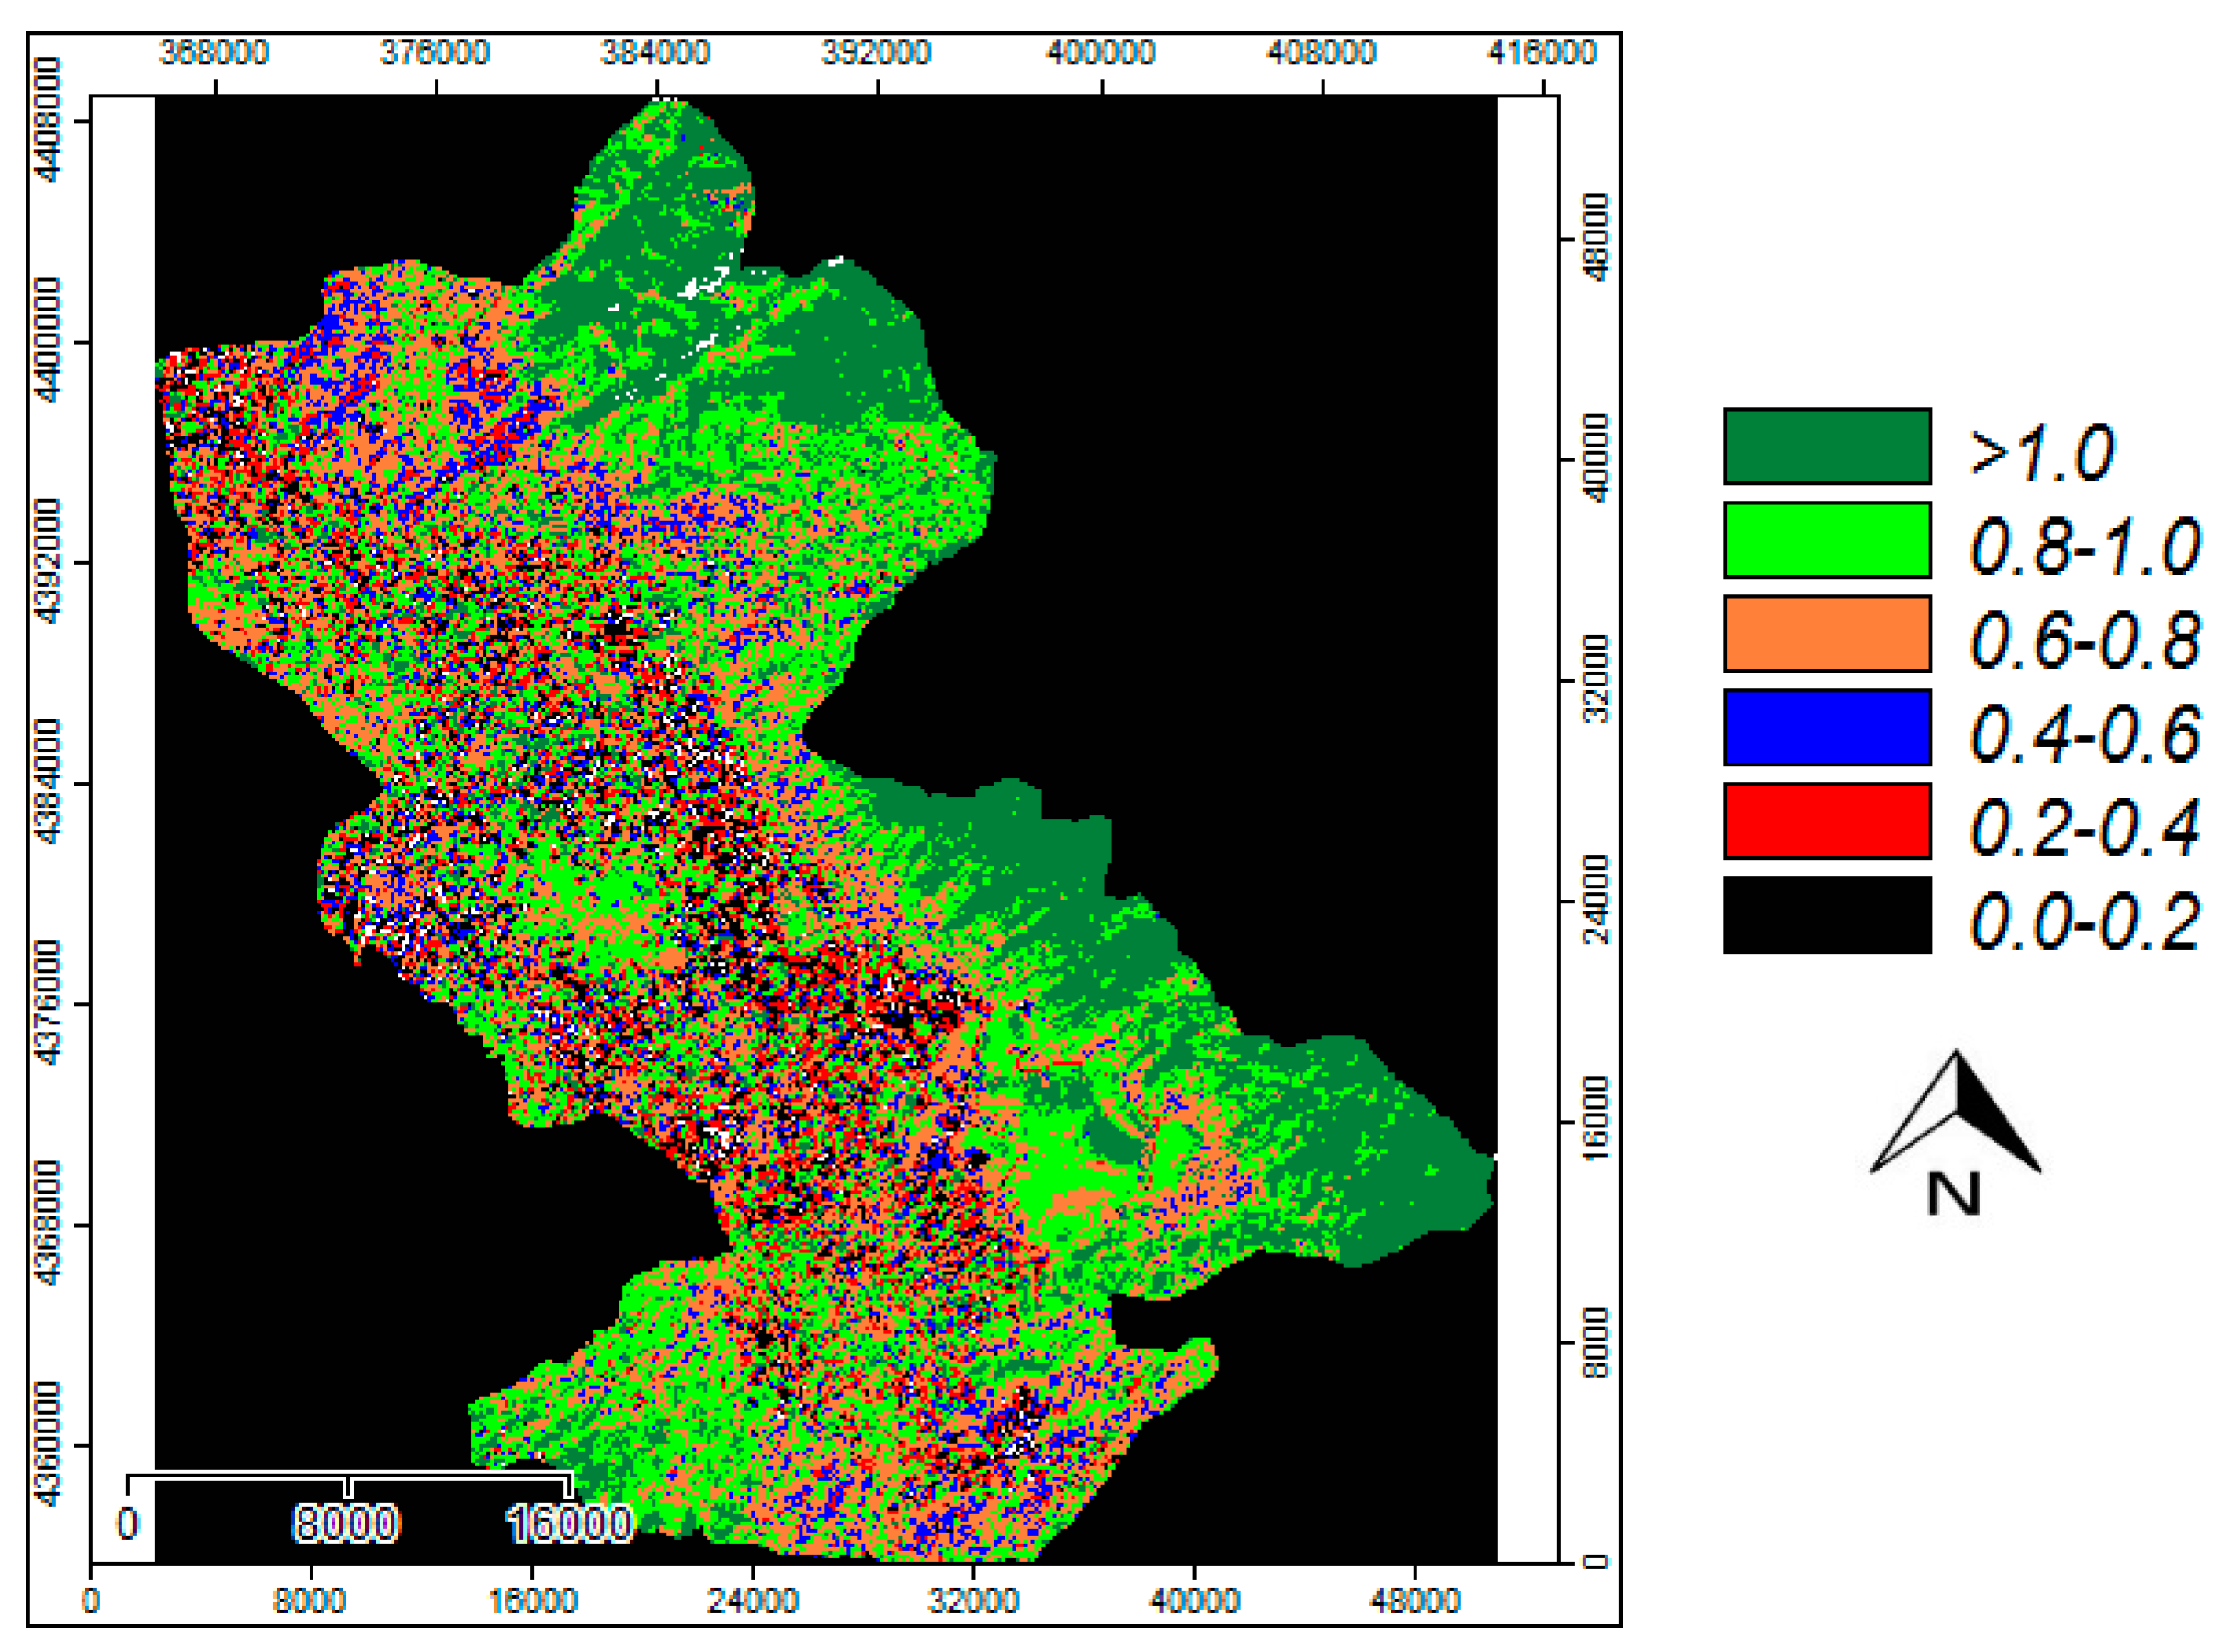
Twenty-one METRIC-based ETrF image files were first computed for the study area on a pixel-by-pixel basis. Figure 6 illustrates a typical image file for June (13 June 2012). The overall behavior of the images was totally expected, since agricultural areas have higher ETrF values than bare soil and rocks, depending to the season. There was also a very clear discrimination of water, bare, or agricultural surfaces. All those results are in agreement with previous similar studies over the region [49,60,61,62]. ETrF values corresponding to the crops under consideration were then recorded on a spreadsheet. The related fields were chosen from GPS tracks during the field experiments.
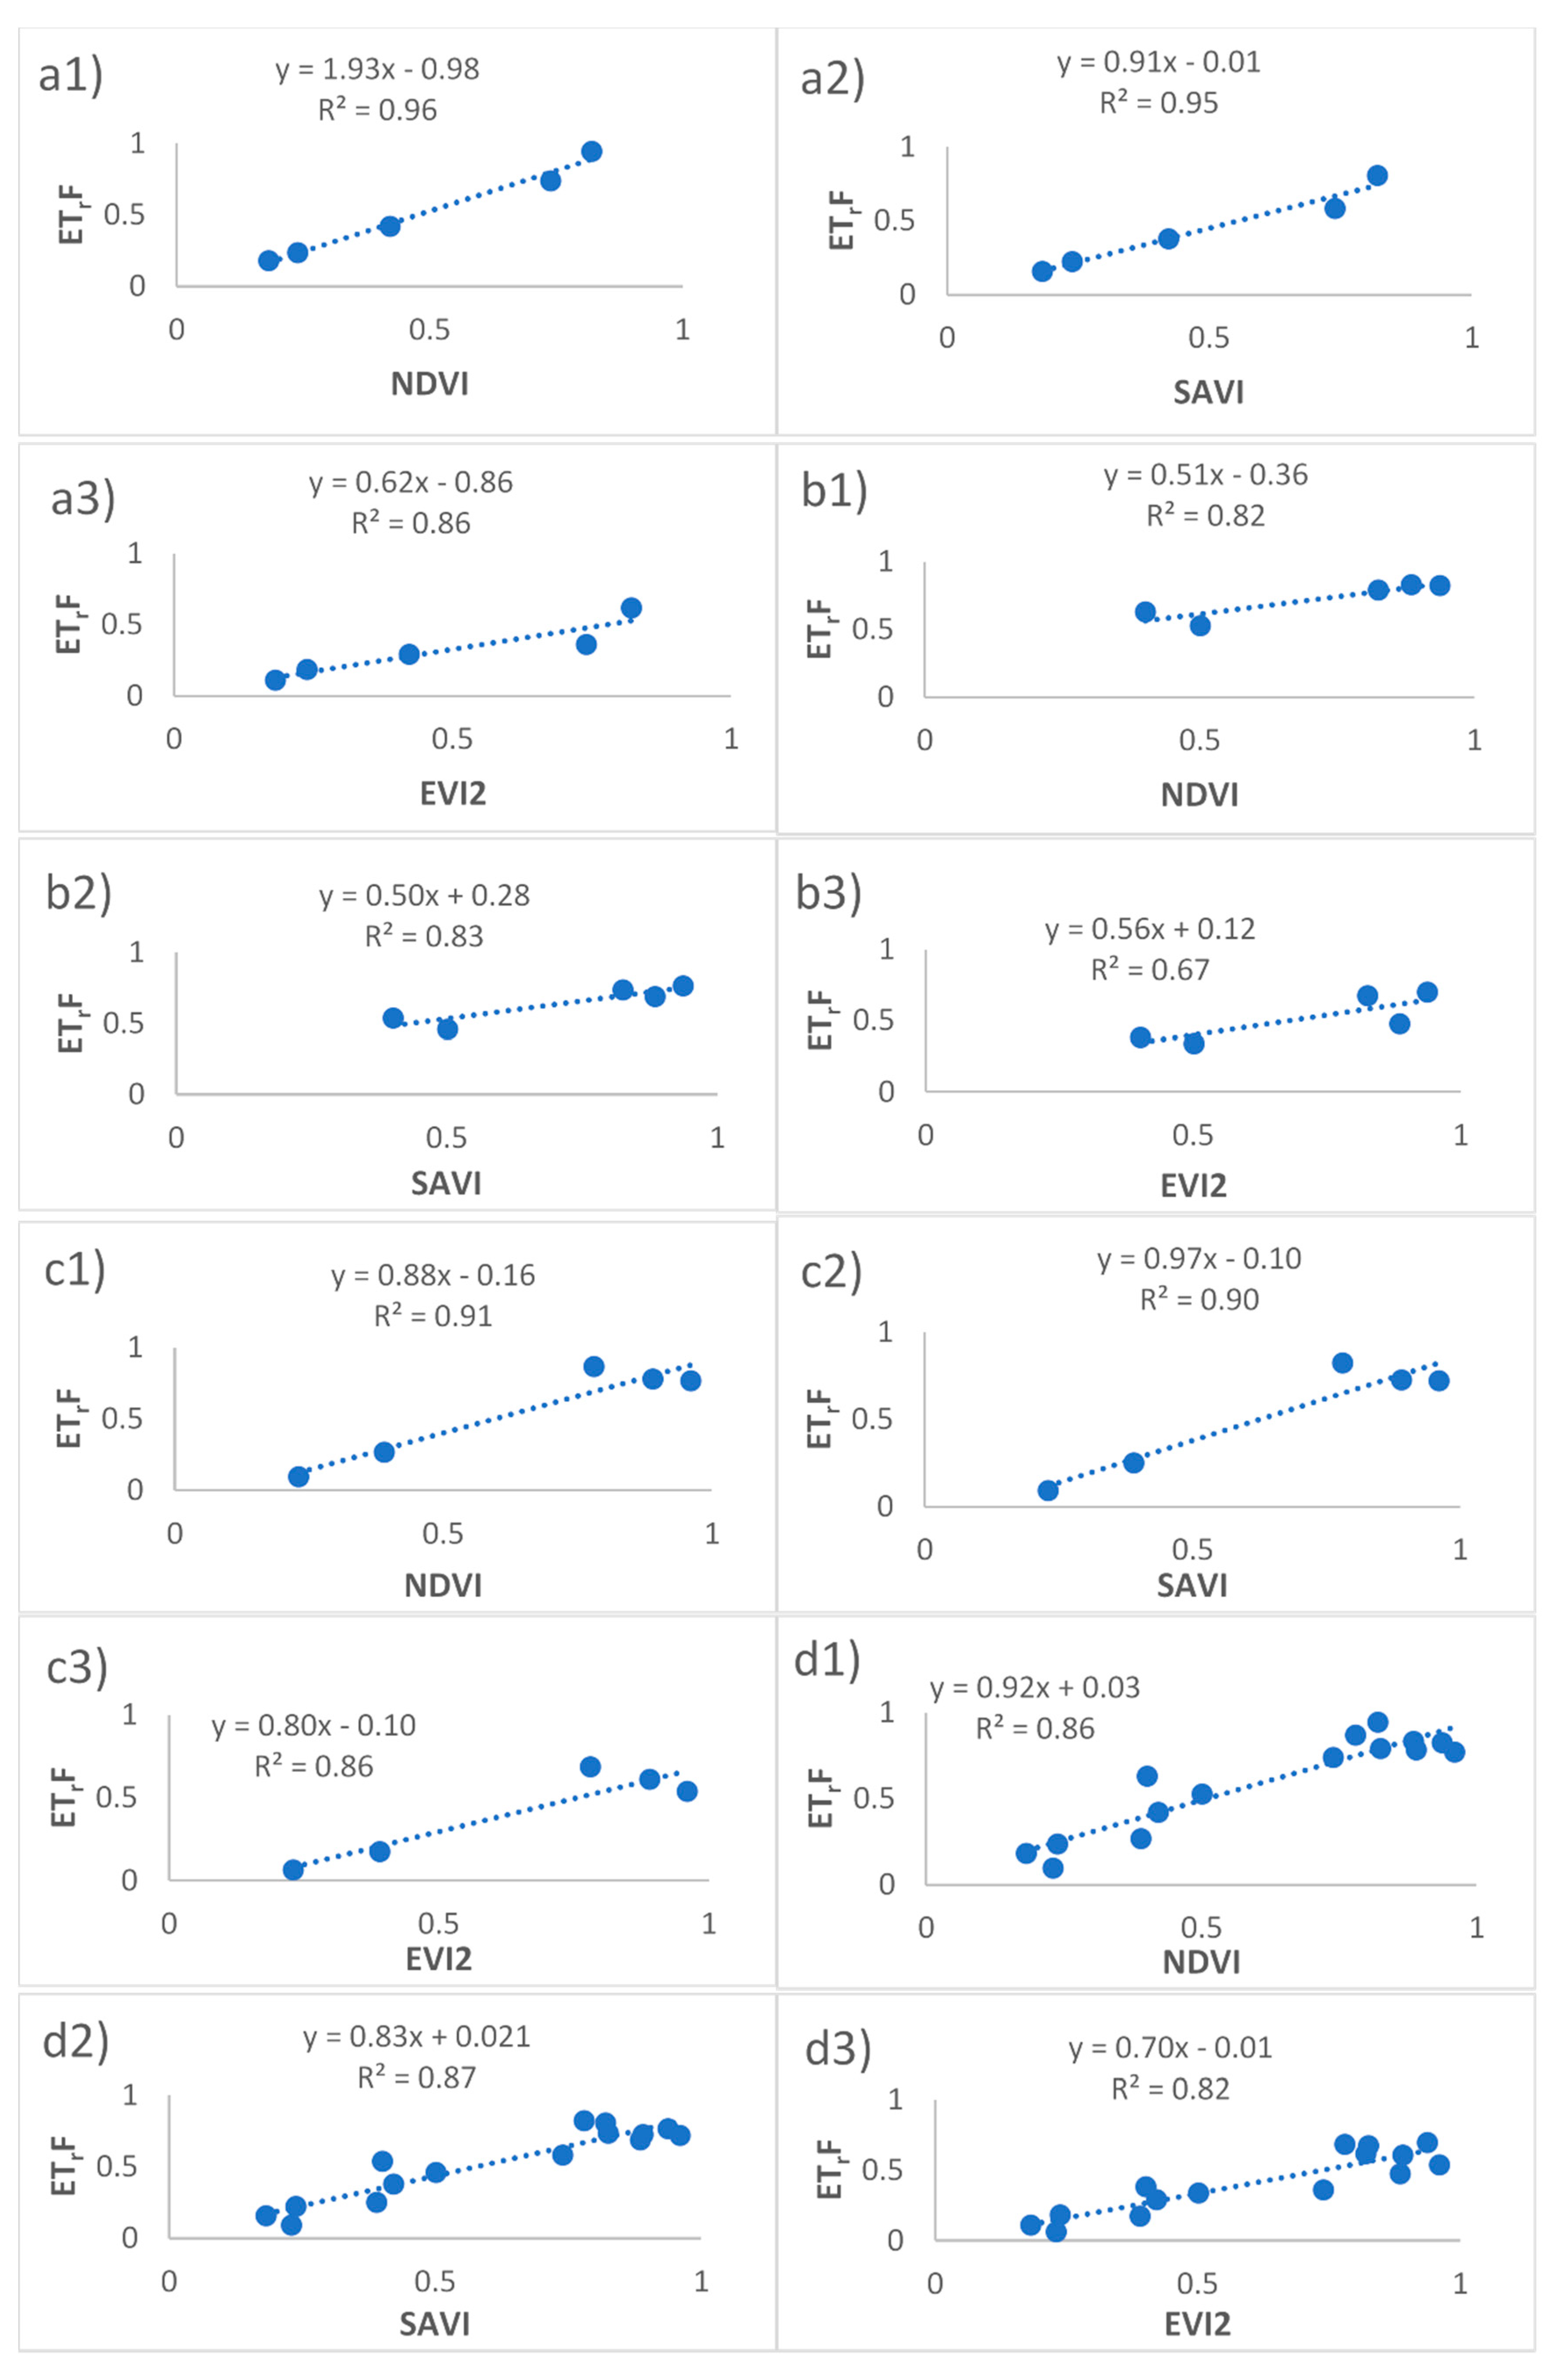
Twenty, on average, separate point reflectance measurements were obtained for every crop for every experiment day (e.g., Figure 3). From those measurements, VIs values were estimated, applying the filtering procedure described in the methodology. ETrF values were plotted against VIs throughout the growing season of 2012 for all the related crops, and finally, linear relationships between ETrF and VIs were obtained (Table 2). A general relationship, relating all three crops for NDVI, SAVI, and EVI2, was also established (Table 2). Those relationships can be very useful, especially when there is no specific knowledge of crop type or land use [51,63]. Table 2 also illustrates the coefficient of determination (R2), Root Mean Square Error (RMSE), Mean Absolute Error (MAE), and coefficient of variation (CV) of RMSE, for statistical reasons.
Considering Table 2, according to R2 value, it seems that NDVI had a better performance for corn (R2 = 0.96) and sugar beet (R2 = 0.91), while SAVI performed slightly better for the case of cotton (R2=0.83). The general equation performed slightly better when applying SAVI (R2 = 0.87). It is worth mentioning that SAVI was computed using L = 0.55, which is a value adjusted to the local conditions, as described in previous study [49]. That is why SAVI performs marginally better than NDVI, especially at the general case. However, according to R2 value, the performance of SAVI is very close to NDVI (R2 = 0.87 vs. R2 = 0.86), while NDVI is much better applied separately for sugar beet and corn. Those results are very promising since lower values of R2 were found in similar studies [21,26,64]. That appearance of NDVI and SAVI has been also confirmed by Calera et al. [65] in Southern Europe, while Tasumi et al. [66] concluded that the ETrF–NDVI approach corresponds well with the results of the METRIC when applied in multiple irrigated crops in the area of Idaho, U.S.. Campos et al. [67] also showed that NDVI appeared to be more sensitive than SAVI when applied to wet soil surface, presenting lower values after irrigation events. When considering RMSE, MAE, and CV, NDVI is dominant when comparing with SAVI and EVI2 in all cases, with RMSE ranging from 0.07 to 0.21, MAE ranging from 0.06 to 0.019, and CV from 0.14 to 0.54. EVI2 experiences less favorable statistics with CV values reaching 2.17 at the case of sugar beet. Figure 7 illustrates all the related plots between ETrF and VIs, corresponding to Equations (17)–(28), respectively. Considering all the plots and statistics, NDVI was chosen for further processing, being much easier to compute, while it is region-independent, unlike SAVI [47]. Additionally, international literature always confirms the importance of NDVI as a remote sensing tool [9,11,28,29,30,31,32,65,68,69,70]. Figure 7d1 illustrates ETrF versus NDVI for the general case, corresponding to Equation (26), which is the formula used for the next steps of the study.

Validation of the Methodology

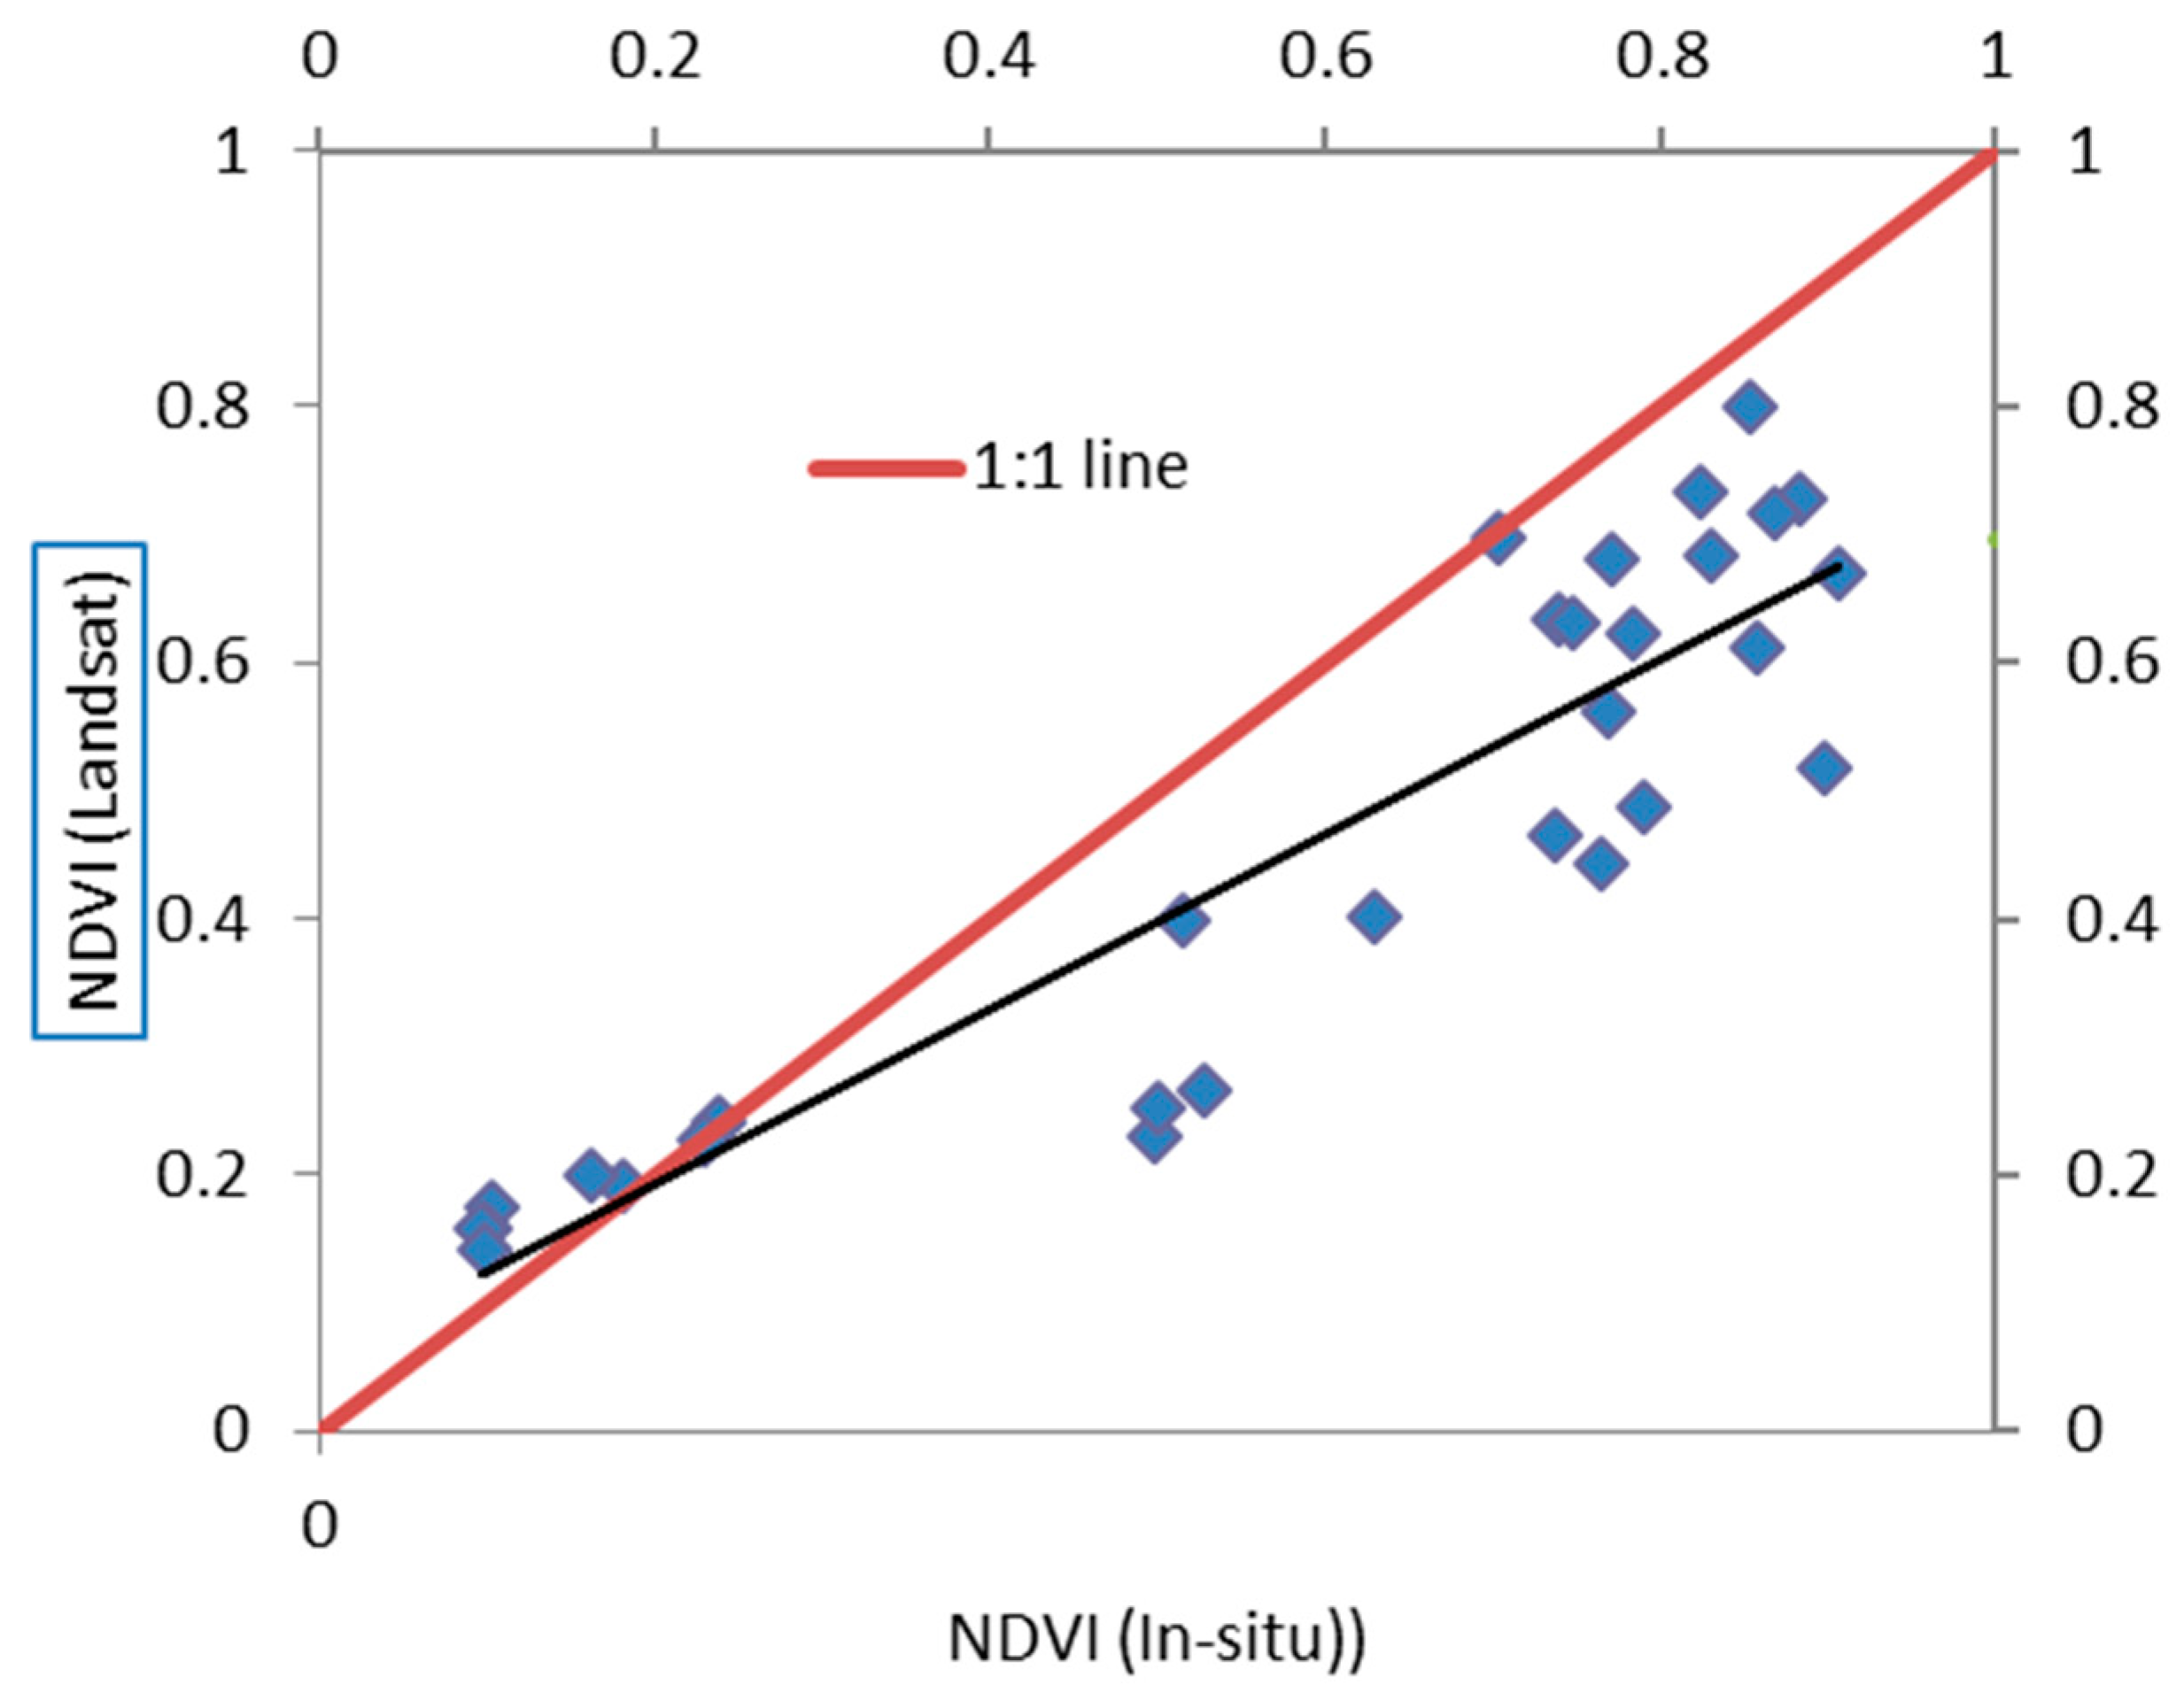
NDVI values derived from in-situ radiometric values after interpolation were firstly plotted against NDVI taken from Landsat in the scatterplot of Figure 8. The regression line is statistically different from the line of perfect agreement (e.g., 1:1 line), as indicated by the slope t-Student test at 5% significance level. However, the statistics of the regression line (R2 = 0.82, RMSE = 0.09, MAE = 0.07, CV = 0.23) indicated a good agreement between the two sets of NDVI values. Differences may be attributed to local atmospheric conditions, especially during interpolated dates.
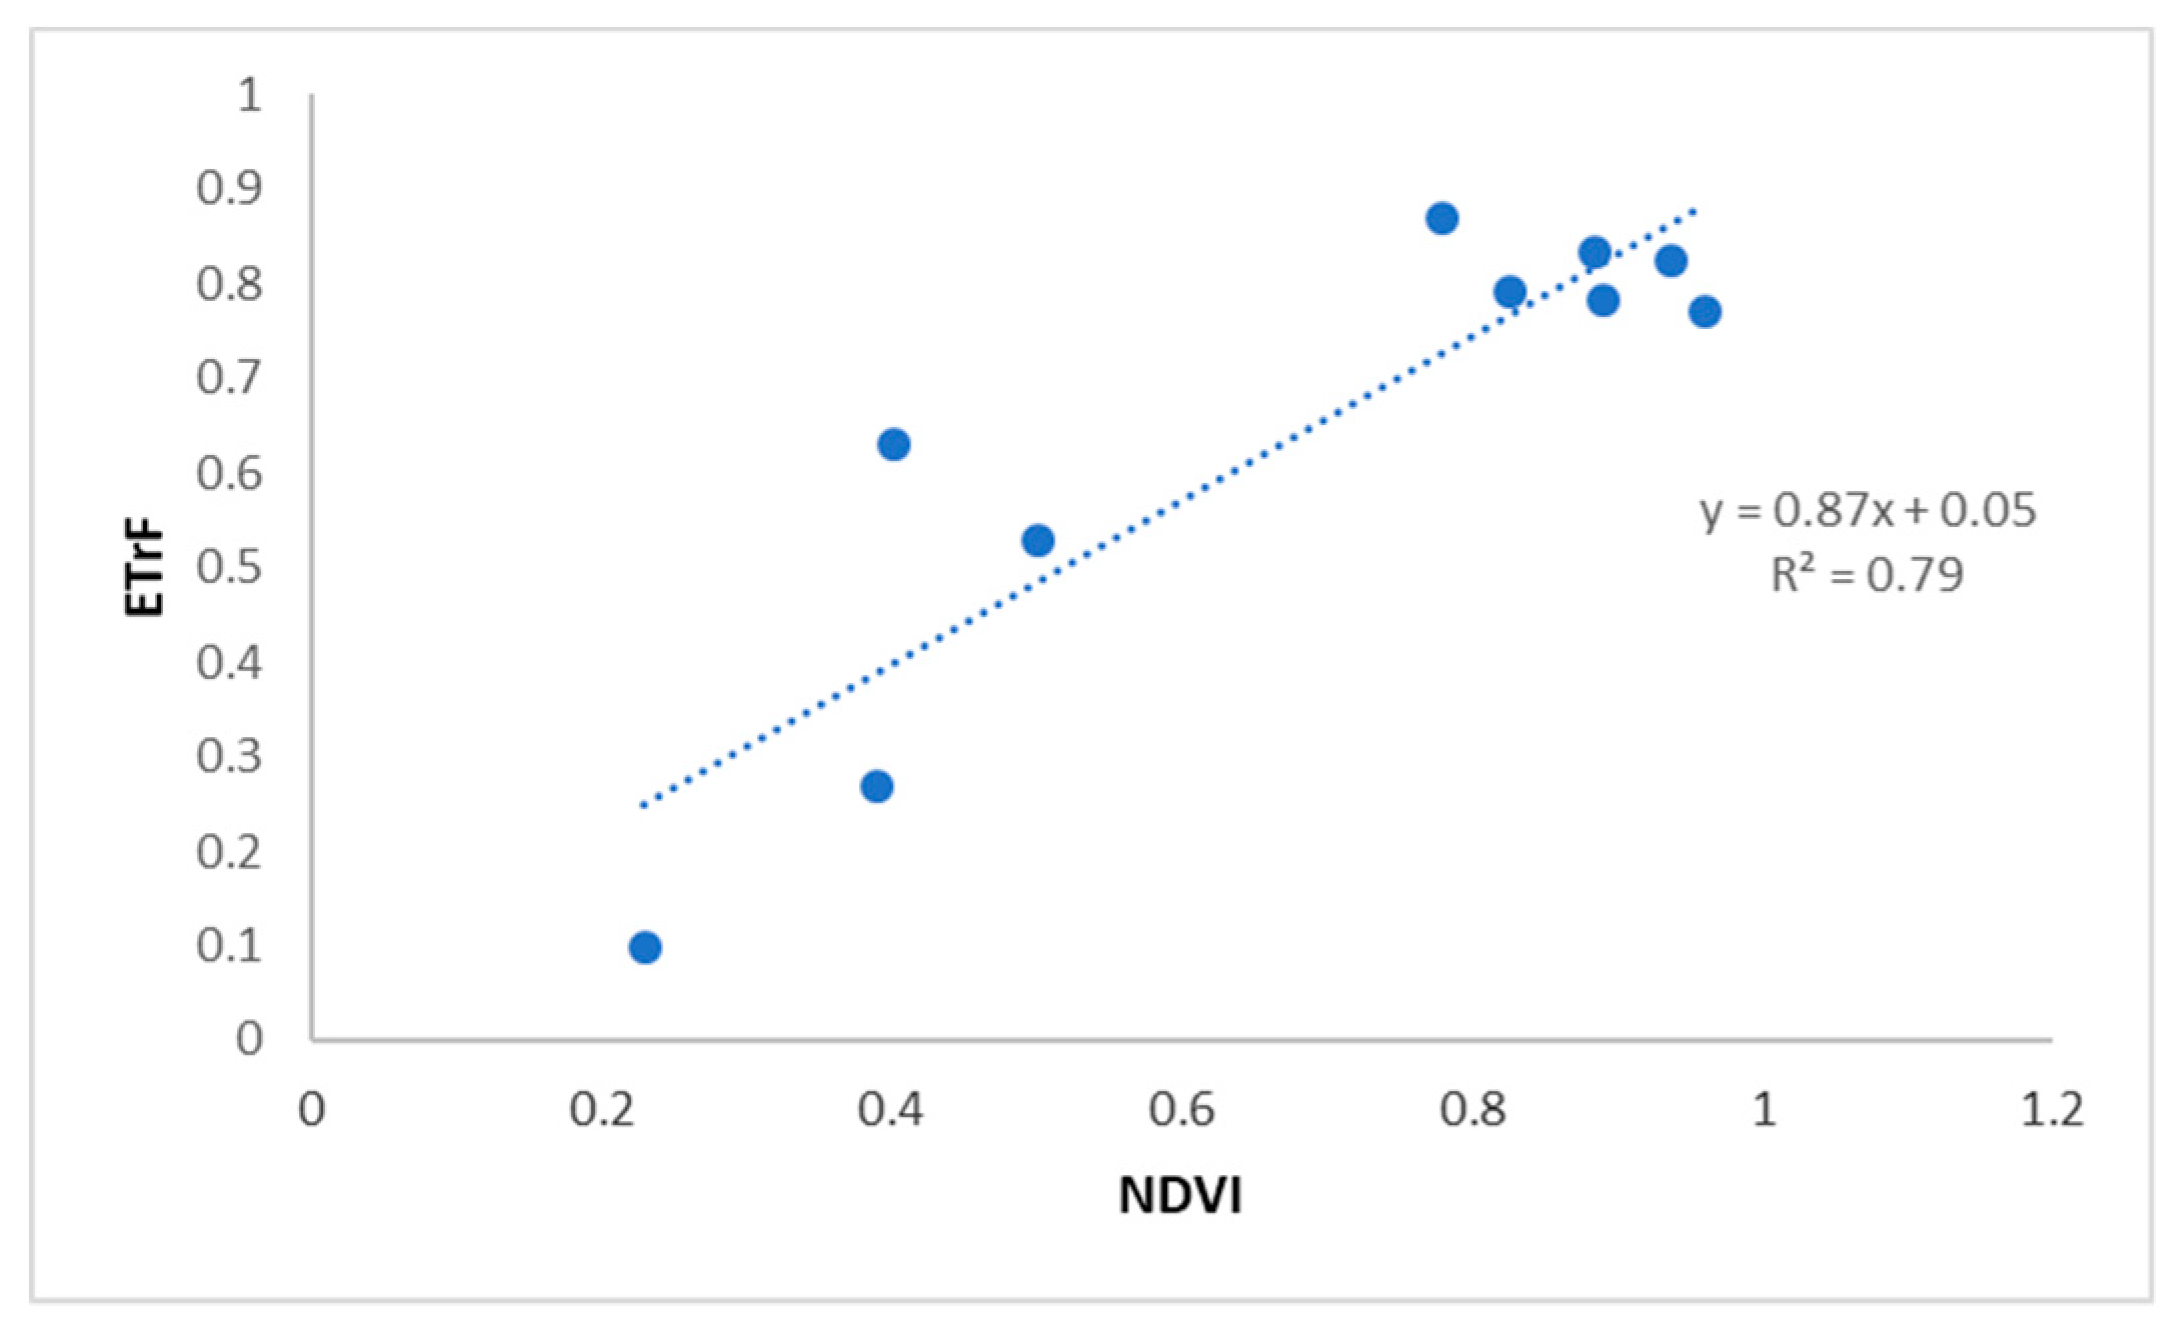
Since lysimeters, or evaporation pans, are not available in the study area, it is impossible to validate the proposed methodology using ground truth data. However, internal validation and two alternative indirect validation procedures have been used for the benchmarking of the proposed method. Initially, a portion of in-situ radiometric values are used for the development of the relationships and the remaining data are used for validation of the developed relationships. As a result, the data and the relationship ETrF versus NDVI was plotted in Figure 9. The coefficient of determination (R2 = 0.79) is lower than previously (R2 = 0.86), and the new equation, which describes the ETrF versus NDVI relationship, is Equation (29):
y = 0.87x + 0.05.
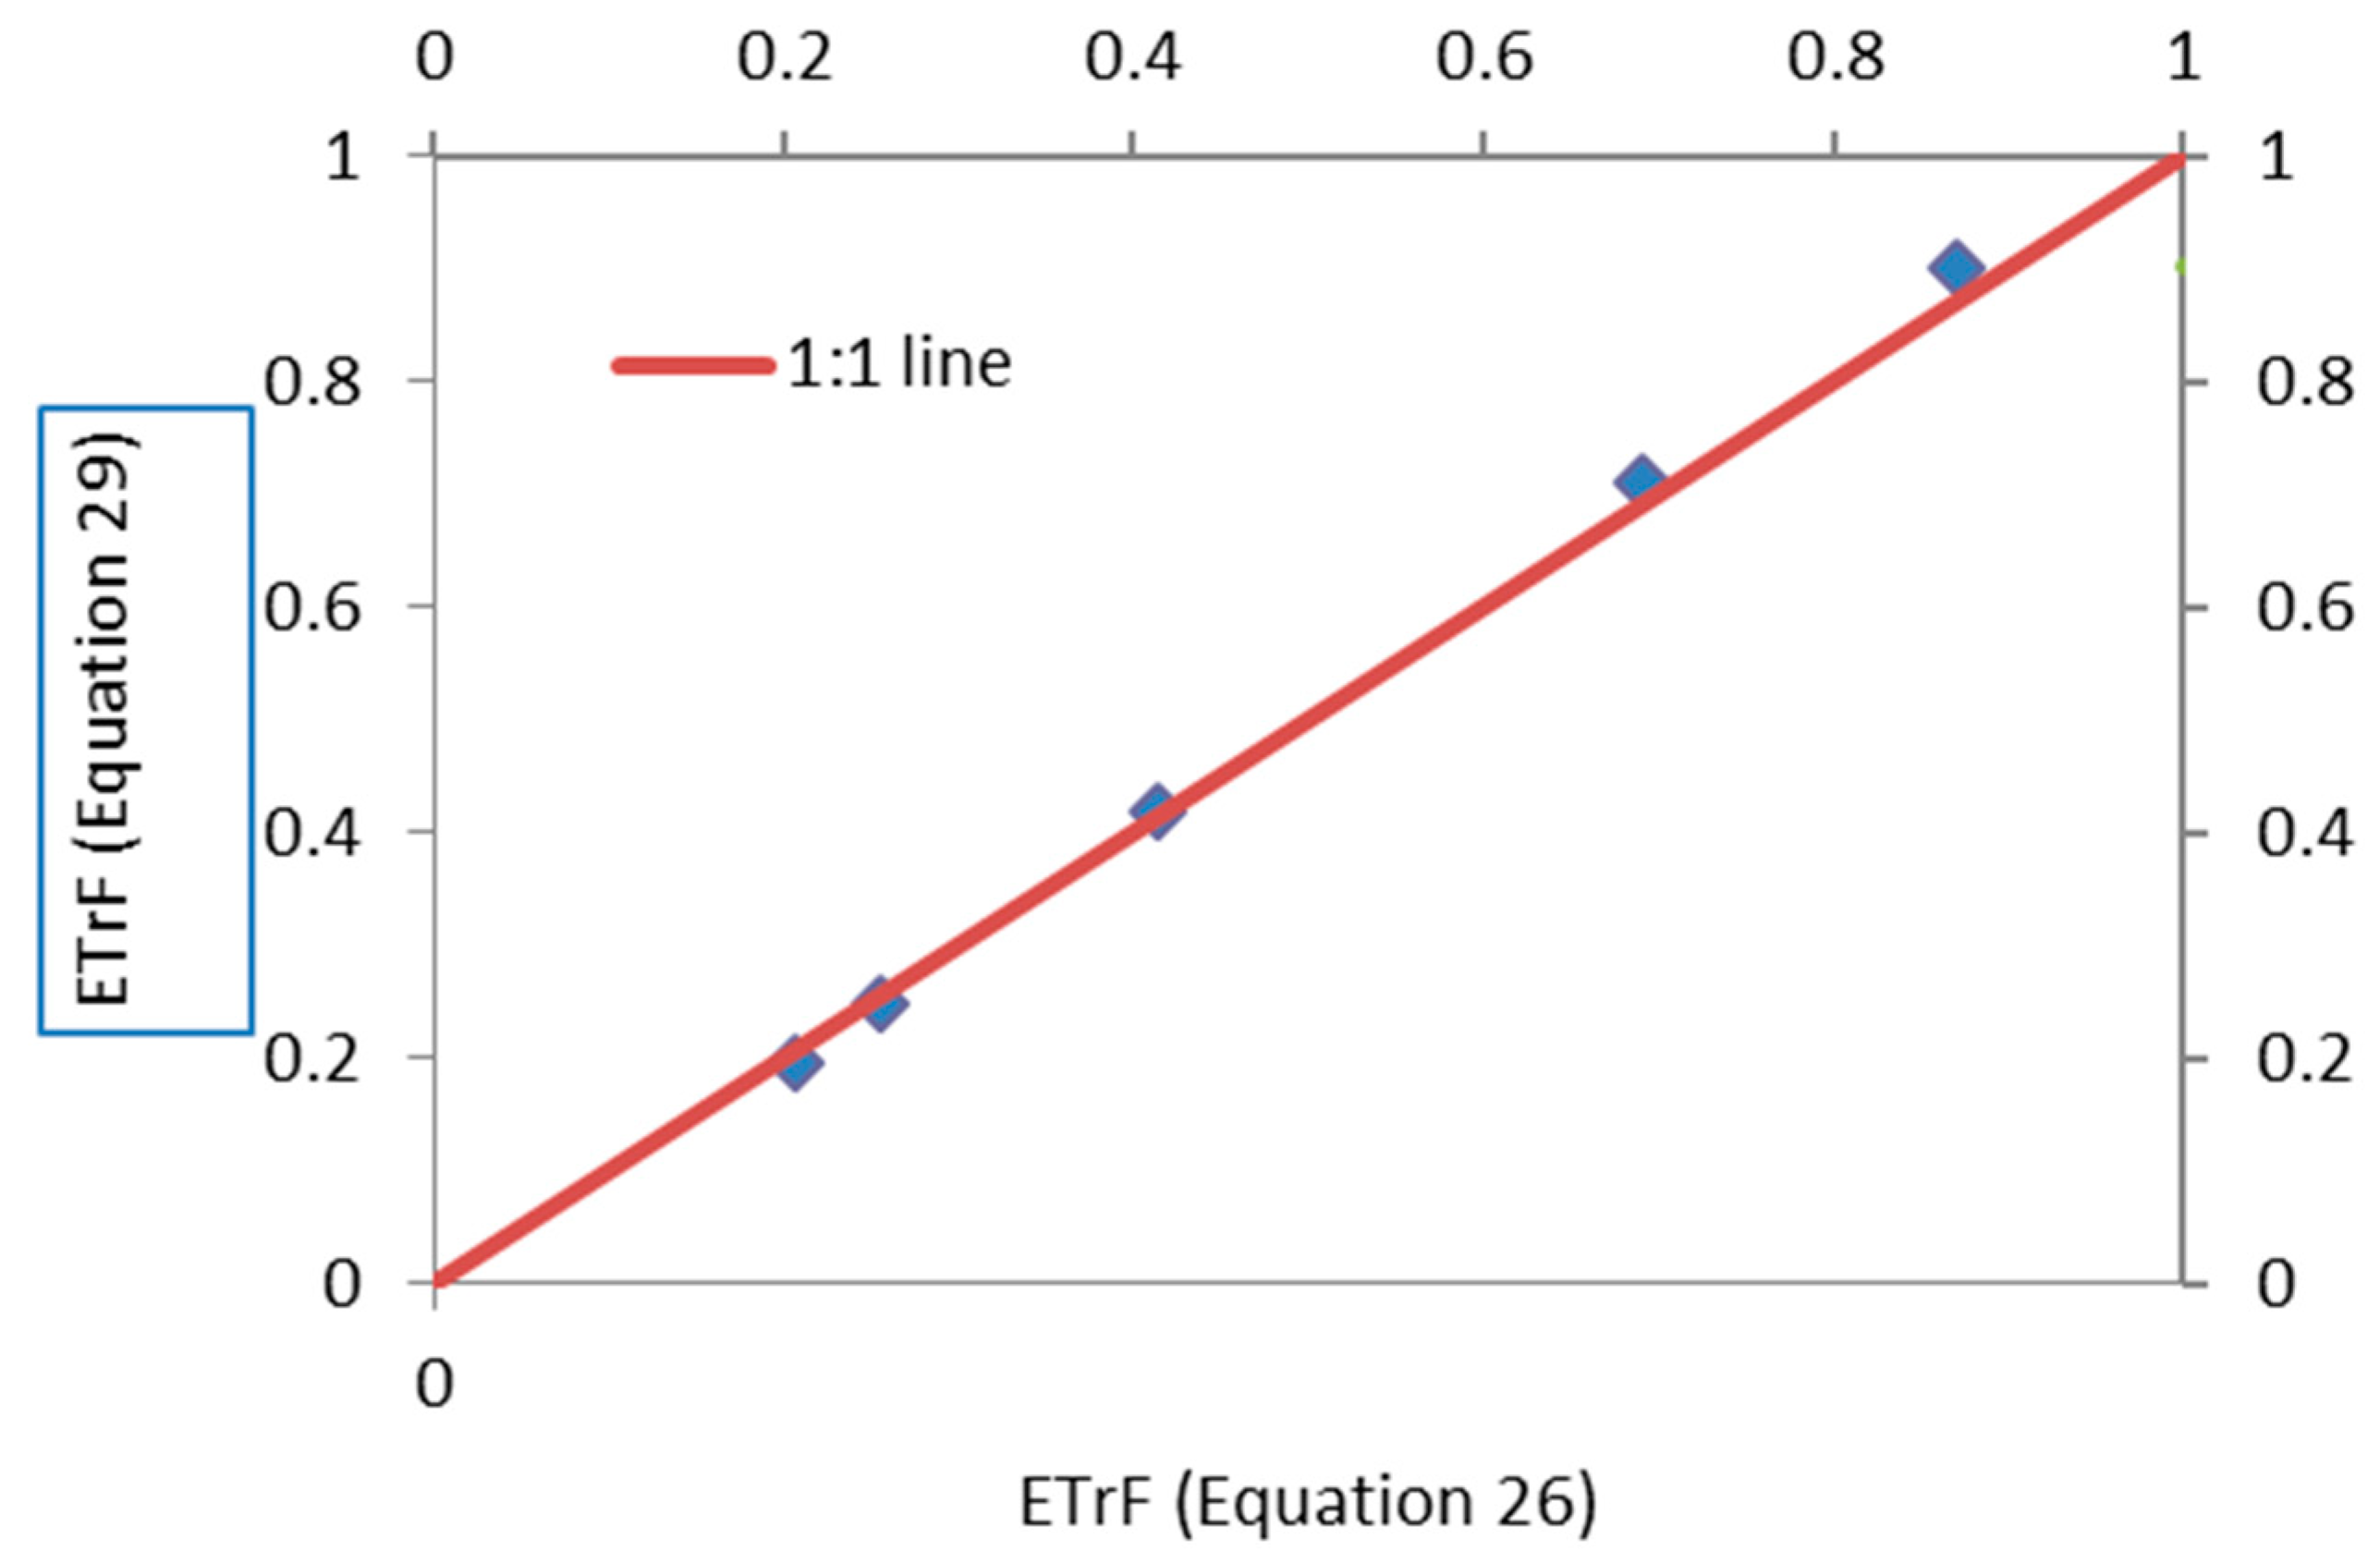
The remaining NDVI values have been tested using Equation (29), giving new ETrF values, and they compared with ETrF values derived from Equation (26). A scatterplot between those two sources of ETrF values is illustrated at Figure 10. A t-test assuming as null hypothesis (Ho) that the difference between the two sets is equal to zero at level of significance 5% is accepted. As a general conclusion, there was no significant difference between results derived from Equation (26), and (29).
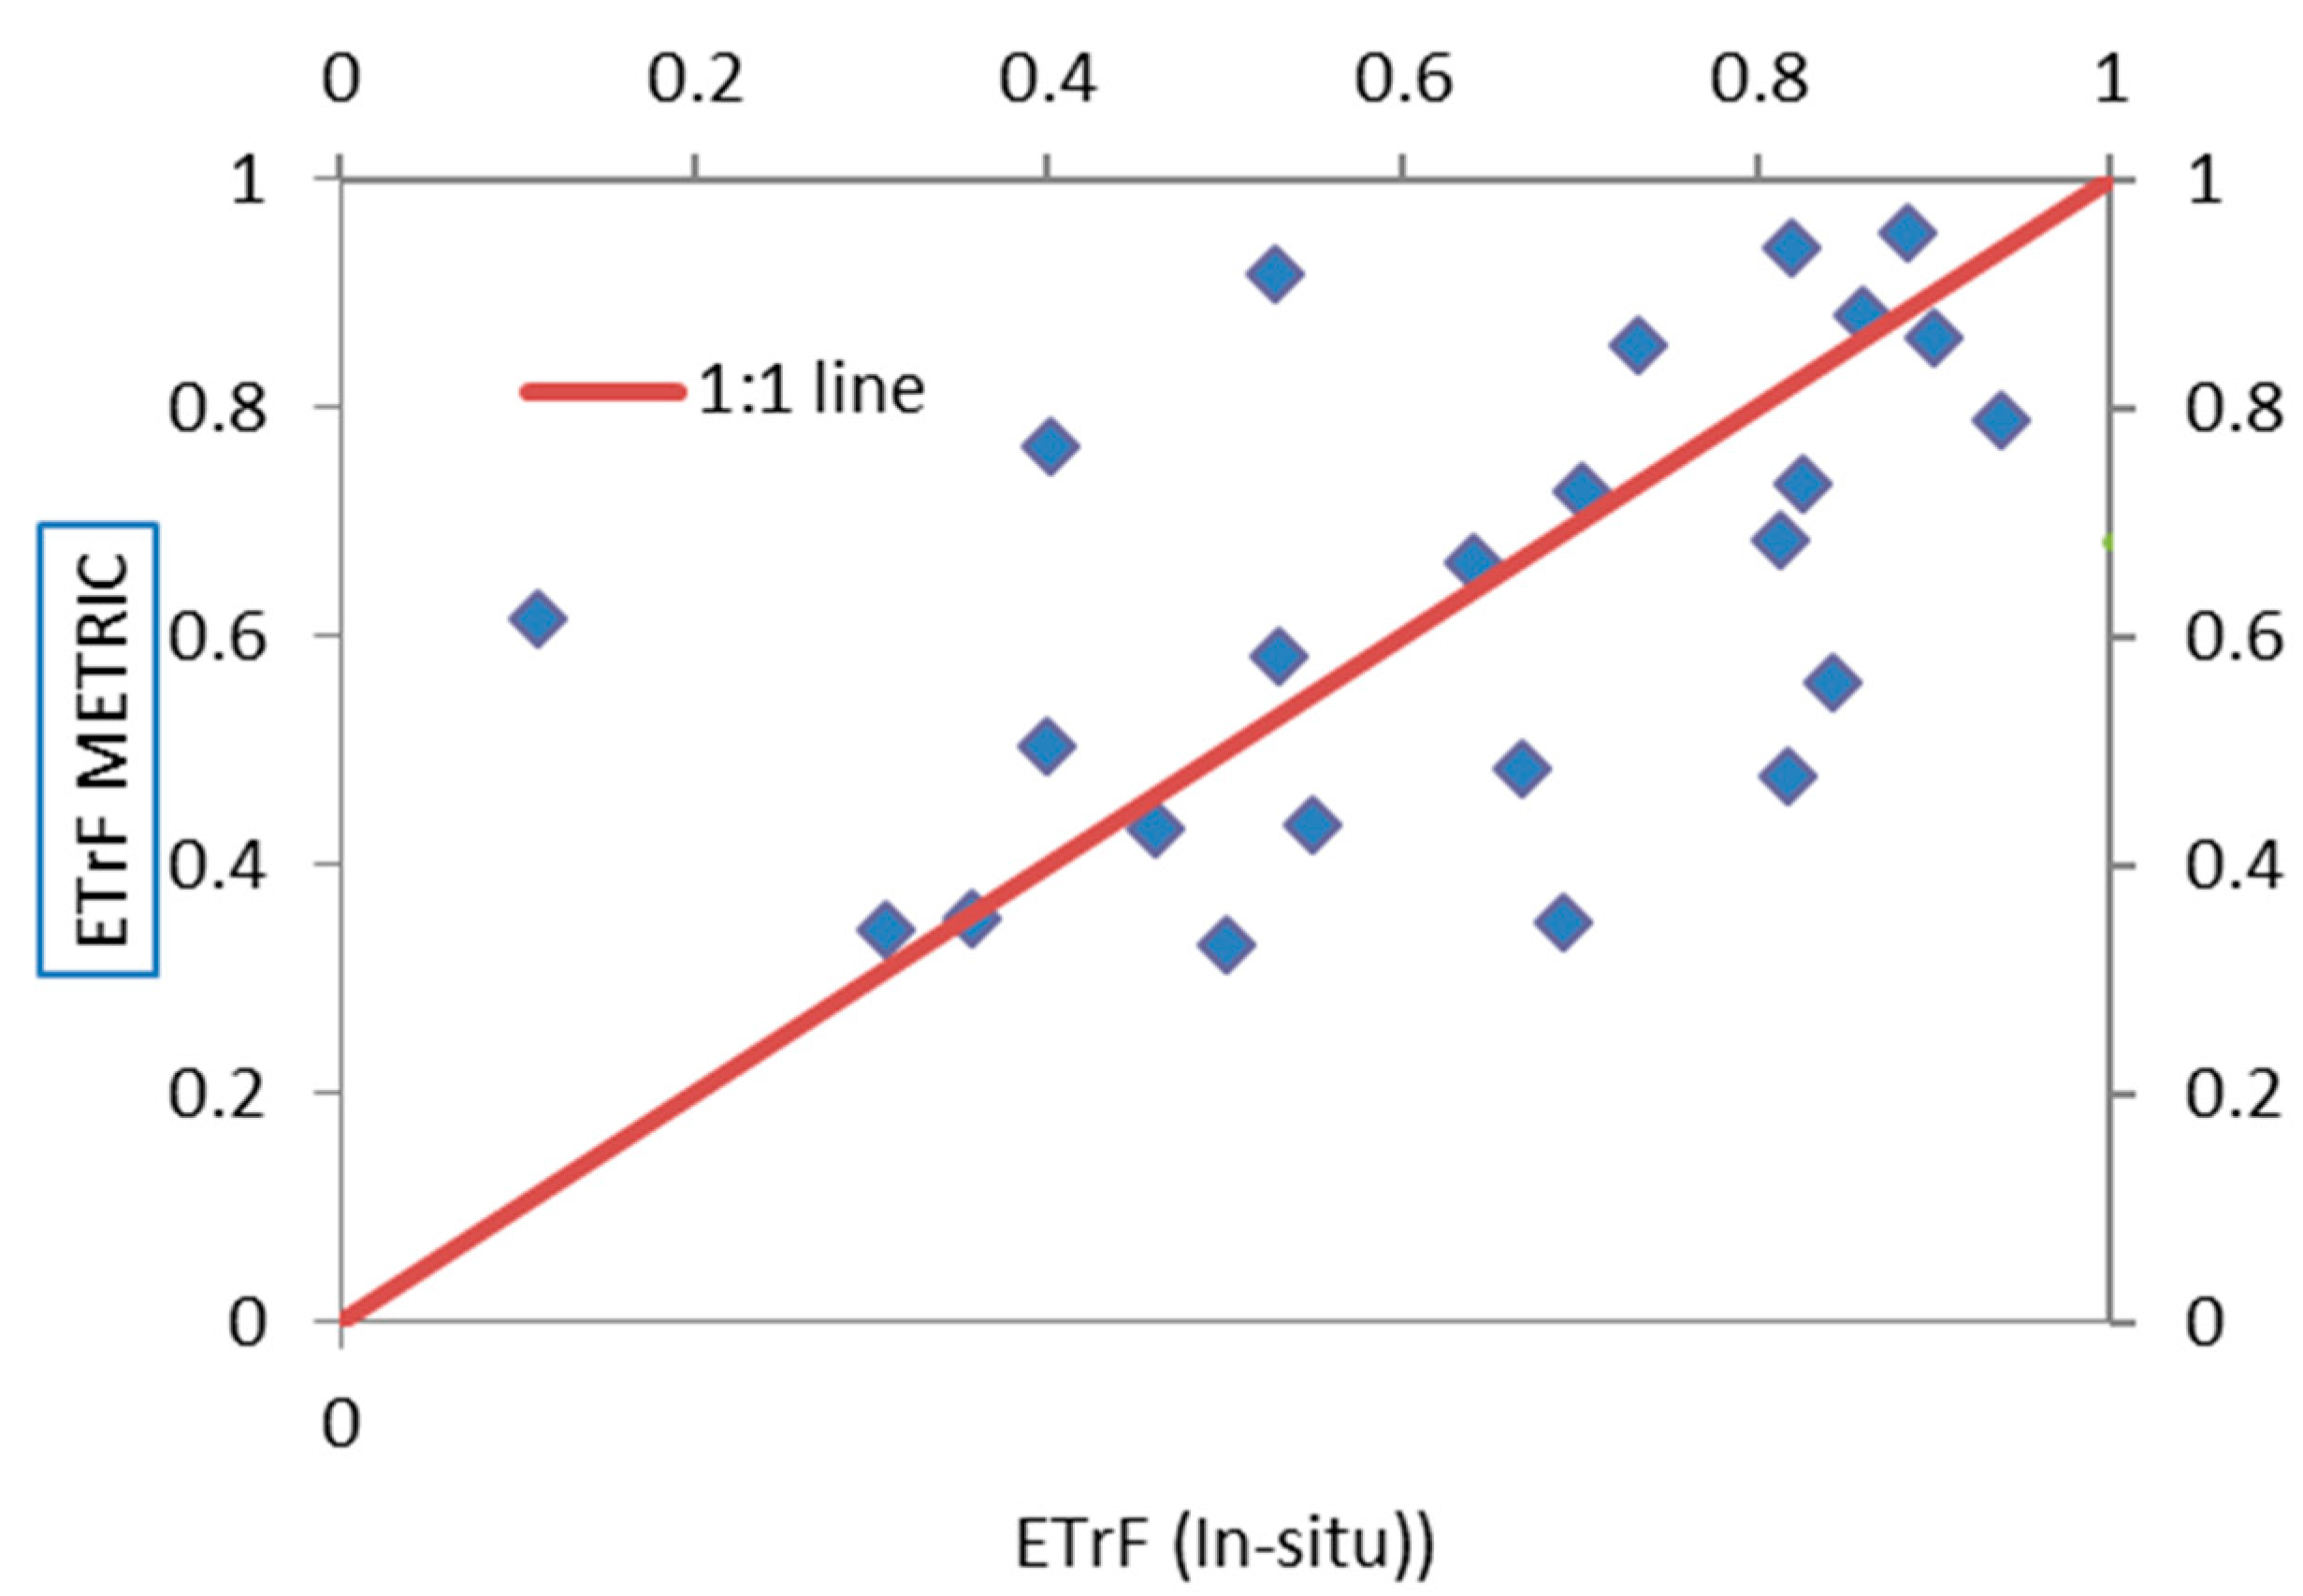
The ETrF values derived using the proposed methodology were compared with the METRIC derived ETrF (Figure 11). The results indicate that there is no significant correlation has been found (R2 = 0.14, RMSE = 0.24, MAE = 0.16, CV = 0.35). Also, the regression line is statistically different from the line of perfect agreement (e.g., 1:1 line), as indicated by the slope t-Student test at 5% significance level. However, the average ETrF values between the two approaches are essentially similar (METRIC ETrF average value = 0.66 vs. modeled ETrF average value = 0.63). The differences may be due to the fact that METRIC is an EB methodology, taking into account a significant amount of parameters which, in the case of the modeled ETrF, are simply ignored.
It is imperative to perform independent validation of the methodology. For this reason, a new satellite image of Landsat ETM+, taken in 2015, was used to compare the ETrF values calculated by the proposed method and the respective values acquired using the METRIC methodology, which is considered as benchmark [58]. This is also supported by the fact that Earth Engine Evapotranspiration Flux (EEFlux), which is a web-based tool operating on the Google Earth Engine and computational cloud, uses the METRIC model as foundation [58,71].
In the second validation procedure, a satellite image of Landsat 8, taken in 2013, was used to estimate ETrF values (equal to crop coefficient Kc) by METRIC and proposed methodologies, and the estimates were used in the CROPWAT model to estimate and compare the crop water requirements found by the two methods.
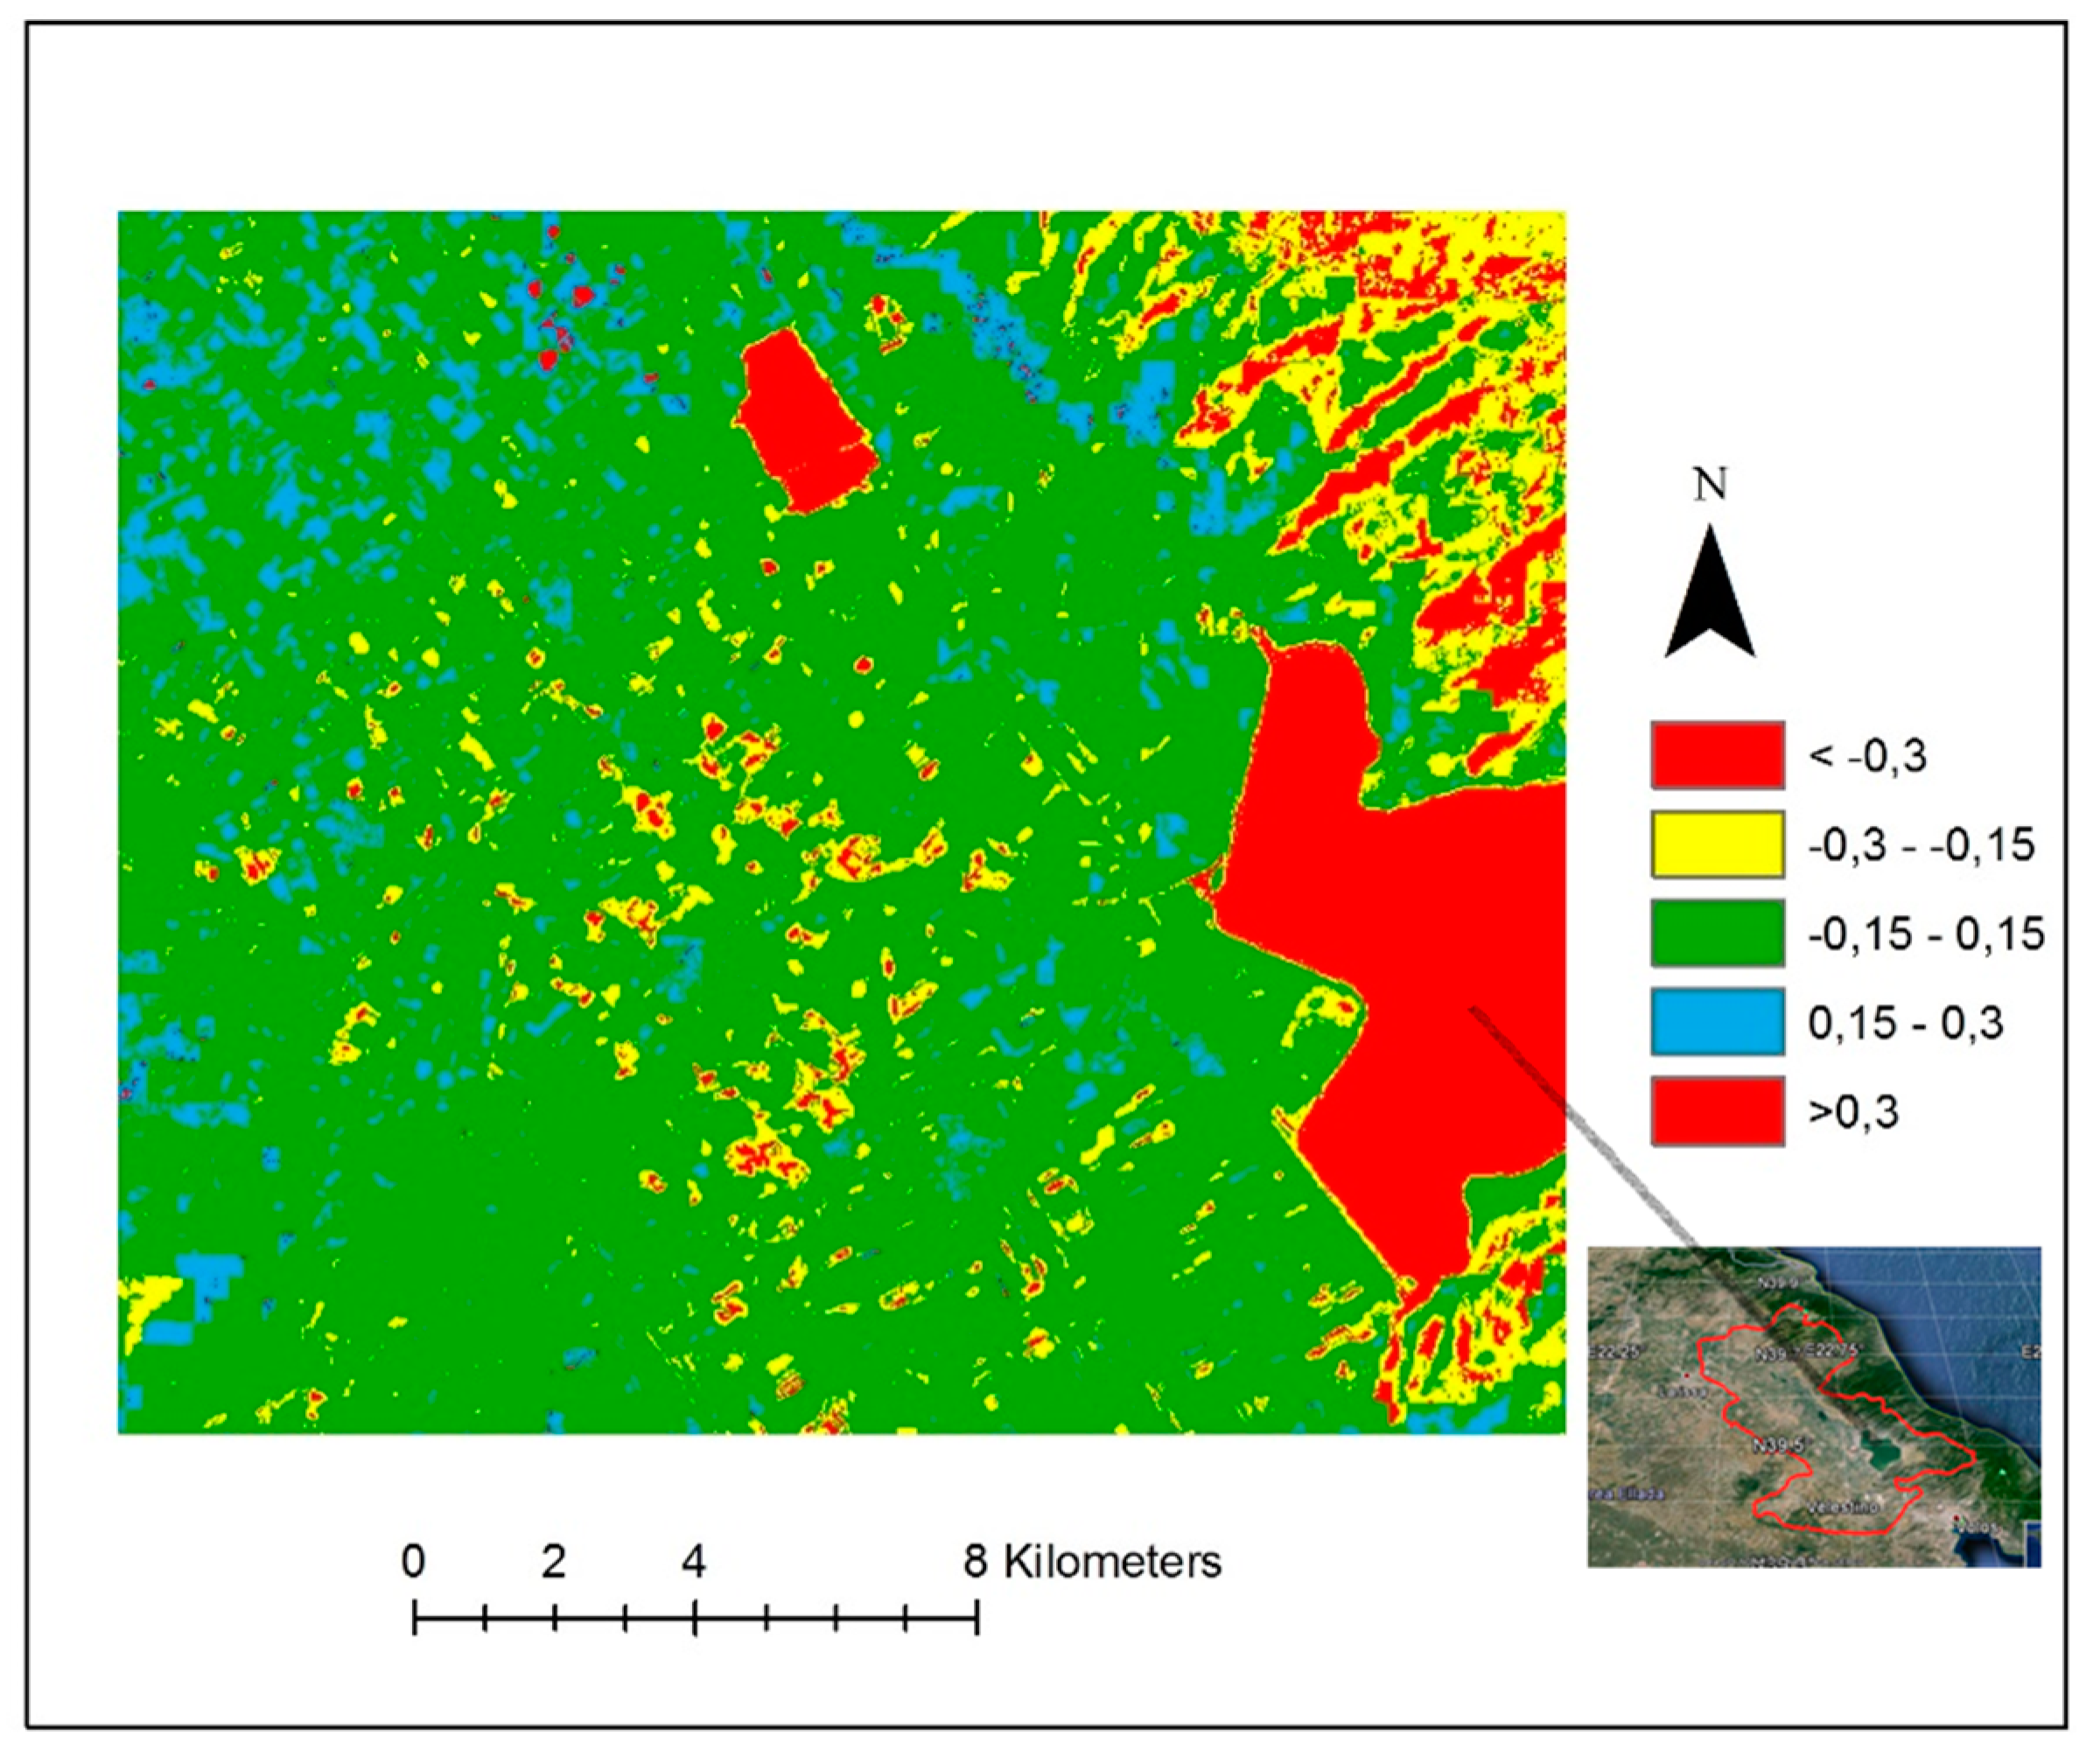
Equation (26), as a generalized equation, was validated using a new satellite image of 14 June 2015. Two new ETrF image files were then obtained, firstly applying METRIC methodology and then applying Equation (26), separately. NDVI was derived from satellite imagery in that case, while during the model formulation, NDVI was derived using in-situ values. Image differencing methodology was then used, which is simply the subtraction of the pixel values of the initial image to the corresponding pixel values of the second image [72,73,74,75]. The result illustrated in Figure 7 is the difference image file between METRIC ETrF estimated values and the ETrF values of the proposed methodology for the central part of the watershed. An average value of 0.08 (stdev = 0.23) was computed. However, examining Figure 12, it is obvious that there are many pixels with remarkable variations. For example, larger differences (in red color) can be seen over water surfaces. That is the reason why a mask was developed, excluding all the other land types from crops, and that occurred using a previously derived land use map of the study region [49].
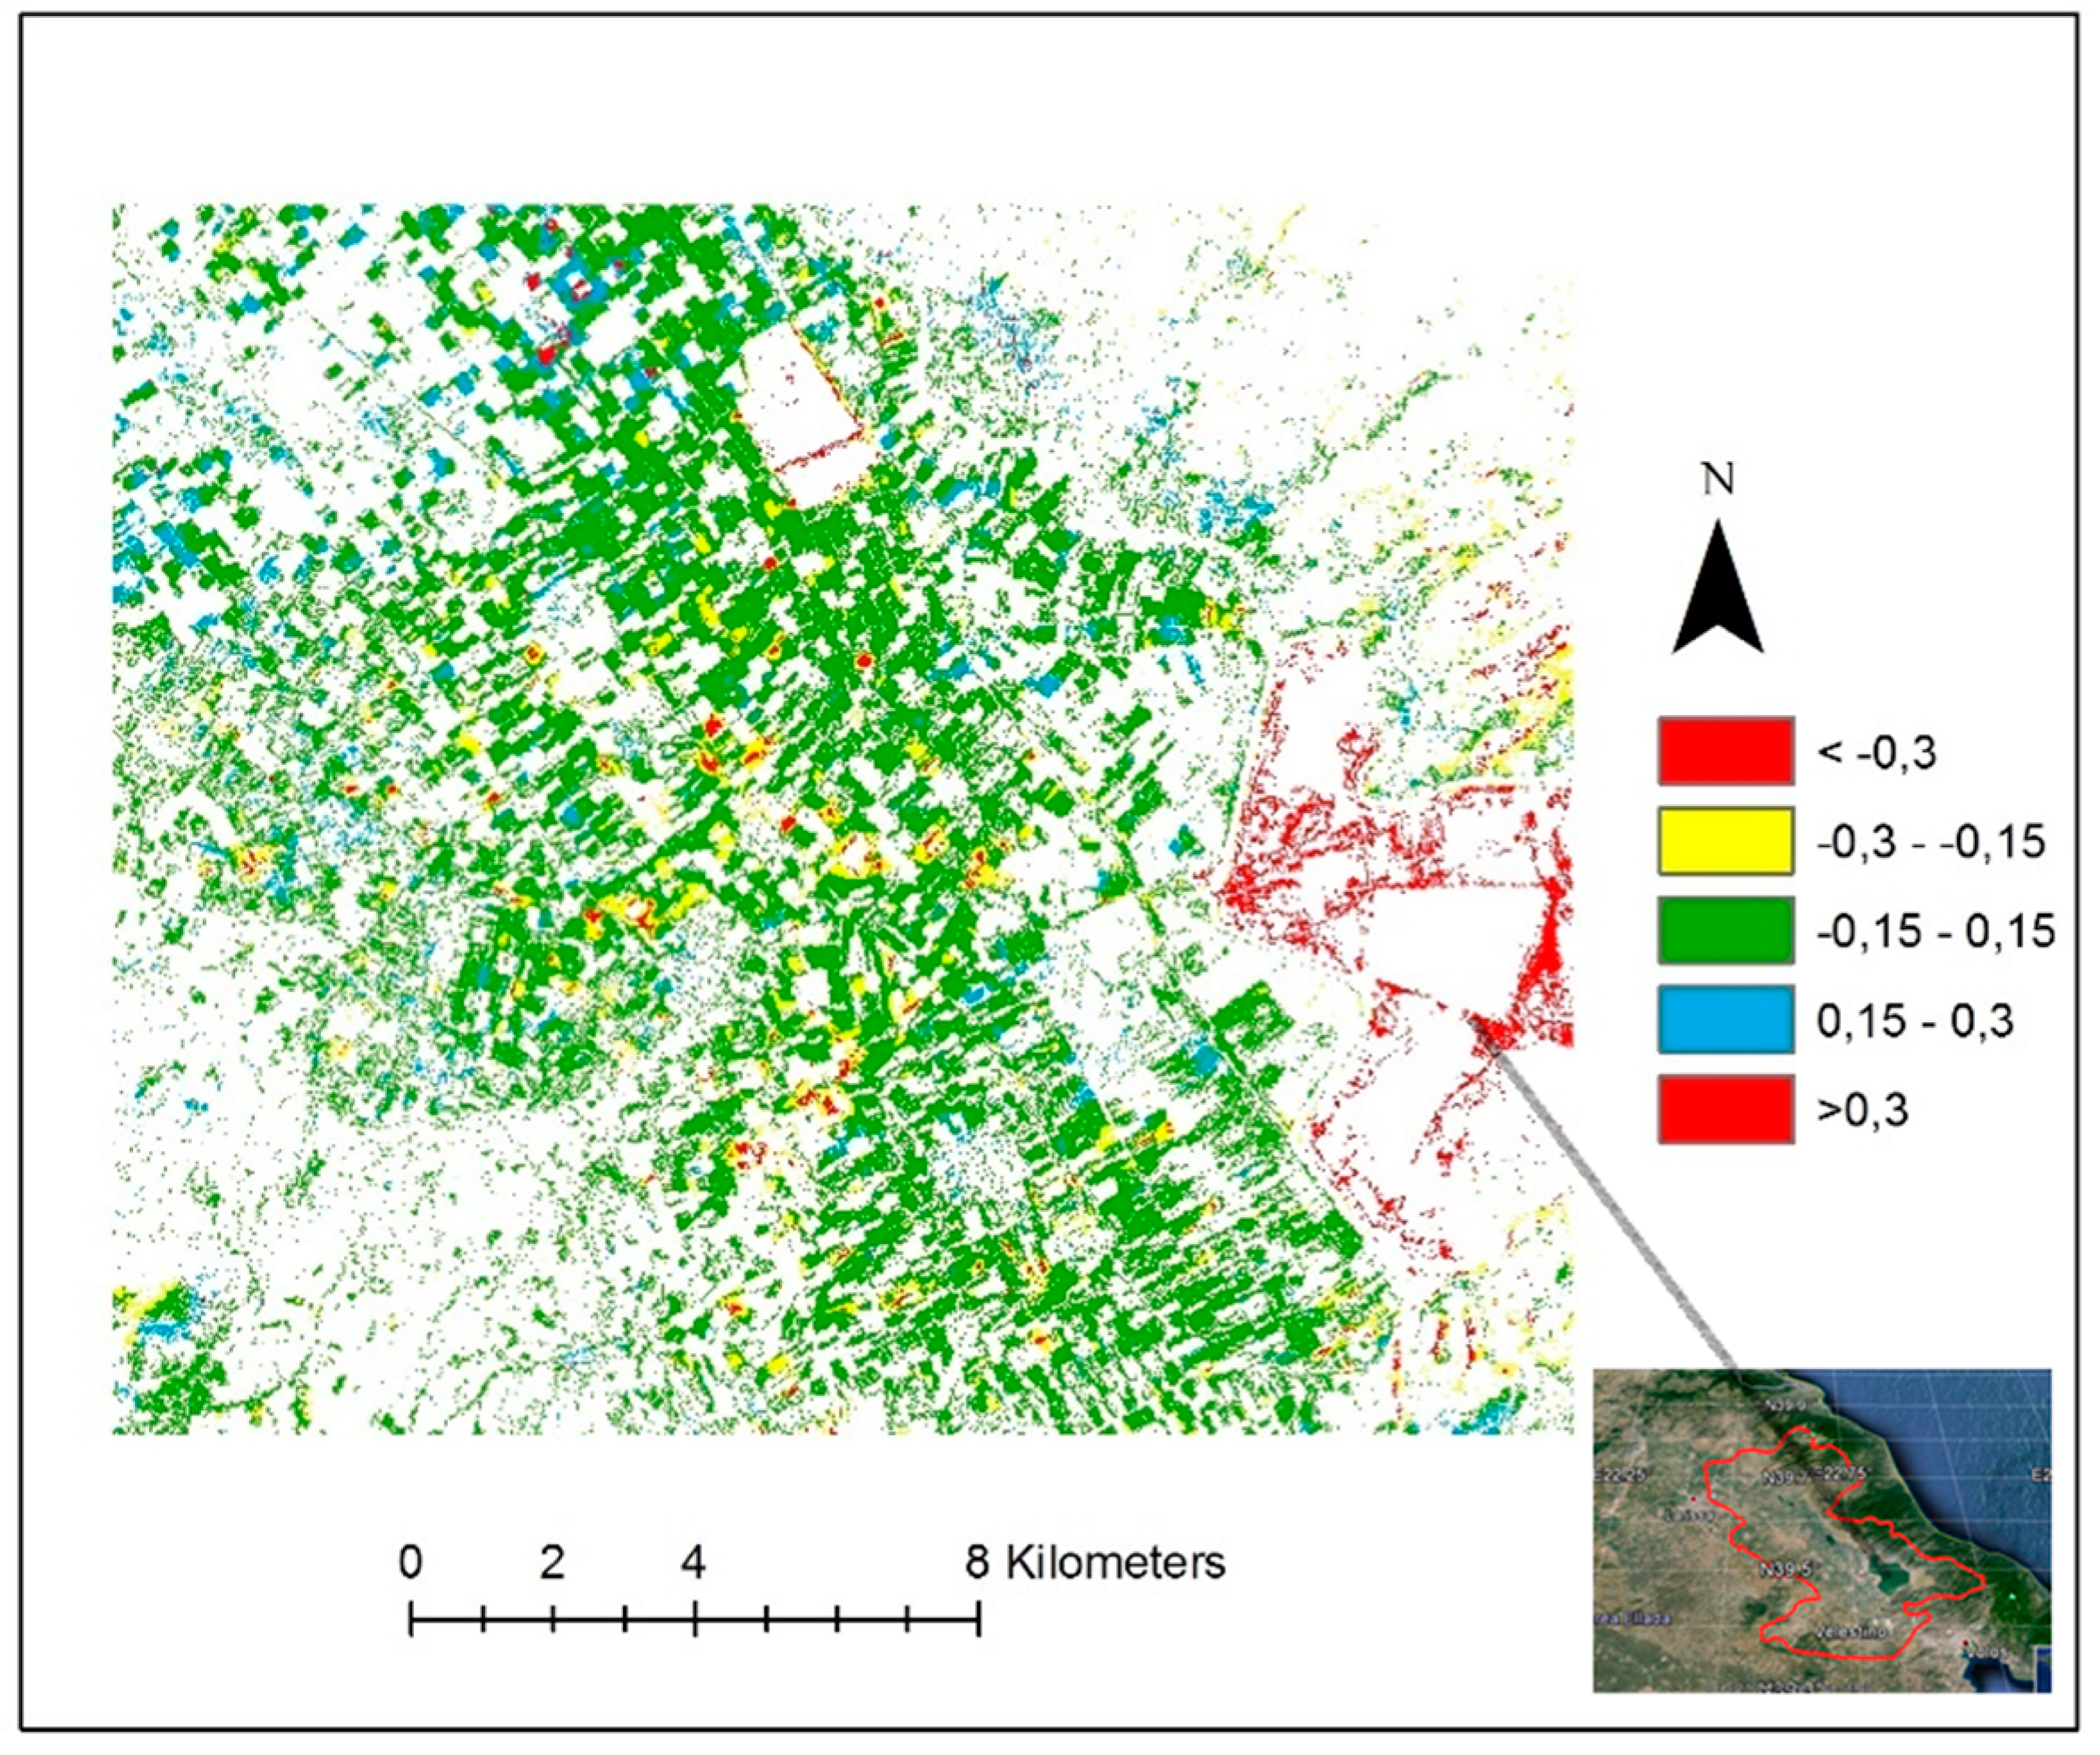
A new image file was obtained after masking, corresponding to a new difference map between METRIC estimated values of ETrF and the values of ETrF calculated by the proposed methodology (Figure 13). The new results showed a clear improvement, with an average of 0.02 (stdev = 0.19), as might have been expected. In fact, it is very reasonable to consider that all linear relationships were developed at the crop fields, indicating that the relationship between NDVI and ETrF would fit much better when applied only on those pixels. Those results agree with Rafn et al. [76], where the related ETrF-NDVI relationships are within the range of +10 percent of the ET estimate based in the METRIC model [65].
The second validation attempt of the proposed methodology was made by applying the CROPWAT model [59]. CROPWAT is a decision support system for irrigation planning and management, developed by the Land and Water Development Division of FAO [59]. The basic functions of CROPWAT include the calculation of ETr, crop water requirements, and crop and scheme irrigation. The model uses Penmann–Montieth methodologies in order to calculate reference crop ET [59] but also requires climatic data, separate rainfall data, crop data, and finally, soil data [77,78]. Rainfall data, as well as the other climatic parameters needed for CROPWAT application, can be computed using ClimWat incorporated into the model’s software package. Crop and soil conditions are taken from FAO databases, while previous studies relating with soil maps in the regions are also taken into account, especially for crosschecking [79]. Finally, instead of using crop data from FAO databases, Kc coefficients derived from METRIC are inserted manually into the program, and a comparison between METRIC based crop water requirements and those related with the crop coefficients calculated using the proposed methodology was followed. The satellite image of Landsat 8 taken on 24 June 2013 was utilized. ETrF values using classic METRIC methodology versus the new proposed methodology were used as input for CROPWAT, while the other input data (e.g., climatic, rainfall, and soil data) were kept constant. Average ETrF values for cotton, sugar beet, and corn, as well as average crop water requirements (in mm) are shown at Table 3. The last column of Table 3 gives the percent difference between the two estimations. It is obvious that the results are very satisfactory (less than 2% for each case). Cotton showed the best results, followed by sugar beet and maize. It is obvious in every case, when considering Table 3, that the accuracy of CROPWAT’s crop water requirements after applying the proposed ETrF values was very satisfactory.

4. Conclusions

This paper presented the development of a new methodology for the estimation of ETrF (i.e., crop coefficient, Kc). The proposed methodology used medium resolution Landsat 7 ETM+ images and meteorological data from local weather station and METRIC methodology. The method was developed in the Lake Karla watershed in central Greece for the major crops of the area (i.e., cotton, sugar beets, and corn) during the growing season of 2012. Measurements with field spectroradiometer GER1500 were used to match the spectral measurements with Landsat ETM+ bands and calculated three VIs, namely, NDVI, SAVI, and EVI2. ETrF values were computed using METRIC methodology and linear equations between ETrF values and the VIs were developed using linear regression analysis for all crops. The linear equations strongly explain the relationships between ETrF values and the VIs with high R2 values. The results of the proposed methodology have been validated against METRIC acquired ETrF values for the growing season of 2015. The CROPWAT model was finally used to estimate the crop irrigation requirements using the results of the proposed methodology and the METRIC acquired ETrF for 2013. The difference of the crop irrigation results ranged, on average, between 0–1.23% for the various crops, indicating excellent agreement.
The results confirm that the methodology developed for the estimation of crop coefficients from field (in-situ) measurements with spectroradiometer is simple, validated, and reliable for the assessment of crop water requirements in a typical Mediterranean agricultural region. Furthermore, the developed equations between ETrF and VIs, and especially NDVI, may be used in other areas, as well. Then, the proposed developed methodology, which is a Kc–NDVI approach, may be applied elsewhere, along with satellite derived NDVI and assuming crop homogeneity. On the other hand, METRIC methodology, using the “hot” and “cold” pixels for finding the anchor values, is a site-dependent methodology because those pixels are generally different for every image and location.
The main advantage of ground radiometric measurements is that it is easier to implement in any meteorological conditions, in contrast with satellite tracks and their related acquisitions. Theoretically, ground measurements can be used every day without significant influence from the prevailing meteorological conditions and, of course, without atmospheric corrections. The good agreement obtained between the results of the proposed methodology and METRIC-based values of ETrF confirmed the validity of the model. The results indicate that NDVI performs better than SAVI and EVI2 applying for special crops. Validation using satellite derived NDVI values shows that the resulting linear relationship could be used satisfactorily under the same crop regions during the growing season, avoiding a complete EB, which might be very time-consuming. Additional data obtained either through field radiometry or new satellite systems, such as Sentinel mission, with improved spectral and spatial resolution could improve the accuracy of the derived relationships in the near future. This procedure may open a new perspective for an accurate estimation of daily water usage and can assist farmers or irrigation managers with important information about the operation and management of irrigation systems.

Author Contributions

M.S. and A.L. conceived and designed the study; A.L. contributed reagents/materials/analysis tools and contributed to the writing of the paper; M.S. processed, analyzed the satellite data and wrote the paper.

Funding

This research received no external funding.

Acknowledgments

This work was supported by ESSEM COST ES1106: Assessment of EUROpean AGRIculture WATer use and trade under climate change (EURO-AGRIWAT). The authors would like to thank Diofantos Hadjimitsis and the Laboratory of Remote Sensing and Geo-Environment Research of the Department of Civil Engineering and Geomatics, Cyprus University of Technology for providing the radio-spectrometer GER1500. The authors acknowledge Centre for Research and Technology, Thessaly, Greece for the provided meteorological data as well as NASA Warehouse Inventory Search Tool for the provided satellite data. Satellite data are distributed by the Land Processes Distributed Active Archive Center (LP DAAC), http://lpdaac.usgs.gov). An initial version of this paper has been presented at the Second International Conference on Remote Sensing and Geoinformation of the Environment (RSCy2014) Paphos, Cyprus, 16–19 March 2015.

Conflicts of Interest

The authors declare no conflict of interest.

References

  1. Huete, A.; Didan, K.; Miura, T.; Rodriquez, E.P.; Gao, X.; Ferreria, L.G. Overview of the radiometric and biophysical performance of the MODIS vegetation indices. Remote Sens. Environ. 2000, 83, 195–213. [Google Scholar] [CrossRef]
  2. Bannari, A.; Morin, D.; Bonn, F.; Huete, A.R. A review of vegetation indices. Remote Sens. Rev. 1995, 13, 95–120. [Google Scholar] [CrossRef]
  3. Elvidge, C.D.; Chen, Z. Comparison of broad-band and narrow-band red and near-infrared vegetation indices. Remote Sens. Environ. 1995, 54, 38–48. [Google Scholar] [CrossRef]
  4. Xue, J.; Su, B. Significant remote sensing vegetation indices: A review of developments and applications. J. Sens. 2017. [Google Scholar] [CrossRef]
  5. Asner, G.P.; Wessman, C.A.; Bateson, C.A.; Privette, J.L. Impact of Tissue, Canopy, and Landscape Factors on the Hyperspectral Reflectance Variability of Arid Ecosystems. Remote Sens. Environ. 2000, 74, 69–84. [Google Scholar] [CrossRef]
  6. Mahlein, A.K.; Rumpf, T.; Welke, P. Development of spectral indices for detecting and identifying plant diseases. Remote Sens. Environ. 2013, 128, 21–30. [Google Scholar] [CrossRef]
  7. Allen, R.G.; Pereira, L.S.; Raes, D.; Smith, M. Crop evapotranspiration: Guidelines for computing crop water requirements. In United Nations FAO, Irrigation and Drainage; FAO: Rome, Italy, 1998; ISBN 92-5-104219-5. [Google Scholar]
  8. Townshend, J.R.G.; Justice, C.O. Towards operational monitoring of terrestrial systems by moderate-resolution remote sensing. Remote Sens. Environ. 2002, 83, 351–359. [Google Scholar] [CrossRef]
  9. Bausch, W.C.; Neale, C.M.U. Spectral Inputs Improve Corn Crop Coefficients and Irrigation Scheduling. Trans. ASAE 1989, 32, 1901–1908. [Google Scholar] [CrossRef]
  10. Neale, C.M.U.; Bausch, W.C.; Heerman, D.F. Development of reflectance-based crop coefficients for corn. Trans. ASAE 1989, 32, 1891–1899. [Google Scholar] [CrossRef]
  11. Choudhury, B.J.; Ahmed, N.U.; Idso, S.B.; Reginato, R.J.; Daughtry, C.S.T. Relations between evaporation coefficients and vegetation indices studied by model simulations. Remote Sens. Environ. 1994, 50, 1–17. [Google Scholar] [CrossRef]
  12. Duchemin, B.; Hadria, R.; Erraki, S.; Boulet, G.; Maisongrande, P.; Chehbouni, A.; Escadafal, R.; Ezzahar, J.; Hoedjes, J.C.B.; Kharrou, M.H.; et al. Monitoring wheat phenology and irrigation in Central Morocco: On the use of relationships between evapotranspiration, crops coefficients, leaf area index and remotely-sensed vegetation indices. Agric. Water Manag. 2006, 79, 1–27. [Google Scholar] [CrossRef]
  13. Hunsaker, D.J.; Pinter, P.J., Jr.; Kimball, B.A. Wheat basal crop coefficients determined by normalized difference vegetation index. Irrig. Sci. J. 2005, 24, 1–14. [Google Scholar] [CrossRef]
  14. Jensen, M.E.; Burman, R.D.; Allen, R.G. Evapotranspiration and Irrigation Water Requirements. ASCE Manual No. 70; American Society of Civil Engineers: New York, NY, USA, 1990. [Google Scholar]
  15. Irmak, S. Nebraska water and energy flux measurement, modeling, and research network (NEBFLUX). Trans. ASABE 2010, 53, 1097–1115. [Google Scholar] [CrossRef]
  16. Bastiaanssen, W.G.M. SEBAL-based sensible and latent heat fluxes in the irrigated Gediz Basin, Turkey. J. Hydrol. 2000, 229, 87–100. [Google Scholar] [CrossRef]
  17. Kukal, M.; Irmak, S.; Kilic, A. Long-term spatial and temporal maize and soybean evapotranspiration trends derived from ground-based and satellite-based datasets over the great plains. J. Irrig. Drain. Eng. 2017, 143, 04017031. [Google Scholar] [CrossRef]
  18. Pimpale, A.R.; Rajankar, P.B.; Wadatkar, S.B.; Wanjari, S.S.; Ramteke, I.K. Estimation of water requirement of wheat using multispectral vegetation indices. J. Agrometeorol. 2015, 17, 208–212. [Google Scholar]
  19. Glenn, E.P.; Neale, C.M.U.; Hunsaker, D.J.; Nagler, P.L. Vegetation index-based crop coefficients to estimate evapotranspiration by remote sensing in agricultural and natural ecosystems. Hydrol. Process. 2011, 25, 4050–4062. [Google Scholar] [CrossRef]
  20. Akdim, N.; Alfieri, S.M.; Habib, A.; Choukri, A.; Cheruiyot, E.; Labbassi, K.; Menenti, M. Monitoring of irrigation schemes by remote sensing: Phenology versus retrieval of biophysical variables. Remote Sens. 2014, 6, 5815–5851. [Google Scholar] [CrossRef]
  21. Kamble, B.; Kilic, A.; Hubbard, K. Estimating crop coefficients using remote sensing-based vegetation index. Remote Sens. 2013, 5, 1588–1602. [Google Scholar] [CrossRef]
  22. Hunink, J.E.; Eekhout, J.P.C.; de Vente, J.; Contreras, S.; Droogers, P.; Baille, A. Hydrological modelling using satellite-based crop coefficients: A comparison of methods at the basin scale. Remote Sens. 2017, 9, 174. [Google Scholar] [CrossRef]
  23. Park, J.; Baik, J.; Choi, M. Satellite-based crop coefficient and evapotranspiration using surface soil moisture and vegetation indices in Northeast Asia. CATENA 2017, 156, 305–314. [Google Scholar] [CrossRef]
  24. Heilman, J.L.; Heilman, W.E.; Moore, D.G. Evaluating the crop coefficient using spectral reflectance. Agron. J. 1982, 74, 967–971. [Google Scholar] [CrossRef]
  25. Bhavsar, P.N.; Patel, J.N. Development of relationship between crop coefficient and NDVI using geospatial technology. J. Agrometeorol. 2016, 18, 261–264. [Google Scholar]
  26. Reyes-González, A. Using Remote Sensing to Estimate Crop Water Use to Improve Irrigation Water Management. Ph.D. Thesis, South Dakota State University, Brookings, SD, USA, 2017. [Google Scholar]
  27. Jackson, R.D.; Idso, S.B.; Regionato, R.J.; Pinter, P.J., Jr. Remotely sensed crop temperatures and reflectances as inputs to irrigation scheduling. In Proceedings of the Irrigation and Drainage Special Conference (ASCE), Boise, NY, USA, 23–25 July 1980; pp. 390–397. [Google Scholar]
  28. Sellers, P.J. Canopy reflectance, photosynthesis and transpiration. Int. J. Remote Sens. 1985, 6, 1335–1372. [Google Scholar] [CrossRef]
  29. Benedetti, R.; Rossinni, P. On the use of NDVI profiles as a tool for agricultural statistics: The case study of wheat yield estimate and forecast in Emilia Romagna. Remote Sens. Environ. 1993, 45, 311–326. [Google Scholar] [CrossRef]
  30. Hubbard, K.G.; Sivakumar, M.V.K. (Eds.) Automated Weather Stations for Applications in Agriculture and Water Resources Management: Current Use and Future Perspectives. In Proceedings of the International Workshop, Lincoln, NE, USA, 6–10 March 2000. [Google Scholar]
  31. Jayanthi, H.; Neale, C.M.U.; Wright, J.L. Seasonal Evapotranspiration Estimation Using Canopy Reflectance: A Case Study Involving Pink Beans. In Proceedings of the Remote Sensing and Hydrology, Santa Fe, NM, USA, 2–7 April 2000; pp. 302–305. [Google Scholar]
  32. Irmak, A.; Kamble, B. Evapotranspiration data assimilation with genetic algorithms and SWAP model for on-demand irrigation. Irrig. Sci. J. 2009, 28, 101–112. [Google Scholar] [CrossRef]
  33. Domenikiotis, C.; Spiliotopoulos, M.; Tsiros, E.; Dalezios, N.R. Early cotton production assessment in Greece based on the combination of the drought vegetation condition index (VCI) and Bhalme and Mooley drought index (BMDI). Int. J. Remote Sens. 2004, 25, 5373–5388. [Google Scholar] [CrossRef]
  34. Domenikiotis, C.; Spiliotopoulos, M.; Tsiros, E.; Dalezios, N.R. Early Cotton Yield Assessment by the use of the NOAA/AVHRR derived drought Vegetation Condition Index in Greece. Int. J. Remote Sens. 2004, 25, 2807–2819. [Google Scholar] [CrossRef]
  35. Domenikiotis, C.; Spiliotopoulos, M.; Tsiros, E.; Dalezios, N.R. Remotely sensed estimation of annual cotton production under different environmental conditions in Central Greece. Phys. Chem. Earth 2005, 30, 45–52. [Google Scholar] [CrossRef]
  36. Domenikiotis, C.; Tsiros, E.; Spiliotopoulos, M.; Dalezios, N.R. Use of NOAA/AVHRR-based Vegetation Condition Index (VCI) and Temperature Condition Index (TCI) for drought monitoring in Thessaly, Greece. In Proceedings of the EWRA Symposium—Water Resources Management: Risks and Challenges for the 21st Century, Izmir, Turkey, 2–4 September 2004; Harmancioglu, N.B., Fistikoglu, O., Dalkilic, Y., Gul, A., Eds.; Sumer: Izmir, Turkey; pp. 769–782.
  37. Tucker, C.J. Red and photographic infrared linear combinations for monitoring vegetation. Remote Sens. Environ. 1979, 8, 127–150. [Google Scholar] [CrossRef] [Green Version]
  38. Milton, E.J. Principles of field spectroscopy. Int. J. Remote Sens. 1987, 8, 1807–1827. [Google Scholar] [CrossRef]
  39. Milton, E.J.; Rollin, E.M.; Emery, D.R. Advances in field spectroscopy. In Advances in Environmental Remote Sensing; Danson, F.M., Plummer, S.E., Eds.; John Wiley & Sons: Chichester, UK, 1995. [Google Scholar]
  40. D’Urso, G.; Calera, B.A. Operative approaches to determinate crop water requirements from Earth Observation data: Methodologies and Applications. In Proceedings of the Earth Observation for Vegetation Monitoring and Water Management, Naples, Italy, 9–10 November 2005; pp. 14–25. [Google Scholar]
  41. Agapiou, A.; Papadavid, G.; Hadjimitsis, D. Surface reflectance retrieval from Landsat TM/ETM+ images for monitoring irrigation demand in Cyprus. In Proceedings of the 29th EARSeL Symposium, Chania, Greece, 15–18 June 2009. [Google Scholar]
  42. Labsphere, Technical Guide: Reference Materials. New Hampshire, USA. Available online: http://www.labsphere.com (accessed on 12 March 2017).
  43. Bastiaanssen, W.G.M.; Menenti, M.; Feddes, R.A.; Holtslag, A.A.M. A remote sensing surface energy balance algorithm for land (SEBAL): 1. Formulation. J. Hydrol. 1998, 212–212, 198–212. [Google Scholar] [CrossRef]
  44. Bastiaanssen, W.G.M.; Pelgrum, H.; Wang, J.; Ma, Y.; Moreno, J.F.; Roerink, G.J.; van der Wal, T. The Surface Energy Balance Algorithm for Land (SEBAL): Part 2 validation. J. Hydrol. 1998, 212–213, 213–229. [Google Scholar] [CrossRef]
  45. Allen, R.G.; Tasumi, M.; Trezza, R. Satellite-based energy balance for mapping evapotranspiration with internalized calibration (METRIC)—Model. ASCE J. Irrig. Drain. Eng. 2007, 133, 380–394. [Google Scholar] [CrossRef]
  46. Numata, I.; Khand, K.; Kjaersgaard, J.; Cochrane, M.; Silva, S. Evaluation of Landsat-Based METRIC modelling to provide high-spatial resolution evapotranspiration estimates for Amazonian forests. Remote Sens. 2017, 9, 46. [Google Scholar] [CrossRef]
  47. Allen, R.; Tasumi, M.; Trezza, R.; Waters, R.; Bastiaanssen, W. Surface Energy Balance Algorithm for Land (SEBAL)—Advanced Training and User’s Manual; Idaho Department of Water Resources, University of Idaho: Moscow, ID, USA, 2002. [Google Scholar]
  48. Monin, A.S.; Obukhov, A.M. Basic laws of turbulent mixing in the surface layer of the atmosphere. Contrib. Geophys. Inst. Slovak Acad. Sci. 1954, 24, 163–187. [Google Scholar]
  49. Spiliotopoulos, M.; Loukas, A.; Mylopoulos, N. A new remote sensing procedure for the estimation of crop water requirements. In Proceedings of the Third International Conference on Remote Sensing and Geoinformation of the Environment, Paphos, Cyprus, 16–19 March 2015. [Google Scholar]
  50. Sidiropoulos, P.; Tziatzios, G.; Vasiliades, L.; Mylopoulos, N.; Loukas, A. Groundwater Nitrate Contamination Integrated Modeling for Climate and Water Resources Scenarios: The Case of Lake Karla Over-Exploited Aquifer. Water 2019, 11, 1201. [Google Scholar] [CrossRef]
  51. Allen, R.G. REF-ET: Reference Evapotranspiration Calculation Software for FAO and ASCE Standardized Equations. University of Idaho. 2000. Available online: www.kimberly.uidaho.edu/ref-et (accessed on 12 March 2017).
  52. Park, J.; Choi, M. Estimation of evapotranspiration from ground-based meteorological data and global land data assimilation system (GLDAS). Stoch. Environ. Res. Risk Assess. 2015, 29, 1963–1992. [Google Scholar] [CrossRef]
  53. Kjaersgaard, J.; Allen, R.G.; Irmak, A. Improved methods for estimating monthly and growing season ET using METRIC applied to moderate resolution satellite imagery. Hydrol. Process. 2011, 23, 4028–4036. [Google Scholar] [CrossRef]
  54. Fleming, D.J. Effect of Relative Spectral Response on Multi-Spectral Measurements and NDVI from Different Remote Sensing Systems. Ph.D. Thesis, University of Maryland, College Park, MD, USA, 2006. [Google Scholar]
  55. Papadavid, G. Estimating Evapotranspiration for Annual Crops in Cyprus Using Remote Sensing. Ph.D. Thesis, Department of Civil Engineering and Geomatics, Cyprus University of Technology, Lemesos, Cyprus, 2012. [Google Scholar]
  56. Jiang, Z.; Huete, A.; Didan, K.; Miura, T. Development of a Two-Band Enhanced Vegetation Index without a Blue Band. Remote Sens. Environ. 2008, 112, 3833–3845. [Google Scholar] [CrossRef]
  57. O’Connell, J.; Connolly, J.; Vermote, E.F.; Holden, N.M. Radiometric normalization for change detection in peatlands: A modified temporal invariant cluster approach. Int. J. Remote Sens. 2013, 34, 2905–2924. [Google Scholar] [CrossRef]
  58. Spiliotopoulos, M.; Holden, N.; Loukas, A. Mapping Evapotranspiration Coefficients in a Temperate Maritime Climate Using the METRIC Model and Landsat TM. Water 2017, 9, 23. [Google Scholar] [CrossRef]
  59. FAO. CROPWAT, a Computer Program for Irrigation Planning and Management by M. Smith; FAO Irrigation and Drainage Paper No. 26; FAO: Rome, Italy, 1992. [Google Scholar]
  60. Tsouni, A.; Kontoes, C.; Koutsoyiannis, D.; Elias, P.; Mamassis, N. Estimation of Actual Evapotranspiration by Remote Sensing: Application in Thessaly Plain, Greece. Sensors 2008, 8, 3586–3600. [Google Scholar] [CrossRef] [PubMed]
  61. Dalezios, N.R.; Mplanta, A.; Domenikiotis, C. Remotely sensed cotton evapotranspiration for irrigation water management in vulnerable agriculture of Central Greece. J. Inf. Technol. Agric. 2011, 4, 1–14. [Google Scholar]
  62. Vasiliades, L.; Spiliotopoulos, M.; Tzabiras, J.; Loukas, A.; Mylopoulos, N. Estimation of crop water requirements using remote sensing for operational water resources management. In Proceedings of the Third International Conference on Remote Sensing and Geoinformation of the Environment, Paphos, Cyprus, 16–19 March 2015. [Google Scholar]
  63. Melton, F.S.; Johnson, L.F.; Lund, C.P.; Pierce, L.L.; Michaelis, A.R.; Hiatt, S.H.; Guzman, A.; Adhikari, D.D.; Purdy, A.J.; Rosevelt, C. Satellite irrigation management support with the terrestrial observation and prediction system: A framework for integration of satellite and surface observations to support improvements in agricultural water resource management. IEEE J. Sel. Top. Appl. Earth Obs. Remote Sens. 2012, 5, 1709–1721. [Google Scholar] [CrossRef]
  64. Singh, R.K.; Irmak, A. Estimation of crop coefficients using satellite remote sensing. J. Irrig. Drain. Eng. 2009, 135, 597–608. [Google Scholar] [CrossRef]
  65. Calera, A.; Campos, I.; Osann, A.; D’Urso, G.; Menenti, M. Remote sensing for crop water management: From ET modelling to services for the end users. Sensors 2017, 17, 1104. [Google Scholar] [CrossRef] [PubMed]
  66. Tasumi, M.; Allen, R.G.; Trezza, R. Calibrating satellite-based vegetation indices to estimate evapotranspiration and crop coefficients. In Proceedings of the USCID Water Management Conference, Boise, ID, USA, 25–28 October 2006. [Google Scholar]
  67. Campos, I.; Balbontin, C.; González-Piqueras, J.; González-Dugo, M.P.; Neale, C.; Calera, A. Combining water balance model with evapotranspiration measurements to estimate total available water soil water in irrigated and rain-fed vineyards. Agric. Water Manag. 2016, 165, 141–152. [Google Scholar] [CrossRef]
  68. Allen, R.G.; Clemmens, A.J.; Burt, C.M.; Solomon, K.; O’Halloran, T. Prediction accuracy for project wide evapotranspiration using crop coefficients and reference evapotranspiration. J. Irrig. Drain. Eng. 2005, 131, 24–36. [Google Scholar] [CrossRef]
  69. Reyes-González, A.; Kjaersgaard, J.; Trooien, T.; Hay, C.; Ahiablame, L. Estimation of Crop Evapotranspiration Using Satellite Remote Sensing-Based Vegetation Index. Adv. Meteorol. 2018, 2018, 4525021. [Google Scholar] [CrossRef]
  70. Abuzar, M.; Whitfield, D.; McAllister, A.; Sheffield, K. Application of ET-NDVI-relationship approach and soil-water-balance modelling for the monitoring of irrigation performance of treed horticulture crops in a key fruit-growing district of Australia. Int. J. Remote Sens. 2019, 40, 4724–4742. [Google Scholar] [CrossRef]
  71. Allen, R.; Morton, C.; Kamble, B.; Kilic, A.; Huntington, J.; Thau, D.; Gorelick, N.; Erickson, T.; Moore, R.; Trezza, R.; et al. EEFlux: A Landsat-based Evapotranspiration mapping tool on the Google Earth Engine. In Proceedings of the Joint ASABE/IA Irrigation Symposium 2015: Emerging Technologies for Sustainable Irrigation, Long Beach, CA, USA, 10–12 November 2015; pp. 424–433. [Google Scholar]
  72. Congalton, R.G.; Green, K. Assessing the Accuracy of Remotely Sensed Data: Principles and Practices; Lewis Publishers: Boca Raton, FL, USA, 1999. [Google Scholar]
  73. Foody, G.M. What is the difference between two maps? A remote sensor’s view. J. Geogr. Syst. 2006, 8, 119–130. [Google Scholar] [CrossRef]
  74. Myint, S.W.; Yuan, M.; Cerveny, R.S.; Giri, C.P. Comparison of remote sensing image processing techniques to identify tornado damage areas from Landsat TM data. Sensors 2008, 8, 1128–1156. [Google Scholar] [CrossRef] [PubMed]
  75. Hayes, D.J.; Sader, S.A. Comparison of change-detection techniques for monitoring tropical forest clearing and vegetation regrowth in a time series. Photogramm. Eng. Remote Sens. 2001, 67, 1067–1075. [Google Scholar]
  76. Rafn, E.B.; Contor, B.; Ames, D.P. Evaluation of a Method for Estimating Irrigated Crop-Evapotranspiration Coefficients from Remotely Sensed Data in Idaho. J. Irrig. Drain. Eng. 2008, 134, 722–729. [Google Scholar] [CrossRef]
  77. Doorenbos, J.; Pruitt, W.O. Guidelines for Predicting Crop Water Requirements. In FAO Irrigation and Drainage Paper No. 24; FAO: Rome, Italy, 1977. [Google Scholar]
  78. Doorenbos, J.; Kassam, A. Yield Response to Water. In FAO Irrigation and Drainage Paper No. 33; FAO: Rome, Italy, 1979. [Google Scholar]
  79. Karioti, K. Land Use and Water Needs Mapping for Lake Karla Watershed. Master’s Thesis, University of Thessaly, Volos, Greece, 2013. (In Greek). [Google Scholar]
Figure 1. GER1500 field spectroradiometer.
Water 11 01364 g001
Figure 2. Geographical location of Karla Watershed, Greece.
Water 11 01364 g002
Figure 3. Raw GER1500 reflectance values for selected cotton fields.
Water 11 01364 g003
Figure 4. Relative spectral responses (RSRs): Landsat 7 (source: U.S. Geological Survey (USGS) spectral viewer).
Water 11 01364 g004
Figure 5. Methodology flowchart. VI = vegetation indices; NDVI = Normalized Difference Vegetation Index; OLI = Operational Land Imager; TIRS = Thermal Infrared Sensor; Kc = crop coefficient; ETrF = evapotranspiration fraction; ETa = actual evapotranspiration; ETref = reference evapotranspiration.
Water 11 01364 g005
Figure 6. Mapping ETrF at high Resolution and with Internalized Calibration (METRIC) computation for 13 June 2012.
Water 11 01364 g006
Figure 7. Plots between ETrF and VIs for 2012 growing/cultivation season: (a) Corn; (b) cotton; (c) sugar beet; and (d) general. Subscript 1 denotes ETrF versus NDVI, Subscript 2 denotes ETrF versus SAVI, and Subscript 3 denotes ETrF versus EVI2. All axes are unitless.
Water 11 01364 g007
Figure 8. Scatterplot of in-situ NDVI versus Landsat NDVI values.
Water 11 01364 g008
Figure 9. Plot between ETrF and NDVI training data.
Water 11 01364 g009
Figure 10. Scatterplot of ETrF values based on Equation (26) versus ETrF values based on Equation (29).
Water 11 01364 g010
Figure 11. Scatterplot of METRIC ETrF versus modeled ETrF values.
Water 11 01364 g011
Figure 12. ETrF difference map between METRIC estimated values and values calculated using the proposed methodology for 14 June 2015.
Water 11 01364 g012
Figure 13. ETrF difference map between METRIC estimated values and values calculated using the proposed methodology after masking 14 June 2015.
Water 11 01364 g013
Table 1. Data availability of Landsat ETM+ and in-situ GER1500 in study area.
Landsat 7 ETM+ and In-Situ GER1500 Data Availability
AcquisitionJulian Day AcquisitionPath/RowGER1500 AvailabilityETM+ Availability
26 April 2012117184/032NOYES
12 May 2012133184/032YESYES
22 May 2012143184/032YESNO
13 June 2012165184/032NOYES
29 June 2012181184/032YESYES
13 July 2012195184/032YESNO
15 July 2012197184/032NOYES
31 July 2012213184/032YESYES
16 August 2012229184/032YESNO
01 September 2012245184/032YESYES
03 October 2012277184/032NOYES
19 October 2012293184/032NOYES
26 April 2012117184/033NOYES
12 May 2012133184/033NOYES
13 June 2012165184/033NOYES
29 June 2012181184/033NOYES
15 July 2012197184/033NOYES
31 July 2012213184/033NOYES
01 September 2012245184/033NOYES
03 October 2012277184/033YESYES
19 October 2012293184/033NOYES
Table 2. Linear relationships between ETrF and vegetation indices (Vis) for 2012 growing/cultivation season. RMSE = Root Mean Square Error; MAE = Mean Absolute Error; CV = coefficient of variation; SAVI = Soil Adjusted Vegetation Index; EVI2 = Enhanced Vegetation Index 2.
Corn
IndexEquationR2RMSEMAECV
NDVIy = 1.93x − 0.98 (Equation (17))0.960.070.060.14
SAVIy = 0.91x − 0.01 (Equation (18))0.950.120.100.40
EVI2y = 0.62x − 0.86 (Equation (19))0.860.320.401.33
Cotton
IndexEquationR2RMSEMAECV
NDVIy = 0.51x + 0.36 (Equation (20))0.820.160.150.23
SAVIy = 0.50 + 0.28 (Equation (21))0.830.200.170.34
EVI2y = 0.56x + 0.12 (Equation (22))0.670.340.300.82
Sugar Beet
IndexEquationR2RMSEMAECV
NDVIy = 0.88x − 0.16 (Equation (23))0.910.210.190.54
SAVIy = 0.97x − 0.10 (Equation (24))0.900.230.210.62
EVI2y = 0.80x − 0.10 (Equation (25))0.860.440.422.17
General *
IndexEquationR2RMSEMAECV
NDVIy = 0.92x + 0.03 (Equation (26))0.860.110.090.21
SAVIy = 0.83x + 0.021 (Equation (27))0.870.190.160.46
EVI2y = 0.70x − 0.01 (Equation (28))0.820.370.341.45
* N.B. Equations (26–28) have been developed using all available data for the three crops.
Table 3. Average Crop Irrigation Requirement values (mm).
24 June 2013METRIC Based KcProposed KcCROPWAT’s Crop Water Irrigation Requirements (mm)—Using Proposed KcCROPWAT’s Crop Water Irrigation Requirements (mm)—Using Proposed KcCrop Irrigation Requirements Difference
Cotton Average values
0.710.713.673.670
Sugar beet Average values
0.750.754.054.030.49
Corn Average values
0.770.764.064.011.23