Is Urban Economic Output Decoupling from Water Use in Developing Countries?—Empirical Analysis of Beijing and Shanghai, China


Abstract
:1. Introduction
2. Literature Review
2.1. Overview of the Decoupling Theory
2.1.1. Research at the National or Provincial Level
2.1.2. Research at the Global or Multiple National Level
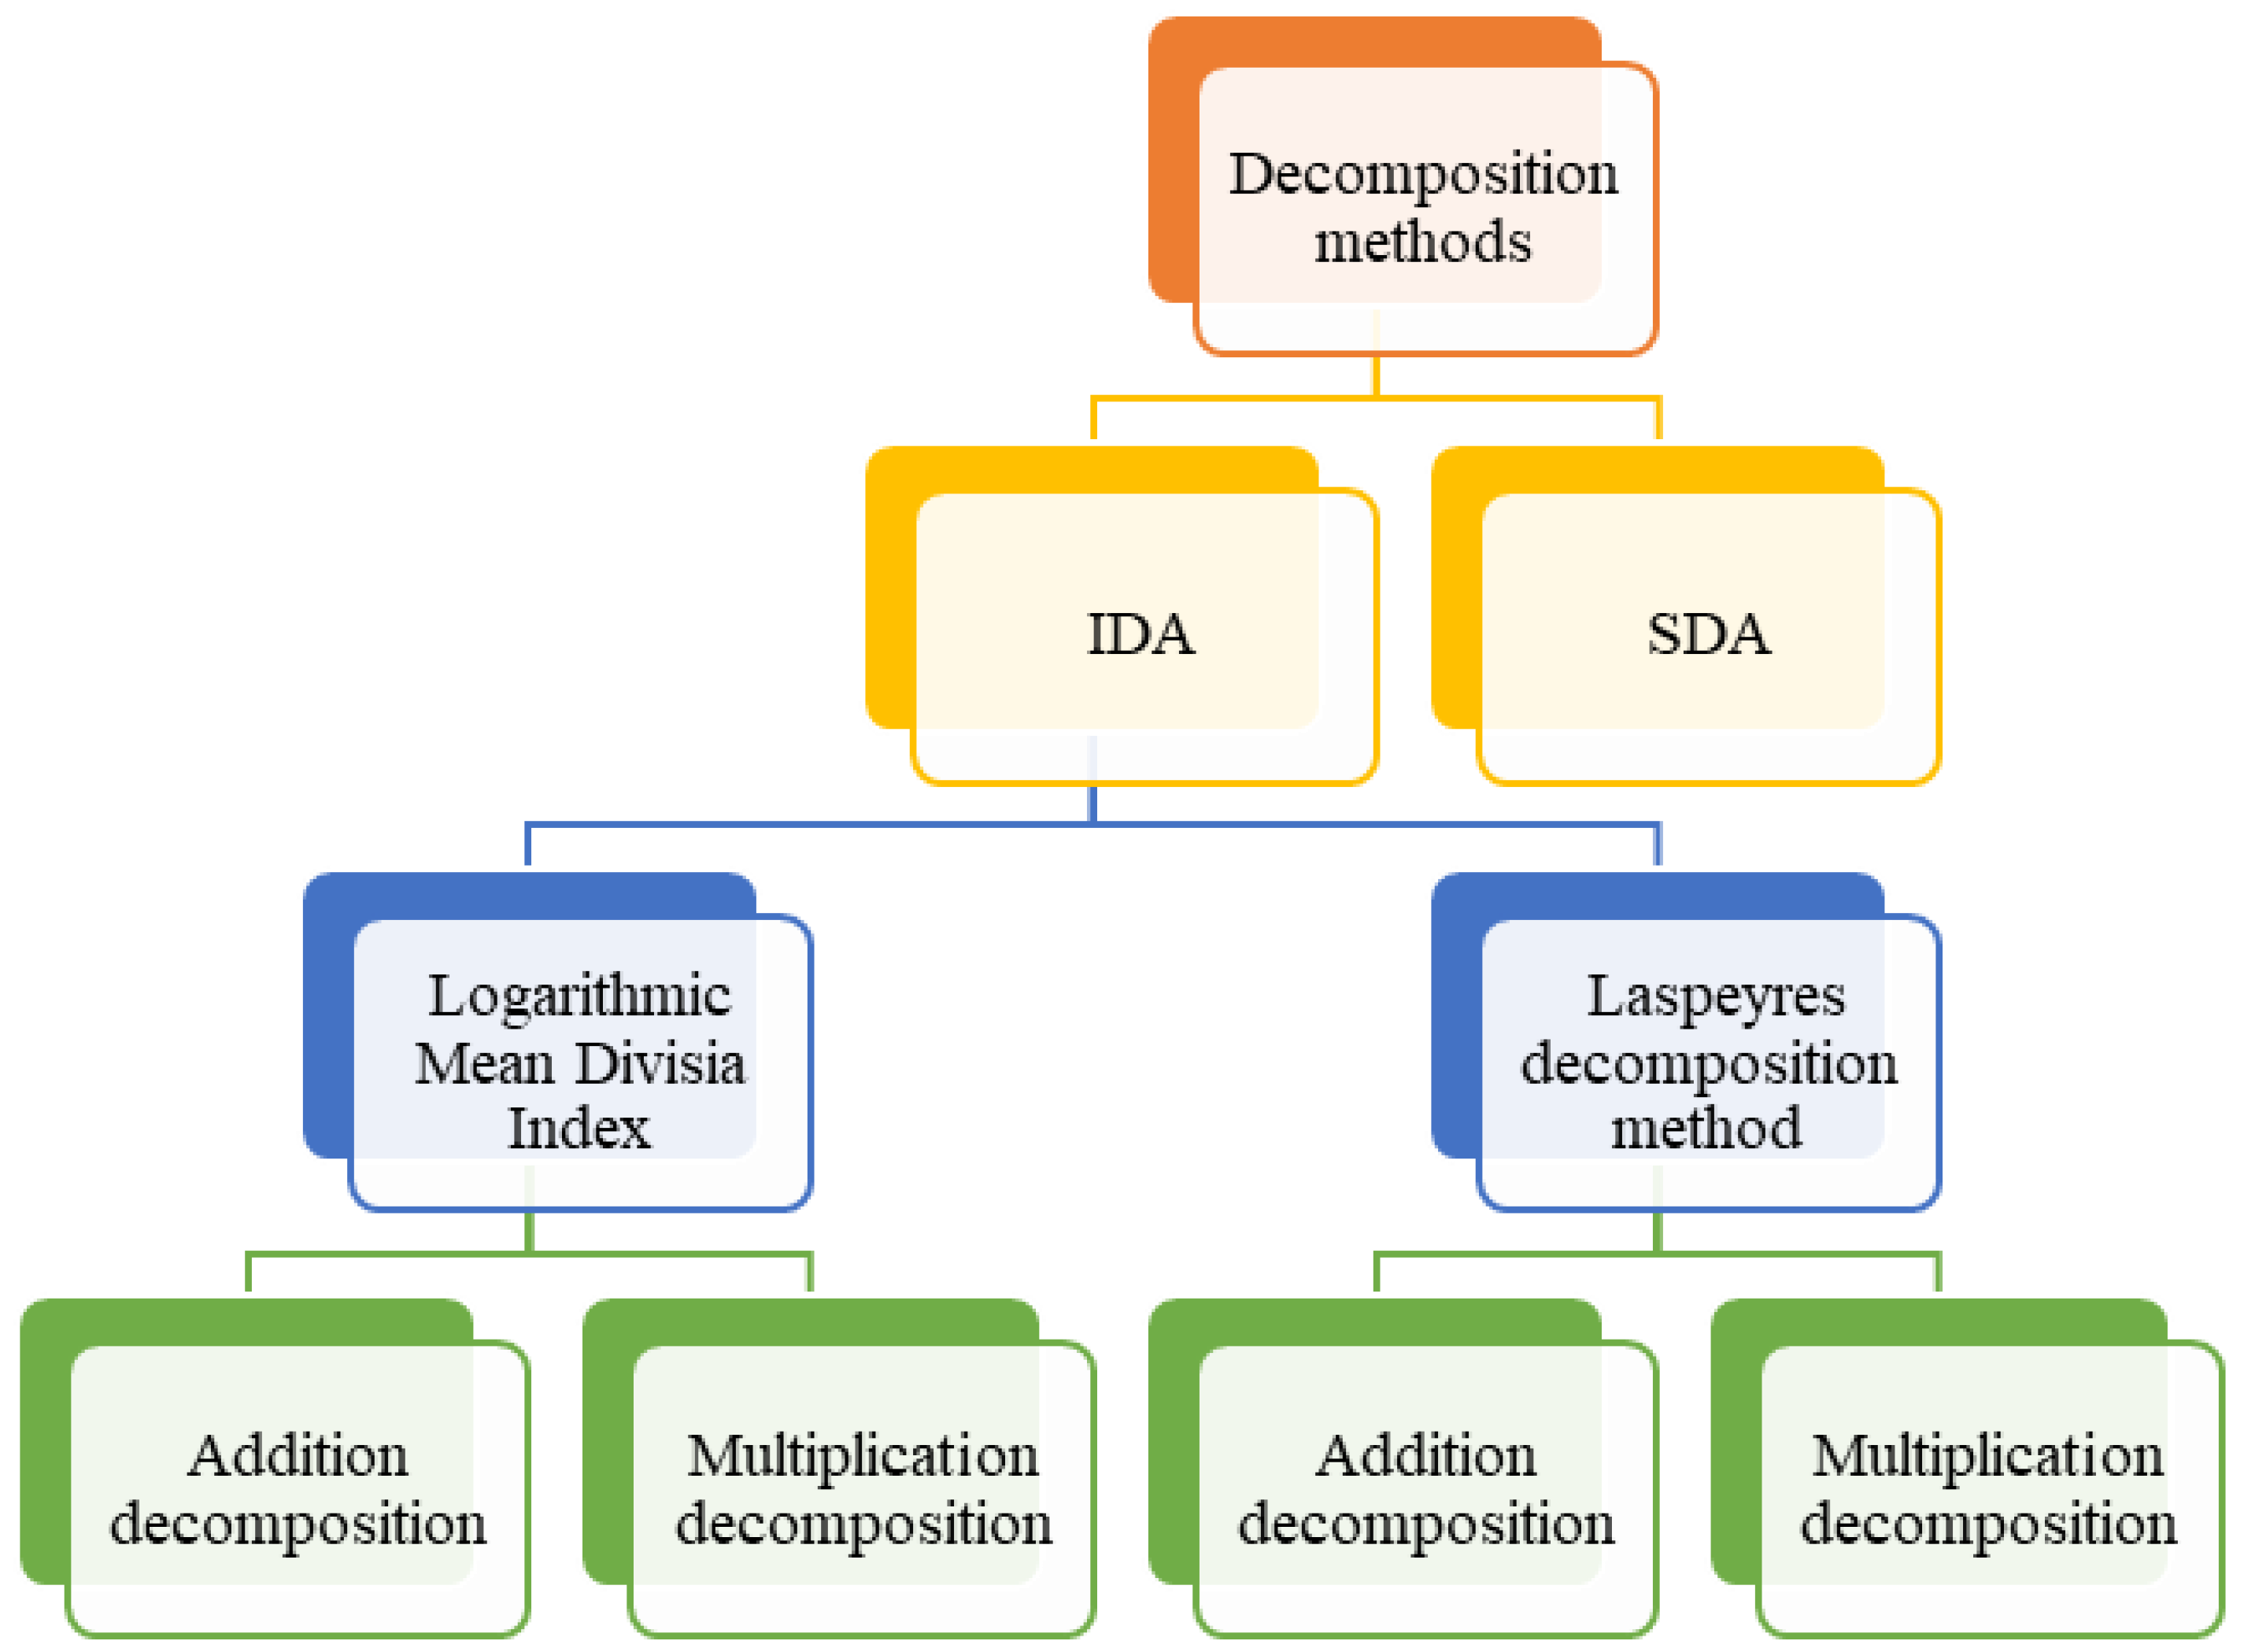
2.2. Overview of Decoupling Analyses Based on Decomposition Methods
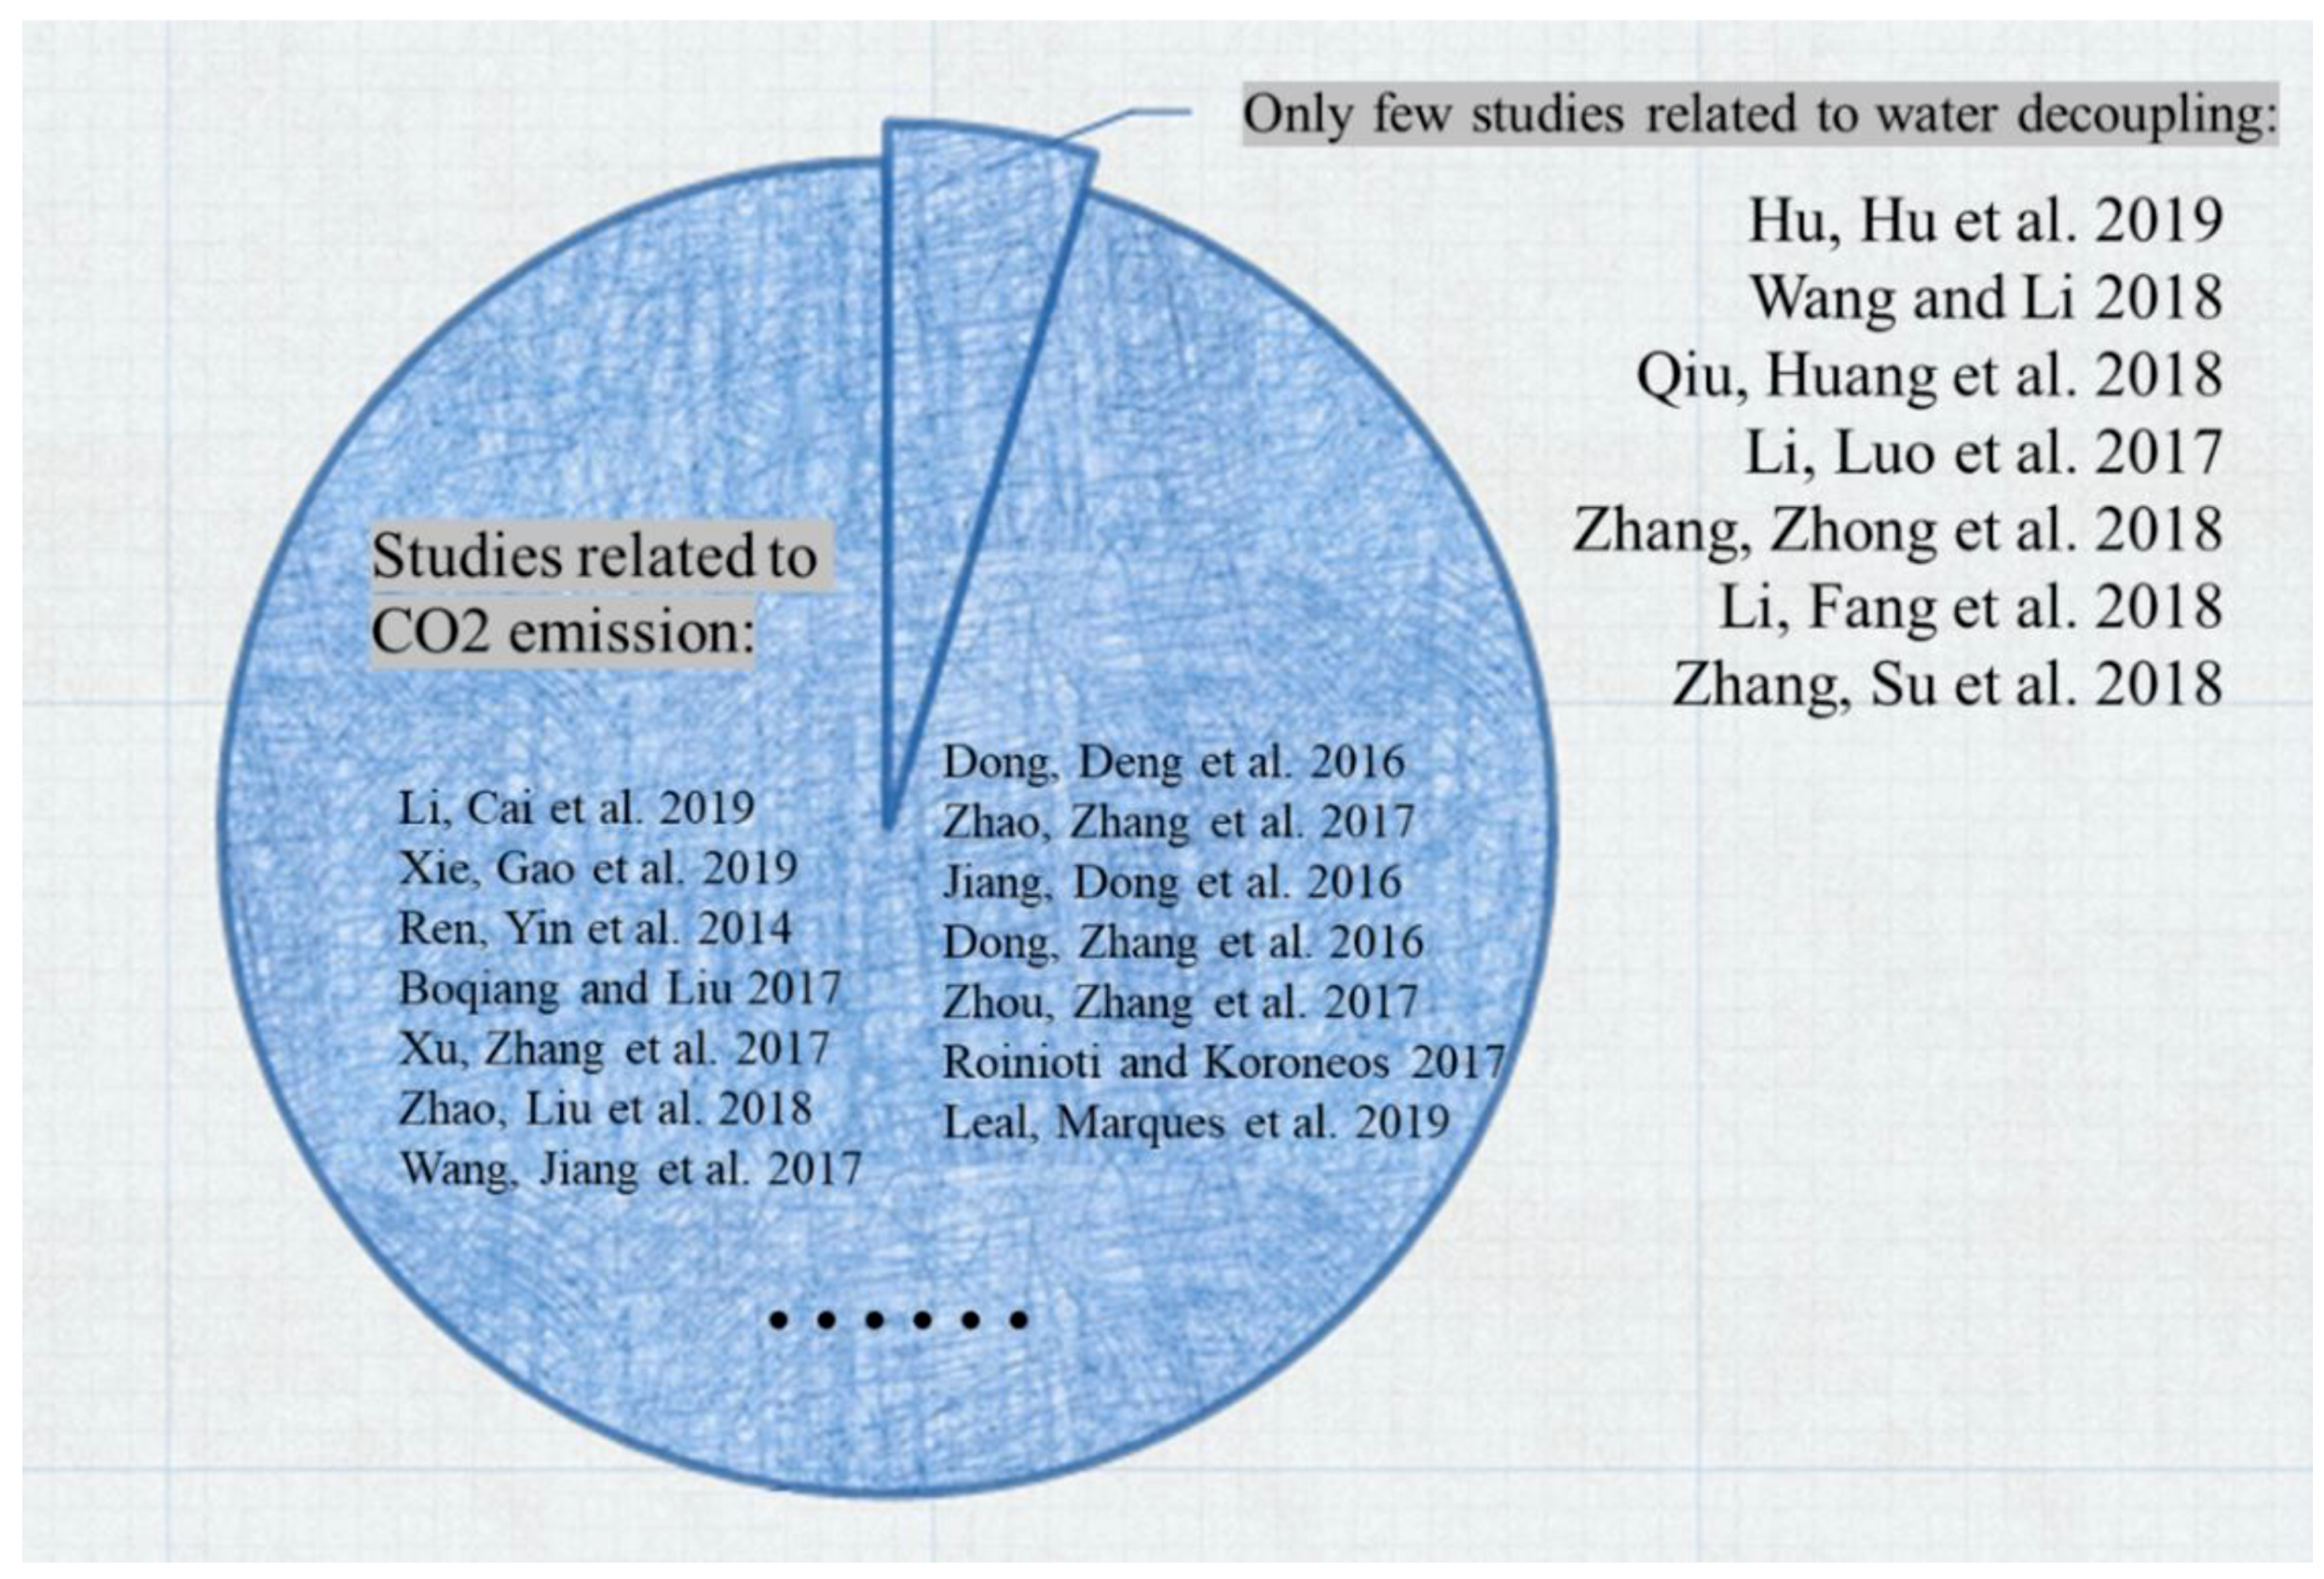
2.3. Research on Water Decoupling
3. Methodology and Data
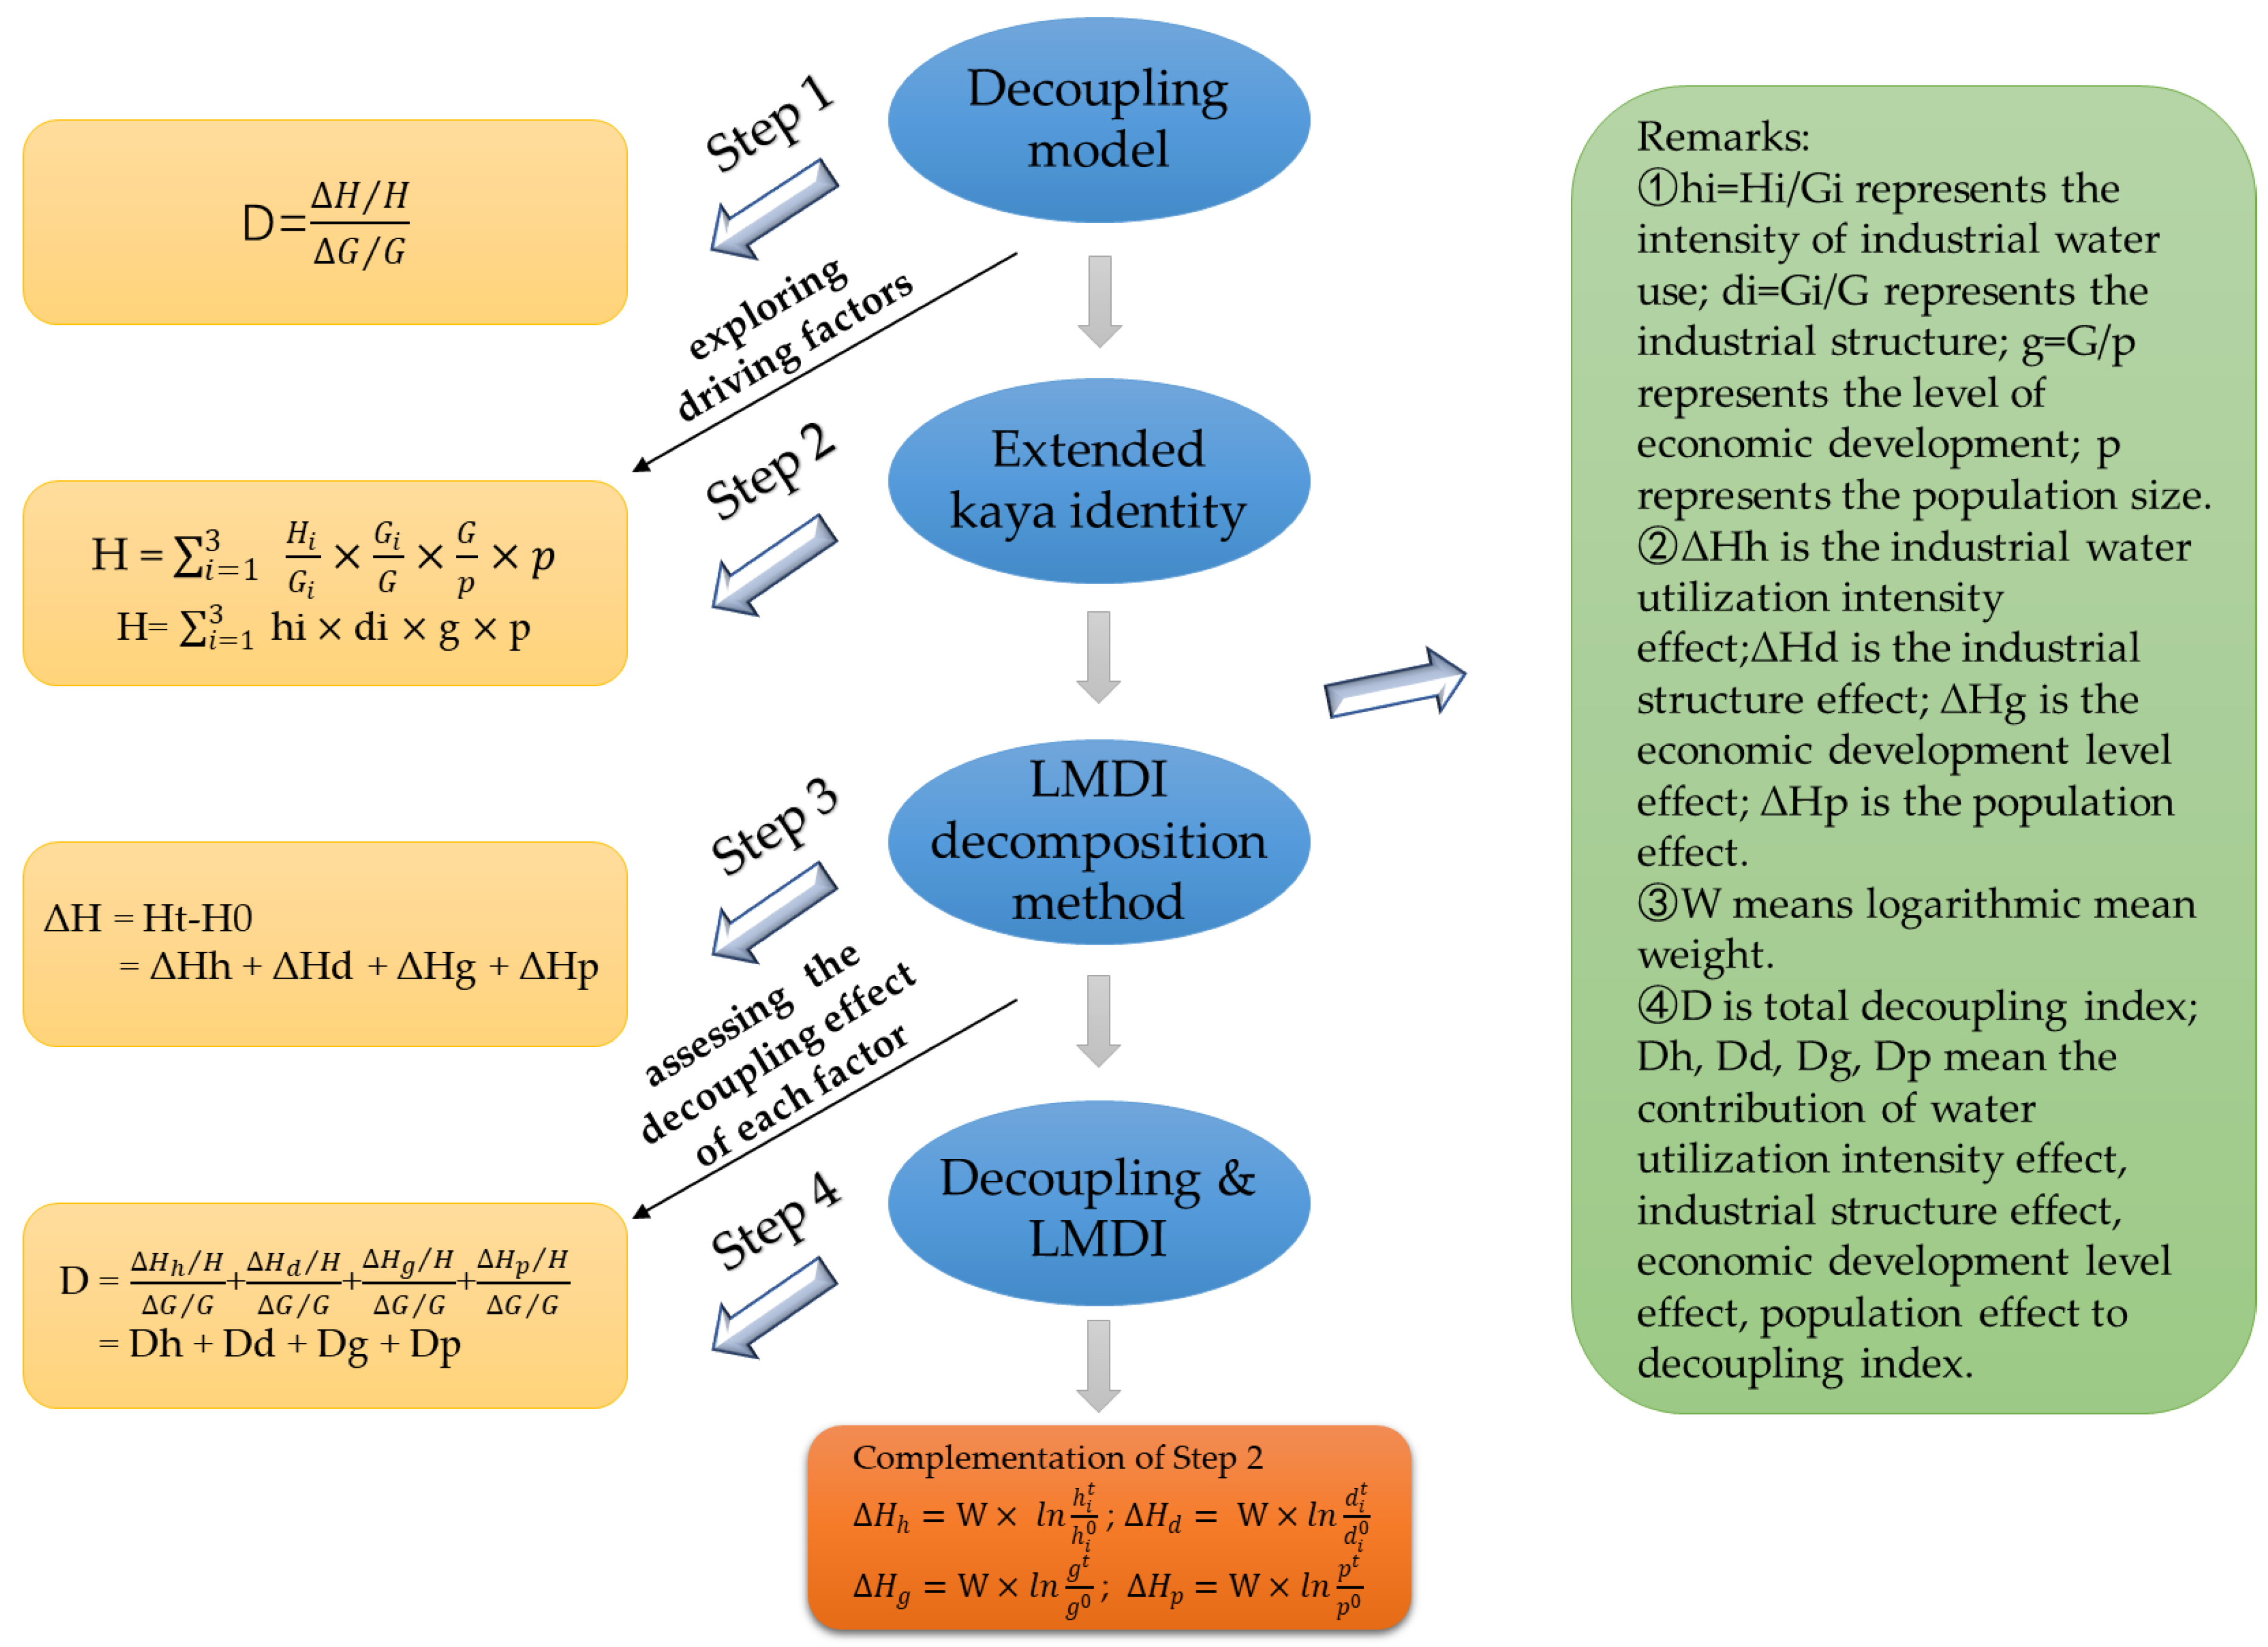
3.1. Water Decoupling Model
3.2. Water Decoupling Decomposition Model Based on LMDI
3.3. Data Sources
4. Results and Discussion
4.1. Analysis of the Decoupling Relationship
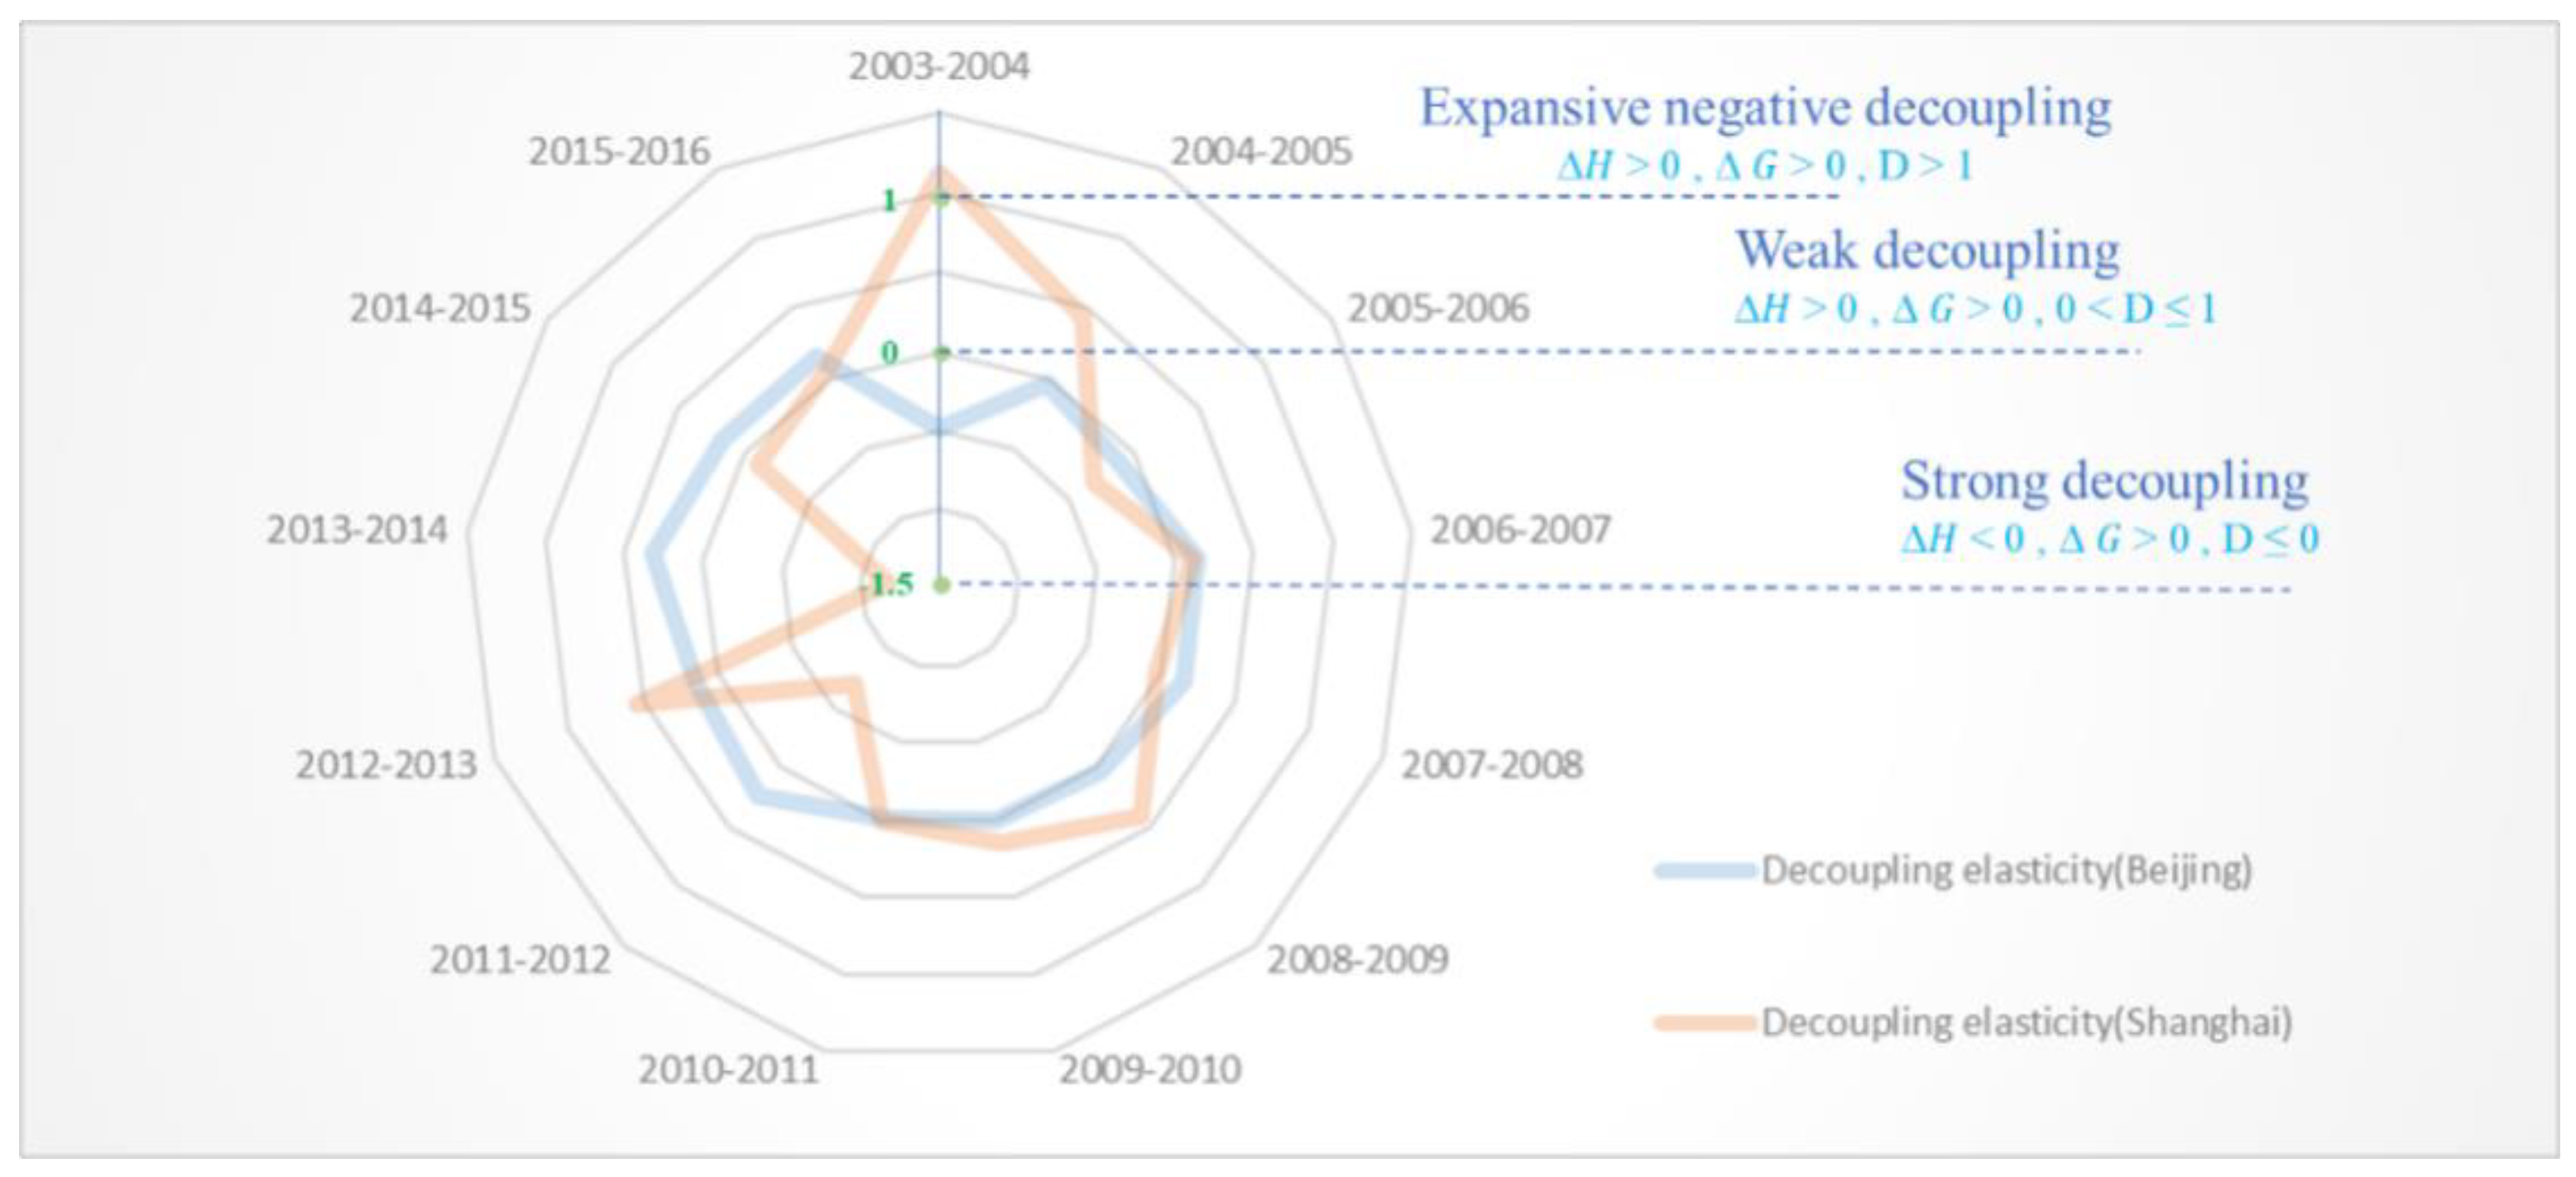
4.1.1. Decoupling between Total Water Consumption and Economic Growth in Beijing and Shanghai
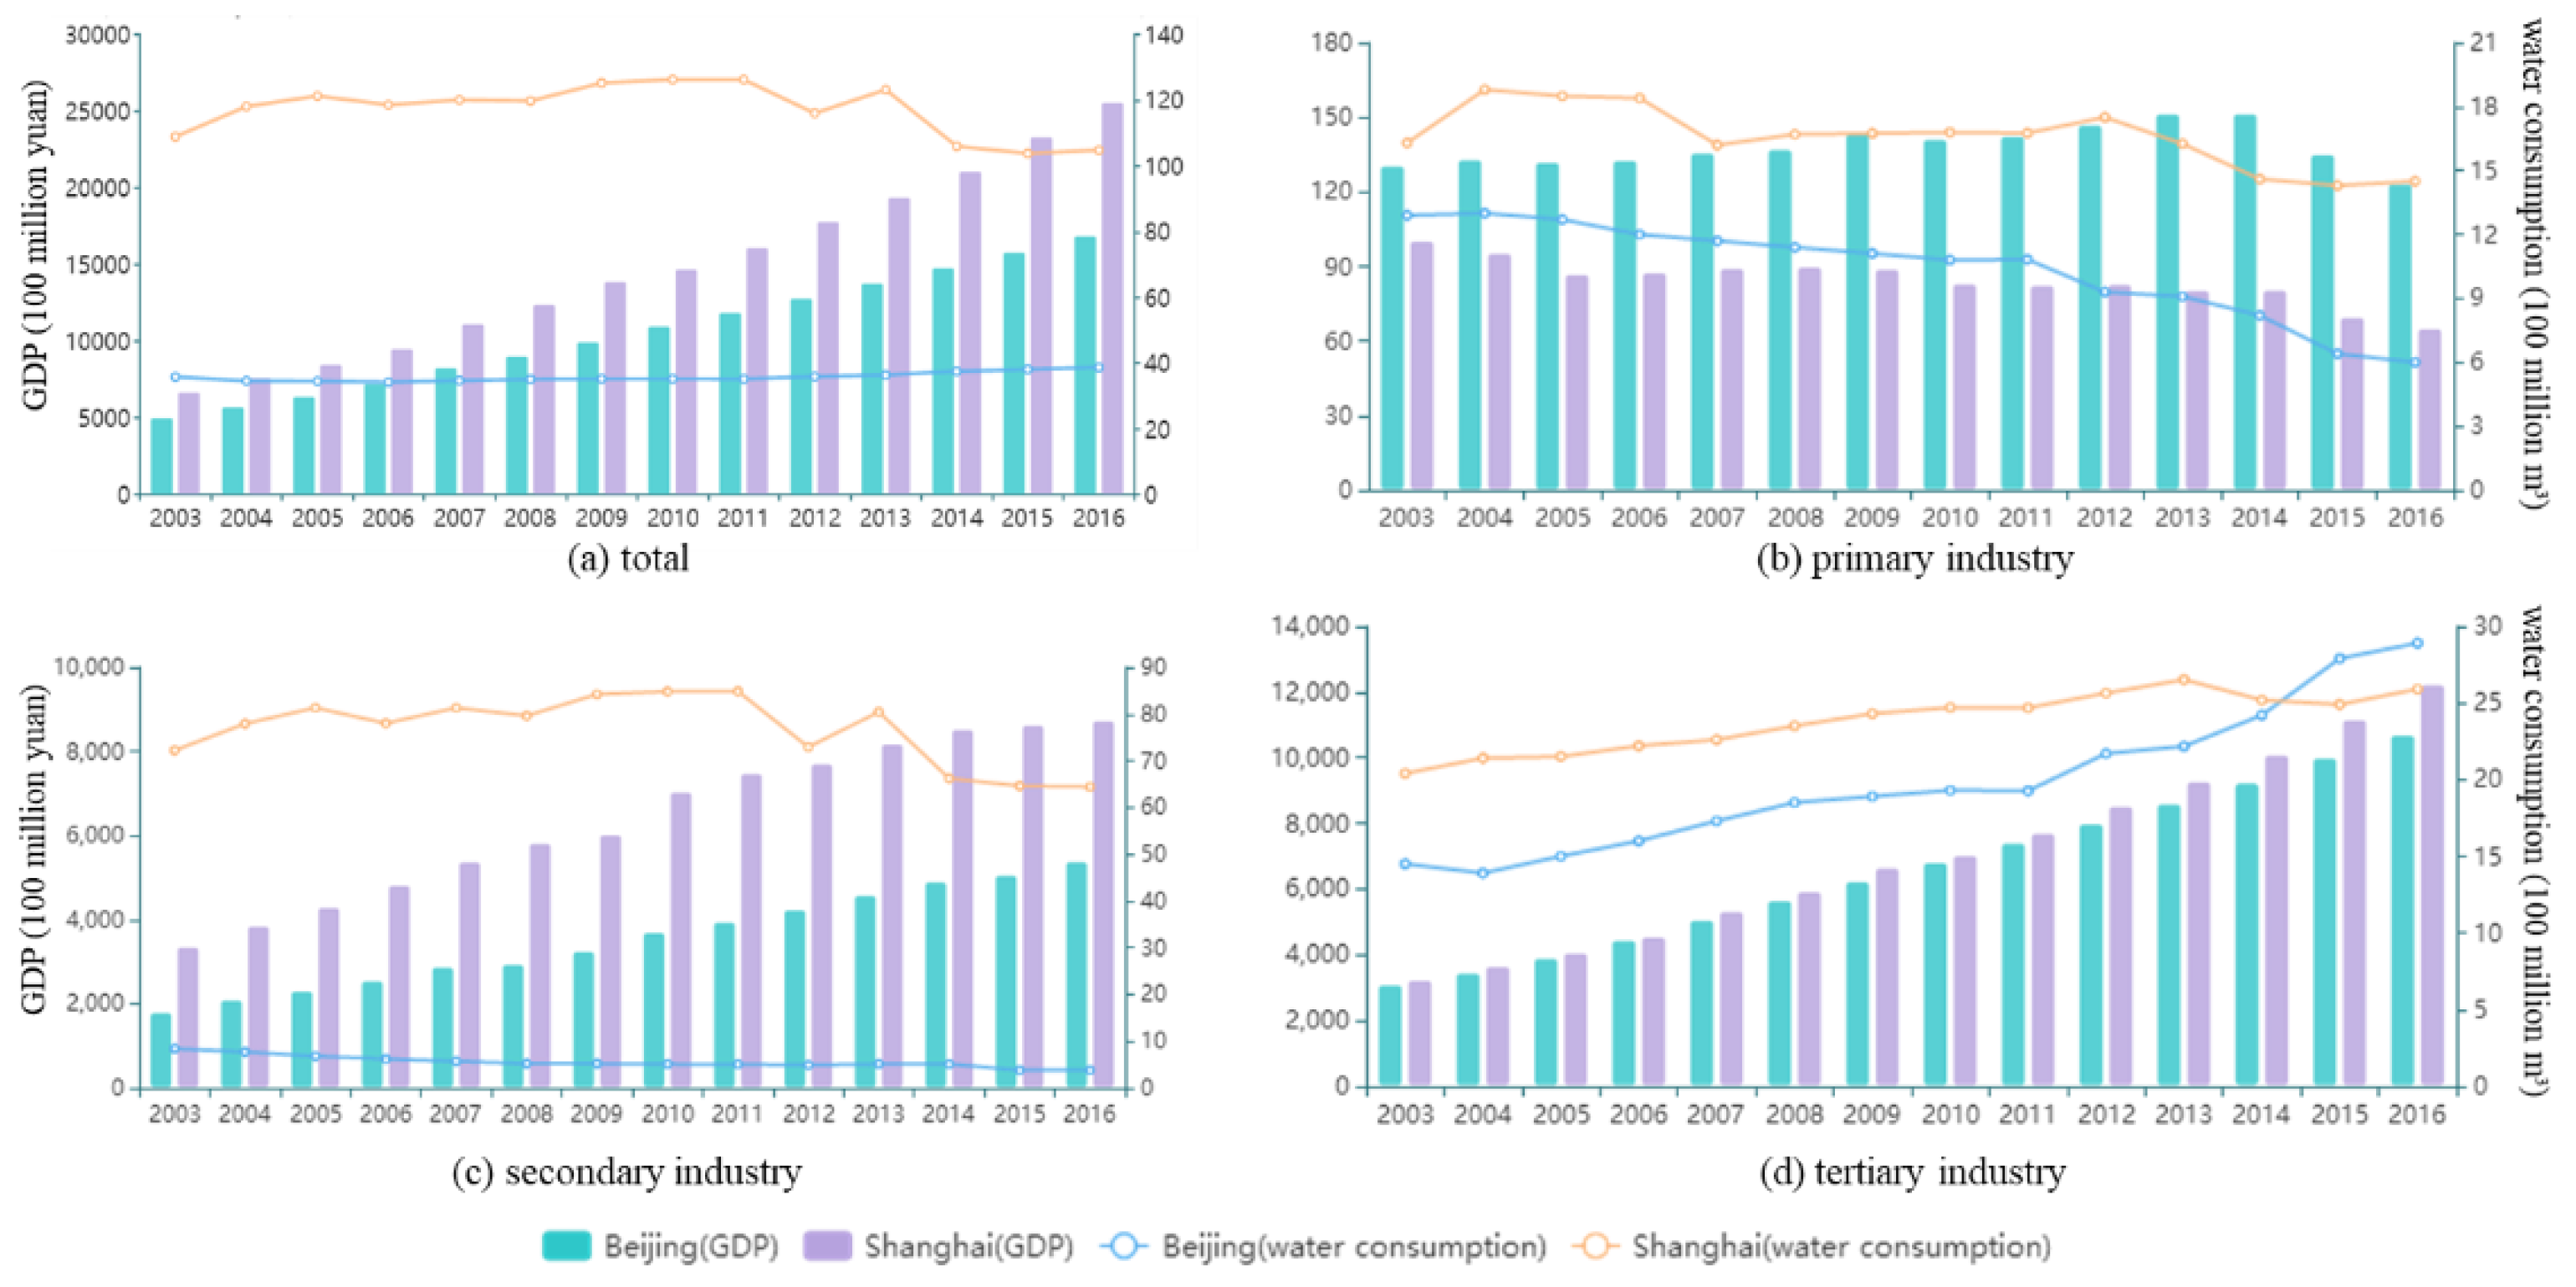
4.1.2. Decoupling between Water Consumption and Economic Growth of Three Industries in Beijing and Shanghai
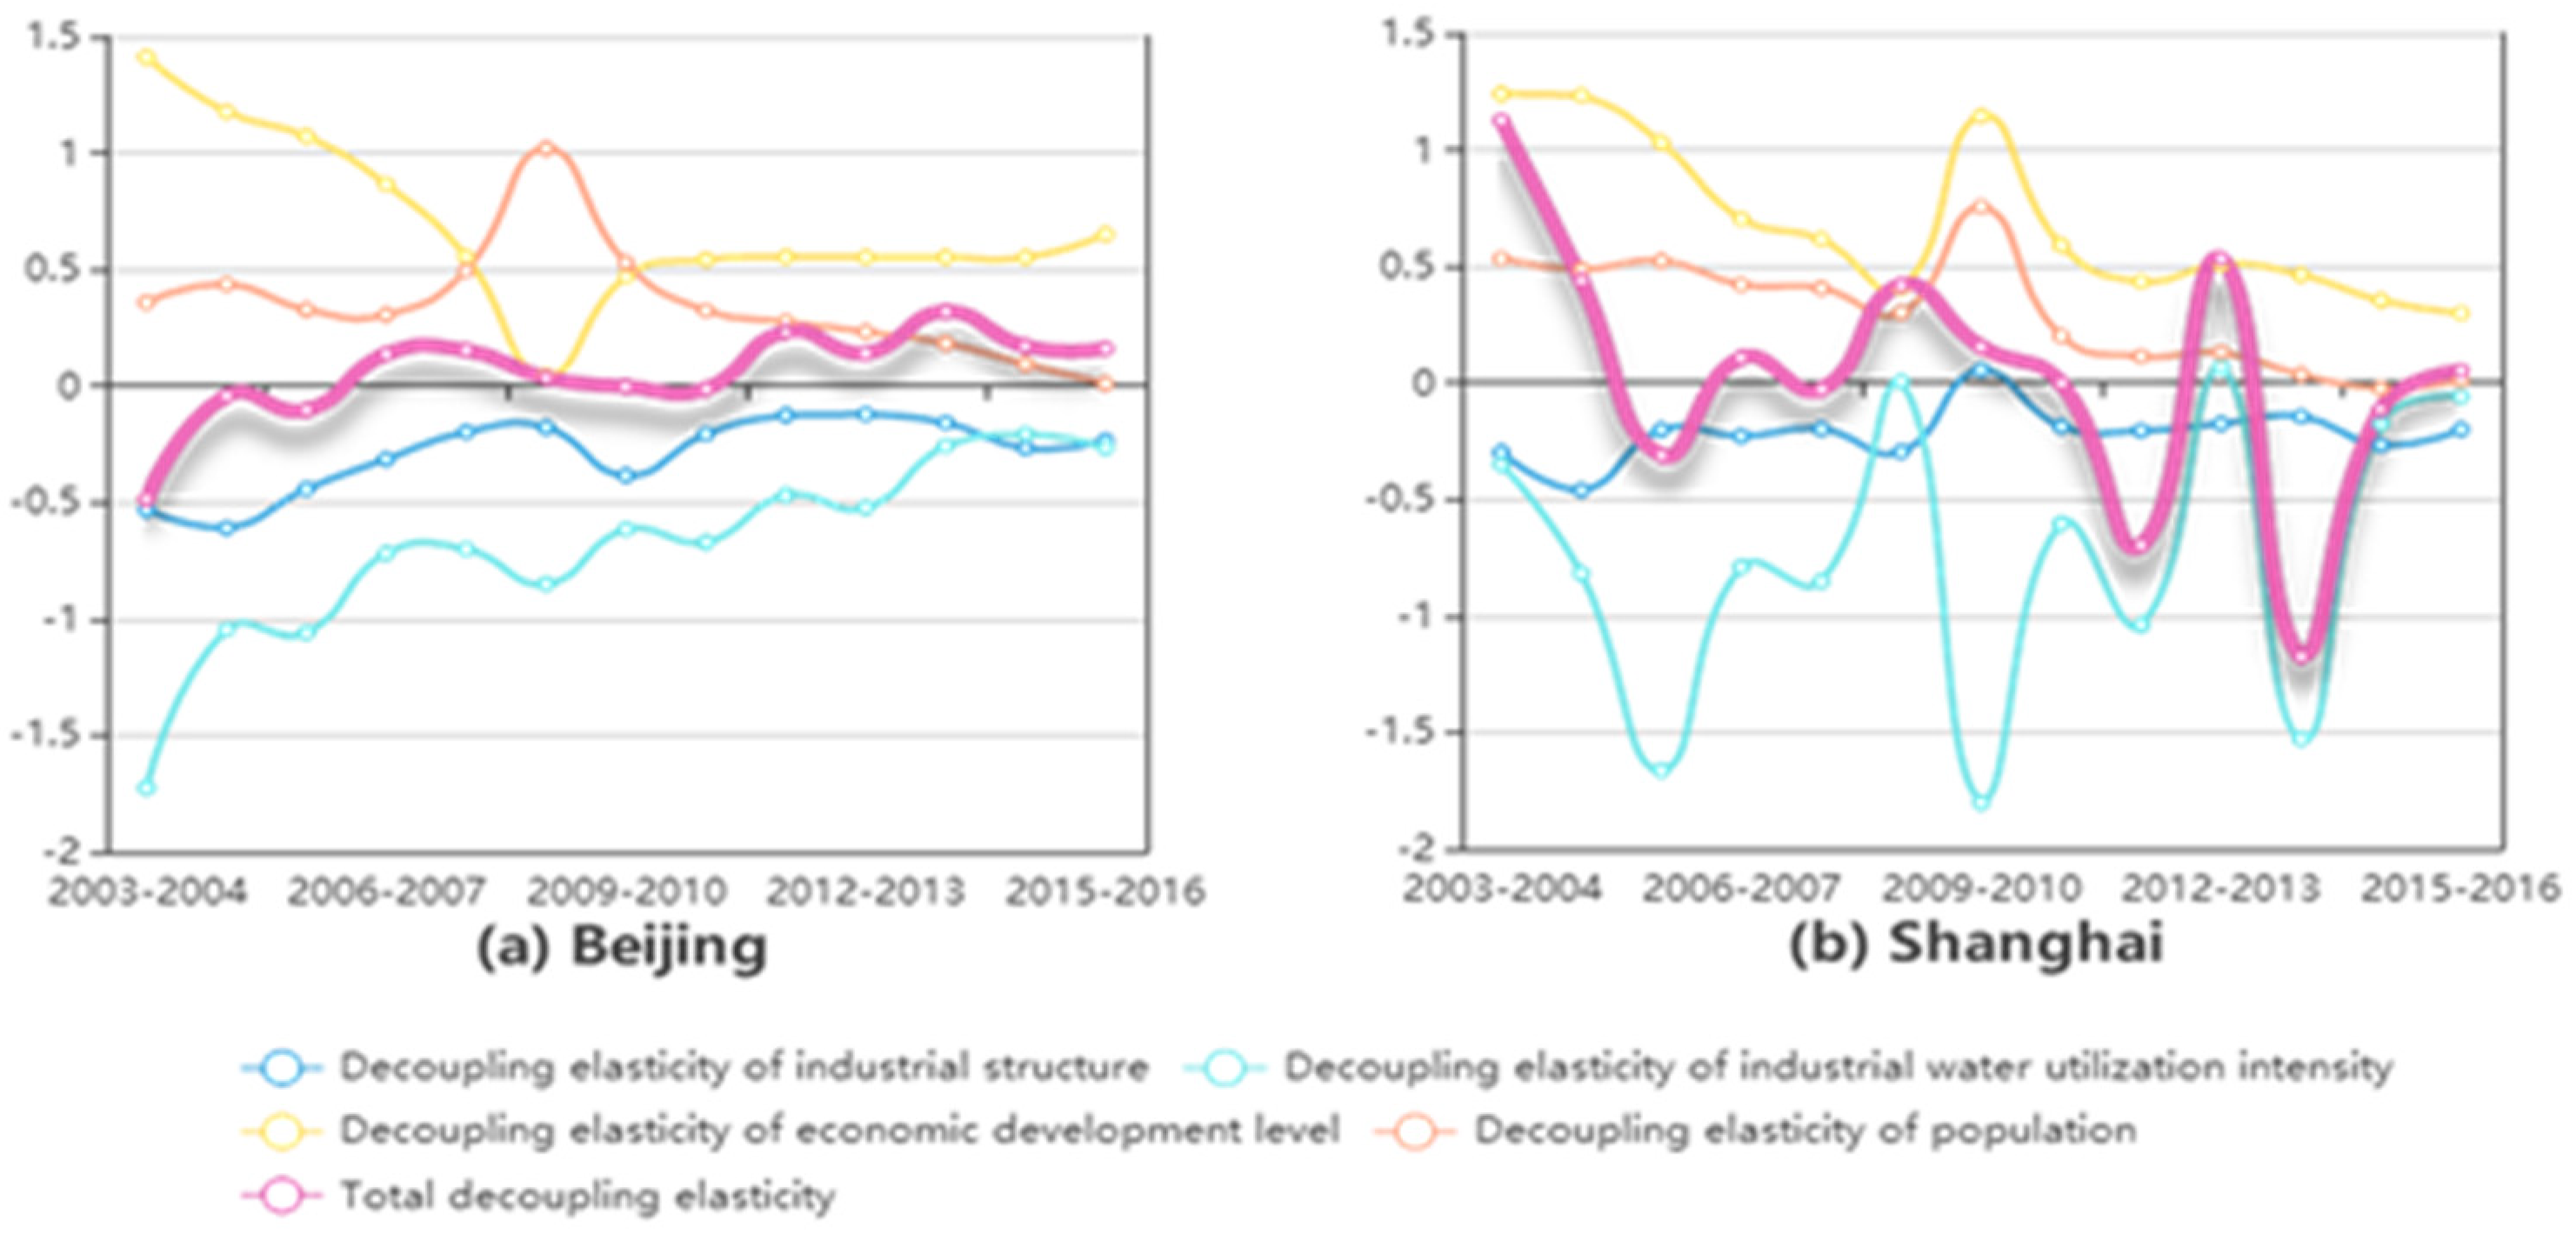
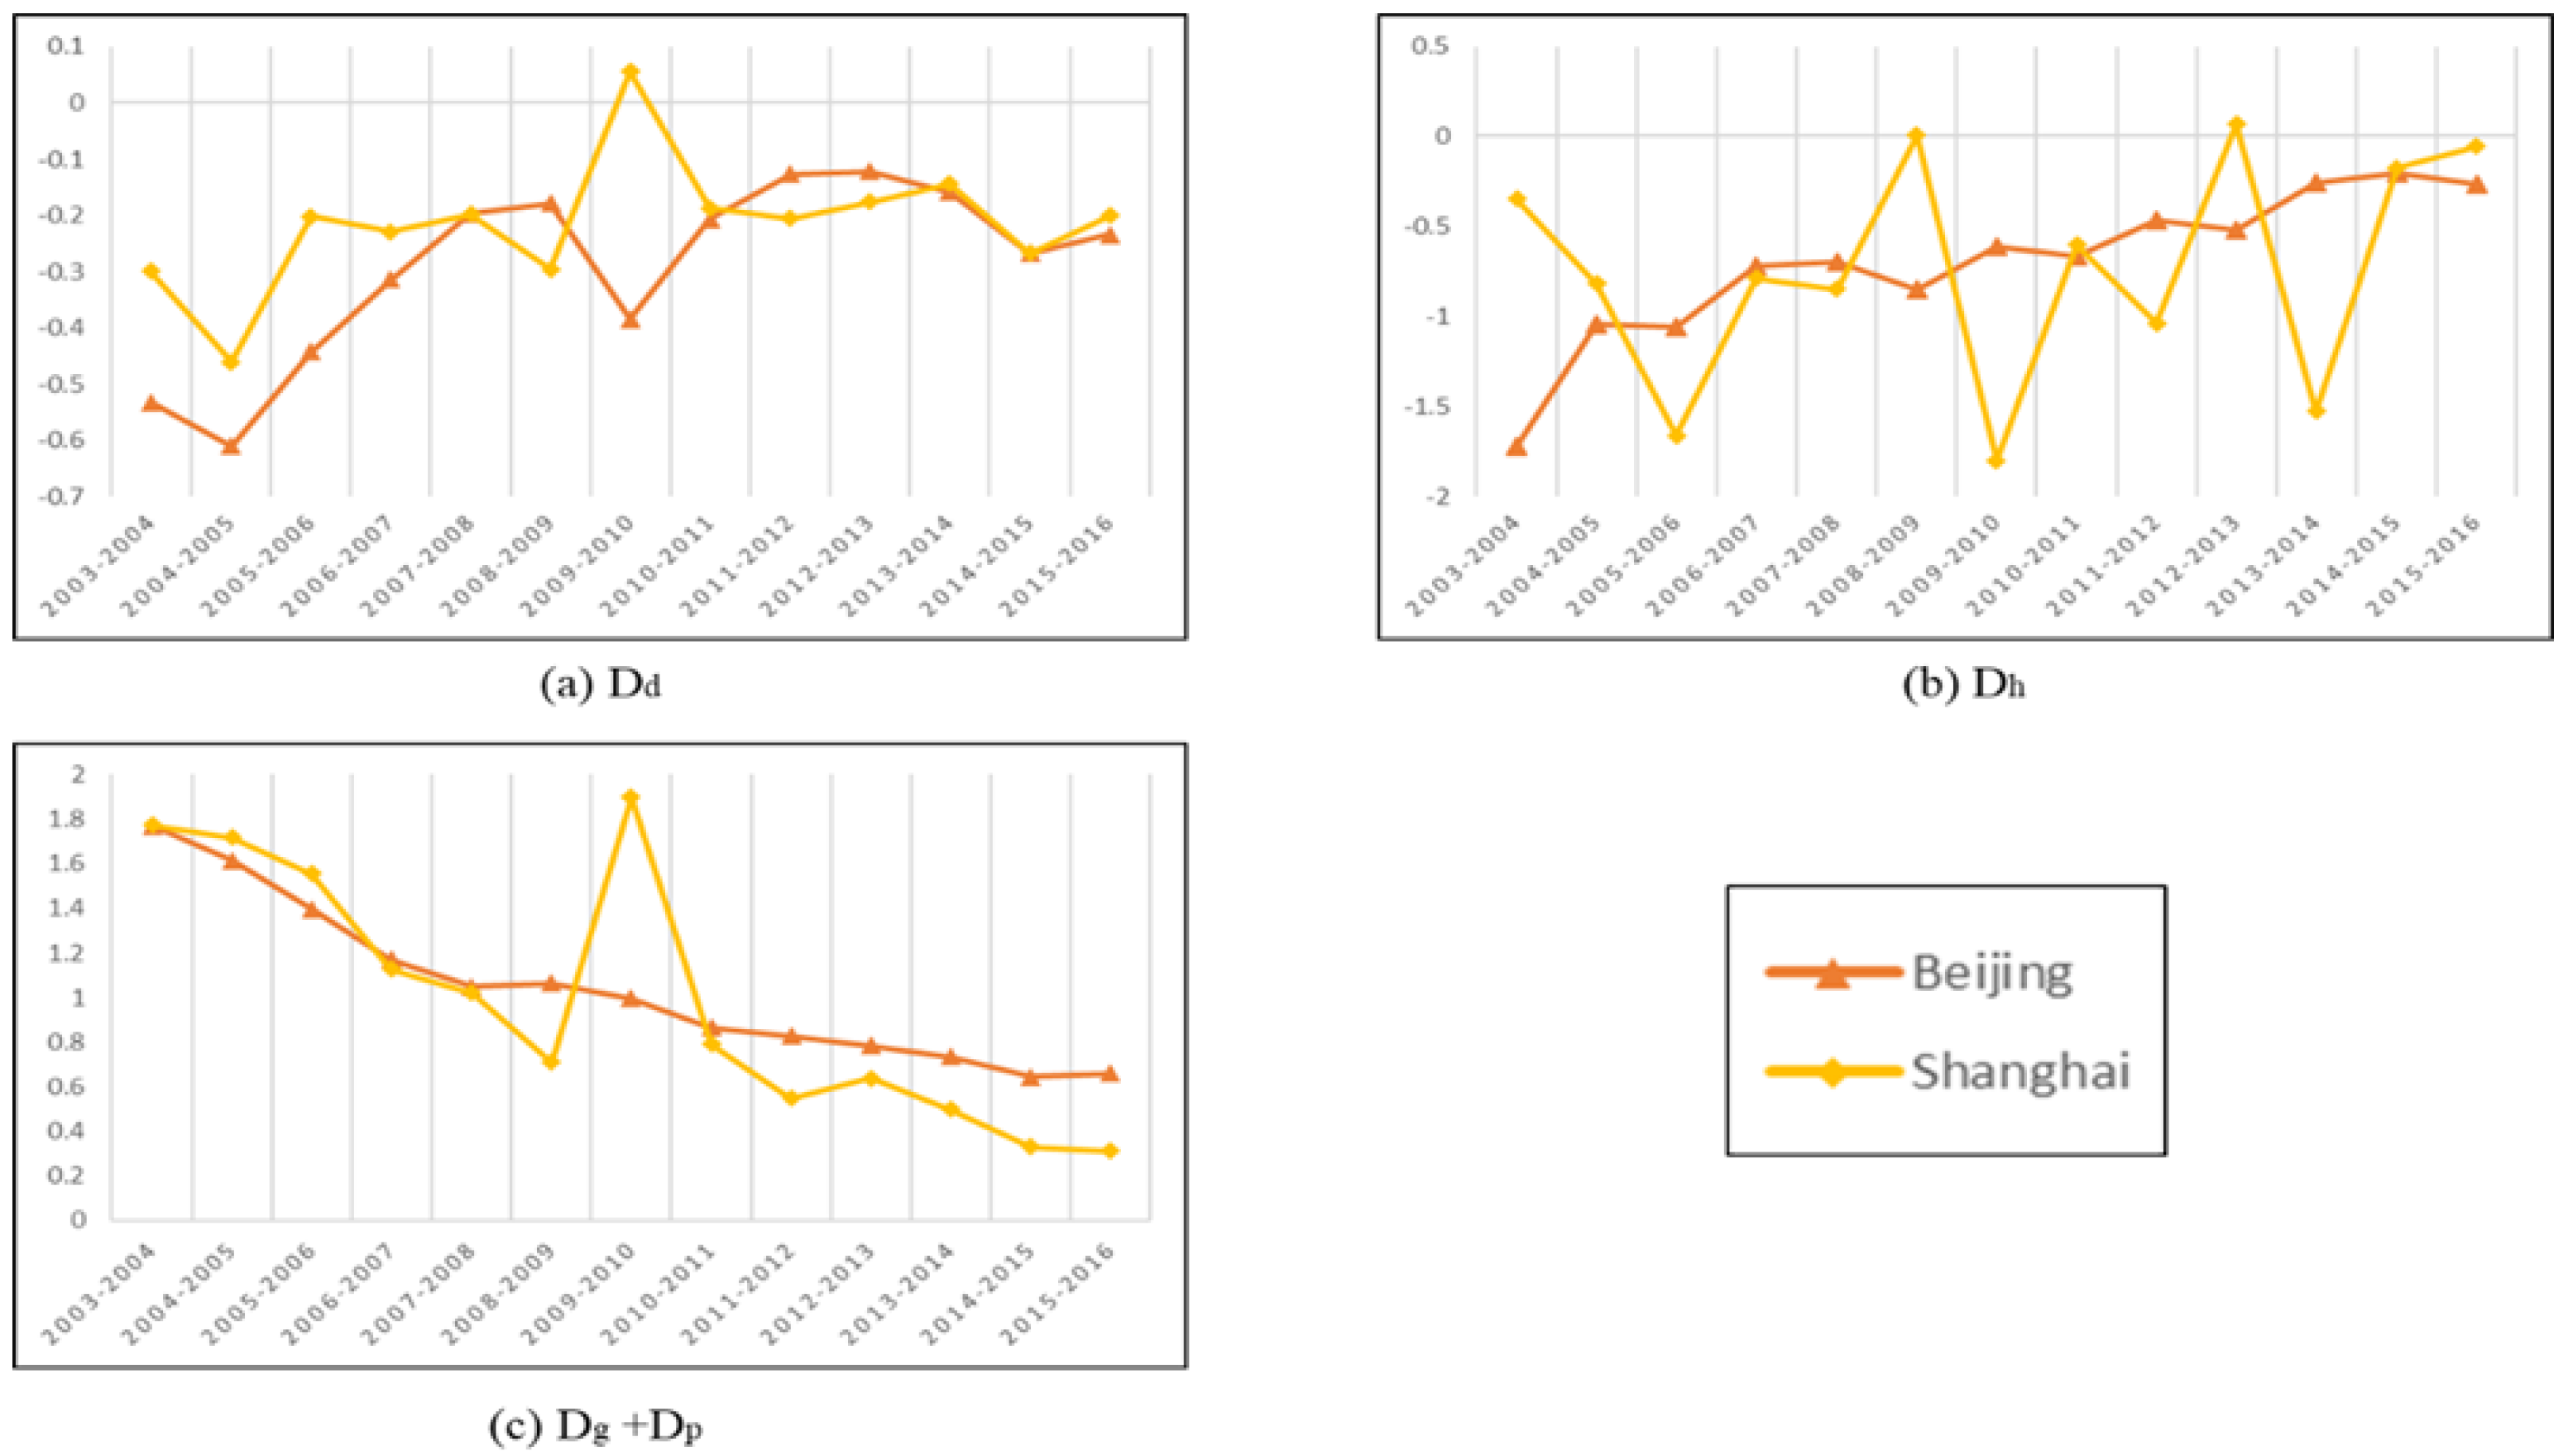
4.2. Analysis of Decoupling Driving Factors
4.3. Discussion
4.4. Future Research
5. Conclusions and Recommendations
5.1. Conclusions
- (1)
- The decoupling states of water use and economic growth in Beijing and Shanghai in 2003–2016 were dominated by strong decoupling and weak decoupling, and the decoupling levels of both cities were well. Shanghai’s strong decoupling status is more frequent than in Beijing, and Shanghai’s decoupling efforts are relatively better than Beijing.
- (2)
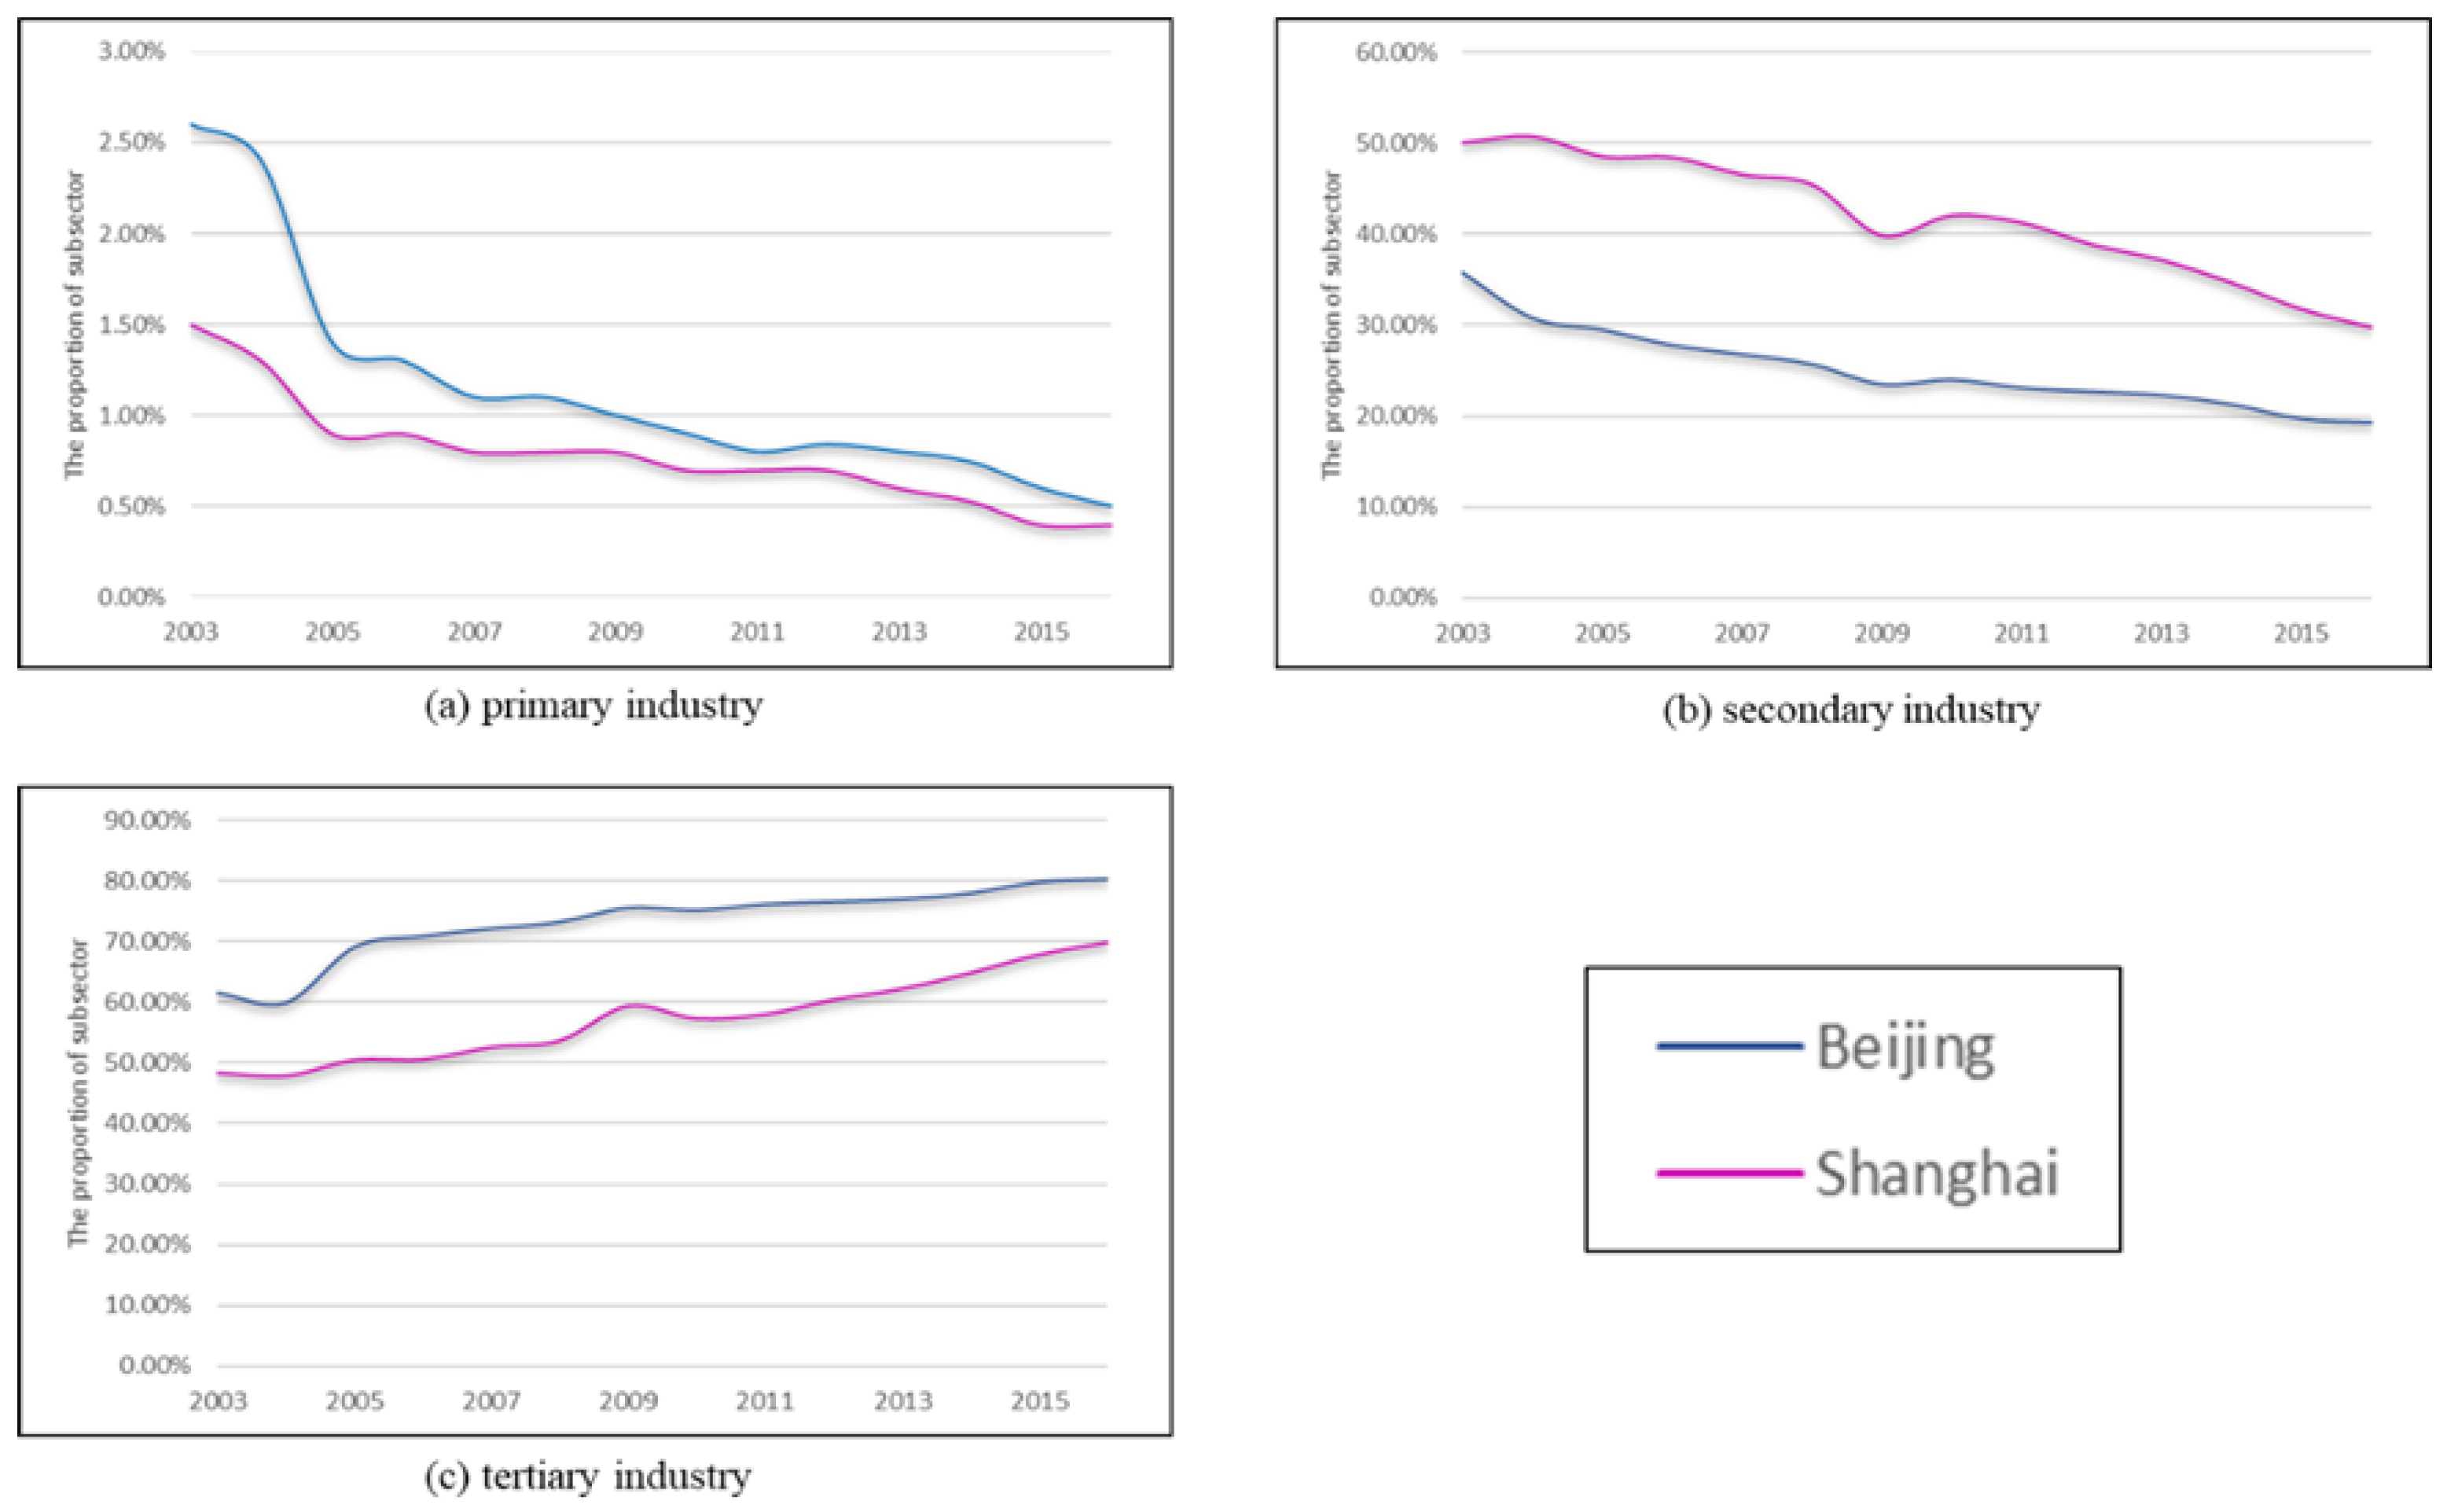
- The decoupling state of the three industries in Beijing was relatively stable during the study period. Beijing’s primary industry and secondary industry mainly showed a strong decoupling state, and the decoupling effect was well, while the tertiary industry experienced expansive negative decoupling level in recent years. Shanghai’s primary industry and secondary industry presented negative decoupling and weak decoupling during the study period, while the tertiary industry presented the opposite, mainly showing weak decoupling and strong decoupling. The decoupling efforts of Beijing’s primary and secondary industries are better than those of Shanghai, while the tertiary industry is the opposite.
- (3)
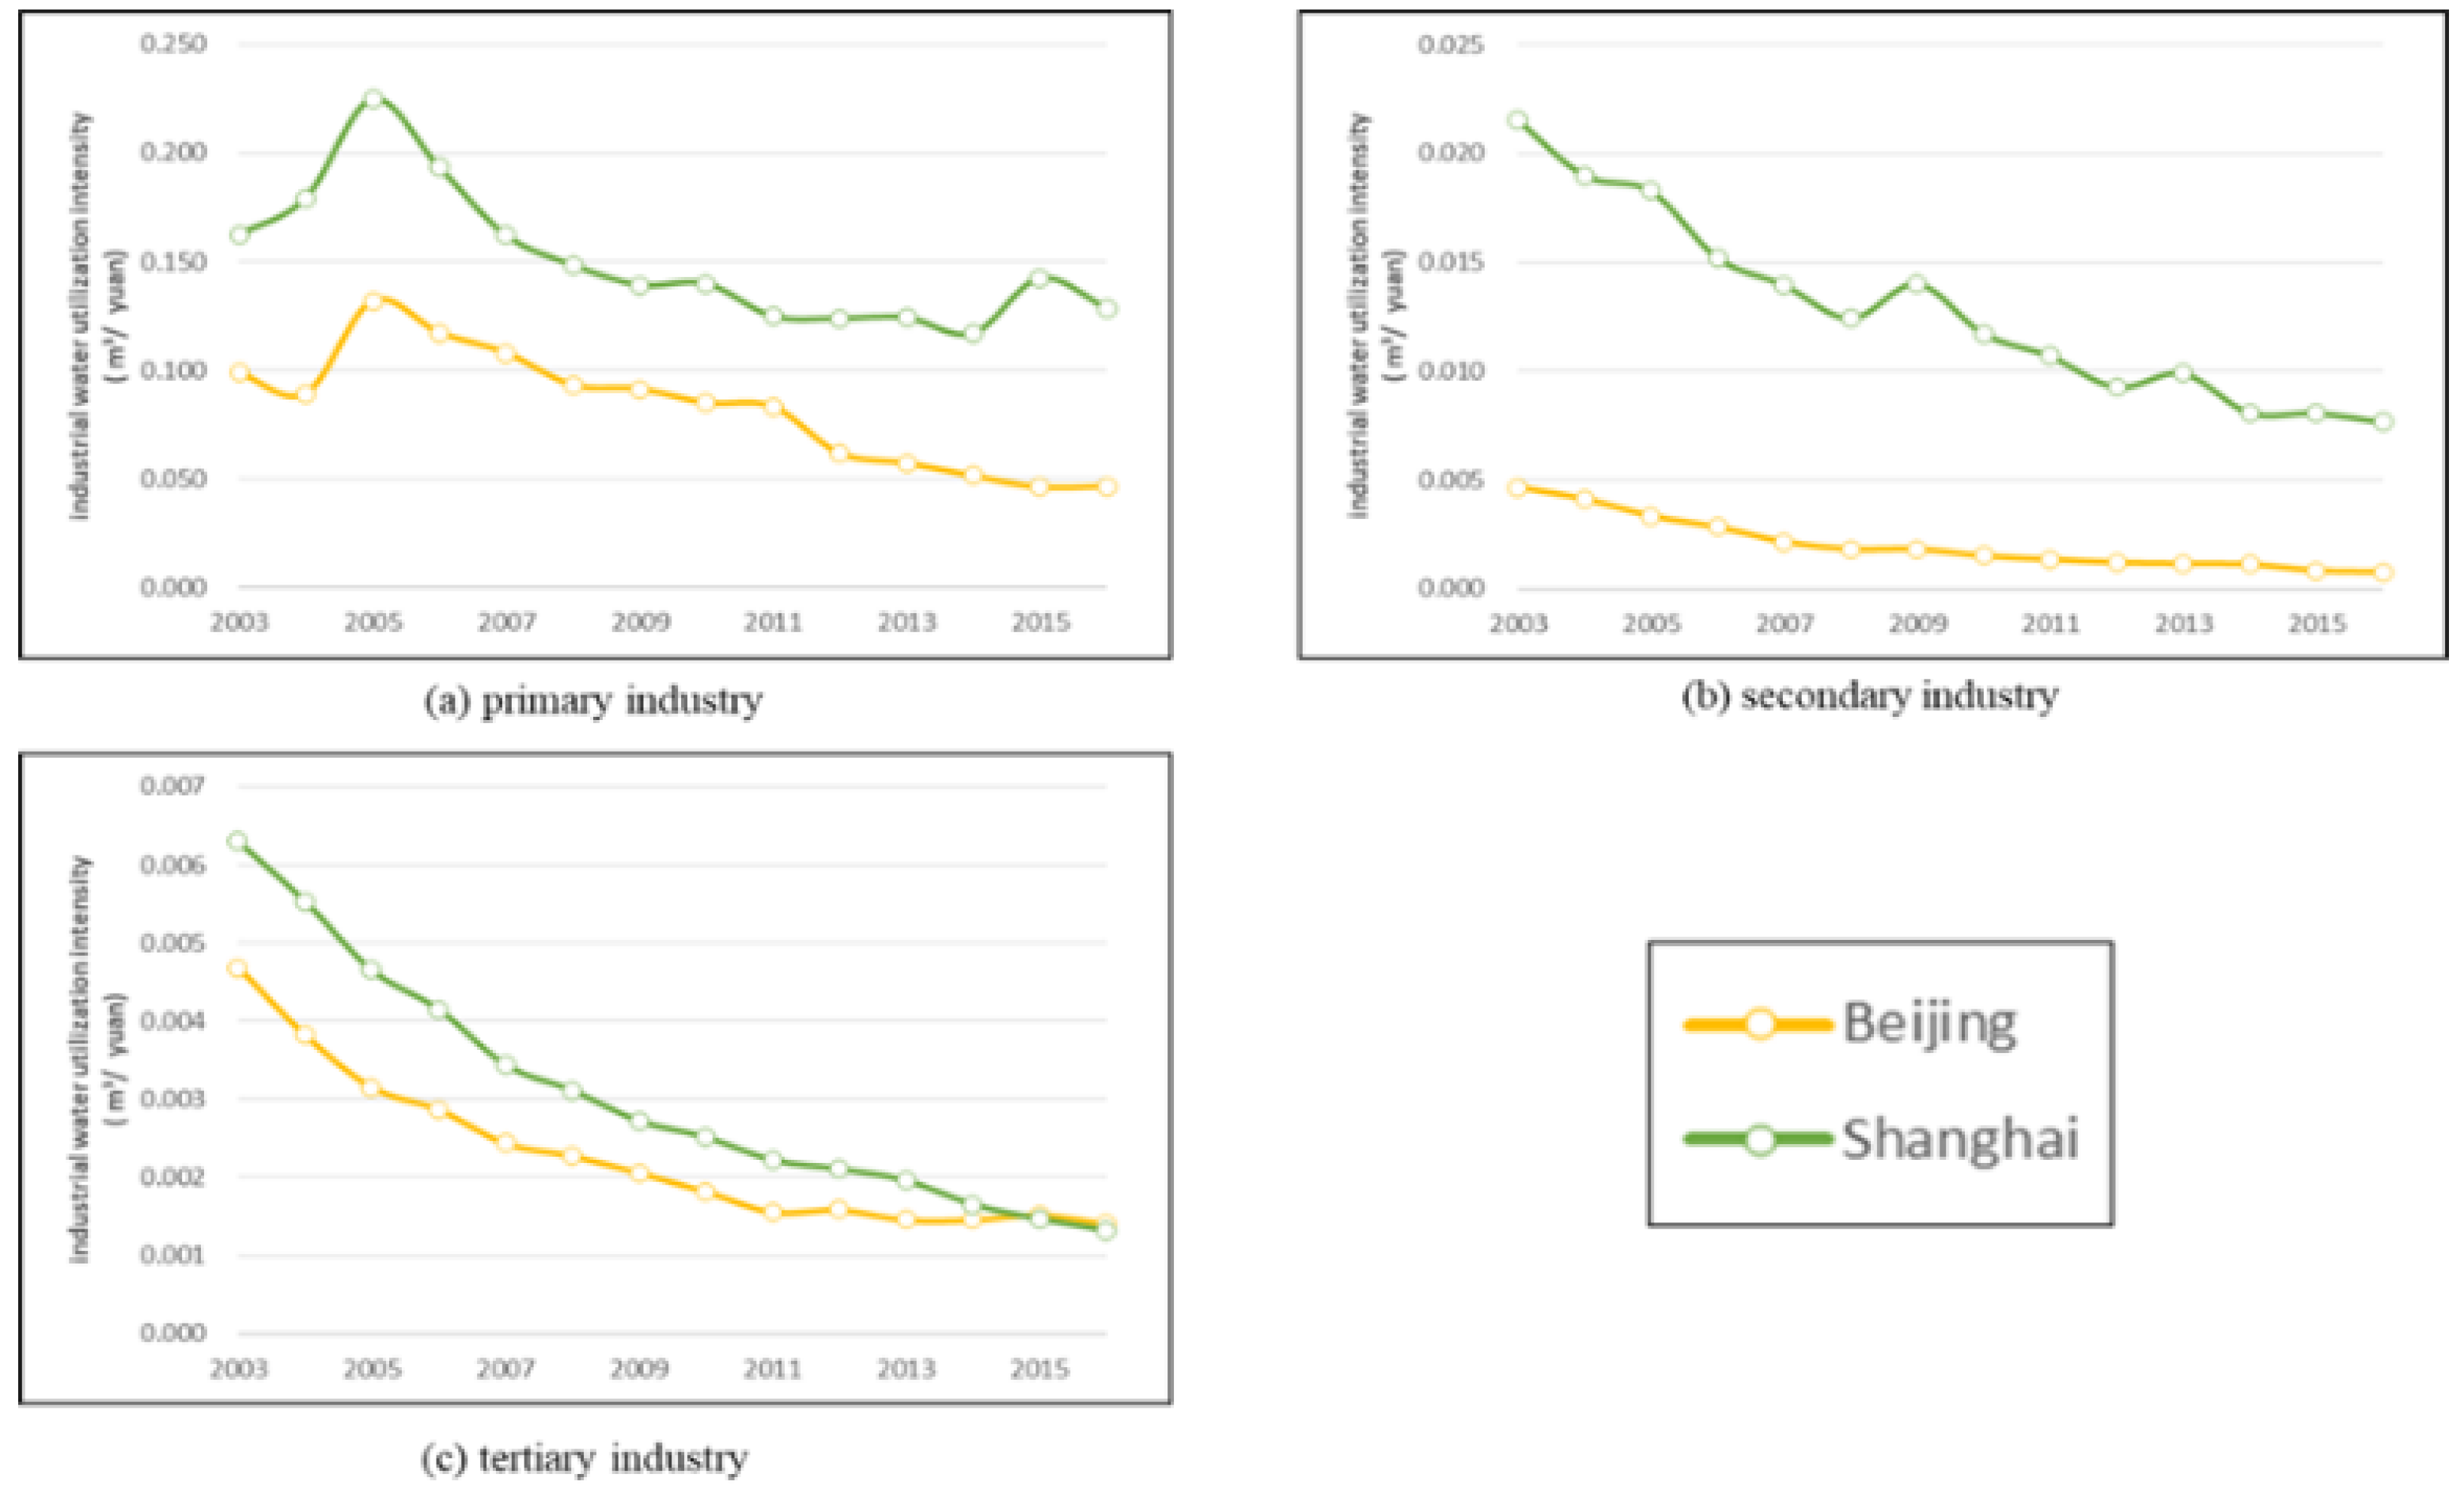
- The common characteristics that drive the two megacities’ decoupling are industrial structure effect and industrial water utilization intensity effect. And both effects show a strong decoupling state. The industrial structure of the two cities is optimized year by year, and the intensity of industrial water use is decreasing year by year. Regarding industrial structure effect, the decoupling index of Beijing’s industrial structure is lower than that of Shanghai, and the effect of Beijing’s industrial structure on decoupling is better than that of Shanghai. Regarding industrial water utilization intensity effect, Shanghai’s water utilization intensity has been declining year by year faster than Beijing, and Shanghai’s decoupling index is lower. Shanghai’s water efficiency is improving faster.
- (4)
- The economic development level effect and population size effect of the two megacities mainly presented weak decoupling. Although they do not effectively drive the decoupling between urban water use and economic growth in Beijing and Shanghai, the decoupling index shows a downward trend year by year, and the decoupling state is gradually optimized.
- (5)
- The reason why Shanghai’s decoupling effect is better than Beijing is that Shanghai’s industrial water utilization intensity factor promotes decoupling more effectively, and the factors of economic development level effect and population size effect that inhibit decoupling are weaker. Although the industrial structure effect drives the decoupling is not as good as Beijing, Shanghai’s decoupling effect is better in general.
5.2. Recommendations
- ➢
- Actively look for new ways to optimize the industrial structure and promote the transformation and upgrading of industrial structure, shifting the focus of production to the tertiary industry with low water consumption and high production capacity. The government should encourage and promote the development of the tertiary industry on the basis of maintaining the healthy development of the primary and secondary industries. Reduce agricultural water use and achieve zero or even negative growth in agricultural water use. Formulate relevant policies, optimize resource allocation, and guide the adjustment of industrial structure. Enterprises should strengthen the use of emerging technologies such as artificial intelligence, big data, and Internet of Things to accelerate the development of smart manufacturing, promote the high-quality development of manufacturing, and realize the transformation of industrial economy into a service-oriented economy. At the same time, the rise of the tertiary industry will also drive the progress of the primary and secondary industries. The three industries operate well, promoting the decoupling between water consumption and economic growth.
- ➢
- Further explore scientific water-saving technologies, improve water use efficiency, reduce water utilization intensity, and reduce water consumption per unit of GDP. Use innovative new methods to reduce water utilization intensity and use less water to create more value. For example, learning advanced water-saving irrigation technology from other countries, reducing the water consumption per unit of cultivated land. At the same time, the government should provide corresponding financial support, policy support, etc., and establish and continuously improve the water-saving irrigation system. Actively promote high-end water-saving production technology and equipment to directly reduce water consumption and increase production efficiency. Encourage the development of talents, promote the exchange of innovative elements such as talents, capital, technology, and information in the service industry, and gradually fill the shortcomings in the development of the service industry. Strengthen exchanges and cooperation with pollution control and water-saving technologies in various regions, so that advanced technologies can be rapidly promoted and applied.
- ➢
- Develop and implement a strict water management system. Combined with the data of urban water use and economic development in previous years, the government should propose corresponding water-saving indicators for each city and industry. For example, set strict water standards and establish stepped water prices. Real-time observation of industrial structure, water utilization intensity, economic development level, population size to contribute to water conservation, timely adjustment of corresponding indicators.
- ➢
- Establish the concept of citizen water conservation. With the expansion of the population, everyone has a role to play in water consumption. If the awareness of water conservation is deeply rooted in the hearts of the people, everyone will start from small things around them, which will play a pivotal role in building a water-saving society and promoting the sustainable development of water resources.
5.3. Implication
Author Contributions
Funding
Conflicts of Interest
References
- Tiziano, D.; Scott, K. Are we in deep water? Water scarcity and its limits to economic growth. Ecol. Econ. 2017, 142, 130–147. [Google Scholar]
- Cecilia, S.; Sam, E.; Jiang, L.; David, R.-H. Low carbon growth in China: The role of emissions trading in a transitioning economy. Appl. Energy 2019, 235, 1118–1125. [Google Scholar]
- Udimal, T.B.; Zhuang, J.; Ayamba, E.C.; Owusu, S.M. China’s water situation; the supply of water and the pattern of its usage. Int. J. Sustain. Built Environ. 2017, 6, 491–500. [Google Scholar] [CrossRef]
- Ma, W.; Wang, Q.; Yang, H.; Zhang, A.; Zhang, Y. Effects of Beijing-Shanghai high-speed rail on air travel: Passenger types, airline groups and tacit collusion. Rese. Transp. Econ. 2019, 74, 64–76. [Google Scholar] [CrossRef]
- Wenpeng, L.I. Emergency Plan for Water Supply in Consecutive Droughts and Sustainable Water Resources Management in Beijing. Acta Geol. Sin. 2018, 92, 1231–1244. [Google Scholar]
- Asim, N.; Marco, C. Exploring urban energy-water nexus embodied in domestic and international trade: A case of Shanghai. J. Clean. Prod. 2019, 223, 522–535. [Google Scholar]
- Cheng, J. Implement the most stringent water resources management system to achieve coordinated development of water and economic society. In Proceedings of the China Water Resources Magazine Expert Committee Meeting and Accelerating Water Conservancy Reform and Development High-Level Seminar, Beijing Water Resources Bureau, Beijing, China, 18 March 2011. [Google Scholar]
- Zhang, N. Close integration of law enforcement and law enforcement, seamless integration of legislation and law enforcement—Municipal People’s Congress Standing Committee conducts air pollution control and water resources management law enforcement inspection. Shanghai People’s Congr. Mon. 2018, 339, 23. [Google Scholar]
- Cui, X.; Wei, X.; Liu, W.; Zhang, F.; Li, Z. Spatial and temporal analysis of carbon sources and sinks through land use/cover changes in the Beijing-Tianjin-Hebei urban agglomeration region. Phys. Chem. Earth 2019, 110, 61–70. [Google Scholar] [CrossRef]
- Sun, Y.; Gao, C.; Li, J.; Wang, R.; Liu, J. Evaluating urban heat island intensity and its associated determinants of towns and cities continuum in the Yangtze River Delta urban agglomerations. Sustain. Cities Soc. 2019. [Google Scholar] [CrossRef]
- Oecd. Indicators to Measure Decoupling of Environmental Pressure from Economic Growth. 2002. Available online: http://www.olis.oecd.org/olis/2002doc.nsf/LinkTo/sg-sd 2002 (accessed on 28 June 2019).
- Juknys, R. Transition Period in Lithuania—Do We Move to Sustainability? Energy 2003, 4, 4–9. [Google Scholar]
- Vehmas, J.; Kaivo-oja, J.; Luukkanen, J. Global Trends of Linking Environmental Stress and Economic Growth; Finland Futures Research Centre: Turku, Finland, 2003; Volume 6. [Google Scholar]
- Tapio, P. Towards a theory of decoupling: Degrees of decoupling in the EU and the case of road traffic in Finland between 1970 and 2001. Transp. Policy 2005, 12, 137–151. [Google Scholar] [CrossRef]
- Zhong, T.; Huang, X.; Han, L.; Wang, B. Research progress on decoupling analysis of resources and environment. J. Nat. Resour. 2010, 8, 1400–1412. [Google Scholar]
- Song, W. Decoupling cultivated land loss by construction occupation from economic growth in Beijing. Habitat Int. 2014, 43, 198–205. [Google Scholar] [CrossRef]
- Gokarakonda, S.; Shrestha, S.; Caleb, P.R.; Rathi, V.; Jain, R.; Thomas, S.; Topp, K.; Niazi, Z. Decoupling in India’s building construction sector: Trends, technologies and policies. Build. Res. Inf. 2019, 47, 91–107. [Google Scholar] [CrossRef]
- Fan, F.; Lei, Y. Responsive relationship between energy-related carbon dioxide emissions from the transportation sector and economic growth in Beijing—Based on decoupling theory. Int. J. Sustain. Transp. 2017, 11, 764–775. [Google Scholar] [CrossRef]
- Wang, Y.; Xie, T.; Yang, S. Carbon emission and its decoupling research of transportation in Jiangsu Province. J. Clean. Prod. 2017, 142, 907–914. [Google Scholar] [CrossRef]
- Jiang, J.-J.; Ye, B.; Zhou, N.; Zhang, X.-L. Decoupling analysis and environmental Kuznets curve modelling of provincial-level CO2 emissions and economic growth in China: A case study. J. Clean. Prod. 2019, 212, 1242–1255. [Google Scholar] [CrossRef]
- Chen, B.; Yang, Q.; Li, J.; Chen, G. Decoupling analysis on energy consumption, embodied GHG emissions and economic growth—The case study of Macao. Renew. Sustain. Energy Rev. 2017, 67, 662–672. [Google Scholar] [CrossRef]
- Zhang, Y.; Nie, R.; Shi, R.; Zhang, M. Measuring the capacity utilization of the coal sector and its decoupling with economic growth in China’s supply-side reform. Resour. Conserv. Recycl. 2018, 129, 314–325. [Google Scholar] [CrossRef]
- Cui, C.X.; Hanley, N.; McGregor, P.; Swales, K.; Turner, K.; Yin, Y.P. Impacts of regional productivity growth, decoupling and pollution leakage. Reg. Stud. 2017, 51, 1324–1335. [Google Scholar] [CrossRef]
- Yuan, Y.; Wu, S.; Yu, Y.; Tong, G.; Mo, L.; Yan, D.; Li, F. Spatiotemporal interaction between ecosystem services and urbanization: Case study of Nanjing City, China. Ecol. Indic. 2018, 95, 917–929. [Google Scholar] [CrossRef]
- Shi, L.; Vause, J.; Li, Q.; Tang, L.; Zhao, J. Decoupling analysis of energy consumption and economic development in China. Energy Sources Part B Econ. Plan. Policy 2016, 11, 788–792. [Google Scholar] [CrossRef]
- Wang, W.; Li, M.; Zhang, M. Study on the changes of the decoupling indicator between energy-related CO2 emission and GDP in China. Energy 2017, 128, 11–18. [Google Scholar] [CrossRef]
- Dasgupta, S.; Roy, J. Analysing energy intensity trends and decoupling of growth from energy use in Indian manufacturing industries during 1973–1974 to 2011–2012. Energy Effic. 2017, 10, 925–943. [Google Scholar] [CrossRef]
- Lesin, Y.V.; Fedulova, E.; Akulov, A.; Vik, S.; Korchagin, R. Water Resources Management In Support Of Raw Region Based On Decoupling Effect. In Proceedings of the IOP Conference Series: Earth and Environmental Science, Semarang, Indonesia, 16–18 January 2017; p. 012026. [Google Scholar]
- Mikayilov, J.I.; Hasanov, F.J.; Galeotti, M. Decoupling of CO2 emissions and GDP: A time-varying cointegration approach. Ecol. Indic. 2018, 95, 615–628. [Google Scholar] [CrossRef]
- Moreau, V.; Neves, C.A.D.O.; Vuille, F. Is decoupling a red herring? The role of structural effects and energy policies in Europe. Energy Policy 2019, 128, 243–252. [Google Scholar] [CrossRef]
- Moutinho, V.; Fuinhas, J.A.; Marques, A.C.; Santiago, R. Assessing eco-efficiency through the DEA analysis and decoupling index in the Latin America countries. J. Clean. Prod. 2018, 205, 512–524. [Google Scholar] [CrossRef]
- WARMING, M. Decoupling water from energy use must be a global priority. Water Wastewater Treat. WWT Irel. 2017, 60, 7. [Google Scholar]
- Csereklyei, Z.; Stern, D.I. Global energy use: Decoupling or convergence? Energy Econ. 2015, 51, 633–641. [Google Scholar] [CrossRef]
- Tu, C.-J.; Chang, M.-C.; Chen, C.-P. Progressive time-weighted dynamic energy efficiency, energy decoupling rate, and decarbonization: An empirical study on G7 and BRICS. Sustainability 2016, 8, 928. [Google Scholar] [CrossRef]
- Schandl, H.; Hatfield-Dodds, S.; Wiedmann, T.; Geschke, A.; Cai, Y.; West, J.; Newth, D.; Baynes, T.; Lenzen, M.; Owen, A. Decoupling global environmental pressure and economic growth: Scenarios for energy use, materials use and carbon emissions. J. Clean. Prod. 2016, 132, 45–56. [Google Scholar] [CrossRef]
- Li, Y.-N.; Cai, M.; Wu, K.; Wei, J. Decoupling analysis of carbon emission from construction land in Shanghai. J. Clean. Prod. 2019, 210, 25–34. [Google Scholar] [CrossRef]
- Xie, P.; Gao, S.; Sun, F. An analysis of the decoupling relationship between CO2 emission in power industry and GDP in China based on LMDI method. J. Clean. Prod. 2019, 211, 598–606. [Google Scholar] [CrossRef]
- Ren, S.; Yin, H.; Chen, X.H. Using LMDI to analyze the decoupling of carbon dioxide emissions by China’s manufacturing industry. J. Cent. South Univ. 2014, 9, 61–75. [Google Scholar] [CrossRef]
- Boqiang, L.; Liu, K. Using LMDI to Analyze the Decoupling of Carbon Dioxide Emissions from China’s Heavy Industry. Sustainability 2017, 9, 1198. [Google Scholar] [CrossRef]
- Xu, S.-C.; Zhang, W.-W.; He, Z.-X.; Han, H.-m.; Long, R.-Y.; Chen, H. Decomposition analysis of the decoupling indicator of carbon emissions due to fossil energy consumption from economic growth in China. Energy Effic. 2017, 10, 1365–1380. [Google Scholar] [CrossRef]
- Zhao, R.; Liu, Y.; Tian, M.; Ding, M.; Cao, L.; Zhang, Z.; Chuai, X.; Xiao, L.; Yao, L. Impacts of water and land resources exploitation on agricultural carbon emissions: The water-land-energy-carbon nexus. Land Use Policy 2018, 72, 480–492. [Google Scholar] [CrossRef]
- Wang, Z.-X.; Ye, D.-J. Forecasting Chinese carbon emissions from fossil energy consumption using non-linear grey multivariable models. J. Clean. Prod. 2017, 142, 600–612. [Google Scholar] [CrossRef]
- Dong, J.-F.; Deng, C.; Wang, X.-M.; Zhang, X.-L. Multilevel index decomposition of energy-related carbon emissions and their decoupling from economic growth in Northwest China. Energies 2016, 9, 680. [Google Scholar] [CrossRef]
- Zhao, X.; Zhang, X.; Li, N.; Shao, S.; Geng, Y. Decoupling economic growth from carbon dioxide emissions in China: A sectoral factor decomposition analysis. J. Clean. Prod. 2017, 142, 3500–3516. [Google Scholar] [CrossRef]
- Jiang, X.-T.; Dong, J.-F.; Wang, X.-M.; Li, R.-R. The multilevel index decomposition of energy-related carbon emission and its decoupling with economic growth in USA. Sustainability 2016, 8, 857. [Google Scholar] [CrossRef]
- Dong, B.; Zhang, M.; Mu, H. Study on decoupling analysis between energy consumption and economic growth in Liaoning Province. Energy Policy 2016, 97, 414–420. [Google Scholar] [CrossRef]
- Wang, Q.; Jiang, R. Is China’s economic growth decoupled from carbon emissions? J. Clean. Prod. 2019, 225, 1194–1208. [Google Scholar] [CrossRef]
- Wang, Q.; Jiang, R.; Zhan, L. Is decoupling economic growth from fuel consumption possible in developing countries?—A comparison of China and India. J. Clean. Prod. 2019, 229, 806–817. [Google Scholar] [CrossRef]
- Zhou, X.; Zhang, M.; Zhou, M.; Zhou, M. A comparative study on decoupling relationship and influence factors between China’s regional economic development and industrial energy–related carbon emissions. J. Clean. Prod. 2017, 142, 783–800. [Google Scholar] [CrossRef]
- Wang, Q.; Wang, S. A comparison of decomposition the decoupling carbon emissions from economic growth in transport sector of selected provinces in eastern, central and western China. J. Clean. Prod. 2019, 229, 570–581. [Google Scholar] [CrossRef]
- Wang, Q.; Zhao, M.; Li, R. Decoupling sectoral economic output from carbon emissions on city level: A comparative study of Beijing and Shanghai, China. J. Clean. Prod. 2019, 209, 126–133. [Google Scholar] [CrossRef]
- Roinioti, A.; Koroneos, C. The decomposition of CO2 emissions from energy use in Greece before and during the economic crisis and their decoupling from economic growth. Renew. Sustain. Energy Rev. 2017, 76, 448–459. [Google Scholar] [CrossRef]
- Leal, P.A.; Marques, A.C.; Fuinhas, J.A. Decoupling economic growth from GHG emissions: Decomposition analysis by sectoral factors for Australia. Econ. Anal. Policy 2019, 62, 12–26. [Google Scholar] [CrossRef]
- Song, Y.; Zhang, M. Using a new decoupling indicator (ZM decoupling indicator) to study the relationship between the economic growth and energy consumption in China. Nat. Hazards 2017, 88, 1013–1022. [Google Scholar] [CrossRef]
- Ning, Y.; Zhang, B.; Ding, T.; Zhang, M. Analysis of regional decoupling relationship between energy-related CO 2 emission and economic growth in China. Nat. Hazards 2017, 87, 867–883. [Google Scholar] [CrossRef]
- Wang, Q.; Su, M.; Li, R. Toward to economic growth without emission growth: The role of urbanization and industrialization in China and India. J. Clean. Prod. 2018, 205, 499–511. [Google Scholar] [CrossRef]
- Wang, Q.; Zhao, M.; Li, R.; Su, M. Decomposition and decoupling analysis of carbon emissions from economic growth: A comparative study of China and the United States. J. Clean. Prod. 2018, 197, 178–184. [Google Scholar] [CrossRef]
- Wang, Q.; Wang, S. Decoupling Economic Growth from Carbon Emissions Growth in the United States: The Role of Research and Development. J. Clean. Prod. 2019. [Google Scholar] [CrossRef]
- Ang, B.W.; Choi, K.-H. Decomposition of aggregate energy and gas emission intensities for industry: A refined Divisia index method. Energy J. 1997, 18, 59–73. [Google Scholar] [CrossRef]
- Sun, J.; Ang, B. Some properties of an exact energy decomposition model. Energy 2000, 25, 1177–1188. [Google Scholar] [CrossRef]
- Liu, B.W.; Zhang, X.; Yang, L. Research on Decoupling of Regional Industrial Carbon Emission Based on LMDI. China’s Popul. Resour. Environ. 2018, 28, 78–86. [Google Scholar]
- Hu, M.; Hu, Y.; Yuan, J.; Lu, F. Decomposing the decoupling of water consumption and economic growth in Jiangxi, China. J. Water Reuse Desalin. 2019, 9, 94–104. [Google Scholar] [CrossRef]
- Wang, S.; Li, R. Toward the coordinated sustainable development of urban water resource use and economic growth: An empirical analysis of Tianjin City, China. Sustainability 2018, 10, 1323. [Google Scholar] [CrossRef]
- Qiu, L.; Huang, J.; Niu, W. Decoupling and Driving Factors of Economic Growth and Groundwater Consumption in the Coastal Areas of the Yellow Sea and the Bohai Sea. Sustainability 2018, 10, 4158. [Google Scholar] [CrossRef]
- Li, Y.; Luo, Y.; Wang, Y.; Wang, L.; Shen, M. Decomposing the decoupling of water consumption and economic growth in china’s textile industry. Sustainability 2017, 9, 412. [Google Scholar] [CrossRef]
- Zhang, C.; Zhong, L.; Wang, J. Decoupling between water use and thermoelectric power generation growth in China. Nat. Energy 2018, 3, 792–799. [Google Scholar] [CrossRef]
- Li, Y.; Fang, D.; Wang, S.; Chen, B. Driving Forces Analysis of Water Consumption in the Energy Production Process in China Based on the LMDI Method. DEStech Trans. Environ. Energy Earth Sci. 2018. [Google Scholar] [CrossRef]
- Zhang, S.; Su, X.; Singh, V.P.; Ayantobo, O.O.; Xie, J. Logarithmic Mean Divisia Index (LMDI) decomposition analysis of changes in agricultural water use: A case study of the middle reaches of the Heihe River basin, China. Agric. Water Manag. 2018, 208, 422–430. [Google Scholar] [CrossRef]
- Kaya, Y. Impact of Carbon Dioxide Emission Control on GNP Growth: Interpretation of Proposed Scenarios; IPCC Energy and Industry Subgroup, Response Strategies Working Group: Paris, France, 1989. [Google Scholar]
- McNicoll, G.; IPAT (Impact, Population, Affluence, and Technology). International Encyclopedia of the Social & Behavioral Sciences, 2nd ed.; Elsevier: Amsterdam, The Netherlands, 2015; pp. 716–718. Available online: http://www.sciencedirect.com/science/article/pii/B9780080970868910456 (accessed on 28 June 2019).
- National Bureau of Statistics. China Statistical Yearbook; China Statistics Press: Beijing, China, 2004–2017.
- Beijing Municipal Bureau of Statistics. Beijing Statistical Yearbook; China Statistics Press: Beijing, China, 2004–2017.
- Shanghai Municipal Bureau of Statistics. Shanghai Statistical Yearbook; China Statistics Press: Shanghai, China, 2004–2017.
- Acharya, S.; Sharma, S.K.; Khandega, V. Assessment of groundwater quality by water quality indices for irrigation and drinking in South West Delhi, India. Data Brief 2018, 18, 2019–2028. [Google Scholar] [CrossRef]


| Literature | Target | Scope | Period | Methods |
|---|---|---|---|---|
| Li et al. [36] | carbon emissions → economic growth | construction land in Shanghai, China | 1999–2015 | Kaya, LMDI |
| Xie et al. [37] | CO2 emission → economic growth | power industry in China | 1985–2016 | Tapio, LMDI |
| Wang et al. [38] | CO2 emissions → economic output | manufacturing industry in China | 1996–2010 | Kaya, LMDI |
| Lin et al. [39] | CO2 emissions → economic output | heavy industry in China | 1991–2015 | Kaya, LMDI |
| He et al. [40] | carbon emissions → economic growth | fossil energy consumption in China | 1995–2013 | Tapio, LMDI |
| Zhao et al. [41] | carbon emissions → water & land resource exploitation | agriculture in China | 2005–2013 | Decoupling, LMDI |
| Wang et al. [42] | carbon emission → electric output | electricity sector in Shandong, China | 1995–2012 | Tapio, LMDI |
| Dong et al. [43] | carbon emissions → economic growth | energy use in Northwest China | 1995–2012 | Decoupling, LMDI |
| Zhao et al. [44] | CO2 emission → economic growth | five major economic sectors | 1992–2012 | Decoupling, LMDI |
| Jiang et al. [45] | carbon emissions → economic growth | energy-related use in the United States | 1990–2014 | Decoupling, LMDI |
| Zhang et al. [46] | energy consumption → economic growth | Liaoning Province in China | 1995–2012 | Decoupling, LMDI |
| Wang et al. [47] | carbon emissions → economic growth | six sectors in China | 2000–2014 | Cobb–Douglas production function, LMDI |
| Wang et al. [48] | fuel consumption → economic growth | China and India | 1990–2015 | Cobb–Douglas production function, LMDI |
| Zhou et al. [49] | carbon emissions → economic growth | energy use in China | 1996–2012 | Big data, Tapio, LMDI |
| Wang et al. [50] | carbon emissions → economic growth | transport sector in China | 2000–2016 | Decoupling, LMDI |
| Wang et al. [51] | carbon emissions → economic output | industrial sectors in Beijing and Shanghai, China | 2000–2015 | Decoupling, LMDI |
| Roinioti et al. [52] | CO2 emission → economic growth | energy use in Greece | 2003–2013 | Decoupling, decomposition |
| Leal et al. [53] | greenhouse gas emissions→ economic growth | all sectors in Australia | 1990–2015 | Decoupling, LMDI |
| Song et al. [54] | energy consumption → economic growth | all sectors in China. | 1991–2012 | ZM Decoupling, LMDI |
| Ning et al. [55] | CO2 emission → economic development | energy-related in China | 1996–2013 | WCDM, Tapio |
| Wang et al. [56] | carbon emissions → economic growth | China and India | 1980–2014 | Decoupling, decomposition |
| Wang et al. [57] | carbon emissions → economic growth | China and the United States | 2000–2014 | Decoupling, LMDI |
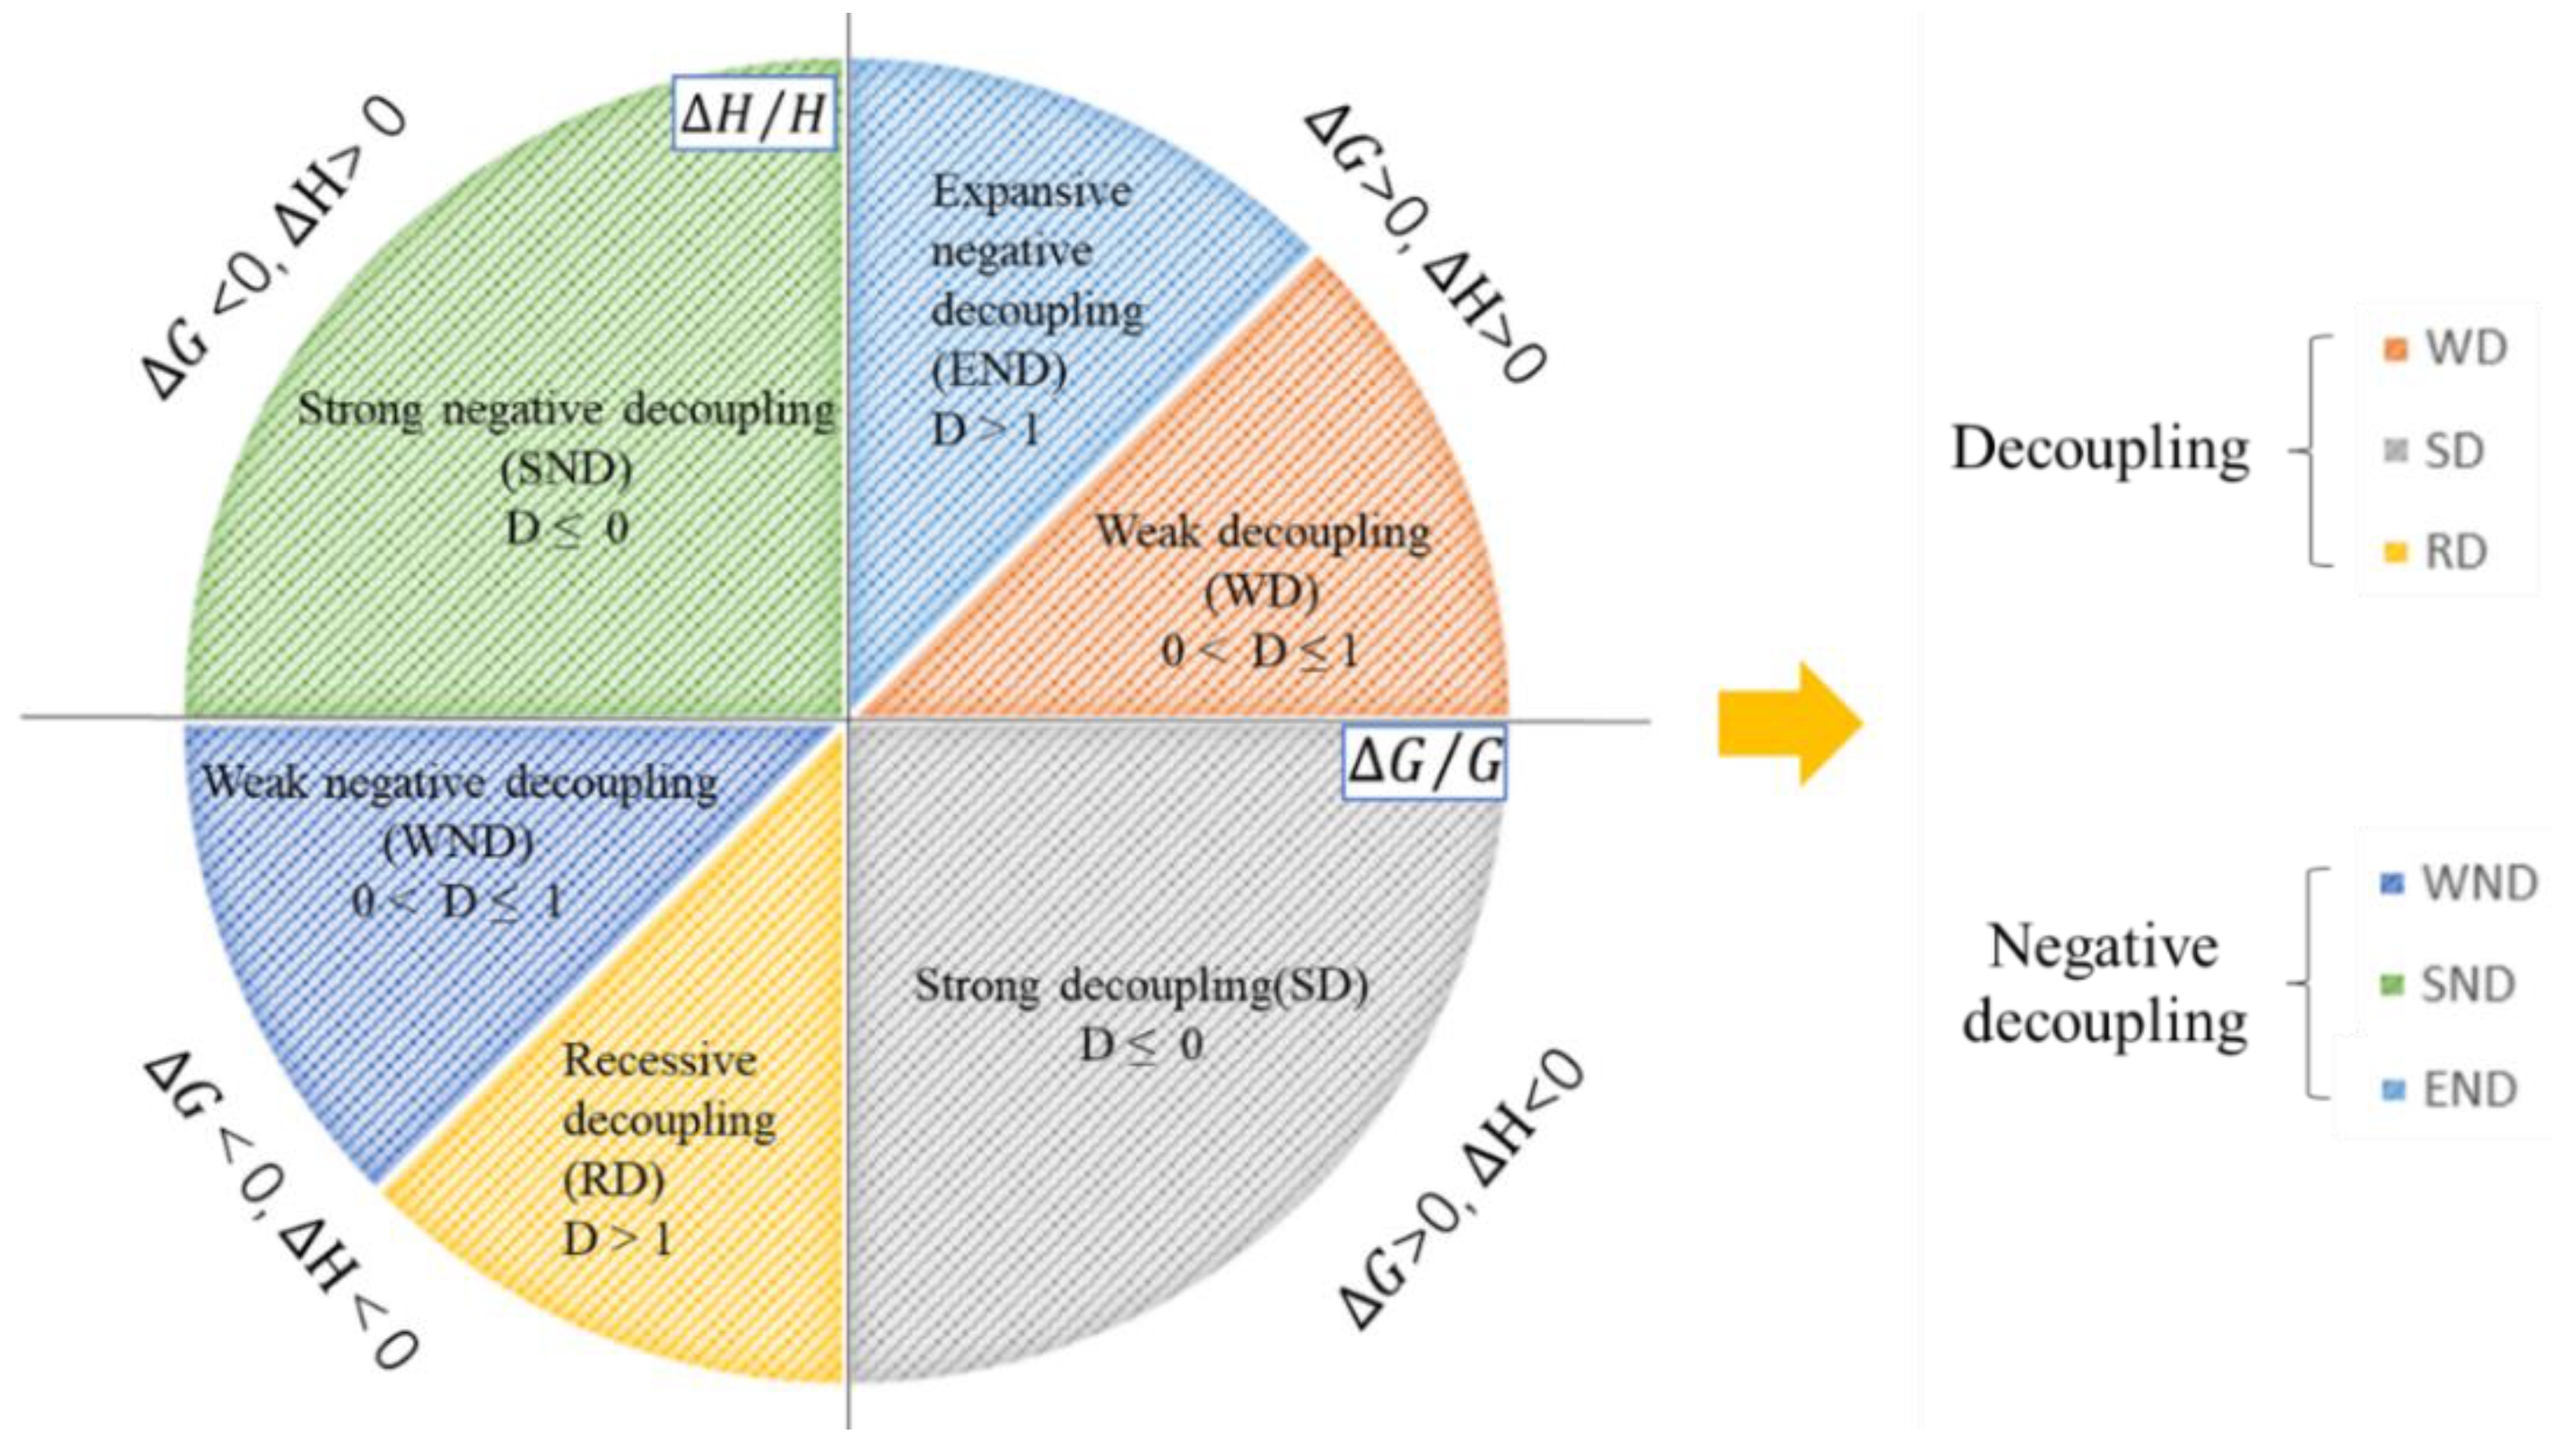
| D | Decoupling Degree | |||
|---|---|---|---|---|
| Decoupling | <0 | >0 | D ≤ 0 | Strong decoupling (SD) |
| >0 | >0 | 0 < D ≤ 1 | Weak decoupling (WD) | |
| <0 | <0 | D > 1 | Recessive decoupling (RD) | |
| Negative decoupling | >0 | <0 | D ≤ 0 | Strong negative decoupling (SND) |
| <0 | <0 | 0 < D ≤ 1 | Weak negative decoupling (WND) | |
| >0 | >0 | D > 1 | Expansive negative decoupling (END) |
| Year | Beijing | |||||
|---|---|---|---|---|---|---|
| D1 | Decoupling State | D2 | Decoupling State | D3 | Decoupling State | |
| 2003–2004 | 0.5369 | WD | −1.4825 | SD | −0.5579 | SD |
| 2004–2005 | 3.7538 | RD | −2.7006 | SD | 0.8178 | WD |
| 2005–2006 | −11.7727 | SD | −1.5730 | SD | 0.6066 | WD |
| 2006–2007 | −1.3678 | SD | −0.9807 | SD | 0.7062 | WD |
| 2007–2008 | −2.6768 | SD | −4.6050 | SD | 0.6756 | WD |
| 2008–2009 | −0.6120 | SD | 0.0000 | SD | 0.2313 | WD |
| 2009–2010 | 1.7982 | RD | −0.1427 | SD | 0.2302 | WD |
| 2010–2011 | 0.3144 | WD | −0.1027 | SD | −0.0169 | WD |
| 2011–2012 | −4.4694 | SD | −0.3438 | SD | 1.3855 | END |
| 2012–2013 | −0.6306 | SD | 0.4072 | WD | 0.2582 | WD |
| 2013–2014 | 3.8042 | SD | −0.0402 | SD | 1.0501 | END |
| 2014–2015 | 1.4654 | RD | −5.1108 | SD | 1.6485 | END |
| 2015–2016 | 0.4532 | WND | 0.0000 | SD | 0.4769 | WD |
| Year | Shanghai | |||||
|---|---|---|---|---|---|---|
| D1 | Decoupling State | D2 | Decoupling State | D3 | Decoupling State | |
| 2003–2004 | −2.5352 | SND | 0.9555 | WD | 0.7139 | WD |
| 2004–2005 | 0.1799 | WND | 0.6446 | WD | 0.0735 | WD |
| 2005–2006 | −0.7323 | SD | −0.5246 | SD | 0.4283 | WD |
| 2006–2007 | −6.3934 | SD | 0.4982 | WD | 0.1533 | WD |
| 2007–2008 | 4.0701 | END | −0.3228 | SD | 0.4458 | WD |
| 2008–2009 | −0.2572 | SND | 1.8913 | WD | 0.3298 | WD |
| 2009–2010 | −0.0433 | SND | 0.0497 | WD | 0.3146 | WD |
| 2010–2011 | 0.3500 | WND | 0.0094 | WD | −0.0088 | SD |
| 2011–2012 | 9.1301 | END | −4.3167 | SD | 0.3504 | WD |
| 2012–2013 | 2.6247 | RD | 1.3399 | WD | 0.3499 | WD |
| 2013–2014 | 12.8331 | SD | −3.4672 | SD | −0.4860 | SD |
| 2014–2015 | 0.1393 | WND | −1.3099 | SD | −0.0809 | SD |
| 2015–2016 | −0.2215 | SND | −0.1618 | SD | 0.2784 | WD |
| Ranking | Megacities | 2018 Population | 2000–2018 Population Growth | Percent of City’s Population | Estimated 2030 Population |
|---|---|---|---|---|---|
| 1 | Tokyo, Japan | 37.5 million | +8.8% | 29.5% | 36.57 million |
| 2 | Delhi, India | 28.5 million | +81.7% | 2.1% | 38.94 million |
| 3 | Shanghai, China | 25.6 million | +79.6% | 1.8% | 32.87 million |
| 4 | São Paulo, Brazil | 21.7 million | +27.2% | 10.3% | 23.82 million |
| 5 | Ciudad de México (Mexico City), Mexico | 21.6 million | +16.9% | 16.5% | 24.11 million |
| 6 | Al-Qahirah (Cairo), Egypt | 20.1 million | +47.3% | 20.2% | 25.52 million |
| 7 | Mumbai, India | 20.0 million | +23.7% | 1.5% | 24.57 million |
| 8 | Beijing, China | 19.6 million | +90.7% | 1.4% | 24.28 million |
| 9 | Dhaka, Bangladesh | 19.6 million | +90.4% | 11.8% | 28.08 million |
| 10 | Kinki M.M.A. (Osaka), Japan | 19.3 million | +3.3% | 15.2% | 18.66 million |
| 11 | New York-Newark, America | 18.8 million | +5.6% | 5.8% | 19.96 million |
| 12 | Karachi, Pakistan | 15.4 million | +56.7% | 7.7% | 20.43 million |
| 13 | Buenos Aires, Argentina | 15.0 million | +19.7% | 33.5% | 16.46 million |
| 14 | Chongqing, China | 14.8 million | +88.7% | 1.0% | 19.65 million |
| 15 | Istanbul, Turkey | 14.8 million | +68.7% | 18.0% | 17.12 million |
| 16 | Kolkata (Calcutta), India | 14.7 million | +12.1% | 1.1% | 17.58 million |
| 17 | Manila, Philippines | 13.5 million | +35.4% | 12.7% | 16.84 million |
| 18 | Lagos, Nigeria | 13.5 million | +84.9% | 6.9% | 20.60 million |
| 19 | Rio de Janeiro, Brazil | 13.3 million | +17.6% | 6.3% | 14.41 million |
| 20 | Tianjin, China | 13.2 million | +89.1% | 0.9% | 15.75 million |
© 2019 by the authors. Licensee MDPI, Basel, Switzerland. This article is an open access article distributed under the terms and conditions of the Creative Commons Attribution (CC BY) license (http://creativecommons.org/licenses/by/4.0/).
Share and Cite
Wang, X.; Li, R. Is Urban Economic Output Decoupling from Water Use in Developing Countries?—Empirical Analysis of Beijing and Shanghai, China. Water 2019, 11, 1335. https://doi.org/10.3390/w11071335
Wang X, Li R. Is Urban Economic Output Decoupling from Water Use in Developing Countries?—Empirical Analysis of Beijing and Shanghai, China. Water. 2019; 11(7):1335. https://doi.org/10.3390/w11071335
Chicago/Turabian StyleWang, Xiaowei, and Rongrong Li. 2019. "Is Urban Economic Output Decoupling from Water Use in Developing Countries?—Empirical Analysis of Beijing and Shanghai, China" Water 11, no. 7: 1335. https://doi.org/10.3390/w11071335
APA StyleWang, X., & Li, R. (2019). Is Urban Economic Output Decoupling from Water Use in Developing Countries?—Empirical Analysis of Beijing and Shanghai, China. Water, 11(7), 1335. https://doi.org/10.3390/w11071335