Article

Reducing Impacts of Contamination in Water Distribution Networks: A Combined Strategy Based on Network Partitioning and Installation of Water Quality Sensors

by
Carlo Ciaponi
1,
Enrico Creaco
1,2,
Armando Di Nardo
2,3,*,
Michele Di Natale
2,3,
Carlo Giudicianni
2,3,
Dino Musmarra
2,3 and
Giovanni Francesco Santonastaso
2,3
1
Dipartimento di Ingegneria Civile e Architettura, Università di Pavia, Via Ferrata 3, 27100 Pavia, Italy
2
Action Group CTRL+SWAN of the European Innovation Partnership on Water, EU, Via Roma 29, 81031 Aversa, Italy
3
Dipartimento di Ingegneria, Università degli Studi della Campania “Luigi Vanvitelli”, Via Roma 29, 81031 Aversa, Italy
*
Author to whom correspondence should be addressed.
Water 2019, 11(6), 1315; https://doi.org/10.3390/w11061315
Submission received: 21 May 2019 / Revised: 20 June 2019 / Accepted: 21 June 2019 / Published: 25 June 2019
(This article belongs to the Special Issue Smart Urban Water Networks)

Abstract

:
This paper proposes a combined management strategy for monitoring water distribution networks (WDNs). This strategy is based on the application of water network partitioning (WNP) for the creation of district metered areas (DMAs) and on the installation of sensors for water quality monitoring. The proposed methodology was tested on a real WDN, showing that boundary pipes, at which flowmeters are installed to monitor flow, are good candidate locations for sensor installation, when considered along with few other nodes detected through topological criteria on the partitioned WDN. The option of considering only these potential locations, instead of all WDN nodes, inside a multi-objective optimization process, helps in reducing the search space of possible solutions and, ultimately, the computational burden. The solutions obtained with the optimization are effective in reducing affected population and detection time in contamination scenarios, and in increasing detection likelihood and redundancy of the monitoring system. Last but most importantly, these solutions offer benefits in terms of management and costs. In fact, installing a sensor alongside the flowmeter present between two adjacent DMAs yields managerial advantages associated with the closeness of the two devices. Furthermore, economic benefits due to the possibility of sharing some electronical components for data acquisition, saving, and transmission are derived.

1. Introduction

Installing an efficient monitoring and control sensor system gives the possibility to carry out main tasks on Water Distribution Network (WDN) management and protection. Securing these critical infrastructures is a crucial task for ensuring society’s welfare and prosperity. In fact, WDNs are strongly vulnerable to malicious and intentional actions [1] since they are made up of thousands of exposed elements. From a practical and economic point of view, securing all the apparatuses is not feasible. Thus, the design of an effective and cost-effective quality monitoring system represents a crucial management strategy for ensuring the delivery of good quality water to users. Optimal sensor placement becomes a necessary step for satisfactory water quality monitoring systems, also allowing identification of the source contamination [2]. These systems should provide a fast and accurate detection, distinguishing between normal variations and contamination events; furthermore, they should be economical, easy to integrate into network, and reliable [3]. This problem has been extensively studied for the past 20 years and several approaches have been proposed to identify optimal locations of sensors (Byoung et al. (1992) [4] defined the concept of maximum coverage to locate sensors formulating the problem as integer programming problem; using the same objective as the maximum coverage, Kumar et al. (1997) [5] employed a mixed-integer programming method; Watson et al.(2004) [6] used a mixed-integer linear programming model, showing that the problem of sensor placement must simultaneously consider multiple design objectives; Berry et al. (2005) [7] pointed out the difficulty of solving sensor placement by means of integer programming optimization; Ostfeld and Salomons (2004) [8] studied the problem in unsteady conditions using a genetic algorithm framework integrated with EPANET; Uber et al. (2004) [9] used a greedy heuristic solution methodology providing a heuristic (non-optimal) solution procedure scalable to large networks, taking into account uncertainty in threat scenario). The problem received lots of attention especially after the events of 11 September 2001. However, although many research works have been carried out in this field, the challenge of the optimal sensor placement is still open in many aspects, such as identification of optimal sensor locations and evaluation of performance and applicability to real-world scenarios. Models and algorithms for solving this arduous problem include deterministic and stochastic optimization techniques, optimizing one (Kessler et al. (1998) [10] defined the total volume of contaminated water consumed ahead of detection; Ostfeld and Salomons (2005) [11] enhanced previous study by taking into account the randomness of flow rate of the intruded pollutant, stochastic demands, and reaction time of the sensors; Berry et al. (2009) [12] incorporated into a mixed-integer programming formulation the probability of sensor failure) or more objectives (McKenna et al. (2007) [13] demonstrated the importance of considering sensor failure rates showing the trade-off between the sensor detection limit and the number of sensors; Dorini et al. (2008) [14] considered four objectives in the model and used a noisy cross-entropy sensor locator algorithm to find the optimal solution; Huang et al.(2008) [15] considered three objectives in their formulation solved by using a competent genetic algorithm while the contamination events were simulated by a development of Monte Carlo method; Propato and Piller (2006) [16] used a mixed-integer linear program methodology including notions of statistical and uncertainty analysis in the design process; Wu and Walski (2008) [17] combined four objectives into a single objective), such as detection likelihood, expected contaminated water volume, affected population, detection time, and the contaminated population. The interested reader can refer to Hart and Murray (2010) [18,19] for a review of this topic. The optimal sensor placement problem was also dealt with at the Battle of the Water Sensor Networks (BWSN) [20]. The main difficulty is that, given WDN complexity, efficient numerical techniques are needed to support optimal monitoring system design and the huge number of all potential contamination events in a WDN makes the problem computationally intractable (as each of these events is characterized by a different injection location, duration, mass rate, and starting time). Indeed, the optimal sensor placement in a network represents a combinatorial optimization problem that has been proven to be NP-hard [21]. For example, Krause et al. (2008) [22] showed that, using 30 parallel processors, it took 8 days to simulate random contamination events that could occur at 5 min intervals over a 24 h period from any of the 12,527 nodes in a medium-sized distribution network. In recent years, new concepts in sensor network design have been studied; Sankary and Ostfeld (2016) [23] investigated the possibility of adopting a mobile wireless sensor network to wirelessly transmit data to fixed transceivers in real time; Rathi et al. 2016 [24] proposed a novel strategy for the selection of contamination events with associated risk to be used in design of sensor network; Zheng et al. 2018 [25] investigated the characteristics of the sensor placement strategy effectiveness using several metrics, and providing guidance for selecting the most appropriate strategy for the preparedness for contamination events.
On the other hand, the “divide and conquer” concept has recently been gaining attention in the field of WDNs, showing to be one of the most efficient management strategies. The option of dividing large-scale networks into smaller and manageable subsystems, called district metered areas (DMAs), offers undisputable advantages for the monitoring and control of consumption, pressure, leakage, and water resource quality. In the scientific literature, numerous works were dedicated to the design of DMAs. Most of them are based on the application of decomposition algorithms [26,27] based on graph [28,29,30,31,32] and spectral theories [33,34], multi-agent method [35], social network theory [36], modularity index [37,38,39]. Though being significant contributions to the field, the works mentioned above are mostly focused on DMA design. Therefore, they fail to analyze the positive effects brought by the creation of DMAs to WDN management, for reducing the impacts of potential contamination events.
The global aim of this paper is to provide a general management framework for WDN monitoring, while exploring the benefits of water network partitioning (WNP) for:
  • reduction in inauspicious consequences of contamination (both accidental and intentional) in terms of limitation of contaminated areas (direct action);
  • optimal placement of quality sensors (indirect action).
While the analysis of the former aspect is presented hereinafter as a follow-up of the work of Ciaponi et al. (2018) [40], the analysis of the latter aspect is entirely novel. In this context, the possibility of installing some or all sensors at boundary pipes will be considered, resulting in a two-fold advantage: numerical, due to the reduction in the research space of possible candidate solutions for sensor installation, and managerial, due to easiness of access and to cost savings for the possibility of sharing some electronical components for data acquisition, saving, and transmission.
In the following sections, first the methodology is presented, followed by the applications to a real case study, testing different scenarios and comparing different sensor locations with four water quality-based parameters, in order to validate the results.

2. Materials and Methods

The methodology used in this work is the combination of two main procedures, used for WNP and sensor placement, respectively. These procedures, both derived from the scientific literature, are described in the following Section 2.1 and Section 2.2, respectively. Section 2.3 deals with the postprocessing of the sensor placement solutions obtained in Section 2.2.

2.1. Procedure 1—WNP

According to Perelmann et al. (2015) [41], WNP is carried out in two main phases: (a) clustering, in which the optimal shape and size of the clusters are defined by minimizing the number of edge cuts (boundary pipes) and by simultaneously balancing the number of nodes of each cluster, and (b) dividing, in which clusters are separated from each other by closing isolation valves at some boundary pipes and installing flow meters at the remaining boundary pipes.
In this work, the clustering layout is obtained exploiting the properties of the normalized Laplacian matrix L = DA, in which D is the diagonal matrix containing the node degree ki of each node, and A is the adjacency matrix. In this matrix, the elements aij = aji = 1 if nodes ni and nj are connected by a pipe; otherwise, aij = aji = 0. Shi and Malik (2000) [42] demonstrated that through the first C smallest eigenvector of the normalized Laplacian matrix, the relaxed version of the min-cut problem can be solved. In fact, it corresponds to the minimization of the Rayleigh quotient. If C is the number of clusters in which the network must be divided, the first C smallest eigenvectors of the Laplacian matrix are considered and used to create a new matrix UnxC. A k-means algorithm is applied to the rows of UnxC for grouping the nodes of the network in C clusters. The main trick is to change the representation of the nodes in the eigenspace of the first C eigenvectors, which enhances the cluster-properties of the nodes in such a way that they can be trivially detected in the new representation. The spectral clustering algorithm proved to show a superior performance to other clustering procedures, in that the provided clustering layout features both a well-balanced cluster size and a minimum number of edge cuts [43]. The main spectral clustering steps in the case of a WDN are described by Di Nardo et al. (2018b) [44]. The graph of the WDN can be considered un-weighted (every connection between the nodes has the same importance, aij = aji = 1) or weighted (the value aij = aji can be related to pipe features, such as diameter d and length l). In the applications of this work, aij and aji were set at 1. The optimal number of clusters C (from a topological point of view) in which to subdivide the network is chosen as a function of the number n of nodes, according to the relationship Copt = n0.28 [45]. The clustering phase provides the optimal cluster layout and, as a result, the edge-cut set, consisting of a group of Nec boundary pipes between clusters. In correspondence to each boundary pipe, the flow transfer between the adjacent clusters must always be known, if it is larger than zero, in order to make the dividing effective. Therefore, the choice must be made whether either a gate valve must be closed, or a flow meter must be installed in the generic boundary pipe. Following this choice, the sum of closed gate valves (as numerous as Ngv) and installed flow meters (as numerous as Nfm) must be equal to Nec. Closing gate valves has the effect of reducing the service pressure and, therefore, leakage in the WDN. However, if service pressure falls below the desired threshold value hdes, this negatively impacts on WDN reliability. In this work, the trade-off between leakage and WDN reliability was explored through the bi-objective optimization, performed through the NSGAII genetic algorithm [46]. In this optimization, several decisional variables equal to Nec was considered, to encode, inside individual genes, gate valve closure (gene value equal to 1) or flow meter installation (gene value equal to 0) at boundary pipes. The first objective function f1 to minimize was the daily leakage volume Vl (m3):
f1 = Vl
where Vl is calculated as the sum of the temporal integral of the nodal leakage outflows, evaluated as a function of nodal pressure heads through the Tucciarelli et al. (1999) [47] formula.
The second objective function f2 relates to the global resilience failure index GRF index proposed by Creaco et al. (2016) [48] to represent the instantaneous power surplus/deficit conditions of the WDN. In fact, GRF is dimensionless and is the sum of the resilience (Ir) and failure (If) indices evaluated at the generic instant of WDN operation:
G R F = I r + I f = m a x q u s e r T H d T H d e s , 0 Q 0 T H 0 d T H d e s + m i n q u s e r T H d T H d e s , 0 d T H d e s
where d and quser are the vectors of nodal demands d (m3/s) and water discharges quser (m3/s) delivered to users, respectively, at WDN demanding nodes. In this work, quser was evaluated as a function of d and pressure head h (m) at each node though the pressure-driven formula of Tanyimboh and Templeman (2010) [49], with calibration proposed by Ciaponi et al. (2014) [50]. H and H0 are the vectors of nodal heads (m) at demanding nodes and sources, respectively. Hdes is the vector of desired nodal heads, which are the sum of nodal elevations and desired pressure heads hdes (m). Finally, Q0 is the vector of the water discharges leaving the sources. The GRF index has the advantage of being within range [−1, 1]. Higher values of GRF indicate higher power delivered to WDN users and, therefore, higher service pressure. With reference to WDN daily operation, the second objective function f2 to maximize was calculated with the following relationship, as suggested by Creaco et al. (2016) [48]:
f2 = median(GRF)
The choice of the median value of GRF is because Creaco et al. (2016) [48] proved it to give a suitable and concise representation of a sequence of operation scenarios in the extended period simulation of the WDN. Both f1 and f2 can be calculated by applying a pressure-driven WDN solver (e.g., that of Creaco et al. 2016 [48]). They are mutually contrasting objectives: in fact, as the number of closed gates grows, f1, which has to be minimized, decreases. At the same time, f2, which has to be maximized, decreases as well due to the decreasing service pressure. This creates a trade-off between the two objectives, which takes the form of a Pareto front of optimal solutions, that is a group of solutions from which to select the final solution for the partitioning. To this end, additional criteria, such as the partitioning cost or demand satisfaction, can be adopted. In fact, the Pareto front of optimal solutions can be re-evaluated in terms of other functions, such as number Nfm of flow meters and demand satisfaction rate Ids. In fact, Nfm is a surrogate for the partitioning cost [34], whereas Ids represents the effectiveness of the service to WDN users. The latter index can be calculated as:
I d s = w d w t o t
where wd (m3) and wtot (m3) are the delivered water volume and the WDN demand, respectively. Variable wd can be calculated starting from the temporal integral of the water discharge quser delivered to the users at each node.

2.2. Procedure 2—Optimal Sensor Placement

Let a set S of potential contamination events considered in the analysis, each of which featuring a certain location, starting time, duration, and total mass, be defined. In this context, sensor placement was formulated as a bi-objective optimization problem [51], in which the first objective function is f3 = Nsens (number of installed sensors), as a surrogate for the installation cost for WDN monitoring, while the second objective function is:
f 4 = p o p = r = 1 S p o p r S
The objective function f4 is related to the contaminated population popr before the first detection of the generic r-th contamination event. This corresponds to the sum of the inhabitants served by the contaminated nodes and can be evaluated using the EPANET quality solver [52], using an unreactive contaminant. The EPANET quality solver can be applied to the flow field obtained following procedure 1. If the r-th event is not detected, popr includes all the nodes crossed by the contamination till the whole contaminant mass leaves the WDN. Though numerous objective functions can be used for the optimal installation of sensors, the population exposed to contamination was chosen as the objective function to minimize along with the number of sensors. This choice was made because, compared to other potential objective functions (such as detection likelihood and sensor redundancy), the population exposed to contamination represents more directly the impact of contamination, which is the most meaningful from the viewpoint of risk assessment and mitigation. The time interval Δtreact for the activation of emergency operations is set to 0 hr hereinafter for simplifying purposes. This means that contamination is assumed to stop instantaneously after its detection. However, Δtreact can be set to other values without loss of validity of the whole methodology. The function f4 is therefore the average value pop of popr. In the bi-objective optimization, functions f3 and f4 are minimized simultaneously through the NSGAII genetic algorithm [46]. In fact, the minimization of the former reduces the sensor cost while the minimization of the latter impacts positively on the system security. In the population individuals of NSGAII, the number of genes is equal to the number of network nodes where sensors can be installed. Each gene can take on the two possible values 0 and 1, which stand for absence and presence of the sensor in the node associated with the gene, respectively.
In this paper, four options for sensor locations on the partitioned network were tested:
  • Option 1, sensors can be installed at all nodes (typical greedy approach);
  • Option 2, sensors can be installed only at the hydraulically upstream nodes of the boundary pipes;
  • Option 3, sensors can be installed at the most central nodes of each district, identified through topological considerations;
  • Option 4, sensors can be installed at the hydraulically upstream nodes of the boundary pipes and at the most central nodes of each district.
In the last two cases, the idea is to take advantage from the study of WDN topology in order to define which nodes are potential candidates for sensor installation, according to their connectivity centrality. In this paper, the most central nodes were defined using the betweenness centrality [53], defined starting from the shortest paths in a graph. The shortest path σ(s, t) between two nodes s and t is the connecting path with the lowest number of links (or the minimum sum of the weights associated with its links in the case of weighted graph). The betweenness centrality of a node i is defined as the sum of the ratios of the number of shortest paths between nodes s and t passing through i to the total number of shortest paths between nodes s and t. It is a measure of the influence of a node i over the flow of information between other nodes. In this paper, for each cluster, the nodes with the highest value of betweenness centrality were selected as possible sensor locations alone (Option 3) or in combination with boundary nodes (Option 4). Options 2, 3, and 4 aim to investigate the possibility of limiting the search for optimal sensor locations to the hydraulically upstream nodes of the flow meter-fitted boundary pipes and to the most central nodes of each district. This choice leads to significant computational simplifications, due to the reduction in the search space. This offers the possibility of better facing the problem of optimal sensor placement also for big-size WDNs (for which the number of all potential scenarios makes the problem computationally intractable). Furthermore, the strategy of locating all or some sensors in the same stations as boundary flowmeters offers easiness and cheapness of inspection and maintenance.

2.3. Procedure 3—Comparison of Sensor Placement Solutions

Sensor placement solutions were evaluated using the following four contamination impact indicators. The first is function f4 in Equation (5), followed by functions f5, f6 and f7 reported in the following Equations (6)–(8), respectively.
The function f5 is the detection likelihood (i.e., the probability of detection):
f 5 = P s = 1 S r = 1 S d r
where dr = 1 if contamination scenario r is detected, and zero otherwise; and S denotes the total number of the contamination scenarios considered.
The function f6 is the detection time. For each detected contamination scenario, the sensor detection time corresponds to the elapsed time from the start of the contamination event, to the first identified presence of a nonzero contaminant concentration. If tj is the time of the first detection (referred to the j-th sensor location), the detection time (td) for the solution for each contamination event, is the minimum among all present sensors td = min(tj); the characteristic detection time of the solution is defined as the mean of all td for the contamination scenarios detected by at least one sensor:
f 6 = m e a n t d
Finally, the function f7 is the sensor redundancy. In a generic scenario, the variable Red corresponds to the number of sensors (including the first) that detect the contamination within 30 minutes from the first detection; the redundancy Red of the solution is defined as the mean of all the values of redundancy Red for all the considered contamination scenarios:
f 7 = R e d = m e a n R e d
which contributes to the safety of the monitoring systems, especially in the case of sensor failures or false positive/negative detection, conferring a higher reliability.
As for the choice of the objective functions, it must be remarked that theoretically more than two of them could be inserted in the same optimization framework. However, to prevent this framework from becoming overly complex, we preferred to keep only two objective functions (number of sensors and exposed population) in the optimization framework, while other assessment criteria (e.g., detection likelihood, detection time, and sensor redundancy) will be considered in the postprocessing of the optimal solutions.

3. Case Study

The methodology described above was tested on the WDN of Parete [54], which is a small town located in a densely populated area to the south of Caserta (Italy), with population of 11,150 inhabitants. This WDN has 182 demanding nodes (with ground elevations ranging from 53 m a.s.l. to 79 m a.s.l.), 282 pipes and 2 sources with fixed head of 110 m a.s.l. A uniform desired pressure head hdes = 19 m was assumed for the demanding nodes, coming from the sum of the maximum building height in the town, which is 9 m in Parete, and 10 m, as prescribed by the Italian guidelines. Reference was made to the day of maximum consumption in the year when the total nodal demand ranges from 7.6 L/s at nighttime to 77.2 L/s in the morning and midday peaks, with an average value of 36.3 L/s. The leakage volume of the networks in the day of maximum consumption adds up to 930 m3 (about 23% of the total outflow from the sources). The number of users connected to each WDN node was derived based on its average nodal demand.

4. Results and Discussions

In this section, the results of the procedures described in Section 2.1, Section 2.2 and Section 2.3 are reported. The first step is the definition of an optimal water network partitioning. In this regard, the clustering phase was applied to produce 5 DMAs. The choice of 5 DMAs was made because the formula Copt = n0.28 proposed by Giudicianni et al. (2018) [45] to calculate the optimal number of clusters yields Copt = 4.3 for this WDN. The number of nodes for each DMA are DMA1 = 20, DMA2 = 35, DMA3 = 39, DMA4 = 41 and DMA5 = 49, with Nec = 21. For the dividing, the optimization through NSGAII yielded the Pareto front reported in Figure 1a, showing, as expected, growing values of median(GRF) with Vl growing. In fact, both variables are growing functions of the service pressure in the WDN. Figure 1b,c report the number Nfm of flow meters and the demand satisfaction rate Ids, respectively, re-evaluated from the Pareto front and plotted against Vl. Globally, Figure 1b highlights that the higher values of Nfm tend to be associated with the high values of Vl. This is because Vl tends to grow when fewer gate valves are closed (and then more numerous flow meters are installed) at the boundary pipes. Finally, Figure 1c shows that Ids tend to grow with Vl increasing, since both variables are increasing functions of the service pressure.
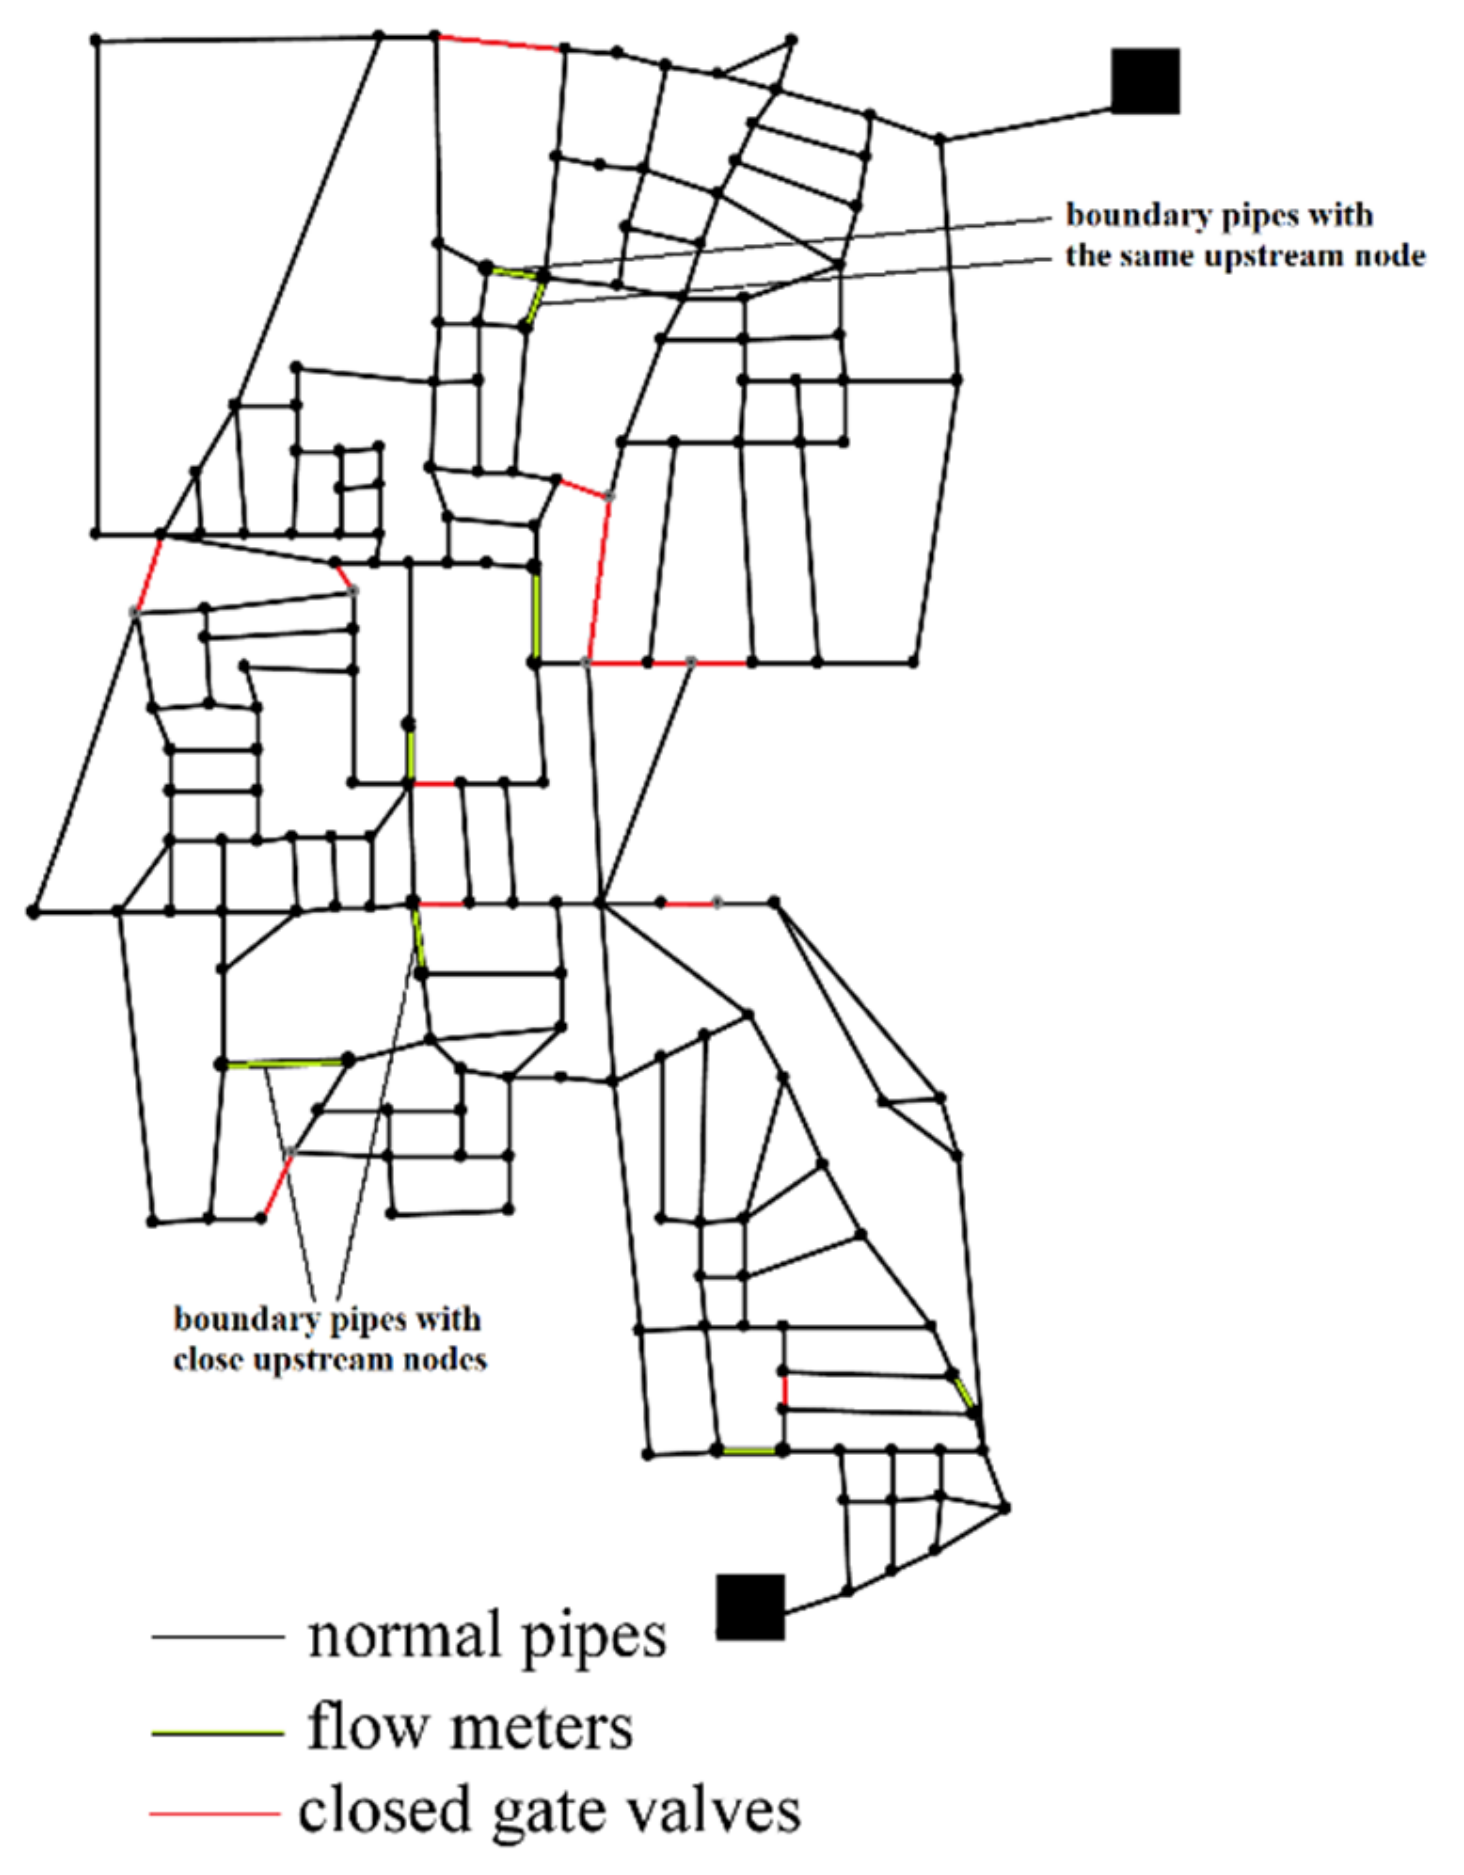
From the graphs in Figure 1, the solution with the lowest value of Nfm (= 8), highest number of closed valves Ngv (= 13), which ensures Ids = 100%, was finally chosen. An important remark to be made is that among the several advantages of the WNP, the adopted partitioning solution enables also reducing leakage, from 930 m3 (for the un-partitioned layout) to 895 m3 (partitioned solution with 13 gate valves closed and 8 flow meters installed). This corresponds to a 3.7% leakage reduction without negatively affecting Ids and GRF. In fact, for this solution median(GRF) is equal to 0.32, very close to the value of 0.36 for the un-partitioned network. The layout of the partitioned layout is reported in Figure 2. The optimal sensor placement is then carried out. The following assumptions were made for the construction of the set S of contamination events considered in the optimization:
  • all the 182 demanding nodes were considered to be potential locations for contaminant injection;
  • 24 possible contamination times in the day (hour 0, 1, 2, …, 22, 23);
  • single value of the mass injection rate equal to 350 g/min;
  • single value of the injection duration equal to 60 min.
The values reported above for mass injection and duration were sampled from those proposed by Preis and Ostfeld (2008) [55], using the procedure of Tinelli et al. (2017) [51], with the objective to obtain a representative smaller set of significant contamination events. Due to the previous assumptions, the total number S of contamination events was 182 × 24 × 1 × 1 = 4368.
The water quality simulations were run for 2 days of WDN operation to make sure that even contaminants injected close to the sources at the last instant of the first day had enough time to leave the network. In the optimization for sensor placement, the partitioned WDN layout was indicated as Var1 to differentiate it from the original layout (Var0). Therefore, according to the three optimization options described in Section 2.2, optimizations were organized as follows:
  • Var1Op1: Optimal sensor placement on the partitioned WDN allowing sensor installation on all nodes (182 potential locations);
  • Var1Opt2: Optimal sensor placement on the partitioned WDN allowing sensor installation only on the nodes hydraulically upstream from the flowmeter fitted boundary pipes (8 potential locations);
  • Var1Opt3: Optimal sensor placement on the partitioned WDN allowing sensor installation only on the most central nodes of each district (15 potential locations, i.e., three locations for each district, which feature a much higher betweenness centrality value than the other nodes);
  • Var1Opt4: Optimal sensor placement on the partitioned WDN allowing sensor installation on the nodes hydraulically upstream from the flowmeter fitted boundary pipes and on the most central nodes of each district (23 scenarios).
Compared to Var1Opt1, Var1Opt2, Var1Opt3 and Var1Opt4 reduce the group of potential sensor locations respectively by 96%, 92% and 87%, resulting in a research space reduction which helps in diminishing the computational burden. The three optimizations were compared with the benchmark Var0Opt1, where all the 182 potential sensor locations are explored in the original layout. Table 1 shows the optimization framework, made up of 5 runs. In all of them, NSGAII was applied with a population of 200 individuals and a total number of 200 generations.
For the optimizations that consider all nodes as potential sensor locations (Var0Opt1, Var1Opt1), the slow convergence of NSGAII was initially remarked towards interesting solutions for water utilities, which are solutions with a reasonably low number of sensors in comparison with the total number of demanding nodes. This problem was solved by implementing inside NSGAII a heuristic algorithm to correct solutions with numerous sensors, that is Nsens > 20. In this heuristic algorithm, for each NSGAII solution violating Nsens = 20, a random integer number within the range (1, 20) is generated, representing the target number of sensors for that solution. Then, starting from the initial value of Nsens, the least effective sensors in terms of pop are removed one by one to reach the target. Though increasing the computation time for each NSGAII generation by about 30 times, this algorithm proved to solve the issue of slow convergence. This heuristic algorithm was not applied to the optimizations Var1Opt2, Var1Opt3 and Var1Opt4. This made the NSGAII optimizations in the two latter applications much lighter from the computational viewpoint.
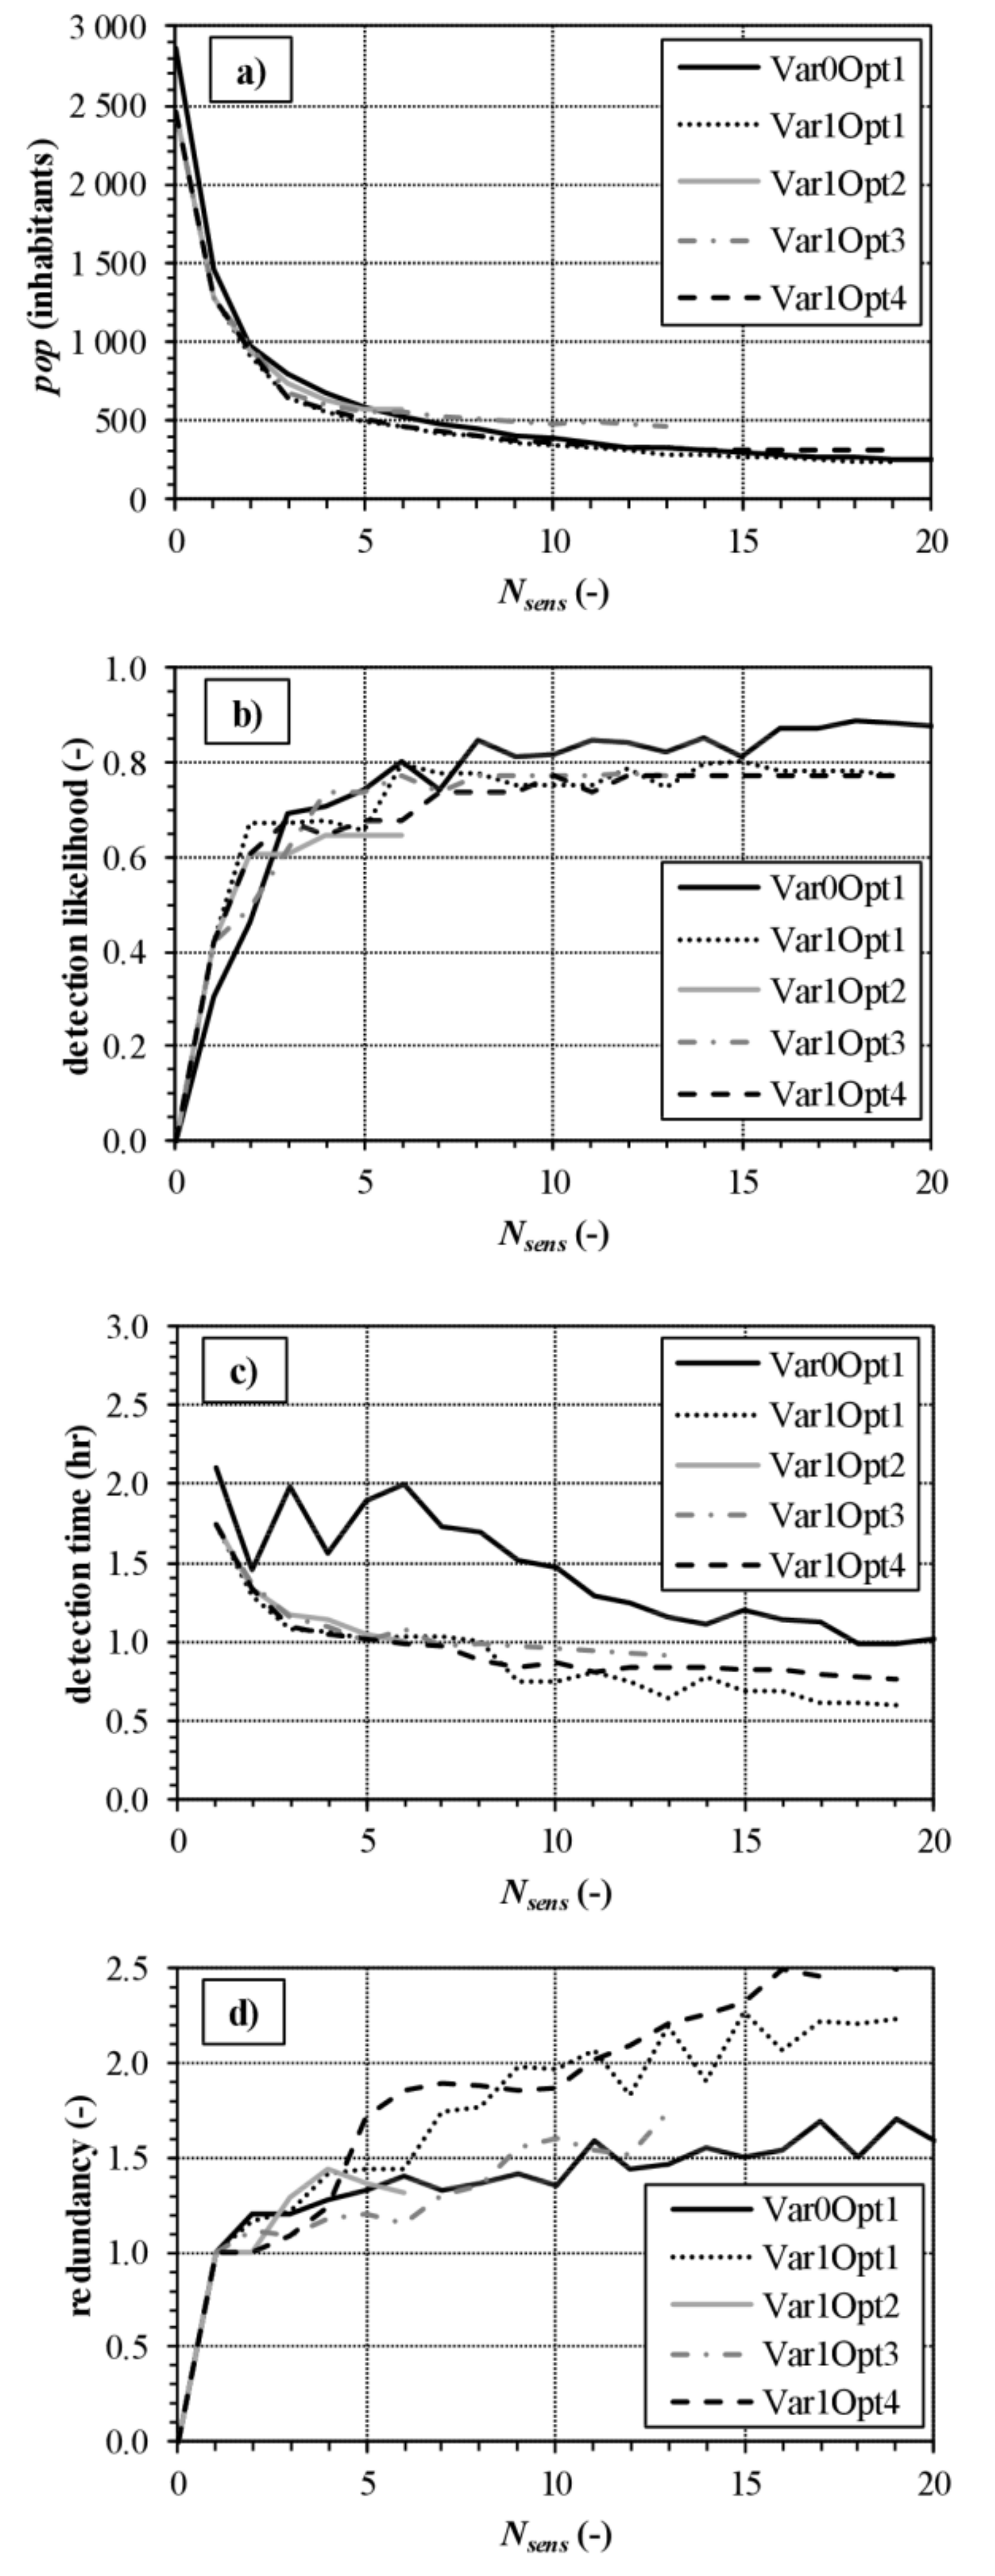
Figure 3a reports the Pareto fronts obtained in optimization Var0Opt1, on the un-partitioned layout, and in optimizations Var1Opt1, Var1Opt2, Var1Opt3 and Var1Opt4, on the partitioned layout. As expected, these fronts in Figure 3a show decreasing values of pop as Nsens increases up to 20. However, for high values of Nsens, the additional benefit of a further sensor installed in the network tends to decrease, as already pointed out by Tinelli et al. (2017) [56]. In the present work, Nsens = 6 appears to be the threshold of benefit for the installation of an additional sensor, slightly to right of the knee of the Pareto fronts (which lies around Nsens = 3).
Another point to highlight is that for the partitioned network, the contaminated population corresponding to the case of zero installed sensors (pop = 2458) is lower than the corresponding contaminated population for the un-partitioned WDN (pop = 2806) as shown in Table 2.
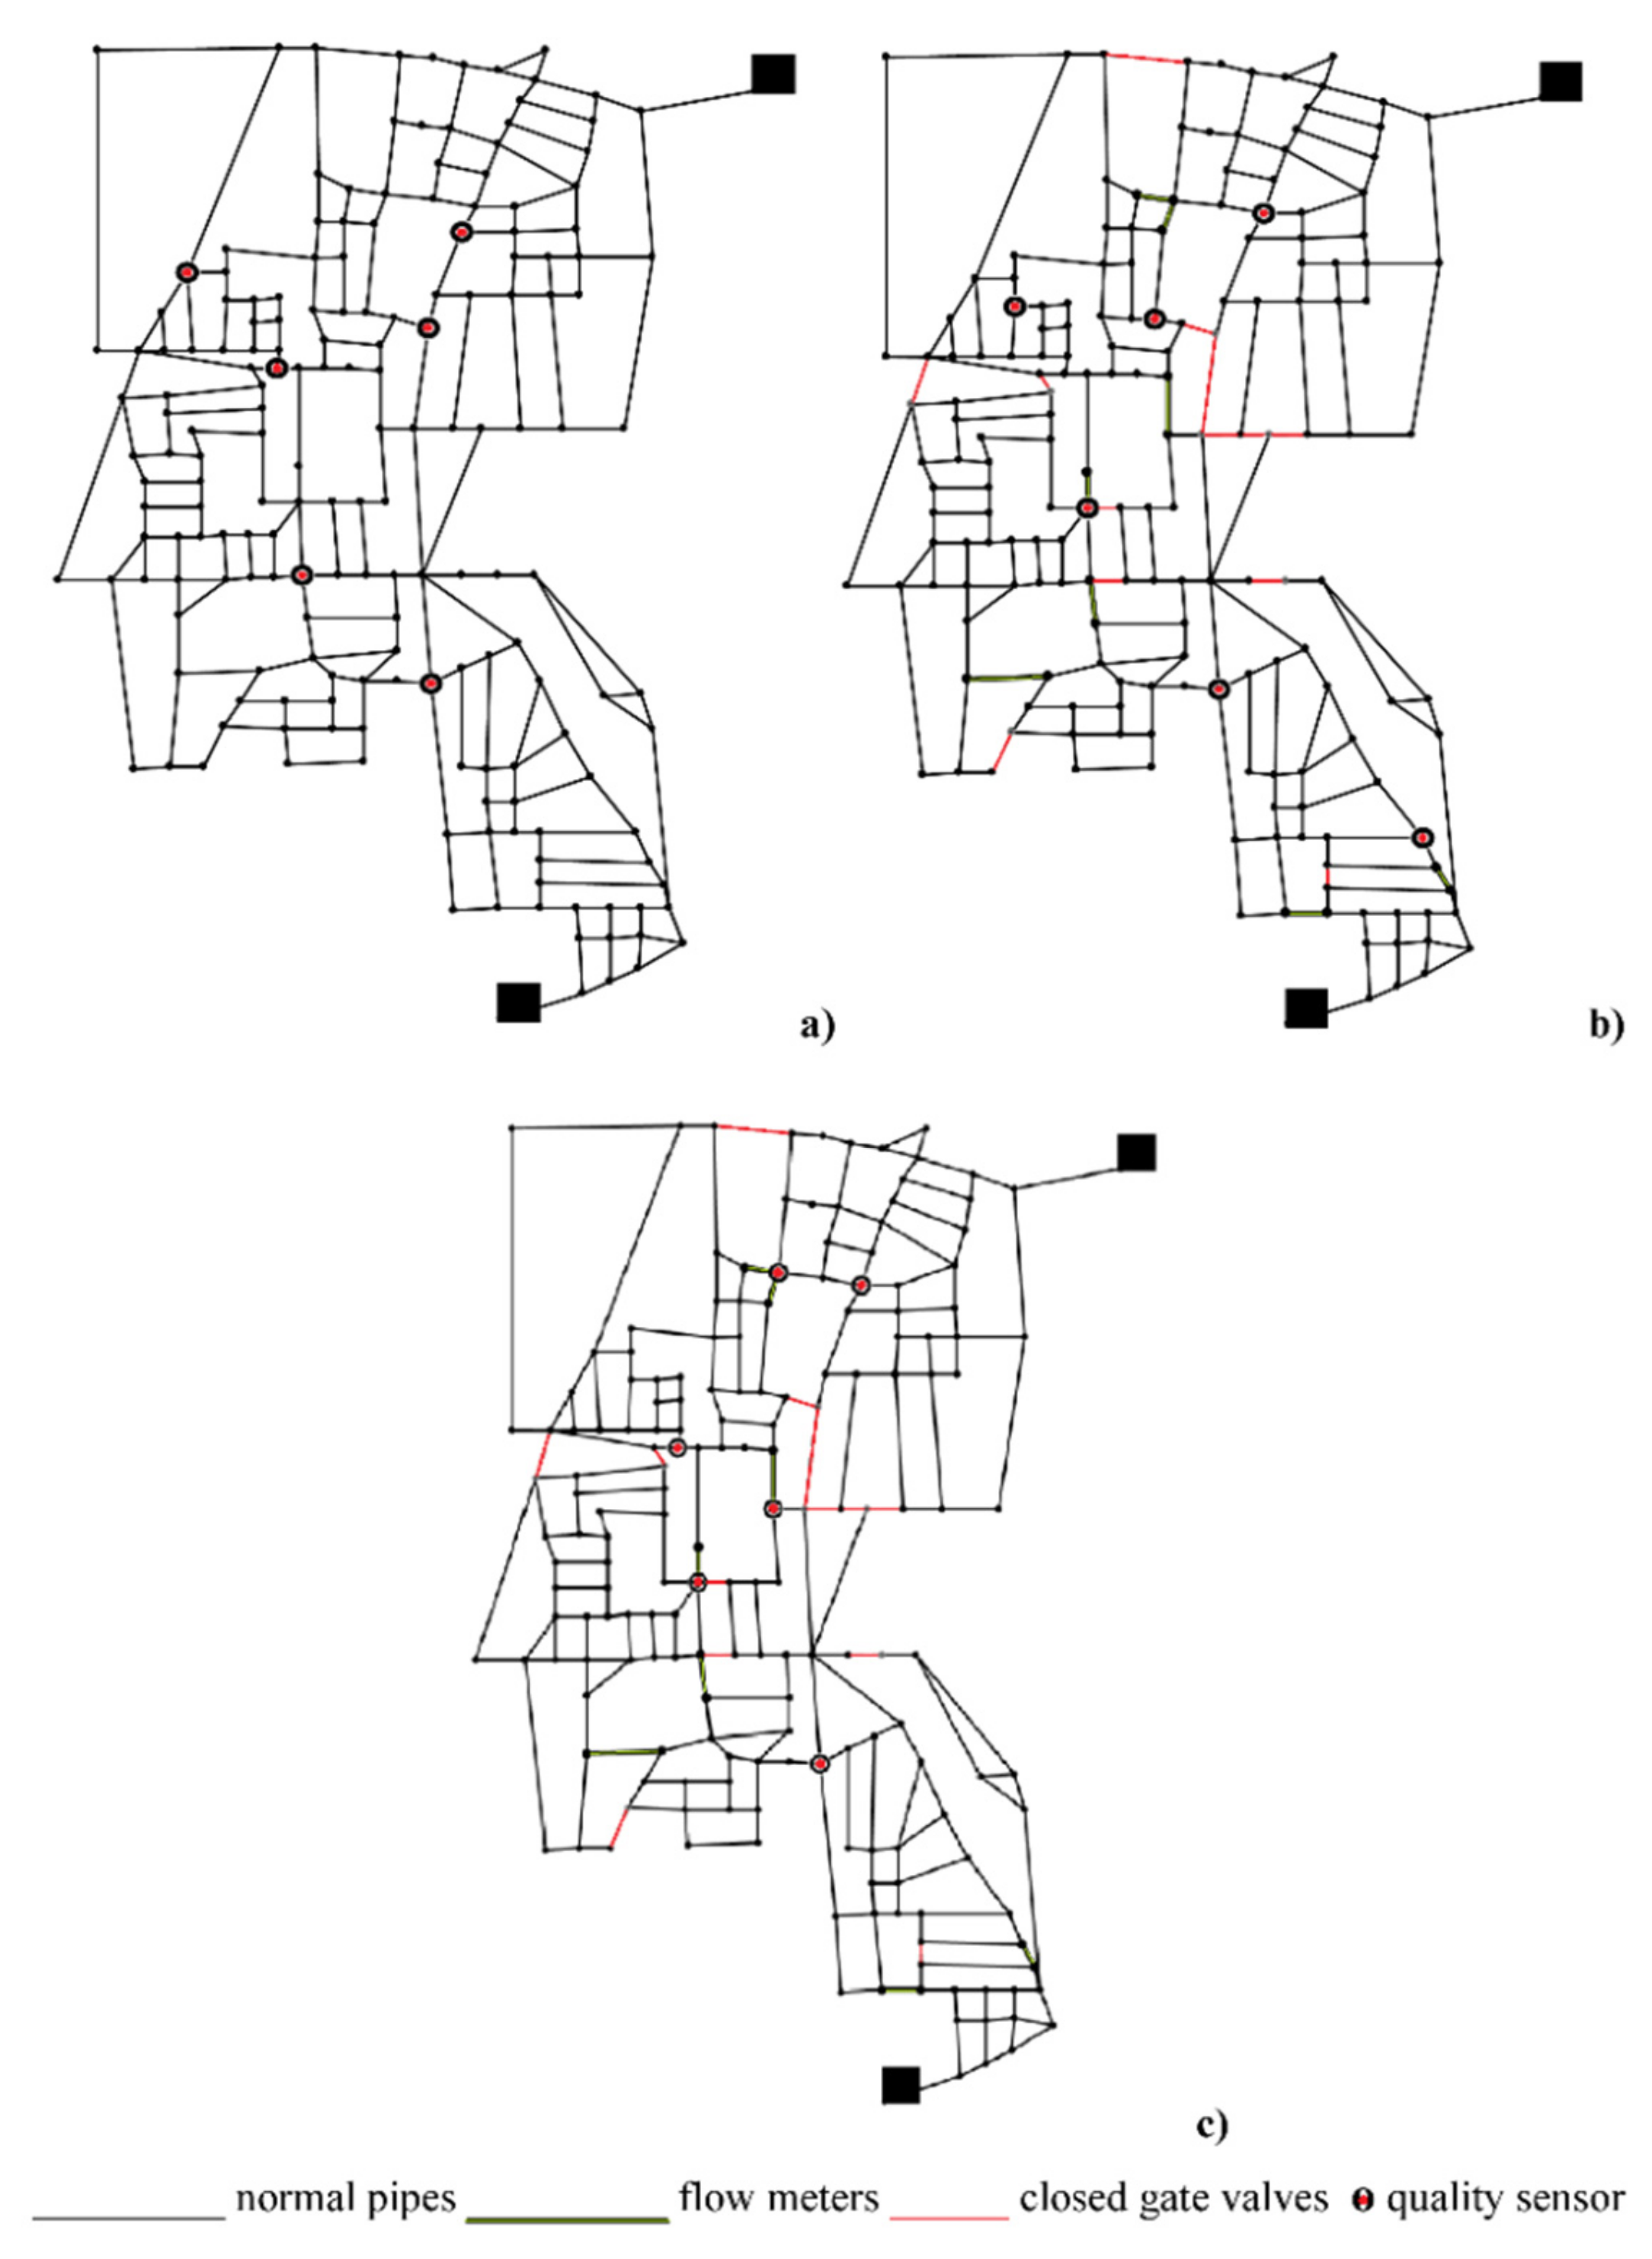
This points out the first advantage of the partitioning: by reducing the average number of possible paths in the network (due to the closure of some pipes), it produces a reduction in the contaminated population by around 12.4%. This is due to the reduction in the spreading of contamination (direct action). Furthermore, the WNP also enhances the results of optimal sensor placement (indirect action). As is shown in Table 2 for Nsens ≤ 6, pop for the un-partitioned WDN (Var0Opt1) is always higher than pop for the Var1Opt1 for all the number Nsens of sensors installed in the network. The minimum value of pop = 462 is for Var1Opt1. Var1Opt2 (sensors allowed only upstream from boundary pipes), Var1Opt3 (sensors allowed only on topologically central nodes in DMAs) and Var1Opt4 (sensors allowed upstream from boundary pipes and on topologically central nodes in DMAs) give similar results to Var1Opt1 up to Nsens = 2. For Nsens > 2, Var1Opt2 and Var1Op3 degenerate while the good performance of Var1Opt4 persists. This is evidence that constraining sensor installation only upstream from boundary pipes or on topologically central nodes may lead to remarkably sub-optimal solutions. However, the combination of locations upstream from the boundary pipes and of topologically central nodes offers a good set of potential locations in the problem of optimal sensor placements. Figure 3b–d report the results of the reprocessing of the optimal solutions in terms of detection likelihood, detection time, and redundancy as a function of Nsens. Along with Figure 3a, they give indications on the effectiveness of the solutions obtained in the NSGAII runs. Globally, the Var1 solutions obtained on the partitioned graph, especially Var1Opt1, Var1Op2, and Var1Opt4, tend to perform better in terms of pop, detection time, and sensor redundancy. Conversely, they feature slightly worse values in terms of detection likelihood. This may be because the optimization was carried out considering pop as objective function, which is slightly contrasted with detection likelihood [56]. In fact, the former variable mainly contributes to the system’s early warning capacity whereas the latter contributes to the system safety. As for Figure 3, it must be remarked that the curves in Figure 3a are Pareto fronts while those in the other Figure 3b–d are obtained by reprocessing the optimal solutions in terms of other assessment criteria. Since these curves are not Pareto fronts, they are not strictly monotonous. Figure 4 shows the sensor placement solutions obtained for Nsens = 6 with three optimizations (Var0Opt1, Var1Opt1, and Var1Opt4). In this context, it must be noted that the Var1Opt4 solution has three of the six sensors placed close to flowmeters (the other three sensors are in the most central nodes according to the betweenness centrality). This solution yields managerial and economic benefits, due to the closeness of some sensors to installed flow meters and due to the possibility of sharing some electronical components for data acquisition, sharing, and transmission. Summing up, the Var1Opt4 solution represents a quasi-optimal solution in the explored trade-off between pop and Nsens, while offering significant potentials for improved management. Another advantage compared to the Var0Opt1 and Var1Opt1 solutions with Nsens = 6 is that it was obtained at a much lower computation cost (about 1/30), due to the research space reduction mentioned above for Options 2–4. Overall, the advantages in terms of computational lightness during the optimization as well as the possibility of inspecting and maintaining sensors in proximity to flow meters make solutions obtained in Opt4 preferable from the water utilities’ viewpoint. The results highlighted that nodes close to flow meters used for the monitoring of DMAs, which must always be easily accessible sites, represent good sensor locations for WDN monitoring from contaminations, when they are inserted into an optimization framework that also includes topologically central nodes inside DMAs. As for the optimal positions of the sensors in Var1Opt1 (partitioned network and all nodes as potential candidates) and Var1Opt4 (partitioned network and sensor installations restricted to entry points and central nodes in DMAs), it must be remarked that many locations are similar in the two cases (see Figure 4). This corroborates the fact that entry points and central nodes in DMAs are good candidate locations in the present case study.

5. Conclusions

In this work, a methodology that combines WNP and optimal sensor installation was proposed, to investigate the benefits of the “divide and conquer” technique for the monitoring of WDNs from contamination events (direct action), and for the effectiveness of optimal sensor placement (indirect action). The applications concerned a real Italian WDN, which was first partitioned into 5 DMAs. Optimal sensor solutions were searched for on the original un-partitioned WDN and on the partitioned layout, in the trade-off between number of installed sensors and affected population for an assigned set of contamination events. Further optimizations were carried out by restricting sensor installation to some pre-selected nodes (nodes hydraulically upstream from the flow meter-fitted boundary pipes and central nodes). The results showed that, for a given number of installed sensors, the monitoring stations installed in the partitioned layouts offer better monitoring performance. On the other hand, the option of considering locations in proximity to flow meters and at most central nodes as the only potential locations in the context of optimal sensor placement has the following advantages:
  • almost identical performance in terms of WDN monitoring, compared to the option of considering all nodes as potential locations;
  • money savings thanks to the possibility of sharing some electronical components for data acquisition, sharing, and transmission;
  • easiness of access to the sensors for maintenance;
  • reduction in the search space and, therefore, in the computational complexity in the optimizations for optimal sensor placement;
  • easier identification of the area from which the contamination starts with the subsequent possibility of isolating the district, assuring a higher resilience of the system to the spreading of the contamination.
With regards to the last issue, it must be noted that the calculations of the present work were carried out on a simple though real WDN. Therefore, the benefits are expected to be much larger in the case of big-size WDNs, for which the problem of optimal sensor placement may become computationally infeasible. Indeed, the topics analyzed in this paper fully match the future research directions identified by Ostfeld et al. (2008) [20] during the Battle of the Water Sensor Networks. In fact, specific reference was made to the problems of aggregation, i.e., the possibility of using a reduced but still significant sample of nodes for investigations into water quality, multi-criteria analysis of sensor performance, choice of optimal number of sensors and multiple use of boundary pipes (for both monitoring flow between DMAs and detecting potential contaminations).
Though topologically central nodes have been considered in this analysis along with DMA entry points, another attractive option is made up of critical sink nodes with lowest head inside DMAs, in which water quality parameters are already monitored. Future works will be dedicated to exploring the solution of critical sink nodes. Future work will be dedicated to investigating how results change when other objective functions from those used in the present work are considered. The methodology presented in this paper will be refined in the future considering also other benchmark networks. Adopting different clustering algorithms and centrality metrics could affect the results; to better investigate the influence on the solutions, new algorithms will be applied. Another aspect that deserves to be further investigated concerns the assumptions made for the definition of the representative set of contamination scenarios. Other prospects could concern the issues of restoration after the generic contamination and of constructing mega-monitoring stations on which to locate all the management devices (chlorine stations, pressure valves, etc.). This will be done with reference to specific real contaminants, while abandoning the simplifying assumption of unreactive and conservative contaminant adopted so far.

Author Contributions

E.C. and A.D.N. wrote the manuscript, C.G. and G.F.S. developed the coding and performed the analysis, C.C., D.M., and M.D.N. revised the paper.

Funding

This research received no external funding.

Acknowledgments

This research is part of the Ph.D. project “Water distribution network management optimization through Complex Network theory” within the Doctoral Course “A.D.I.” granted by Università degli Studi della Campania “L. Vanvitelli”.

Conflicts of Interest

The authors declare no conflict of interest.

References

  1. Kroll, D.J. Securing Our Water Supply: Protecting a Vulnerable Resource; PennWell Books: Tulsa, OK, USA, 2006. [Google Scholar]
  2. Adedoja, O.S.; Hamam, Y.; Khalaf, B.; Sadiku, R. Towards Development of an Optimization Model to Identify Contamination Source in a Water Distribution Network. Water 2018, 10, 579. [Google Scholar] [CrossRef]
  3. Che, H.; Liu, S.; Smith, K. Performance evaluation for a contamination detection method using multiple water quality sensors in an early warning system. Water 2015, 7, 1422–1436. [Google Scholar] [CrossRef]
  4. Lee, B.H.; Deininger, R.A. Optimal locations of monitoring stations in water distribution system. J. Environ. Eng. 1992, 118, 4–16. [Google Scholar] [CrossRef]
  5. Kumar, A.; Kansal, M.L.; Arora, G. Identification of monitoring stations in water distribution system. J. Environ. Eng. 1997, 123, 746–752. [Google Scholar] [CrossRef]
  6. Watson, J.-P.; Greenberg, H.J.; Hart, W.E. A multiple-objective analysis of sensor placement optimization in water networks. In Proceedings of the World Water and Environmental Resources Congress 2004, Salt Lake City, UT, USA, 27 June–1 July 2004; pp. 1–10. [Google Scholar]
  7. Berry, J.W.; Hart, W.E.; Phillips, C.A.; Watson, J.-P. Scalability of integer programming computations for sensor placement in water networks. In Proceedings of the World Water and Environmental Resources Congress 2004, Anchorage, AK, USA, 15–19 May 2005; pp. 1–13. [Google Scholar]
  8. Ostfeld, A.; Salomons, E. Optimal layout of early warning detection stations for water distribution systems security. J. Water Resour. Plan. Manag. 2004, 130, 377–385. [Google Scholar] [CrossRef]
  9. Uber, J.; Janke, R.; Murray, R.; Meyer, P. Greedy heuristic methods for locating water quality sensors in distribution systems. In Proceedings of the World Water and Environmental Resources Congress 2004, Salt Lake City, UT, USA, 27 June–1 July 2004; pp. 1–9. [Google Scholar]
  10. Kessler, A.; Ostfeld, A.; Sinai, G. Detecting accidental contaminations in municipal water networks. J. Water Resour. Plan. Manag. 1998, 124, 192–198. [Google Scholar] [CrossRef]
  11. Ostfeld, A.; Salomons, E. Securing water distribution systems using online contamination monitoring. J. Water Resour. Plan. Manag. 2005, 131, 402–405. [Google Scholar] [CrossRef]
  12. Berry, J.; Carr, R.D.; Hart, W.E.; Leung, V.J.; Phillips, C.A.; Watson, J.-P. Designing contamination warning systems for municipal water networks using imperfect sensors. J. Water Resour. Plan. Manag. 2009, 135, 253–263. [Google Scholar] [CrossRef]
  13. McKenna, S.A.; Hart, D.B.; Yarrington, L. Impact of sensor detection limits on protecting water distribution systems from contamination events. J. Water Resour. Plan. Manag. 2006, 132, 305–309. [Google Scholar] [CrossRef]
  14. Dorini, G.; Jonkergouw, P.; Kapelan, Z.; Di Pierro, F.; Khu, S.T.; Savic, D. An efficient algorithm for sensor placement in water distribution systems. In Proceedings of the Eighth Annual Water Distribution Systems Analysis Symposium, Cincinnati, OH, USA, 27–30 August 2006; pp. 1–13. [Google Scholar]
  15. Huang, J.; McBean, E.A.; James, W. Multiobjective optimization for monitoring sensor placement in water distribution systems. In Proceedings of the 8th Annual Symposium on Water Distribution Systems Analysis, Cincinnati, OH, USA, 27–30 August 2006. [Google Scholar]
  16. Propato, M.; Piller, O. Battle of the water sensor networks. In Proceedings of the Annual Symposium on Water Distribution Systems Analysis, Cincinnati, OH, USA, 27–30 August 2006. [Google Scholar]
  17. Wu, Z.Y.; Walski, T. Multiobjective optimization of sensor placement in water distribution systems. In Proceedings of the 8th Annual Water Distribution Systems Analysis Symposium, Cincinnati, OH, USA, 27–30 August 2006. [Google Scholar]
  18. Hart, W.E.; Murray, R. Review of sensor placement strategies for contamination warning systems in drinking water distribution systems. J. Water Resour. Plan. Manag. 2010, 136, 611–619. [Google Scholar] [CrossRef]
  19. Rathi, S.; Gupta, R.; Ormsbee, L. A review of sensor placement objective metrics for contamination detection in water distribution networks. Water Supply 2015, 15, 898–917. [Google Scholar] [CrossRef]
  20. Ostfeld, A.; Uber, J.G.; Salomons, E.; Berry, J.W.; Hart, W.E.; Phillips, C.A.; Watson, J.-P.; Dorini, G.; Jonkergouw, P.; Kapelan, Z.; et al. The battle of the water sensor networks (BWSN): A design challenge for engineers and algorithms. J. Water Resour. Plan. Manag. 2008, 134, 556–568. [Google Scholar] [CrossRef]
  21. Xu, X.; Lu, Y.; Huang, S.; Xiao, Y.; Wang, W. Incremental sensor placement optimization on water network. In Proceedings of the Joint European Conference on Machine Learning and Knowledge Discovery in Databases, Berlin, Germany, 23–27 September 2013; pp. 467–482. [Google Scholar]
  22. Krause, A.; Leskovec, J.; Guestrin, C.; VanBriesen, J.; Faloutsos, C. Efficient sensor placement optimization for securing large water distribution networks. J. Water Resour. Plan. Manag. 2008, 134, 516–526. [Google Scholar] [CrossRef]
  23. Sankary, N.; Ostfeld, A. Inline mobile sensors for contaminant early warning enhancement in water distribution systems. J. Water Resour. Plan. Manag. 2016, 143, 04016073. [Google Scholar] [CrossRef]
  24. Rathi, S.; Gupta, R.; Kamble, S.; Sargaonkar, A. Risk-based analysis for contamination event selection and optimal sensor placement for intermittent water distribution network security. Water Resour. Manag. 2016, 30, 2671–2685. [Google Scholar] [CrossRef]
  25. Zheng, F.; Du, J.; Diao, K.; Zhang, T.; Yu, T.; Shao, Y. Investigating effectiveness of sensor placement strategies in contamination detection within water distribution systems. J. Water Resour. Plan. Manag. 2018, 144, 06018003. [Google Scholar] [CrossRef]
  26. Deuerlein, J.W. Decomposition model of a general water supply network graph. J. Hydraul. Eng. 2008, 134, 822–832. [Google Scholar] [CrossRef]
  27. Zheng, F.; Simpson, A.R.; Zecchin, A.C.; Deuerlein, J.W. A graph decomposition-based approach for water distribution network optimization. Water Resour. Res. 2013, 49, 2093–2109. [Google Scholar] [CrossRef] [Green Version]
  28. Perelman, L.; Ostfeld, A. Topological clustering for water distribution systems analysis. Environ. Model. Softw. 2011, 26, 969–972. [Google Scholar] [CrossRef]
  29. Perelman, L.S.; Allen, M.; Preisc, A.; Iqbal, M.; Whittle, A.J. Multi-level automated sub-zoning of water distribution systems. In Proceedings of the 7th International Congress on Environmental Modelling and Software, San Diego, CA, USA, 18 June 2014. [Google Scholar]
  30. Galdiero, E.; De Paola, F.; Fontana, N.; Giugni, M.; Savic, D. Decision support system for the optimal design of district metered areas. J. Hydroinf. 2016, 18, 49–61. [Google Scholar] [CrossRef]
  31. Hajebi, S.; Roshani, E.; Cardozo, N.; Barrett, S.; Clarke, A.; Clarke, S. Water distribution network sectorisation using graph theory and many-objective optimisation. J. Hydroinf. 2016, 18, 77–95. [Google Scholar] [CrossRef]
  32. Herrera, M.; Abraham, E.; Stoianov, I.; Fernandez, M.H. A graph-theoretic framework for assessing the resilience of sectorised water distribution networks. Water Resour. Manag. 2016, 30, 1685–1699. [Google Scholar] [CrossRef]
  33. Di Nardo, A.; Di Natale, M.; Giudicianni, C.; Greco, R.; Santonastaso, G.F. Weighted spectral clustering for water distribution network partitioning. Stud. Comput. Intell. Complex Netw. Their Appl. V 2016, 693, 797–807. [Google Scholar] [CrossRef] [PubMed]
  34. Di Nardo, A.; Di Natale, M.; Giudicianni, C.; Santonastaso, G.F.; Tzatchkov, V.G.; Varela, J.M.R.; Yamanaka, V.H.A. Economic and Energy Criteria for District Meter Areas Design of Water Distribution Networks. Water 2017, 9, 463. [Google Scholar] [CrossRef]
  35. Herrera, M.; Izquierdo, J.; Pérez-García, R.; Montalvo, I. Multi-agent adaptive boosting on semi-supervised water supply clusters. Adv. Eng. Softw. 2012, 50, 131–136. [Google Scholar] [CrossRef]
  36. Campbell, E.; Izquierdo, J.; Montalvo, I.; Ilaya-Ayza, A.; Pérez-García, R.; Tavera, M. A flexible methodology to sectorize water supply networks based on social network theory concepts and multiobjective optimization. J. Hydroinf. 2015, 18, 62–76. [Google Scholar] [CrossRef]
  37. Girvan, M.; Newman, M.E.J. Community structure in social and biological networks. Proc. Natl. Acad. Sci. USA 2002, 99, 7821–7826. [Google Scholar] [CrossRef] [PubMed] [Green Version]
  38. Ciaponi, C.; Murari, E.; Todeschini, S. Modularity-based procedure for partitioning water distribution systems into independent districts. Water Resour. Manag. 2016, 30, 2021–2036. [Google Scholar] [CrossRef]
  39. Zhang, Q.; Wu, Z.Y.; Zhao, M.; Qi, J.; Huang, Y.; Zhao, H. Automatic Partitioning of Water Distribution Networks Using Multiscale Community Detection and Multiobjective Optimization. J. Water Resour. Plan. Manag. 2017, 143, 4017057. [Google Scholar] [CrossRef]
  40. Ciaponi, C.; Creaco, E.; Di Nardo, A.; Di Natale, M.; Giudicianni, C.; Musmarra, D.; Santonastaso, G.F. Optimal Sensor Placement in a Partitioned Water Distribution Network for the Water Protection from Contamination. Proceedings 2018, 2, 670. [Google Scholar] [CrossRef]
  41. Perelman, L.S.; Allen, M.; Preis, A.; Iqbal, M.; Whittle, A.J. Automated sub-zoning of water distribution systems. Environ. Model. Softw. 2015, 65, 1–14. [Google Scholar] [CrossRef] [Green Version]
  42. Shi, J.; Malik, J. Normalized Cuts and Image Segmentation. IEEE Trans. Pattern Anal. Mach. Intell. 2000, 22, 888–905. [Google Scholar]
  43. Di Nardo, A.; Di Natale, M.; Giudicianni, C.; Greco, R.; Santonastaso, G.F. Water Distribution Network Clustering: Graph Partitioning or Spectral Algorithms? Stud. Comput. Intell. Complex Netw. Their Appl. VI 2018, 689, 1197–1209. [Google Scholar]
  44. Di Nardo, A.; Giudicianni, C.; Greco, R.; Herrera, M.; Santonastaso, G.F. Applications of Graph Spectral Techniques to Water Distribution Network Management. Water 2018, 10, 45. [Google Scholar] [CrossRef]
  45. Giudicianni, C.; Di Nardo, A.; Di Natale, M.; Greco, R.; Santonastaso, G.F.; Scala, A. Topological taxonomy of water distribution networks. Water 2018, 10, 444. [Google Scholar] [CrossRef]
  46. Deb, K.; Agrawal, S.; Pratapm, A.; Meyarivan, T. A fast and elitist multi-objective genetic algorithm: NSGA-II. IEEE Trans. Evol. Comput. 2002, 6, 182–197. [Google Scholar] [CrossRef]
  47. Tucciarelli, T.; Criminisi, A.; Termini, D. Leak Analysis in Pipeline System by Means of Optimal Value Regulation. J. Hydraul. Eng. 1999, 125, 277–285. [Google Scholar] [CrossRef]
  48. Creaco, E.; Franchini, M.; Todini, E. Generalized resilience and failure indices for use with pressure driven modeling and leakage. J. Water Resour. Plan. Manag. 2016, 142, 4016019. [Google Scholar] [CrossRef]
  49. Tanyimboh, T.T.; Templeman, A.B. Seamless pressure-deficient water distribution system model. J. Water Manag. 2010, 163, 389–396. [Google Scholar] [CrossRef] [Green Version]
  50. Ciaponi, C.; Franchioli, L.; Murari, E.; Papiri, S. Procedure for Defining a Pressure-Outflow Relationship Regarding Indoor Demands in Pressure-Driven Analysis of Water Distribution Networks. Water Resour. Manag. 2014, 29, 817–832. [Google Scholar] [CrossRef]
  51. Tinelli, S.; Creaco, E.; Ciaponi, C. Sampling significant contamination events for optimal sensor placement in water distribution systems. J. Water Resour. Plan. Manag. 2017, 143, 4017058. [Google Scholar] [CrossRef]
  52. Rossman, L.A. EPANET2 Users Manual; United States Environmental Protection Agency: Washington, DC, USA, 2000.
  53. Freeman, L.C. A set of measures of centrality based on betweenness. Sociometry 1977, 40, 35–41. [Google Scholar] [CrossRef]
  54. Di Nardo, A.; Di Natale, M.; Giudicianni, C.; Savic, D. Simplified Approach to Water Distribution System Management via Identification of a Primary Network. J. Water Resour. Plan. Manag. 2017, 144, 1–9. [Google Scholar] [CrossRef]
  55. Preis, A.; Ostfeld, A. Multiobjective contaminant sensor network design for water distribution systems. J. Water Resour. Plan. Manag. 2008, 134, 366–377. [Google Scholar] [CrossRef]
  56. Tinelli, S.; Creaco, E.; Ciaponi, C. Impact of objective function selection on optimal placement of sensors in water distribution networks. Ital. J. Eng. Geol. Environ. 2018, 173–178. [Google Scholar] [CrossRef]
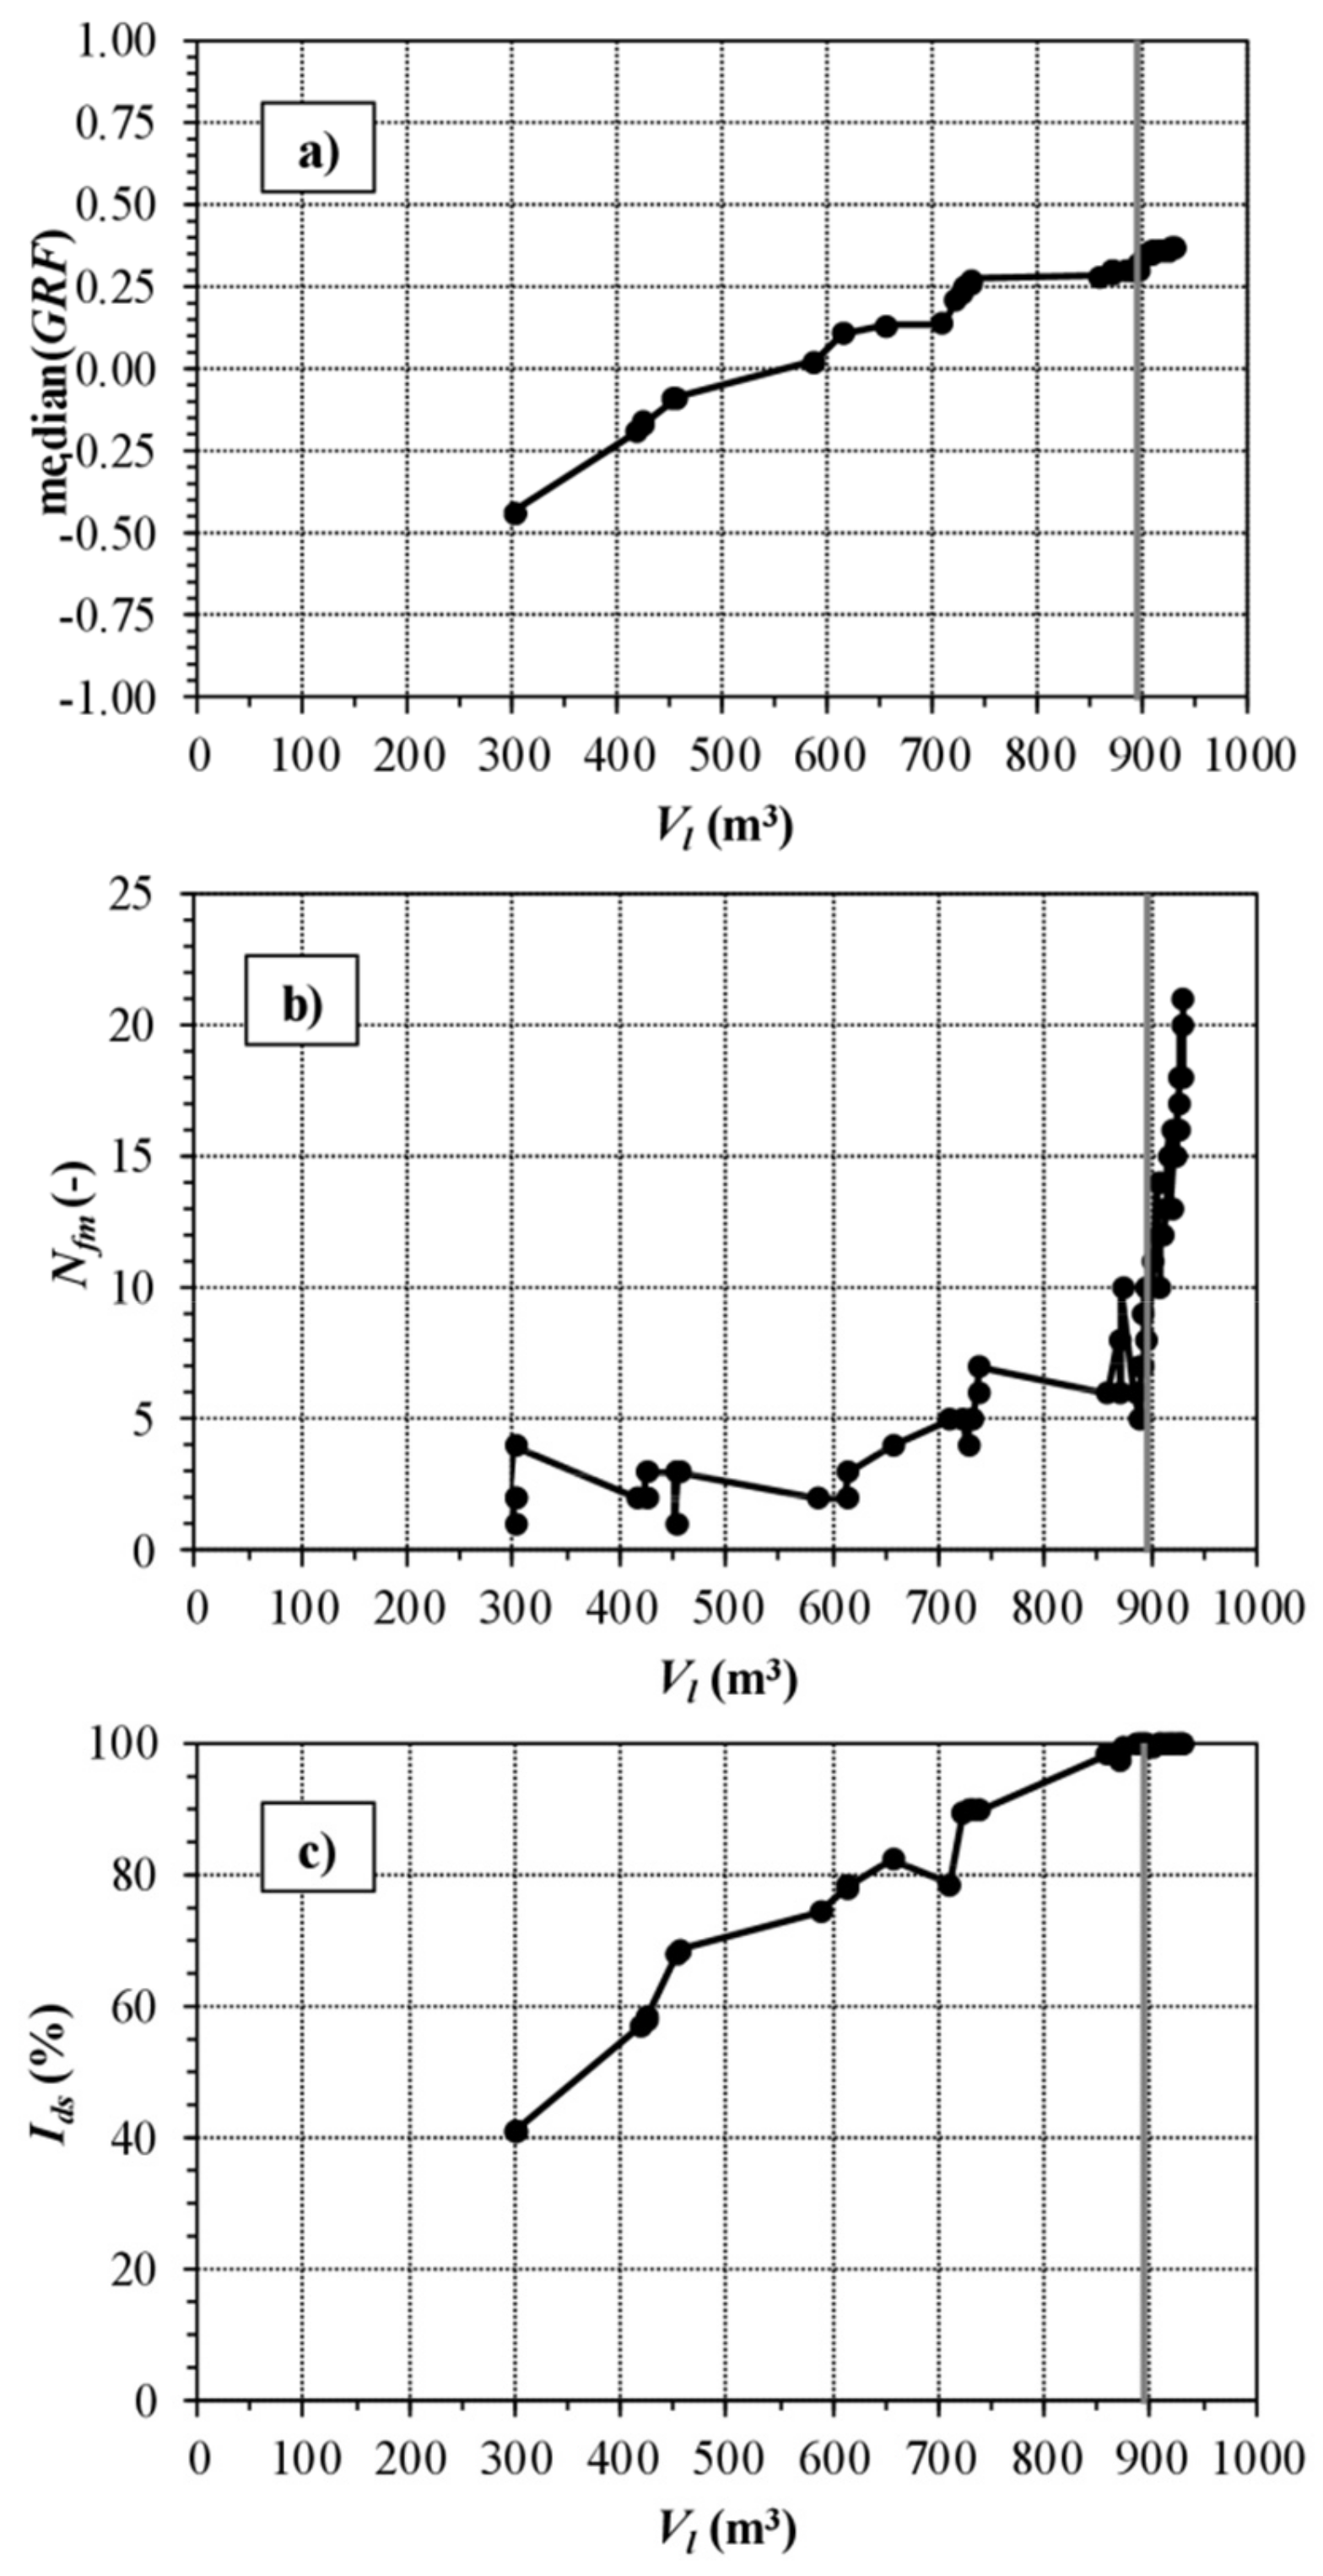
Figure 1. Dividing phase considering the clustered graph of the Parete WDN (Variant 1). Pareto front of optimal solutions in the trade-off between daily median (GRF) index and leakage volume Vl (a), re-evaluated solutions in terms of number of flow meters Nfm (b), and of demand satisfaction rate Ids (c). In all graphs, the selected solution is highlighted with a grey vertical line.
Water 11 01315 g001
Figure 2. WDN partitioning into 5 DMAs.
Water 11 01315 g002
Figure 3. For the original un-partitioned WDN (Var0Opt1), reported as benchmark, and for the partitioned WDN (Var1Opt1, Var1Opt2, Var1Opt3 and Var1Opt4), Pareto front of optimal sensor placement solutions in the trade-off between Nsens and contaminated population pop (a), re-evaluated solutions in terms of Nsens and detection likelihood Ps (b), Nsens and detection time Tmean (c), and Nsens and redundancy Red (d).
Water 11 01315 g003
Figure 4. Optimal location of 6 sensors in (a) original un-partitioned WDN (Var0Opt1), (b) partitioned WDN (Var1Opt1), and (c) partitioned WDN (Var1Opt4).
Water 11 01315 g004
Table 1. Framework of optimizations for sensor placement in the Parete WDN.
OptionVariant 0
(Un-Partitioned)
Variant 1
(Partitioned)
1 (all nodes)Var0Opt1Var1Opt1
2 (only boundary nodes)-Var1Opt2
3 (only central nodes)-Var1Opt3
4 (boundary nodes + central nodes)-Var1Opt4
Table 2. Simulation results in terms of exposed population from the four optimizations for sensor placement in the Parete WDN, considering Nsens up to 6.
NsensVar0Opt1Var1Opt1Var1Opt2Var1Opt3Var1Opt4
028062458245824582458
114381274127412741274
2982919953974953
3789648741679653
4667559638598569
5589500572561515
6514462564548472