Validation of GPM Precipitation Products by Comparison with Ground-Based Parsivel Disdrometers over Jianghuai Region


Abstract
1. Introduction
2. Data and Methods
2.1. Observational Sites and Datasets
2.1.1. In Situ Parsivel2 Disdrometers
2.1.2. GPM DPR Level-2 Products
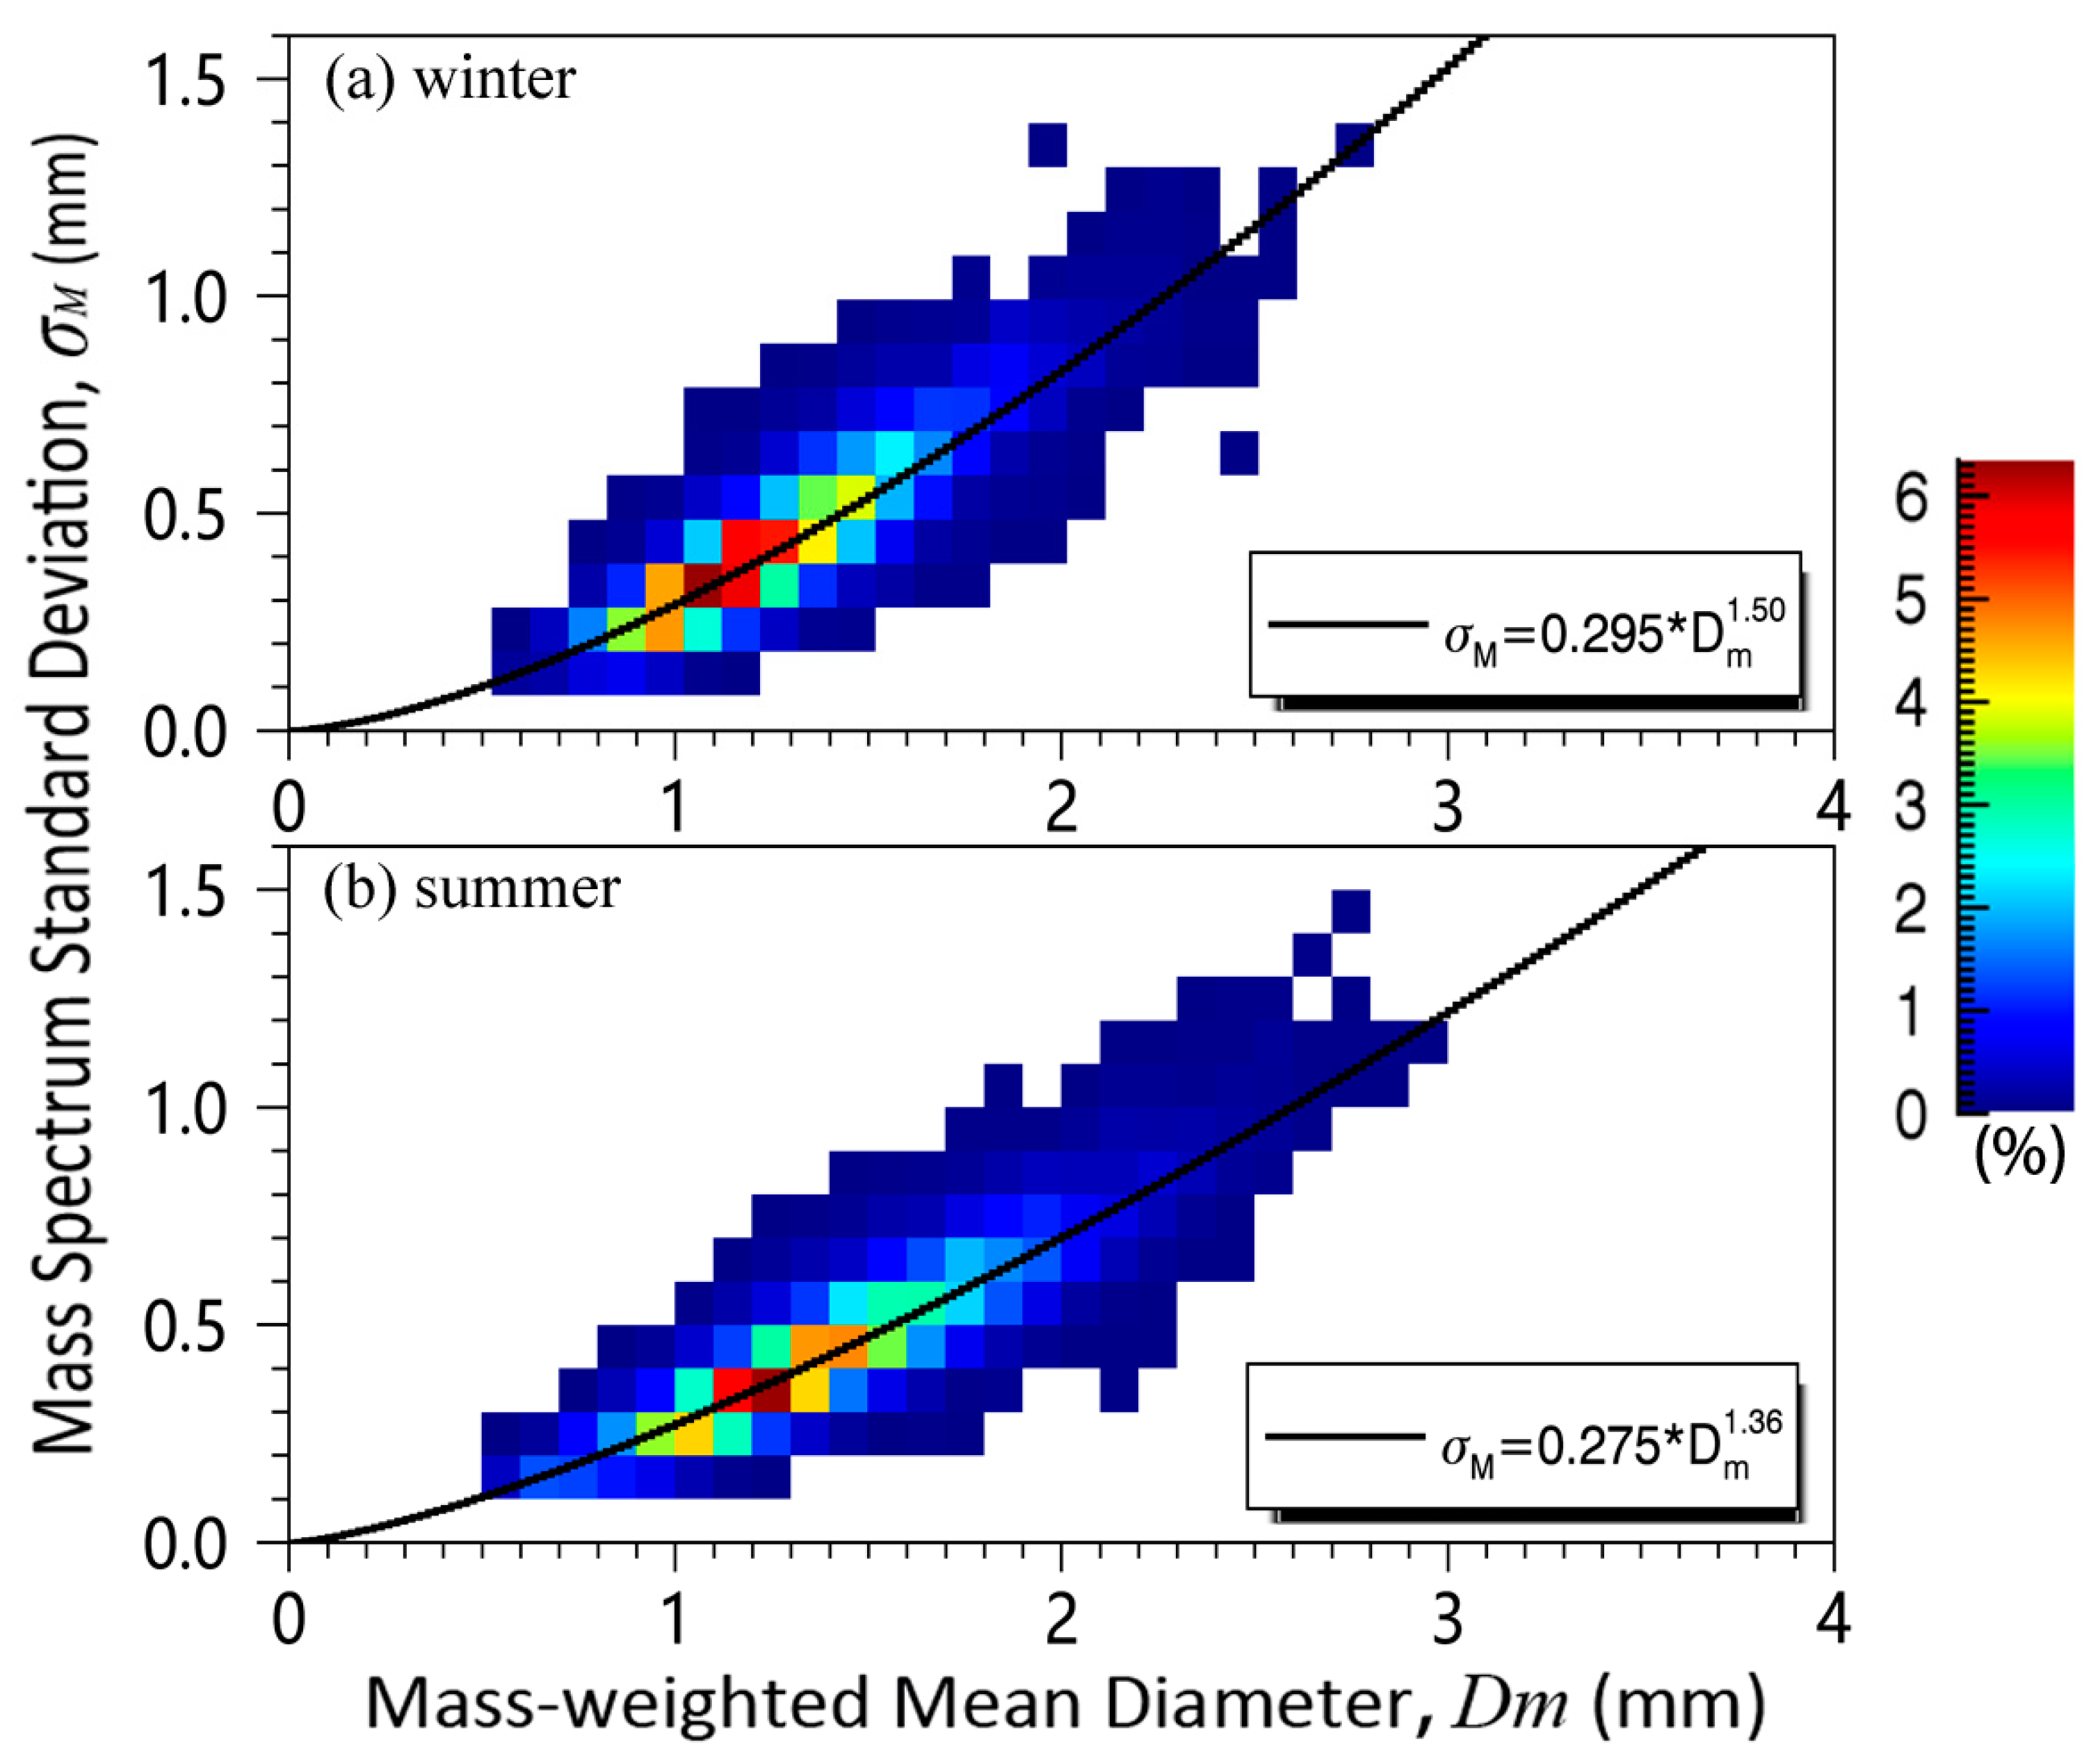
2.2. Raindrop Size Distribution
2.3. Calculated GPM DPR Variables
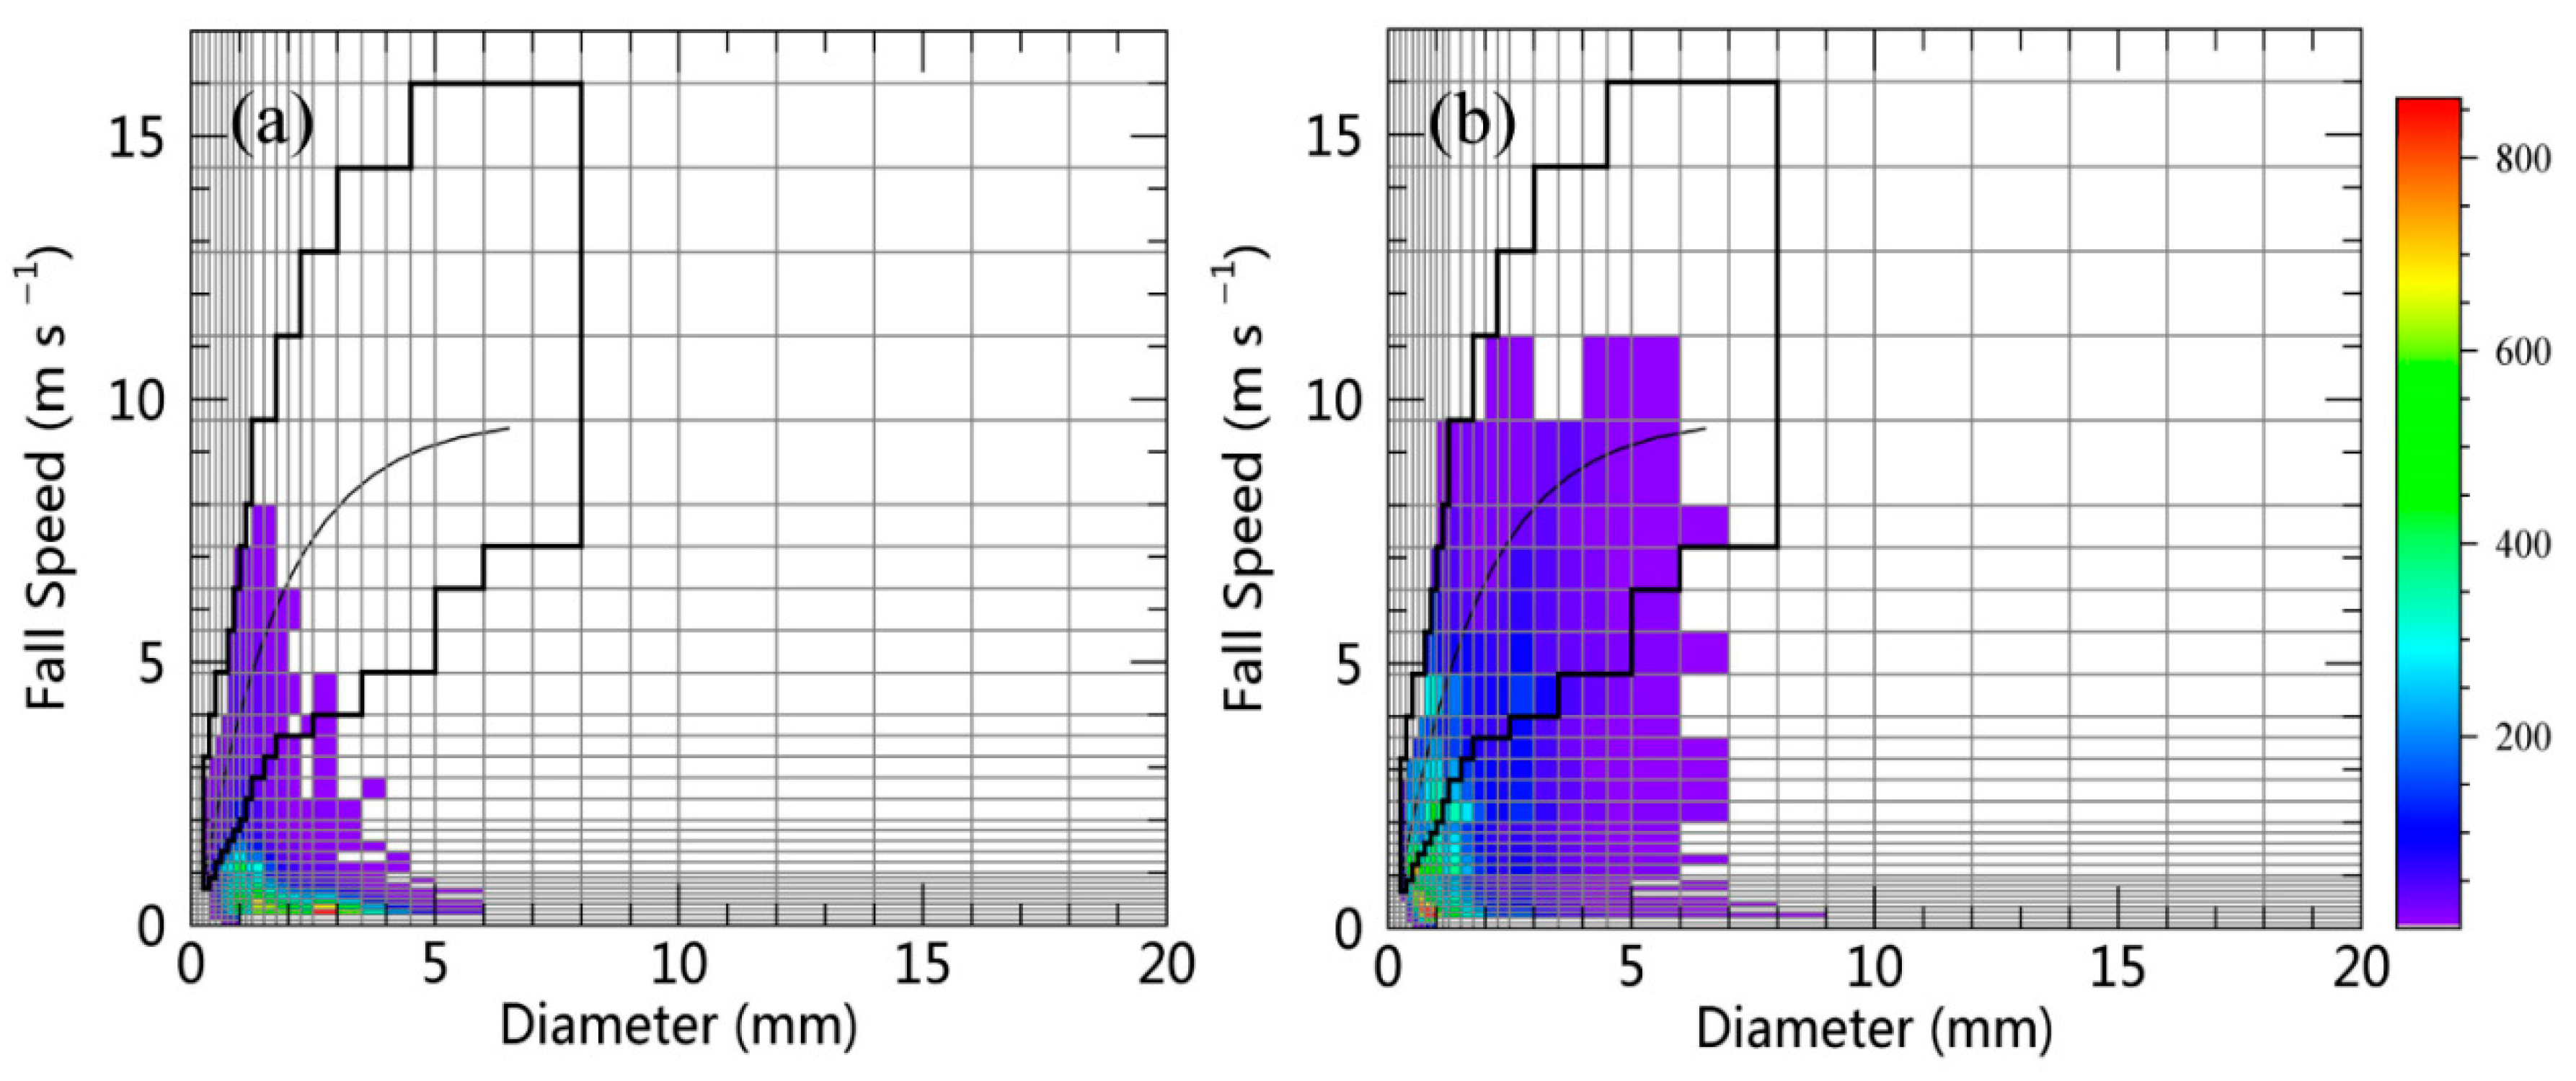
2.4. GPM–Parsivel Comparison
3. Validation of GPM Precipitation Products
4. Improvement of GPM Retrieval Algorithms
4.1. Under Different Rain Rates
4.2. Under Different Rain Categories
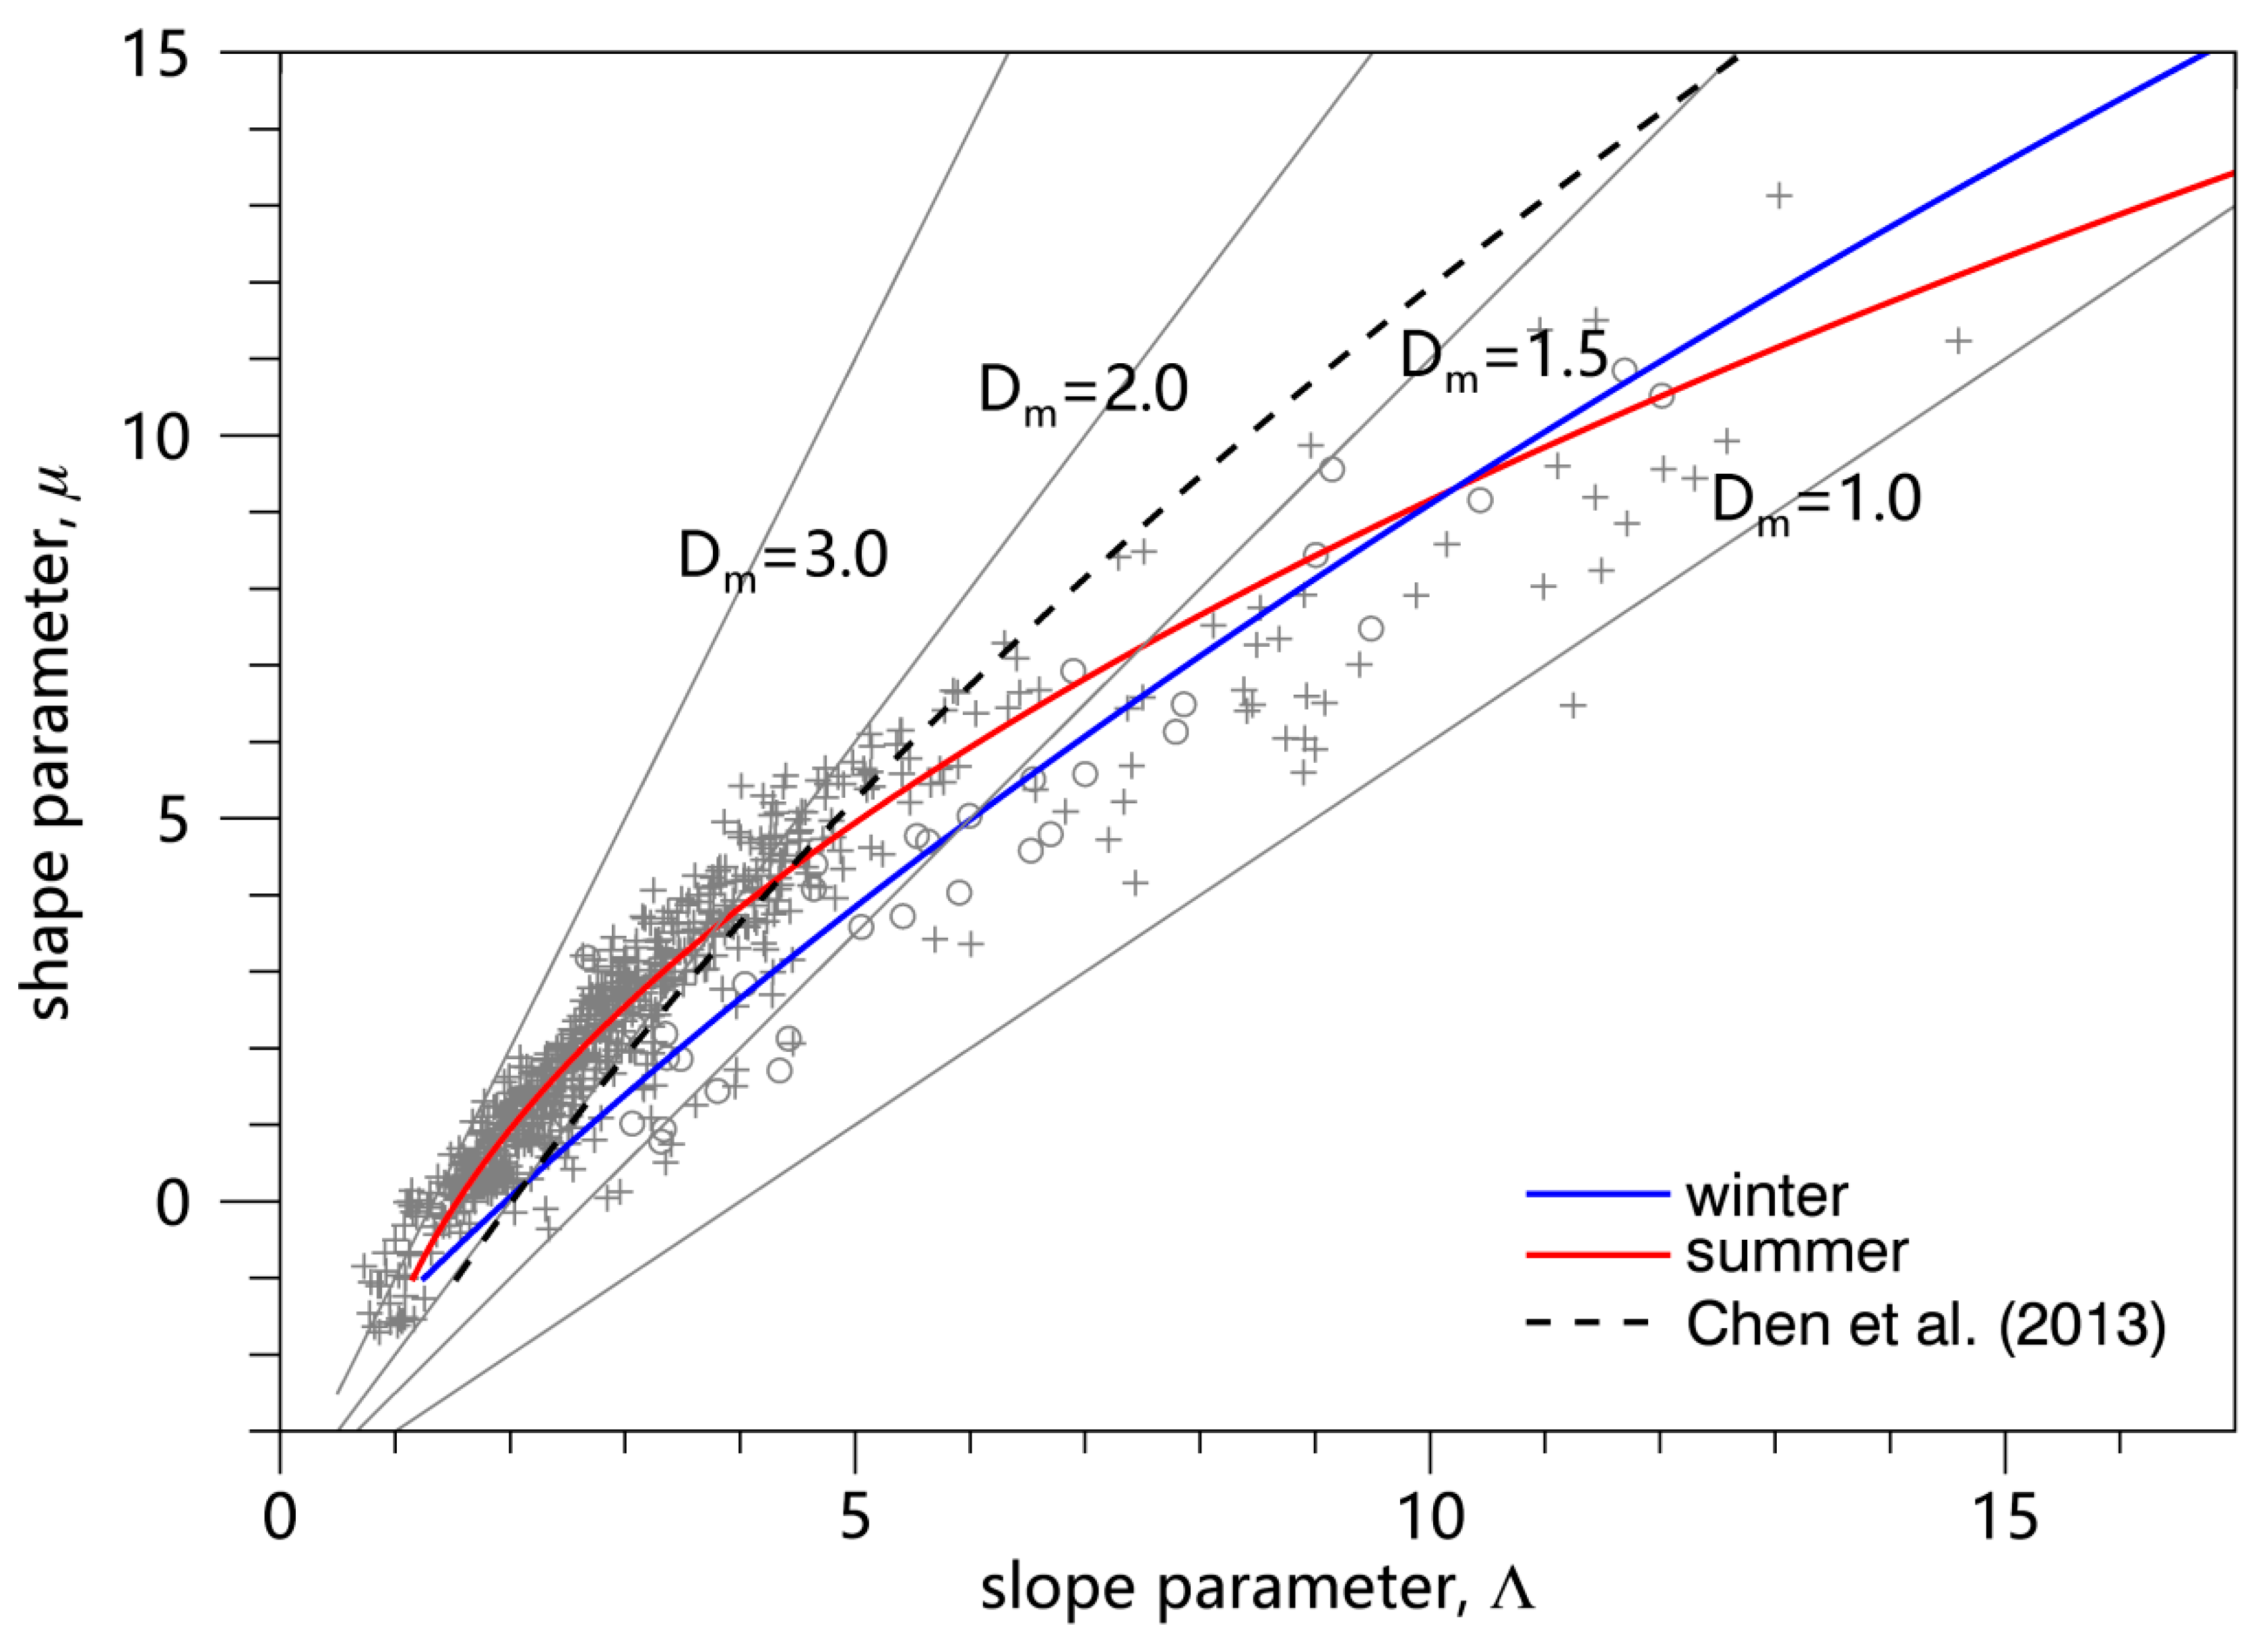
4.3. Possible Application of the µ–Λ Relationship
5. Summary and Conclusions
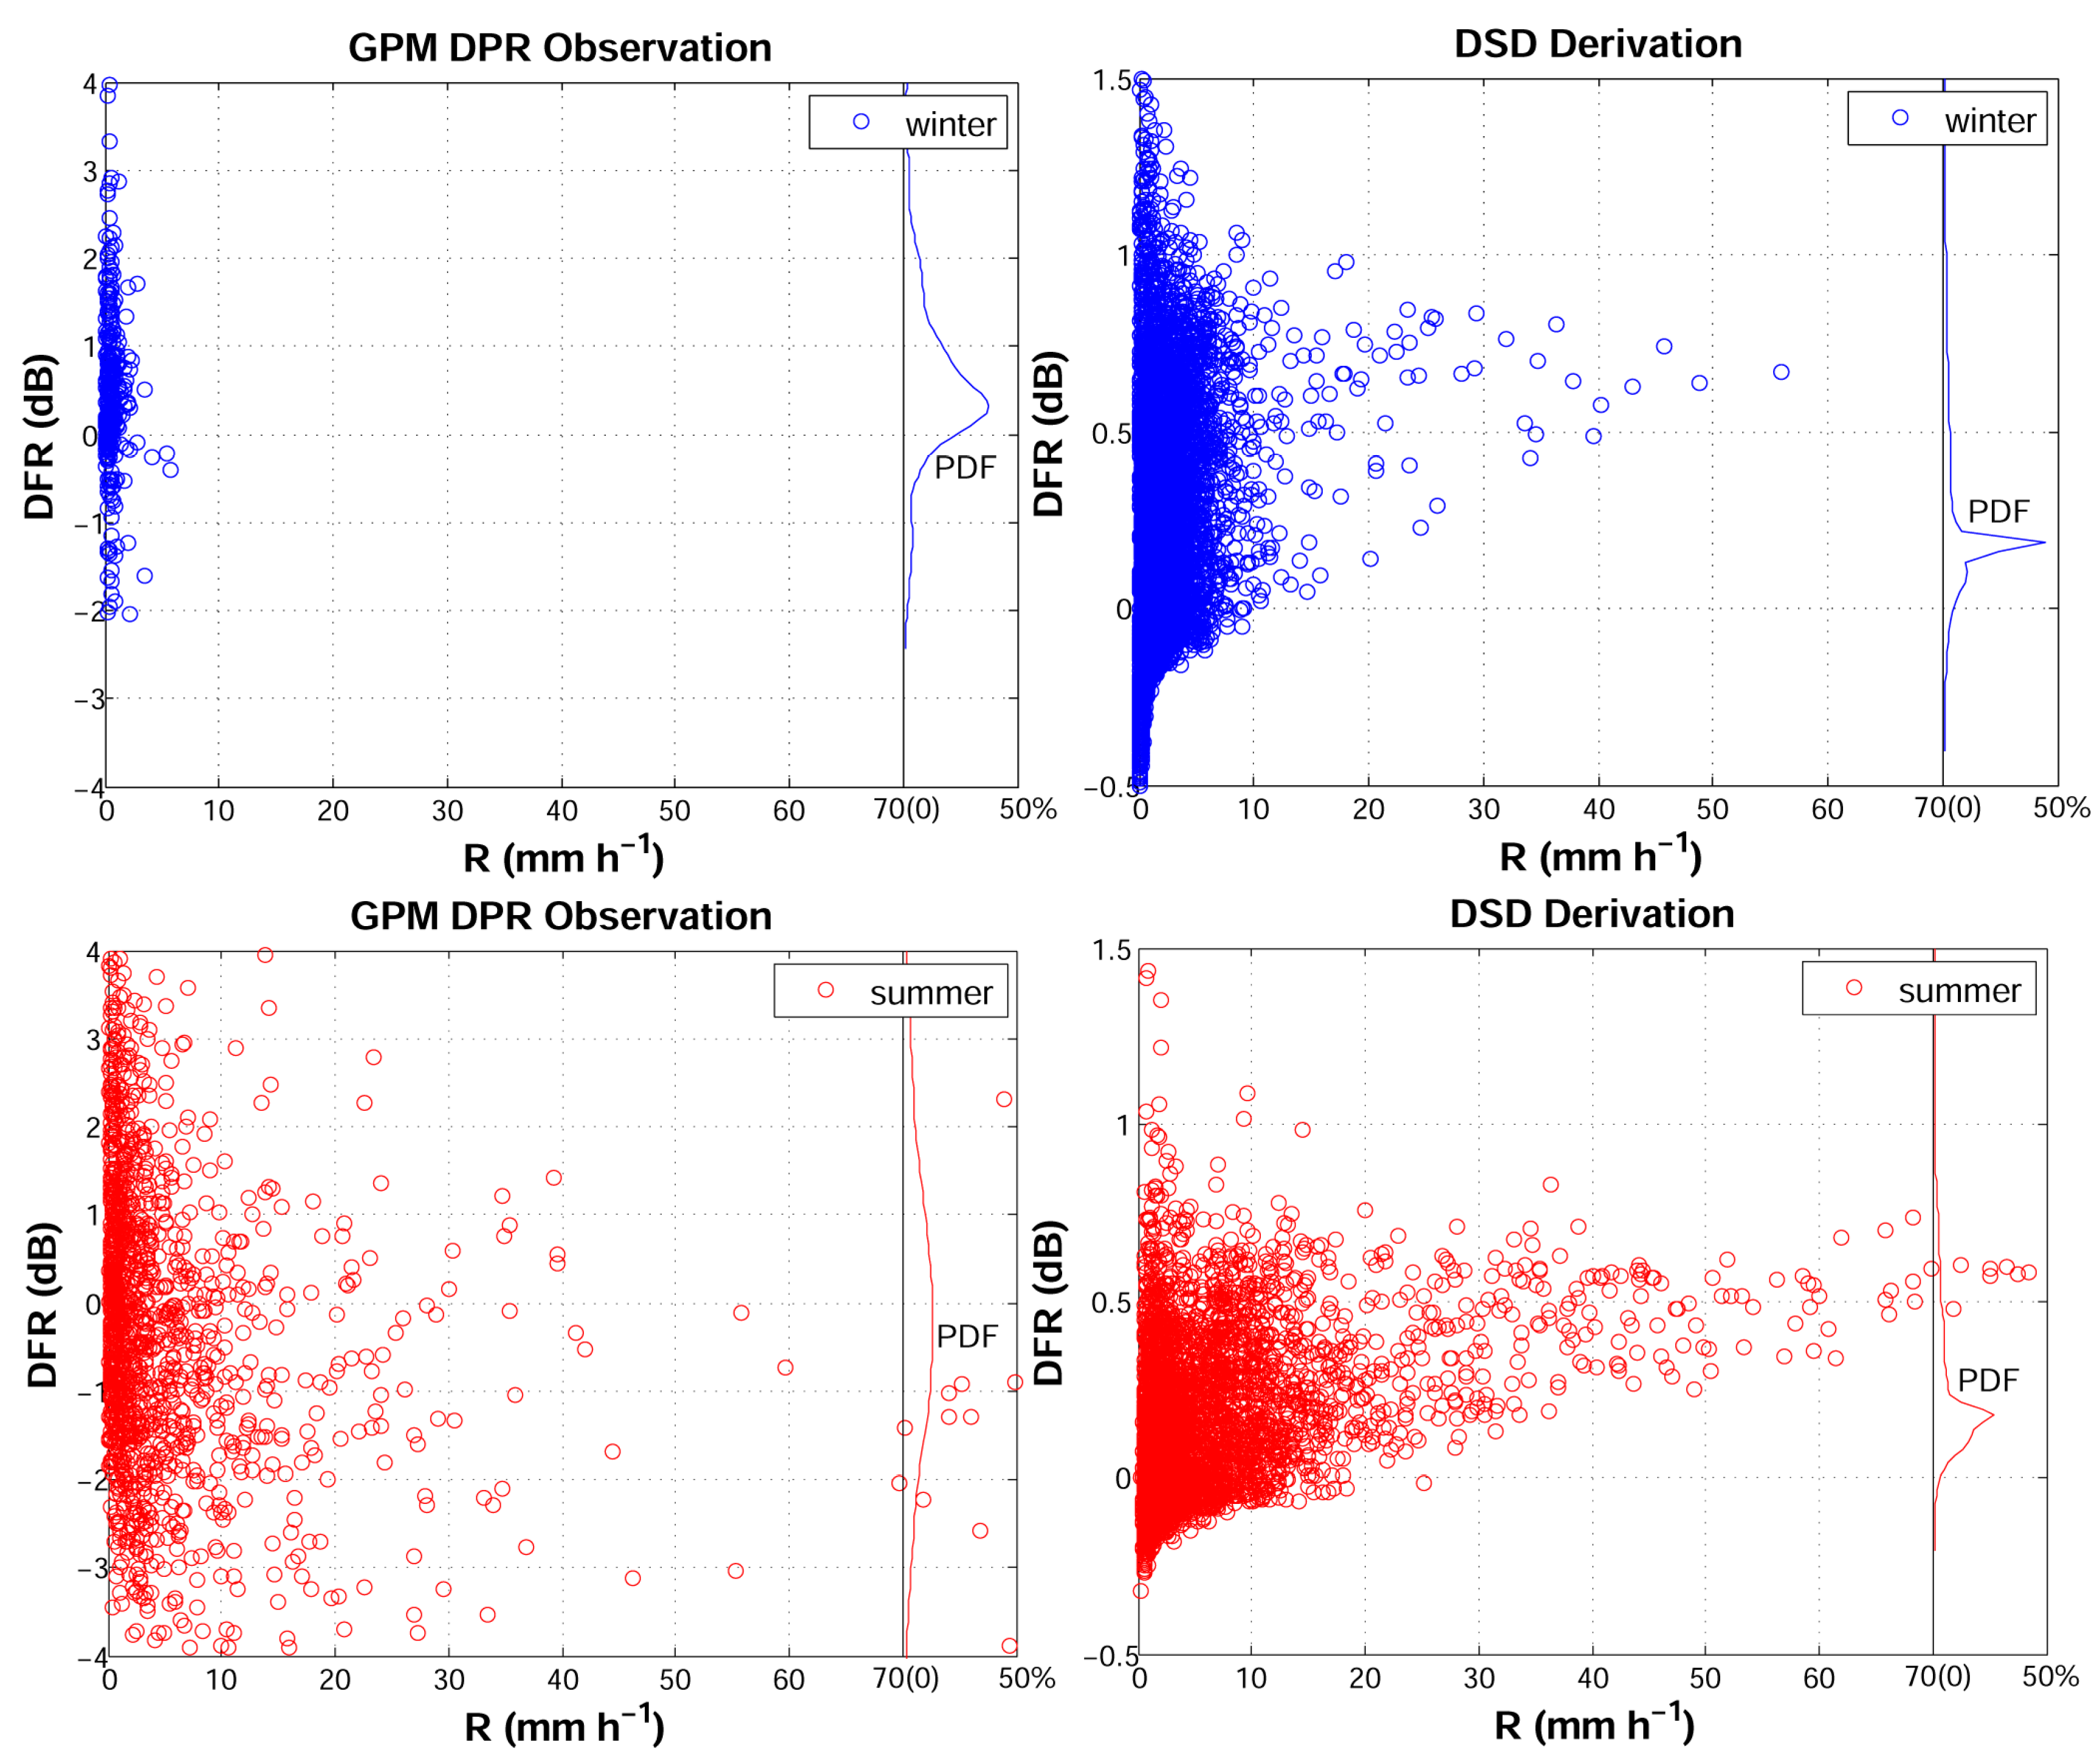
- GPM underestimates the DFR more in summer than winter, which indicates that GPM might have better performance in the winter than summer season over Jianghuai region with biases of 40% (80%) in winter (summer). Such a discrepancy could be due to the broader spectral width of the precipitation during summer than that of winter in this specific area.
- The shape parameters µ under different rain rates as well as rain categories are obtained from 5-year Parsivel observations over Jianghuai region. The retrieval errors of rain category-based µ (3–5%) are proved to be smaller than that of rain rate-based µ (11–13%) or a constant µ (20–22%) in rain-retrieval algorithms, with a possible application to rainfall estimations over Jianghuai region.
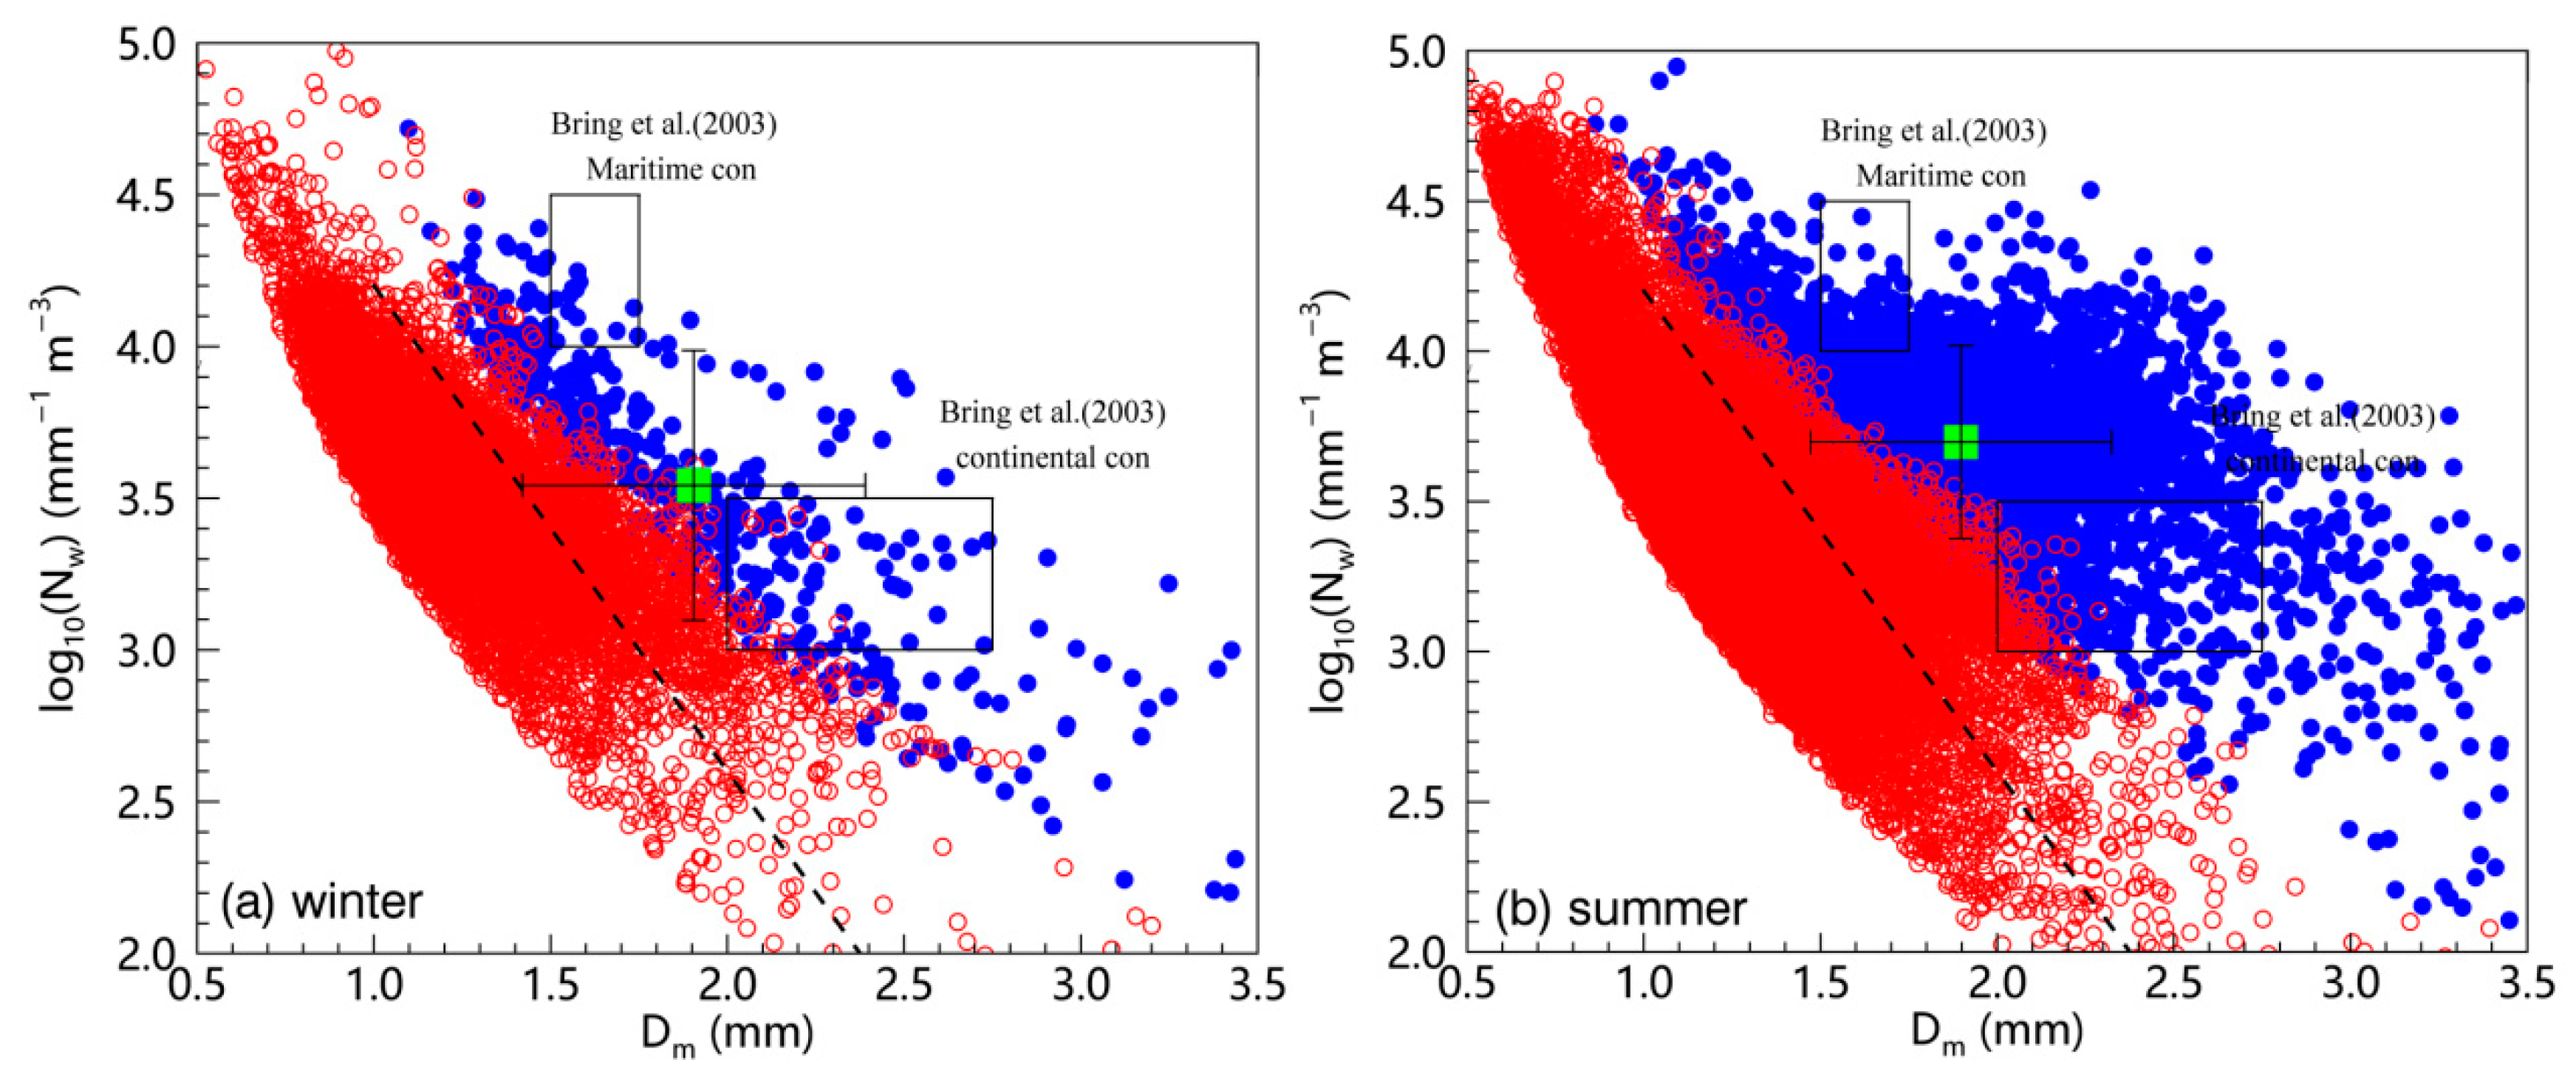
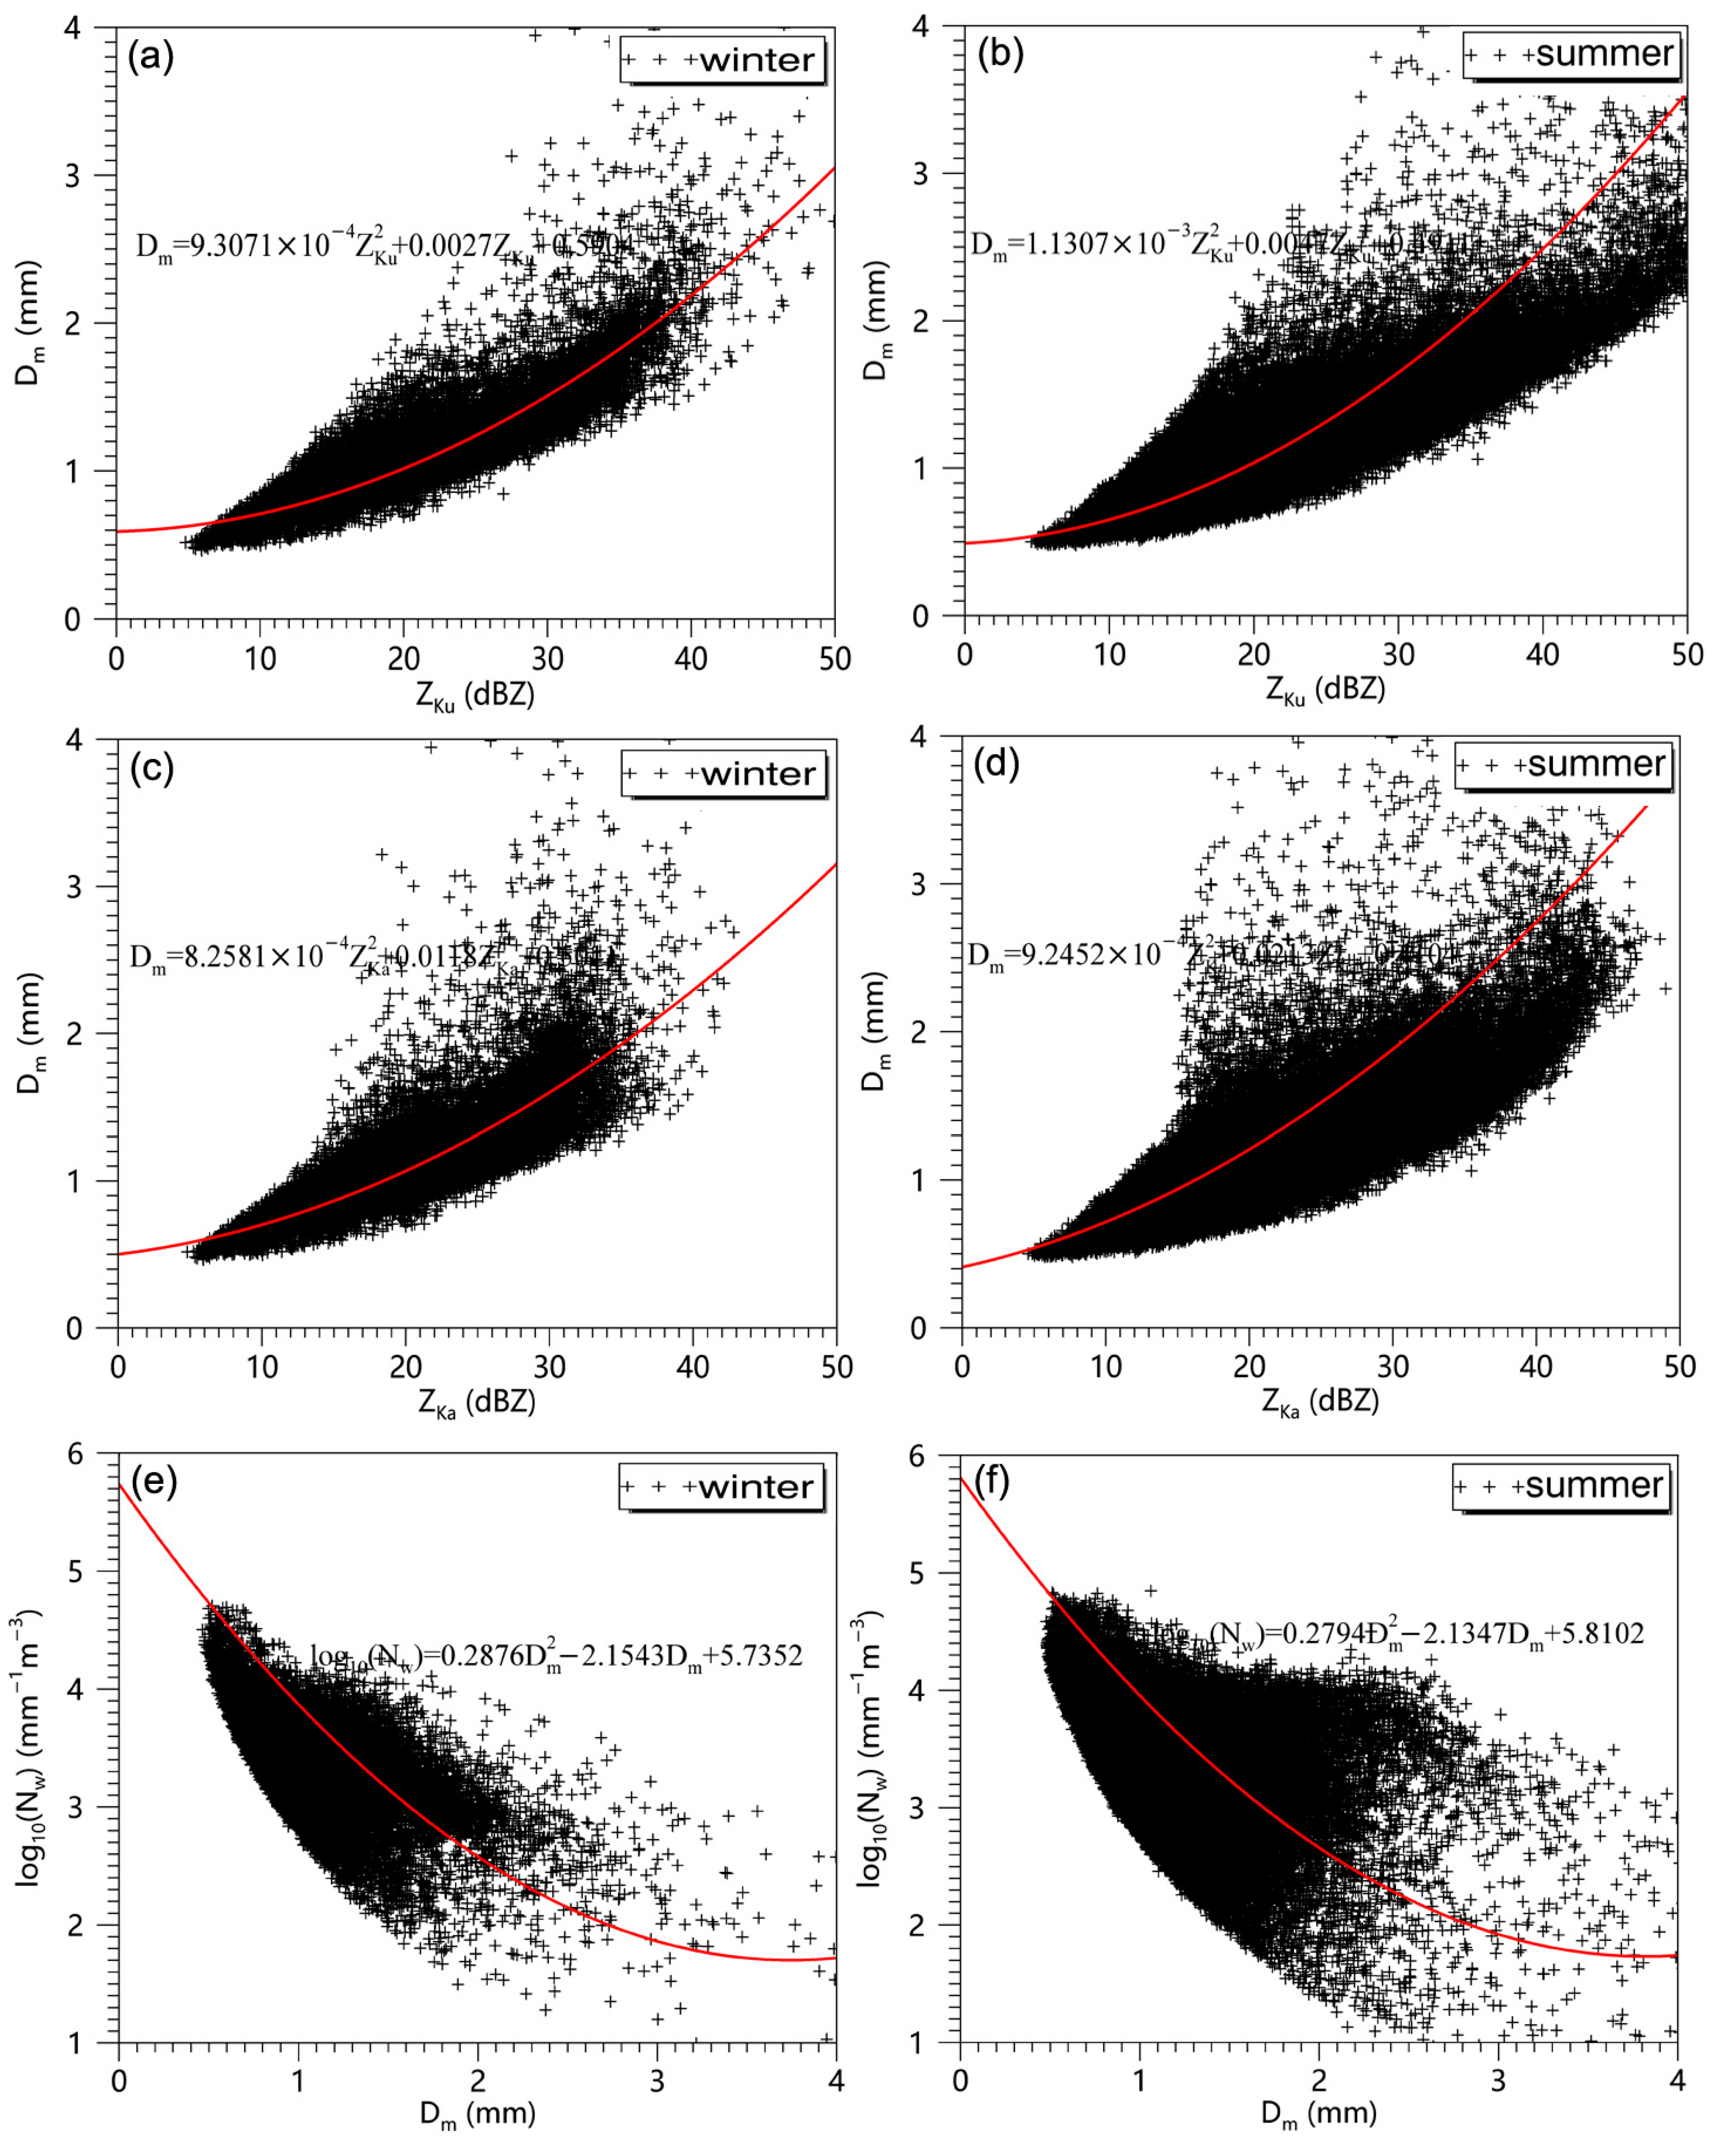
- The effective radar reflectivity factor Ze is calculated using Parsivel disdrometer data. Empirical Dm–Ze and Nw–Dm relationships are further derived to improve the GPM rainfall estimates over Jianghuai region.
Author Contributions
Funding
Conflicts of Interest
References
- Ning, S.; Wang, J.; Jin, J.; Ishidaira, H. Assessment of the Latest GPM-Era High-Resolution Satellite Precipitation Products by Comparison with Observation Gauge Data over the Chinese Mainland. Water 2016, 8, 481. [Google Scholar] [CrossRef]
- Ma, Z.; Tan, X.; Yang, Y.; Chen, X.; Kan, G.; Ji, X.; Lu, H.; Long, J.; Cui, Y.; Hong, Y. The First Comparisons of IMERG and the Downscaled Results Based on IMERG in Hydrological Utility over the Ganjiang River Basin. Water 2018, 10, 1392. [Google Scholar] [CrossRef]
- Tao, S.; Chen, L. A review of recent research on the East Asian summer monsoon in China. In Monsoon Meteorology; Chang, C.-P., Krishnamurti, T.N., Eds.; Oxford University Press: London, UK, 1987; pp. 60–92. [Google Scholar]
- Ding, Y.H.; Chan, J.C.L. The East Asian summer monsoon: an overview. Meteor. Atmos. Phys. 2005, 89, 117–142. [Google Scholar]
- Ha, K.J.; Heo, K.Y.; Lee, S.S.; Yun, K.S.; Jhun, J.G. Variability in the East Asian Monsoon: A review. Meteorol. App. 2012, 19, 200–215. [Google Scholar] [CrossRef]
- Ninomiya, K.; Shibagaki, Y. Cloud system families in the Meiyu-Baiu front observed during 1–10 July 1991. J. Meteor. Soc. Japan 2003, 81, 193–209. [Google Scholar] [CrossRef][Green Version]
- Kato, T.; Aranami, K. Formation factors of 2004 Niigata-Fukushima and Fukui heavy rainfalls and problems in the predictions using a cloud-resolving model. SOLA 2005, 1, 1–4. [Google Scholar] [CrossRef]
- Kato, T. Structure of the band-shaped precipitation system inducing the heavy rainfall observed over northern Kyushu, Japan on 29 June 1999. J. Meteor. Soc. Japan 2006, 84, 129–153. [Google Scholar] [CrossRef]
- Li, Q.; Wei, F.; Li, D. Interdecadal variation of East Asian summer monsoon and drought/flood distribution over eastern China in the last 159 years. J. Geogr. Sci. 2011, 21, 579–593. [Google Scholar] [CrossRef]
- Shan, X.; Jiang, N.; Qian, W. Regional heavy rain locations associated with anomalous convergence lines in eastern China. Nat. Hazards 2015, 77, 1731–1750. [Google Scholar] [CrossRef]
- Tong, K.; Zhao, Y.; Wei, Y.; Hu, B.; Lu, Y. Evaluation and Hydrological Validation of GPM Precipitation Products over the Nanliu River Basin, Beibu Gulf. Water 2018, 10, 1777. [Google Scholar] [CrossRef]
- Hou, A.Y.; Kakar, R.K.; Neeck, S.; Azarbarzin, A.A.; Kummerow, C.D.; Kojima, M.; Oki, R.; Nakamura, K.; Iguchi, T. The Global Precipitation Measurement Mission. Bull. Am. Meteorol. Soc. 2014, 95, 701–722. [Google Scholar] [CrossRef]
- Huffman, G.J.; Bolvin, D.T.; Nelkin, E.J. Integrated Multi-Satellite Retrievals for GPM (IMERG) Technical Documentation. 2015. Available online: https://pmm.nasa.gov/sites/default/fifiles/ document_fifiles/IMERG_doc.pdf (accessed on 22 March 2019).
- Gilewski, P.; Nawalany, M. Inter-Comparison of Rain-Gauge, Radar, and Satellite (IMERG GPM) Precipitation Estimates Performance for Rainfall-Runoff Modeling in a Mountainous Catchment in Poland. Water 2018, 10, 1665. [Google Scholar] [CrossRef]
- Le, M.; Chandrasekar, V. Hydrometeor Profile Characterization Method for Dual-Frequency Precipitation Radar Onboard the GPM. IEEE Trans. Geosci. Remote Sens. 2013, 51, 3648–3658. [Google Scholar] [CrossRef]
- Tokay, A.; Short, D.A. Evidence from tropical raindrop spectra of the origin of rain from stratiform versus convective clouds. J. Appl. Meteorol. 1996, 35, 355–371. [Google Scholar] [CrossRef]
- Kumar, S.B.; Reddy, K.K. Raindrop size distribution characteristics of cyclonic and north east monsoon thunderstorm precipitating clouds observed over Kadapa (14.47°N, 78.82°E), tropical semi-arid region of India. Mausam 2013, 64, 35–48. [Google Scholar]
- Kumari, N.P.A.; Kumar, S.B.; Jayalakshmi, J.; Reddy, K.K. Raindrop size distribution variations in JAL and NILAM cyclones induced precipitation observed over Kadapa (14.47°N, 78.82°E), a tropical semi-arid region of India. Indian J. Radio Space Phys. 2014, 43, 57–66. [Google Scholar]
- Seela, B.K.; Janapati, J.; Lin, P.-L.; Reddy, K.K.; Shirooka, R.; Wang, P.K. A comparison study of summer season raindrop size distribution between Palau and Taiwan, two islands in western Pacifific. J. Geophys. Res. Atmos. 2017, 122, 11787–11805. [Google Scholar] [CrossRef]
- Dolan, B.; Fuchs, B.; Rutledge, S.A.; Barnes, E.A.; Thompson, E.J. Primary modes of global drop-size distributions. J. Atmos. Sci. 2018, 75, 1453–1476. [Google Scholar] [CrossRef]
- Wang, D.; Giangrande, S.E.; Bartholomew, M.J.; Hardin, J.; Feng, Z.; Thalman, R.; Machado, L.A.T. The Green Ocean: Precipitation insights from the GoAmazon2014/5 experiment. Atmos. Chem. Phys. 2018, 18, 9121–9145. [Google Scholar] [CrossRef]
- Wu, Z.; Zhang, Y.; Zhang, L.; Lei, H.; Xie, Y.; Wen, L.; Yang, J. Characteristics of summer season raindrop size distribution in three typical regions of western Pacific. J. Geophys. Res. Atmos. 2019, 124, 4054–4073. [Google Scholar] [CrossRef]
- Giangrande, S.E.; Wang, D.; Bartholomew, M.J.; Jensen, M.P.; Mechem, D.B.; Hardin, J.C.; Wood, R. Midlatitude oceanic cloud and precipitation properties as sampled by the ARM Eastern North Atlantic Observatory. J. Geophys. Res. Atmos. 2019, 124, 4741–4760. [Google Scholar] [CrossRef]
- Hou, A.Y.; Skofronick-Jackson, G.; Kummerow, C.D.; Shepherd, J.M. Global precipitation measurement. In Precipitation: Advances in Measurement, Estimation and Prediction; Michaelides, S., Ed.; Springer: New York, NY, USA, 2008; pp. 131–169. [Google Scholar]
- Liao, L.; Meneghini, R.; Tokay, A. Uncertainties of GPM DPR rain estimates caused by DSD parameterizations. J. Appl. Meteor. Climatol. 2014, 53, 2524–2537. [Google Scholar] [CrossRef]
- Nakamura, K.; Iguchi, T. Dual-wavelength radar algorithm. In Measuring Precipitation from Space; Levizanni, V., Bauer, P., Turk, F.J., Eds.; Springer: New York, NY, USA, 2007; pp. 225–234. [Google Scholar]
- Tokay, A.; Petersen, W.A.; Gatlin, P.; Wingo, M. Comparison of raindrop size distribution measurements by collocated disdrometers. J. Atmos. Oceanic. Technol. 2013, 30, 1672–1690. [Google Scholar] [CrossRef]
- Brandes, E.A.; Zhang, G.; Vivekanandan, J. Experiments in rainfall estimation with a polarimetric radar in a subtropical environment. J. App. Meteorol. 2002, 41, 674–685. [Google Scholar] [CrossRef]
- Kozu, T.; Akramin, Z.; Shimomai, T. Seasonal and diurnal variations of raindrop size distribution in Asian monsoon region. J. Meteor. Soc. Japan 2006, 84, 195–209. [Google Scholar] [CrossRef]
- Sun, Q.; Miao, C.; Duan, Q. Changes in the Spatial Heterogeneity and Annual Distribution of Observed Precipitation across China. J. Clim. 2017, 30, 9399–9416. [Google Scholar] [CrossRef]
- Tokay, A.; Wolff, D.B.; Petersen, W.A. Evaluation of the New Version of the Laser-Optical Disdrometer, OTT Parsivel2. J. Atmos. Oceanic Technol. 2014, 31, 1276–1288. [Google Scholar] [CrossRef]
- Löffler-Mang, M.; Joss, J. An optical distrometer for measuring size and velocity of hydrometeors. J. Atmos. Ocean. Technol. 2000, 17, 130–139. [Google Scholar] [CrossRef]
- Atlas, D.; Srivastava, R.C.; Sekhon, R.S. Doppler radar characteristics of precipitation at vertical incidence. Rev. Geophys. 1973, 11, 1–35. [Google Scholar] [CrossRef]
- Tokay, A.; Bashor, P.G. An experimental study of small-scale variability of raindrop size distribution. J. Appl. Meteorol. Climatol. 2010, 49, 2348–2365. [Google Scholar] [CrossRef]
- Friedrich, K.; Kalina, E.A.; Masters, F.J. Drop-size distributions in thunderstorms measured by optical disdrometers during VORTEX2. Mon. Weather Rev. 2013, 141, 1182–1203. [Google Scholar] [CrossRef]
- Wen, L.; Zhao, K.; Zhang, G.; Xue, M.; Zhou, B.; Liu, S.; Chen, X. Statistical characteristics of raindrop size distributions observed in East China during the Asian summer monsoon season using 2-D video disdrometer and Micro Rain Radar data. J. Geophys. Res. Atmos. 2016, 121, 2265–2282. [Google Scholar] [CrossRef]
- Ulbrich, C.W. Natural variations in the analytical form of the drop size distribution. J. Clim. Appl. Meteor. 1983, 22, 1764–1775. [Google Scholar] [CrossRef]
- Ulbrich, C.W.; Atlas, D. Rainfall microphysics and radar properties: Analysis methods for drop size spectra. J. Appl. Meteorol. 1998, 37, 912–923. [Google Scholar] [CrossRef]
- Testud, J.; Oury, S.; Black, R.A.; Amayenc, P.; Dou, X. The Concept of “Normalized” Distribution to Describe Raindrop Spectra: A Tool for Cloud Physics and Cloud Remote Sensing. J. Appl. Meteor. 2001, 40, 1118–1140. [Google Scholar] [CrossRef]
- Willis, P.T. Functional fits to some observed drop size distributions and parameterization of rain. J. Atmos. Sci. 1984, 41, 1648–1661. [Google Scholar] [CrossRef]
- Sempere Torres, D.; Porrà, J.M.; Creutin, J.D. A general formulation for raindrop size distribution. J. Appl. Meteor. 1994, 33, 1494–1502. [Google Scholar] [CrossRef]
- Sempere Torres, D.; Porrà, J.M.; Creutin, J.D. Experimental evidence of a general description for raindrop size distribution properties. J. Geophys. Res. 1998, 103, 1785–1797. [Google Scholar] [CrossRef]
- Skofronick-Jackson, G.; Petersen, W.A.; Berg, W.; Kidd, C.; Stocker, E.F.; Kirschbaum, D.B.; Kakar, R.; Braun, S.A.; Huffman, G.J.; Iguchi, T.; et al. The Global Precipitation Measurement (GPM) mission for science and society. Bull. Amer. Meteor. Soc. 2017, 98, 1679–1695. [Google Scholar] [CrossRef]
- Kotsuki, S.; Terasaki, K.; Miyoshi, T. GPM/DPR precipitation compared with a 3.5-km-resolution NICAM simulation. Scientific online letters on the atmosphere. SOLA 2014, 10, 204–209. [Google Scholar] [CrossRef]
- Chandrasekar, V.; Le, M. Evaluation of profile classification module of GPM-DPR algorithm after launch. In Proceedings of the IEEE International Geoscience and Remote Sensing Symposium (IGARSS), Milan, Italy, 26–31 July 2015; pp. 5174–5177. [Google Scholar] [CrossRef]
- Zhang, A.; Fu, Y. The structural characteristics of precipitation cases detected by dual-frequency radar of GPM satellite. Chin. J. Atmos. Sci. 2018, 42, 33–51. (In Chinese) [Google Scholar]
- Iguchi, T.; Kozu, T.; Kwiatkowski, J.; Meneghini, R.; Awaka, J.; Okamoto, K. Uncertainties in the Rain Profiling Algorithm for the TRMM Precipitation Radar. J. Meteor. Soc. Japan. 2009, 87, 1–30. [Google Scholar] [CrossRef]
- Bringi, V.N.; Chandrasekar, V.; Hubbert, J.; Gorgucci, E.; Randeu, W.L.; Schoenhuber, M. Raindrop size distribution in different climatic regimes from disdrometer and dual-polarized radar analysis. J. Atmos. Sci. 2003, 60, 354–365. [Google Scholar] [CrossRef]
- Meagher, J.P.; Haddad, Z.S. To what extent can raindrop size be determined by a multiple-frequency radar? J. Appl. Meteor. Climatol. 2006, 45, 529–536. [Google Scholar] [CrossRef]
- Zhang, G.; Vivekanandan, J.; Brandes, E.A.; Meneghini, R.; Kozu, T. The shape-slope relation in observed gamma raindrop size distributions: Statistical error or useful information? J. Atmos. Ocean. Technol. 2003, 20, 1106–1119. [Google Scholar] [CrossRef]
- Chen, B.; Yang, J.; Pu, J. Statistical Characteristics of Raindrop Size Distribution in the Meiyu Season Observed in Eastern China. J. Meteor. Soc. Japan 2013, 91, 215–227. [Google Scholar] [CrossRef]
- Cao, Q.; Zhang, G.; Brandes, E.; Schuur, T.; Ryzhkov, A.; Ikeda, K. Analysis of video disdrometer and polarimetric radar data to characterize rain microphysics in Oklahoma. J. Appl. Meteorol. Climatol. 2008, 47, 2238–2255. [Google Scholar] [CrossRef]
- Vivekanandan, J.; Zhang, G.; Brandes, E. Polarimetric radar estimators based on a constrained gamma drop size distribution model. J. Appl. Meteorol. 2004, 43, 217–230. [Google Scholar] [CrossRef]
- Atlas, D.; Ulbrich, C.W. Drop size spectra and integral remote sensing parameters in the transition from convective to stratiform rain. Geophys. Res. Lett. 2006, 33, L16803. [Google Scholar] [CrossRef]
- Brandes, E.A.; Zhang, G.; Vivekanandan, J. An evaluation of a drop distribution–based polarimetric radar rainfall estimator. J. Appl. Meteorol. 2003, 42, 652–660. [Google Scholar] [CrossRef]


| Seasons | Event No. | Date | Time (LST) | 1-min Samples (min) | Accumulated Precipitation (mm) | Max Rain Rate (mm h−1) |
|---|---|---|---|---|---|---|
| Summer | 1 | 15 Jun 2014 | 04:54–06:15 | 62 | 13.7 | 19.6 |
| 2 | 15 Jun 2014 | 17:57–22:12 | 152 | 15.2 | 18.4 | |
| 3 | 16 Jun 2014 | 07:11–17:01 | 216 | 18.1 | 16.8 | |
| 4 | 25 Jun 2014 | 05:51–23:47 | 364 | 29.2 | 39.4 | |
| 5 | 26 Jun 2014 | 00:02–18:17 | 545 | 38.6 | 43.1 | |
| 6 | 1 Jul 2014 | 05:53–15:51 | 263 | 12.3 | 32.5 | |
| 7 | 1–2 Jul 2014 | 20:49–09:37 | 417 | 19.4 | 37.2 | |
| 8 | 4 Jul 2014 | 11:00–23:59 | 631 | 39.8 | 101.1 | |
| 9 | 5 Jul 2014 | 00:01–12:53 | 725 | 41.1 | 115.3 | |
| 10 | 12 Jul 2014 | 06:59–22:58 | 313 | 71.9 | 145.2 | |
| Winter | 1 | 17 Dec 2014 | 11:10–13:36 | 146 | 3.5 | 3.9 |
| 2 | 19 Dec 2014 | 12:24–20:02 | 192 | 5.9 | 2.9 | |
| 3 | 21 Dec 2014 | 10:24–21:42 | 99 | 0.2 | 0.6 | |
| 4 | 22–23 Dec 2014 | 12:10–01:47 | 130 | 0.1 | 0.4 | |
| 5 | 24 Dec 2014 | 14:25–20:43 | 67 | 0.1 | 0.2 | |
| 6 | 26 Dec 2014 | 06:41–12:52 | 120 | 2.5 | 6.9 | |
| 7 | 29 Dec 2014 | 09:52–10:58 | 66 | 1.1 | 2.8 | |
| 8 | 30 Dec 2014 | 15:23–23:02 | 328 | 12.8 | 6.8 | |
| 9 | 1 Jan 2015 | 04:02–09:28 | 189 | 4.9 | 3.1 | |
| 10 | 2–3 Jan 2015 | 13:05–06:44 | 205 | 9.7 | 4.3 | |
| 11 | 3 Jan 2015 | 08:21–16:37 | 156 | 2.4 | 1.6 | |
| 12 | 8 Jan 2015 | 15:34–16:57 | 83 | 3.5 | 2.8 |
| Seasons | Pass No. | Date | Time (LST) | Rainfall Observations (√/×) | Max Rain Rate (mm h−1) |
|---|---|---|---|---|---|
| Summer | 1 | 15 Jun 2014 | 02:56–04:29 | √ | 10.2 |
| 2 | 15 Jun 2014 | 12:11–13:44 | × | 0 | |
| 3 | 23 Jun 2014 | 00:41–02:13 | × | 0 | |
| 4 | 25 Jun 2014 | 23:39–01:11 | √ | 24.3 | |
| 5 | 26 Jun 2014 | 08:54–10:27 | √ | 32.1 | |
| 6 | 2 Jul 2014 | 06:50–08:23 | √ | 19.5 | |
| 7 | 6 Jul 2014 | 20:21–21:54 | × | 0 | |
| 8 | 12 Jul 2014 | 04:24–05:56 | √ | 62.4 | |
| Winter | 1 | 9 Dec 2014 | 22:55–00:27 | √ | 1.5 |
| 2 | 10 Dec 2014 | 08:10–09:42 | √ | 0.7 | |
| 3 | 18 Dec 2014 | 05:50–07:22 | √ | 1.9 | |
| 4 | 20 Dec 2014 | 19:33–21:05 | × | 0 | |
| 5 | 21 Dec 2014 | 04:48–06:20 | × | 0 | |
| 6 | 23 Dec 2014 | 18:31–20:03 | √ | 0.3 | |
| 7 | 26 Dec 2014 | 03:35–05:08 | √ | 0.6 | |
| 8 | 8 Jan 2015 | 13:55–15:28 | √ | 0.4 | |
| 9 | 10 Jan 2015 | 13:44–15:18 | × | 0 | |
| 10 | 13 Jan 2015 | 12:42–14:15 | √ | 6.9 | |
| 11 | 27 Jan 2015 | 08:18–09:51 | √ | 6.8 |
| Relation | Data | a | b | c |
|---|---|---|---|---|
| Dm = aZKu2 + bZKu + c | Winter | 0.00093071 | 0.0027 | 0.5904 |
| Summer | 0.00113070 | 0.0047 | 0.4911 | |
| Dm = aZKa2 + bZKa + c | Winter | 0.00082581 | 0.0118 | 0.5011 |
| Summer | 0.00092452 | 0.0213 | 0.4104 | |
| log10(Nw) = aDm2 + bDm + c | Winter | 0.2876 | –2.1543 | 5.7352 |
| Summer | 0.2794 | –2.1347 | 5.8102 |
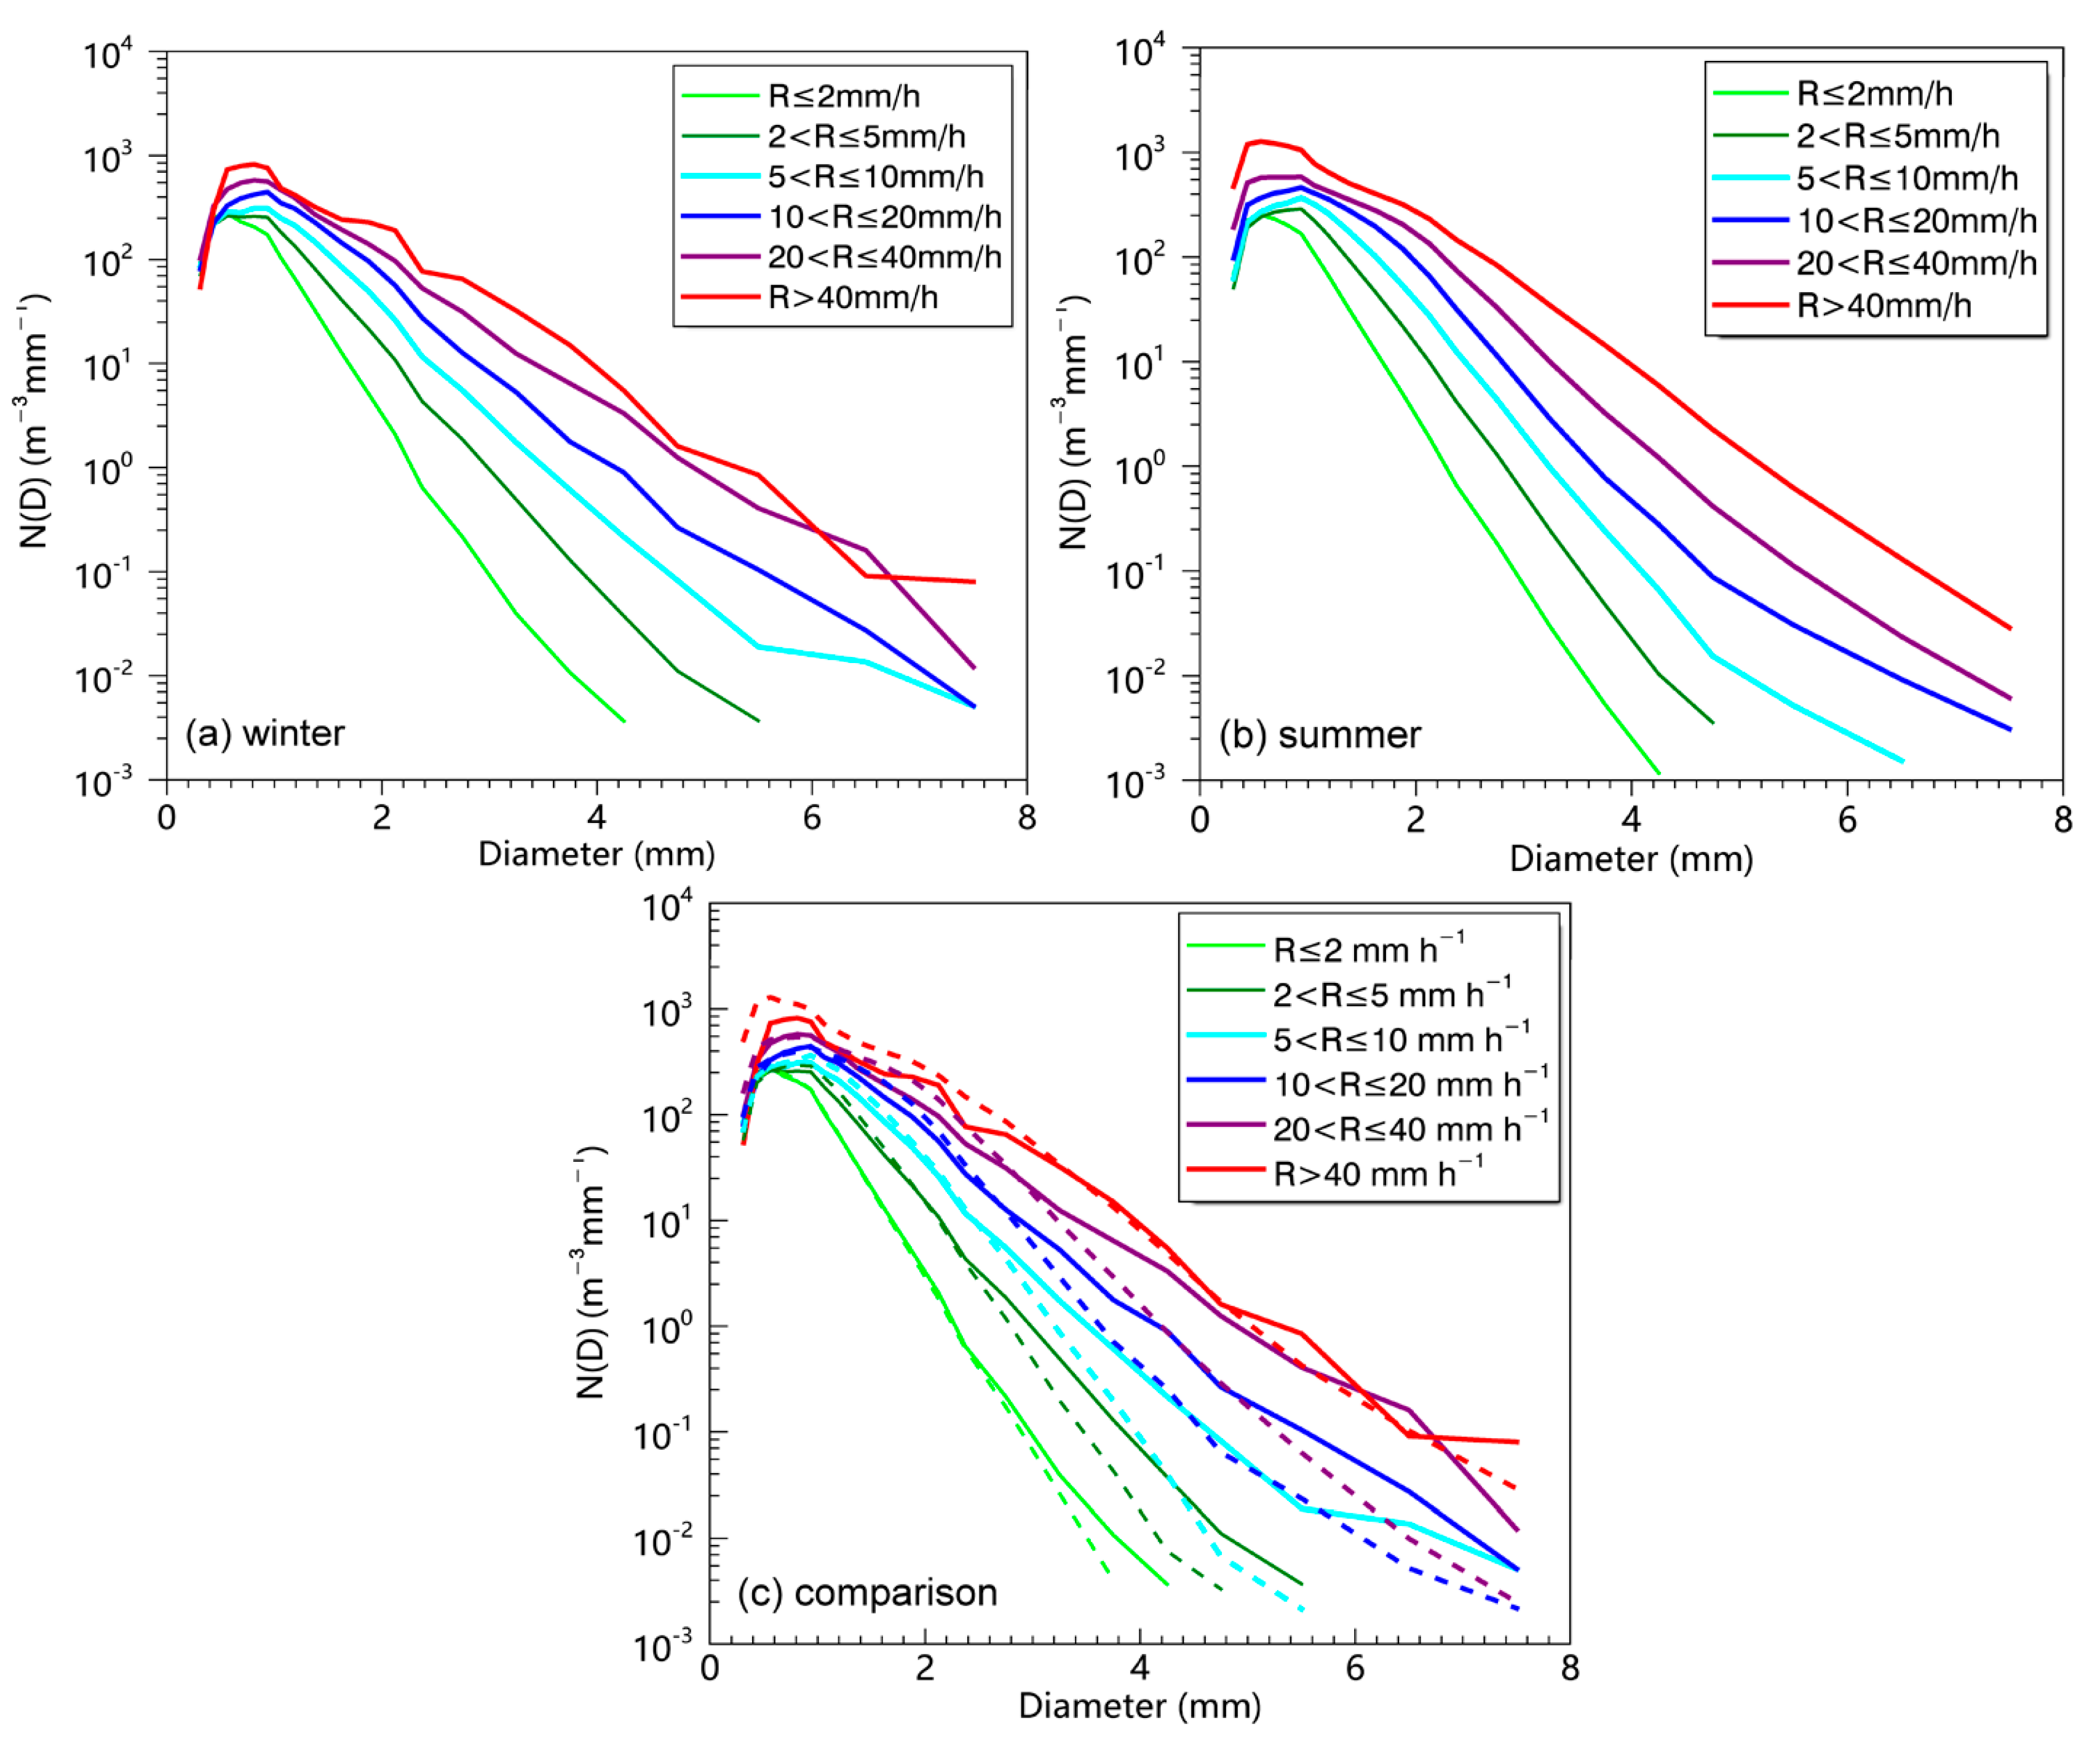
| Season | Rain Rate Class | log10N0 | μ | Λ |
|---|---|---|---|---|
| Winter | R ≤ 2 | 4.82 | 3.09 | 5.85 |
| 2 < R ≤ 5 | 4.71 | 2.88 | 5.04 | |
| 5 < R ≤ 10 | 4.45 | 3.14 | 4.28 | |
| 10 < R ≤ 20 | 4.27 | 3.52 | 4.14 | |
| 20 < R ≤ 40 | 4.11 | 1.87 | 2.88 | |
| R > 40 | 3.91 | 1.22 | 2.41 | |
| Summer | R ≤ 2 | 4.86 | 3.20 | 6.01 |
| 2 < R ≤ 5 | 4.73 | 3.41 | 5.23 | |
| 5 < R ≤ 10 | 4.65 | 3.79 | 5.01 | |
| 10 < R ≤ 20 | 4.42 | 3.61 | 4.55 | |
| 20 < R ≤ 40 | 4.27 | 2.85 | 3.54 | |
| R > 40 | 3.98 | 1.34 | 2.39 |
| Season | NB (%) | NSE (%) | |
|---|---|---|---|
| µ = 3 | Winter | −20.7 | 58.3 |
| Summer | −22.1 | 60.5 | |
| µ (rain rate-based) | Winter | −11.3 | 33.2 |
| Summer | −13.1 | 36.3 | |
| µ (rain category-based) | Winter | −3.5 | 17.9 |
| Summer | −5.3 | 18.8 |
| Rain Type | Season | log10N0 | μ | Λ | ||||||
|---|---|---|---|---|---|---|---|---|---|---|
| Mean | SD | SK | Mean | SD | SK | Mean | SD | SK | ||
| Convective | Winter | 4.26 | 1.39 | 0.79 | 3.81 | 3.31 | 0.89 | 4.37 | 2.68 | 1.07 |
| Summer | 4.70 | 1.14 | 0.73 | 4.69 | 2.92 | 0.69 | 4.89 | 2.42 | 0.94 | |
| Stratiform | Winter | 5.12 | 1.50 | 0.38 | 4.66 | 2.93 | 0.56 | 6.94 | 3.22 | 0.49 |
| Summer | 5.41 | 1.45 | 0.34 | 5.92 | 2.87 | 0.38 | 7.60 | 3.07 | 0.44 | |
© 2019 by the authors. Licensee MDPI, Basel, Switzerland. This article is an open access article distributed under the terms and conditions of the Creative Commons Attribution (CC BY) license (http://creativecommons.org/licenses/by/4.0/).
Share and Cite
Wu, Z.; Zhang, Y.; Zhang, L.; Hao, X.; Lei, H.; Zheng, H. Validation of GPM Precipitation Products by Comparison with Ground-Based Parsivel Disdrometers over Jianghuai Region. Water 2019, 11, 1260. https://doi.org/10.3390/w11061260
Wu Z, Zhang Y, Zhang L, Hao X, Lei H, Zheng H. Validation of GPM Precipitation Products by Comparison with Ground-Based Parsivel Disdrometers over Jianghuai Region. Water. 2019; 11(6):1260. https://doi.org/10.3390/w11061260
Chicago/Turabian StyleWu, Zuhang, Yun Zhang, Lifeng Zhang, Xiaolong Hao, Hengchi Lei, and Hepeng Zheng. 2019. "Validation of GPM Precipitation Products by Comparison with Ground-Based Parsivel Disdrometers over Jianghuai Region" Water 11, no. 6: 1260. https://doi.org/10.3390/w11061260
APA StyleWu, Z., Zhang, Y., Zhang, L., Hao, X., Lei, H., & Zheng, H. (2019). Validation of GPM Precipitation Products by Comparison with Ground-Based Parsivel Disdrometers over Jianghuai Region. Water, 11(6), 1260. https://doi.org/10.3390/w11061260