Abstract
Unconfined aquifers beneath piedmont pluvial fans are widely distributed in front of mountains and proper for water supply with pumping wells. However, the catchment zone and capture zones of a pumping well in such an unconfined aquifer is not well known. We develop a preliminary simplified model where groundwater flows between a segmental inflow boundary and a discharge boundary of constant head. The catchment zone is delineated from numerical simulation via MODFLOW and MODPATH. Results are expressed with dimensionless variables and lumped parameters to show general behaviors. Sensitive analyses indicate that there are 4 types of the catchment zone according to different connections to the boundaries. The shape of the catchment zone is quantitatively analyzed with typical shape factors. Capture zones with respect to special travel times are identified from travel time distribution in the catchment zone. The modeling results can be applied in the design of water supply wells and delineation of protection zones at a site with similar hydrogeological conditions.
1. Introduction
The capture zone of a pumping well is the aquifer volume from which groundwater flows to the well after a limited travel time. In particular, the catchment zone refers to the maximum capture zone without the limitation of the travel time [1]. The delineation of capture zones is important for management of groundwater resources, such as to define wellhead protection zones or to optimize pump-and-treat systems in projects of groundwater pollution remediation.
The characteristics of capture zones can be studied with numerical or analytical methods. In several simplified aquifer conditions, the catchment zone of a pumping well has been soundly investigated with analytical models. For a pumping well in an infinite confined aquifer with uniform regional flow, analytical solutions of potential and stream function were derived and used for determining the catchment zone [2,3,4,5]. The method was also extended for unconfined conditions [6]. These analytical models could not be used directly for conditions where the aquifer is limited by specific boundaries. It was found with analytical models of a near-stream well [7,8] that the shape of the catchment zone is highly dependent on the well-stream distance and pumping rate. Intaraprasong and Zhan [9] proposed an analytical model in which a pumping well is located in a confined aquifer between two streams along infinite parallel lines that were treated as constant head boundaries. The effect of wedge–shape boundaries [10] and groundwater divide [1,11] were also investigated with analytical approaches. In most of the analytical models, the hydraulic head can be obtained directly from closed-form solutions, however, boundary streamlines of the catchment zone have to be delineated with indirect or numerical methods due to the complexity of stream functions.
In practice, capture zones are generally delineated with respect to a travel time that ranges from tens of days to tens of years. For idealized radial flow around a pumping well, simplified analytical solution [12] and semi-analytical solutions [13,14] of the travel time have been proposed. For complex conditions, a widely used approach is to perform a numerical modeling of groundwater flow and then determine capture zones with the particle tracking method [15,16].
The capture zone of a pumping well in a piedmont pluvial fan is of interest to hydrogeologists because unconfined aquifers of pluvial deposits are common in front of mountains. A typical example is the Qaidam Basin [17], China, where the climate is extremely dry but groundwater gains inflow recharge from the surrounding mountains, as shown in Figure 1a. The general hydrogeological conditions in the basin are shown in Figure 1b. Streams bring surface water from the mountains toward the pluvial fans. At the mountain front, the water table in the aquifer is deep and so the streams leak significantly. Streams dry up along a short extending length and all surface water becomes the supplement of groundwater. It produces a concentrate groundwater inflow to the pluvial fan that has been known as mountain front recharge [18]. At the lower edge of the pluvial fan, water table becomes shallow and discharges to springs and wetlands in the plain area (Figure 1b). The places of spring form a groundwater discharge line where fine sands and clayey sediments are the major deposits in comparison with the gravel to coarse sands in the pluvial fan. A pumping well in the pluvial fan aquifer would capture a portion of the concentrated inflow and the catchment zone should be controlled by several key factors. However, the general features of this kind of capture zones were not well known in the literature because the non-uniform flow and the special boundary conditions are different from that in the previous models. For example, in the analytical model of Intaraprasong and Zhan [9], the lateral groundwater flow begins from a recharge river with infinite length, which could not describe the divergent flow driven by the segmental inflow from the mountains.
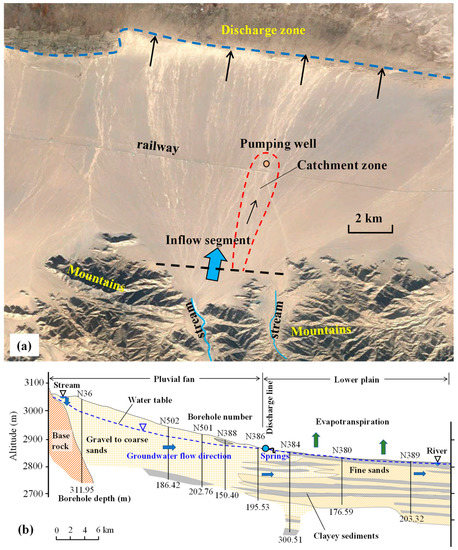
Figure 1.
Characteristics of pluvial fans in the Qaidam Basin: (a) A satellite photo of a pluvial fan, with delineations of the groundwater inflow segment, discharge zone and potential catchment zone of a pumping well; (b) A typical profile map of the general hydrogeological conditions (modified from [17]).
In this study we develop a simplified model for the catchment and capture zones of a well pumping groundwater with the mountain front recharge from the segmental inflow. Unconfined groundwater flow in this situation is numerically solved with MODFLOW. Particle tracking method is used to delineate the time-related capture zone and the time-independent catchment zone. The general shape of the catchment zone and distribution of the travel time are investigated. Sensitivity analyses were performed to check the impacts of several lumped parameters.
2. Conceptual and Mathematical Models of Groundwater Flow
2.1. Conceptual Model with Simplifications
The simplified conceptual model proposed in this study is shown in Figure 2. We assume that the pluvial fans developed in front of mountains and distribute along a straightforward mountain-rim line in a relatively uniform pattern (Figure 2a). The discharge boundary between pluvial fans and the plain area is simplified as a line parallel to the mountain-rim with a constant hydraulic head (the water table reaches the ground surface). Lateral inflow of groundwater in pluvial fans is segmentally distributed at mountain passes. The recharge rate (QR) across each segment is assumed to be equal and steady. In the natural state, groundwater divides are developed between different pluvial fans. In considering of the symmetry, a block of double pluvial fans is selected as an interested study area (Figure 2b) where the groundwater flow along Divide-2 could be affected by the pumping well.
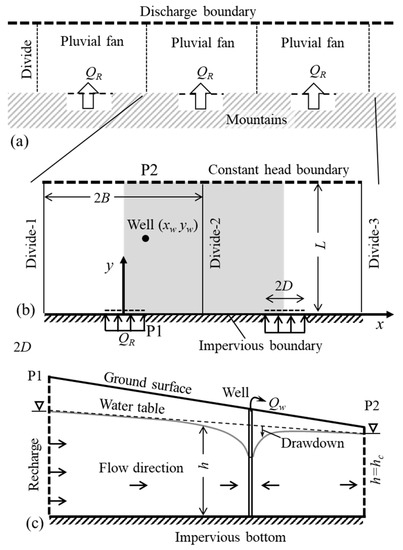
Figure 2.
Conceptual model of the unconfined aquifer in a pluvial fan: (a) uniform distribution of pluvial fans in the plan view; (b) a representative area with a pumping well in the gray zone; (c) the profile between P1 and P2.
Base rocks in the mountain area are treated as impervious media in comparison with the aquifers in fluvial fans, whereas each segment of mountain passes forms an inflow boundary with uniform flow rate across a per-length of the segment. A fully penetrating pumping well is located in the zone between central-lines of the two fans, abstracting groundwater from the aquifer at the constant rate of Qw.
The additional assumptions of the aquifer and groundwater flow are specified to:
(1) The bottom of the unconfined aquifer is flat and impervious (Figure 2c);
(2) The aquifer media beneath the fan is homogenous and isotropic;
(3) Vertical groundwater flow is ignorable;
(4) Groundwater flow is in steady state and satisfies the Darcy law;
(5) No vertical infiltration recharge and evapotranspiration loss of groundwater in the study zone;
(6) The radius of the well is sufficiently small so that it can be treated as a point sink for the horizontal flow in the aquifer;
(7) The inflow rate on the upstream boundary and the hydraulic head on the downstream boundary are not influenced by the well, i.e., the place of the discharge line (Figure 1b) is not influenced by groundwater pumping;
(8) Divide-1 and Divide-3 are not influenced by the well, i.e., they are no-flow boundaries as that in the natural state.
Limitations of the model with these assumptions are discussed on Section 6.
2.2. Mathematical Model and Lumped Parameters
According to the assumptions in the conceptual model, the mathematical model of the two-dimensional groundwater flow in the study area can be given as
where K is the hydraulic conductivity [LT−1], h is the relative groundwater level [L], L is the distance between the upper and lower boundaries [L], B and D refer to the half-widths of a fan block and an inflow segment [L], respectively, along the x-direction, hc is the groundwater level on the discharge boundary [L], q0 refers to the flow rate across per-unit width of the inflow segment [L2T−1], QR is the total inflow from one segment [L3T−1], Qw is the pumping rate of the well [L3T−1], δ is the Dirac delta function [L−1], xw and yw are the coordinates of the well [L].
At the site shown in Figure 1a, the hydrogeological conditions have not been surveyed in detail, however, we can schematically characterize the shape of the pluvial fan and hydrological conditions as that in Table 1. The hc value is approximately determined as the effective thickness of the gravel to coarse sands limited by the clayey sediments (Figure 1b). The QR value is specified from streamflow data of rivers in the eastern Qaidam Basin [17]. The Qw in fact is the total pumping rate of several wells that allocated in a relatively small area around the position of (xw, yw). Pumping wells were penetrated into the aquifer at a maximum depth around 100 m but can be plausibly considered as fully penetrating wells in this study. In the modeling investigation, we will check the effect of the well position by replace (xw, yw) in Table 1 with other values that are limited by B and L (Figure 2b).

Table 1.
Characteristics of the site in Figure 1a.
Introducing the following dimensionless variables
and lumped dimensionless parameters,
the mathematical model can be rewritten as
Equations (8)–(12) yield a dimensionless model, indicating that groundwater flow is generally controlled by the four lumped parameters. The theoretical ranges of the four dimensionless parameters are: 0 < α < 1, β > 0, γ > 0, 0 ≤ λ ≤ 1. At the site of Figure 1a, the highly possible ranges are: 0.2 < α < 0.7, 0.7 < β < 1.8, 0.2 < γ < 5.4, 0.1 < λ < 0.4.
In this study, we obtain solutions of the original physical-based model in Equations (1)–(4) with a numerical method (Section 3.1). This is implemented by fixing B = 10 km, K = 50 m/d, and hc = 100 m and changing the values of D, L, QR, and Qw, as well as the xw and yw values. Then the results are expressed with dimensionless variables in Equation (6) and lumped parameters in Equation (7) to represent more general behaviors. Consequently, the result of the spatial distribution of groundwater level, h(x, y), is expressed as hD(xD, yD) to indicate a solution of Equation (8). Dimensionless results are useful for analyzing other sites with a different size and/or different physical parameters.
3. Numerical Methods
3.1. Numerical Solution of Groundwater Flow
The catchment zone of a pumping well has been well investigated by the analytical method. This approach has an advantage to obtain closed-form equations of the critical streamlines but limited in a few of simple conditions. In addition, most of the analytical models are false to provide closed-form equations for the travel time. For the mathematical model in Section 2.2, it is very difficult to derive an analytical solution of h(x, y), even more difficult in obtaining analytical formulas of the catchment zone and the travel time. Alternatively, we can sufficiently obtain the numerical solution with effective simulation tools. In this study, the mathematical model is numerically solved with MODFLOW [19,20], a widely adopted simulation tool for groundwater flow modeling. A single-layer cell-centered grid is generated to prepare data for the numerical model based on the finite-difference method. Each cell in the grid is square-shape in plane with the size of Δx = 50 m. The aquifer type is specified to “unconfined” in constructing the MODFLOW model. The inflow boundary segment with a constant flow rate is equivalently implemented by using the WELL package [19]. A virtual well with the injecting rate of q0Δx is settled in each cell along this boundary, which is an equivalent implement of Equation (4). The pumping rate Qw is specified to a well-block including the place of (xw, yw).
The PCG2 package [21] is chosen from the solver packages of MODFLOW to solve the finite-difference equations. Criteria for the convergence are specified to: head change is 0.001 m; the residual of cell-by-cell flow is 0.01m3/d. The grid resolution and the criteria have been checked to obtain accurate modeling results without excessive computational cost. The dimensionless result, hD(xD, yD), are obtained from the MODFLOW output, h(x, y), by using Equation (6).
3.2. Particle Tracking Method for Streamlines and Travel Time
We use MODPATH to observe the flow-net and delineate the capture zone from the simulation results of the MODFLOW model. It was developed on the basis of a semi-analytical particle tracking method [22]. The new version, MODPATH version 6, improves the performance and output for post-processing [23]. The pathline and step-by-step travel time of a particle can be extracted from the MODPATH output. The catchment zone of a pumping well is delineated through a group of pathlines that sufficiently link the source on the boundaries and the well. The capture zone is a part within the catchment zone where a particle can move to the well along a pathline in a period that is less than a specified travel-time. In practice, 100 particles are placed on all sides of a well-cell and then the pathlines of them are determined by backward tracking. Shafer [15] pointed out that 100 to 300 particles are generally sufficient to encompass the entire capture zone of a pumping well. We check the use of different numbers of particles and find that 100 particles are enough in this studied model.
In this study, we attempt to obtain general results of the travel time with respect to the dimensionless model in Equations (8)–(12), by introducing a dimensionless travel time. For a particle moving forward along a streamline, the velocity is determined by the Darcy law as follows:
where l is the travel length along the streamline [L], dl is a small increase in travel length [L] with respect to a small increase in the real travel time dt [T], φ is the effective porosity [-], lD refers to the dimensionless travel length (=l/B). The travel time is an integral of that:
Substituting Equation (13) into Equation (14), we have:
To present the results in a general manner, the dimensionless travel time is defined as
Accordingly, the MODPATH output can be also transformed into dimensionless results.
4. Results of the Catchment Zone
4.1. General Shape and Classification
The characteristics of groundwater flow field in the modeling area and the shape of the catchment zone, as indicated by the simulation results, are highly dependent on the well location. Figure 3, Figure 4, Figure 5 and Figure 6 show typical results for specified parameters: α = 0.4, β = 1, γ = 1, and λ = 0.2. When the well is not far away from the Y-axis, the disturbance of the natural divergent flow would be significantly limited in the zone between Divide-1 and Divide-2, as in the case of Figure 3 and Figure 4. Otherwise, the catchment zone could extend to the neighboring fan. We classified the shape of the catchment zone into four types according to the hydraulic connection between the well and boundaries:

Figure 3.
The flow net (a) and catchment zone (b) of type-I.

Figure 4.
The flow net (a) and catchment zone (b) of type-II.

Figure 5.
The flow net (a) and catchment zone (b) of type-III.

Figure 6.
The flow net (a) and catchment zone (b) of type-IV.
Type-I, the pumping well captures water from only one of the two inflow segments that is closer to the well, as shown in Figure 3b;
Type-II, the pumping well captures water from the constant head discharge boundary and one of the inflow segments that is closer to the well, as shown in Figure 4b;
Type-III, the pumping well captures water from both of the two inflow segments without abstracting water from the constant head boundary, as shown in Figure 5b;
Type-IV, the pumping well captures water from both of the two inflow segments and the constant head boundary, as shown in Figure 6b.
In most of the situations, the pumping well does not significantly change the divergent flow at the regional scale, as shown in Figure 3a, Figure 4a, Figure 5a and Figure 6a, but locally reshapes the streamlines to produce a concentrated flow around the well. This local influence limited the size of the catchment zone in an area with the length along the X-axis that is smaller than 2B. The width of the type-I and type-II catchment zones in the X-direction could be even smaller than 2D, as shown in Figure 3b and Figure 4b. The maximum length of the catchment zone in the Y-direction will reach to L in the type-II and type-IV cases, as shown in Figure 4b and Figure 6b.
The relationship between the well location and the type of the catchment zone can be shown with a map of well-location zones (Figure 7). For example, when the pumping well is located in the II zone, a type-II catchment zone will be generated. The well-location zones symmetrically distribute on sides of the Y-axis and Divide-2 due to the symmetry of the conceptual model. Therefore, we can focus the investigation on the distribution of well-location zones in a typical area between the Y-axis and Divide-2.

Figure 7.
General well-location zones with respect to different types (from I to IV) of the catchment zone.
Distribution of the well location zone depends on the control parameters, α, β, γ, and λ, that defined in Equation (7). In particular, Figure 8 shows the change in the well-location zones with the increasing λ value. An increase in the λ value indicates a relative increase in the well pumping rate (Qw), which will reduce the area of the I zone and enlarge the area of the IV zone. When the λ value is small, like that shown in Figure 8a, the II and IV zones will be limited in small areas in the vicinity of the discharge boundary. While if the λ value is close or equal to 1.0, the I zone will significantly shrink to a narrow small area that encloses a short part of the Y-axis, as shown in Figure 8d. The IV zone extends to the X-axis in this situation, indicating that the constant head boundary could be connected with the catchment zone for a well pumped heavy even it is very close to the X-axis.
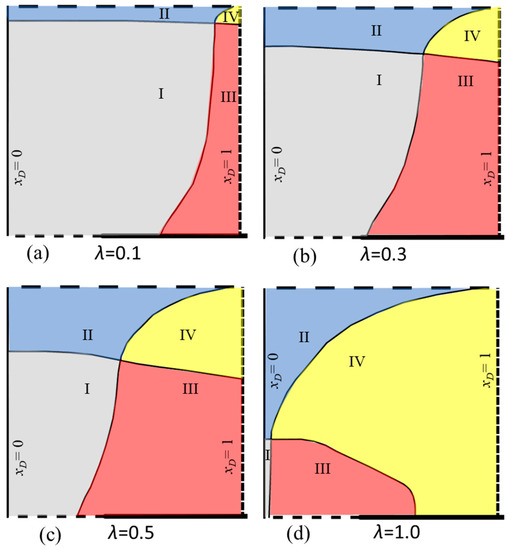
Figure 8.
Change in well-location zones with different values of λ when the other parameters are specified as α = 0.4, β = 1 and γ = 1: (a) λ = 0.1; (b); λ = 0.3; (c): λ = 0.5; (d): λ = 1.0.
4.2. Dependency of Shape Factors on Controls
The shape of a catchment zone can be characterized by several geometric elements. For the type-I and type-III catchment zones with a well on the Y-axis or Divide-2, typical shape factors are defined as that shown in Figure 9. The type-I catchment zone in Figure 9a collects water from a single inflow segment where the source head width is d [L]. In fact, the d value is determined by the necessary contribution of recharge from the source head to the well, which can be expressed as
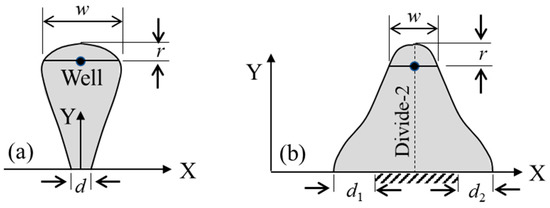
Figure 9.
Shape factors of a symmetrical catchment zone: (a) type-I; (b) type-III.
A line across the well center and parallel to the X-axis within the catchement zone characterizes the size of the catchment zone near the well, which has a length of w [L]. The ratio w/d is a dimensionless shape factor indicating the transectional expansion of the catchment zone along the flow path from the source head to the well. The distance from the well center to the stagnation point is defined as r [L]. The ratio r/d is another dimensionless shape factor indicating the expansion of the catchment zone from the well to the natural downstream area. The type-III catchment zone in Figure 9b collects water from two inflow segments on the sides of Divide-2. The source head width along the left segment is d1 whereas the source head width along the right segment is d2. The total length of the source head is defined as d1 + d2, which satisfies the following equation:
The size of the catchment zone at the well, w, and the distance of the stagnation point, r, are defined in Figure 9b. In this situation, the dimensionless shape factors are defined by w/(d1 + d2) and r/(d1 + d2).
Shape factors of the catchment zone are controlled by several parameters, such as α, β, γ, and λ, and also dependent on the well location. In Figure 10, the relationship between shape factors and key parameters are illustrated from results of the sensitivity analysis for the Type-I zone. As shown in Figure 10a,b, w/d increases between 0.5 and 2.5, nonlinearly with the decreasing α value between 0.2 and 1.0. Since the α value refers to the relative width of an inflow segment, this relationship indicates that a shorter inflow segment will lead to a larger transectional expansion of the catchment zone when groundwater flow toward the well. An increase in the λ value (relative pumping rate) will also increase w/d, as shown in Figure 10a. The w/d value seems to be not sensitive to the change in the β value (relative distance between the inflow and discharge boundaries), as indicated in Figure 10b, even the β value has a slight negative influence. The impacts of α and λ on w/d are also exhibited with the curves in Figure 10c,d, respectively, for the relationship between w/d and the well-location represented by ywD. It can be seen that w/d is positively correlated with the ywD value, almost in a linear manner. The r/d value is generally less than 1.0 and also increases with the decreasing α value as shown in Figure 10e, indicating that the distance from the well to the stagnation point is generally less than the width of source head. Similar to the relationship between w/d and ywD, r/d increases with the increasing ywD value, as shown in Figure 10f, however, the relationship becomes nonlinear when the λ value is large.
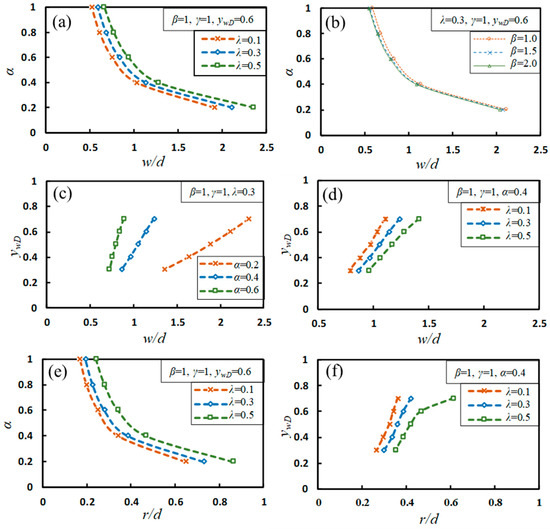
Figure 10.
Dependency of dimensionless shape factors on control parameters for xwD = 0 in the type-I catchment zone: (a) Curves of w/d versus α with different λ values; (b) Curves of w/d versus α with different β values; (c) Curves of w/d versus ywD with different α values; (d) Curves of w/d versus ywD with different λ values; (e) Curves of r/d versus α with different λ values; (f) Curves of r/d versus ywD with different λ values.
The impacts of control parameters and the well location on shape factors of the type-III catchment zone are shown in Figure 11. The w/(d1 + d2) value could be significantly larger than 1.0, indicating that the width of the catchment zone at the well center could be significantly larger than the effective width of the source head. Both Figure 11a,b show that w/(d1 + d2) increases with the decreasing α value in a nonlinear manner. The w/(d1 + d2) value also increases with the increasing λ value as shown in Figure 11a, however, it is not sensitive to the change in the β value as shown in Figure 11b. The relationship between w/(d1 + d2) and ywD is negative and nonlinear, as is clearly shown in Figure 11c,d. In particular, Figure 11c indicates that a smaller α value leads to a larger range of w/(d1 + d2) with respect to the same range of ywD. This effect seems can be also leaded by the change in the λ value, as shown in Figure 11d, whereas the impact is not significant. Figure 11e exhibits the negative nonlinear relationship between r/(d1 + d2) and α, where r/(d1 + d2) is less than 1.0 in most of the situations. The relationship between r/(d1 + d2) and ywD is a bit complex as shown in Figure 11f where r/(d1 + d2) does not simply increase with the decreasing ywD value but they could have a positive relationship when ywD is high, especially for situations of a large λ value. In particular, r/(d1 + d2) is not sensitive to the change in the λ value when ywD is sufficiently small (less than 0.4).
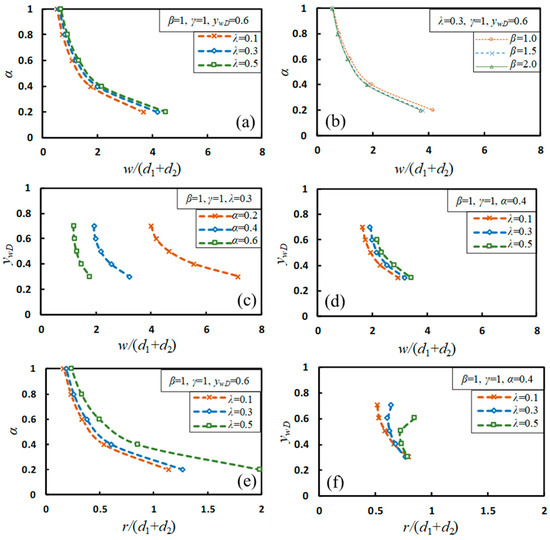
Figure 11.
Dependency of dimensionless shape factors on control parameters for xwD = 1 in the type-III catchment zone:(a) Curves of w/d versus α with different λ values; (b) Curves of w/(d1 + d2) versus α with different β values; (c) Curves of w/(d1 + d2) versus ywD with different α values; (d) Curves of w/(d1 + d2) versus ywD with different λ values; (e) Curves of r/(d1 + d2) versus α with different λ values; (f) Curves of r/(d1 + d2) versus ywD with different λ values.
5. Travel Time Analyses for Capture Zones
5.1. General Travel Time Distribution
Distributions of the dimensionless travel time around the pumping well are typically shown in Figure 12 for the four types of the catchment zone. In general, the travel time increases with the distance from the starting point to the well but the change patterns are not uniform. When control parameters are fixed, the maximum travel time for particles on the source head increases when the catchment zone changes from type-I to type-IV, due to the increase in the maximum length of streamlines linking the source head and the well. A capture zone is enclosed by a contour of travel time (tD = 1, 2, 3, etc.) in the map. In the type-I and type-II catchment zones shown in Figure 12a,b, the capture zone could be significantly stretched to the upstream area along the middle line between the sides of the catchment zone. In the type-III (Figure 12c) and type-IV (Figure 12d) catchment zones, this stretch effect also exists for relatively small travel times, whereas the capture zone will be stretched to the upstream area along the sides of the catchment zone for relatively large travel times, because the double source heads are not in the middle. The capture zone will be preferentially stretched toward a closer recharge boundary when the pumping well is not rightly located at Divide-2.
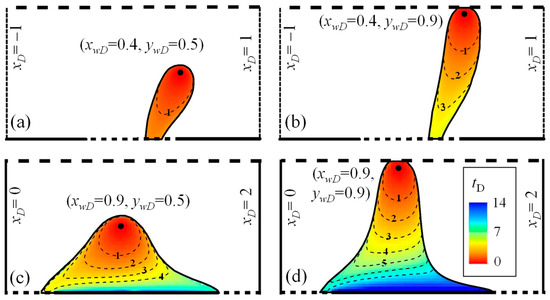
Figure 12.
Travel time (tD, dimensionless) distribution in the catchment zone: (a) type-I; (b) type-II; (c) type-III; (d) type-IV. Dashed lines are the contours of tD. Parameter values are specified in the model as α = 0.4, β = 1, γ = 1, λ = 0.2.
5.2. The Relationship between the Travel Time and the Size Factor
The shape and area of a capture zone are not only dependent on the well location and control parameters but also dependent on the specified travel time. To quantitatively analyze the controls of the capture zone, shape factors are required for description. Without significant loss of general, we investigate symmetrical capture zones in the type-I and type-III catchments with a size factor, R, that defined in Figure 13a and Figure 14a, respectively. The axis of symmetry for the type-I catchment zone is the Y-axis, which is also shown in Figure 9a. For the type-III catchment zone, the axis of symmetry is Divide-2, which is also shown in Figure 9b. The contour of a specified travel time, tD, and the symmetry axis have an intersection point. R denotes the distance between this intersection point and the well. It certainly increases with the increasing tD as a function whereas the function is controlled by the well location and parameters.
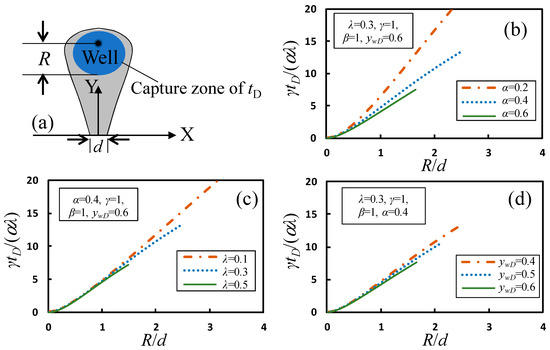
Figure 13.
The size factor of a capture zone (a) with limited travel time in a type-I catchment for a well on the Y-axis and the curves of γtD/(αλ) versus R/d with varying α (b), λ (c) and ywD (d).
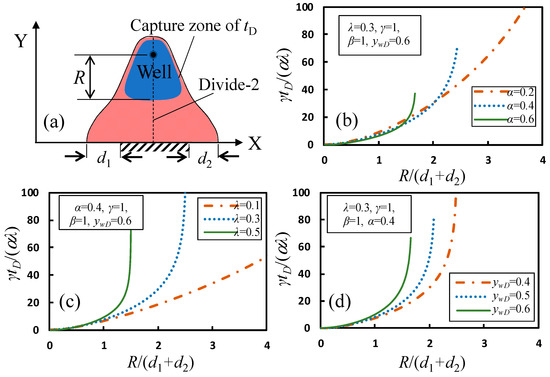
Figure 14.
The size factor of a capture zone (a) with limited travel time in a Type-III catchment for a well on Divide-2 and the curves of γtD/(αλ) versus R/d with varying α (b), λ (c) and ywD (d).
The travel time of a particle starting from a place in a catchment zone depends on the streamline length from the place to the well, as well as the change in the flow velocity along the streamline. In particular, the size factor, R, in Figure 13a is dependent on a streamline along the Y-axis oriented to the well. According to the relationship formulas presented in Equation (16), the relationship between R and tD can be expressed as
where t is the real travel time [T] and Vy is the Darcy velocity [LT−1] in the Y-direction along the Y-axis. In the vicinity of the pumping well, the flow is almost in a radial form where the radial velocity (oriented toward the well), Vr, depends on the radial distance from the well, r, as follows
where r can be expressed as |yw − y| in the model. Accordingly, in the vicinity of the pumping well along the Y-axis, Vy can be approximately estimated by
where h roles as the saturated thickness of the unconfined aquifer and is assumed to be hc for small drawdown condition. Substituting Equations (16) and (21) into Equation (19), we have
Equation (22) implies that in the vicinity of the well the dimensionless travel time depends on R/d and αλ/γ. When R is not small, significant error could be arisen by Equation (22), whereas the general relationship between R and tD can be checked by a formula as follows
where F() represents a function of R/d that would be dependent on or independent on a few parameters. For the type-III catchment zone, R/(d1 + d2) is used in the F() function to replace R/d.
Figure 13b–d show curves of γtD/(αλ) versus R/d for capture zones in the type-I catchment. As indicated, γtD/(αλ) is almost linearly dependent on R/d. An increase in the α value will cause a decrease in the slope of the curve, as indicated in Figure 13b. The slope of curves also decreases with the increasing λ value, as shown in Figure 13c, but the response is not significant as that influenced by the α value. Figure 13d shows that the curves are not sensitive to ywD even the increase in ywD could increase the slope. It is clearly indicated that the relationship between γtD/(αλ) and R/d, i.e., the function F(R/d), is almost independent on λ and ywD when R/d is less than 1.0 but still significantly depends on α. Different curves of γtD/(αλ) versus R/(d1 + d2) are shown in Figure 14b–d for capture zones in the type-III catchment. Unlike those shown in Figure 13, these curves are significant nonlinear. When R/d is less than 1.0, the curves are close to each other and are not sensitive to the changes in α, λ and ywD. Otherwise the curves are significantly influenced by these parameters. Note that the intersection of the X-axis and Divide-2 is a stagnation point for the Type-III catchment, which limits the value of R/(d1 + d2) but leads to an infinite tD value because of the tiny Vy value in the vicinity of the stagnation point. As a result, the curves are approximately vertical to the horizontal axis when R/(d1 + d2) is close to the maximum value. According to Equation (18), both α and λ increase d1 + d2 so that the bound of R/(d1 + d2) decrease in Figure 14b,c, respectively, with the increasing α and λ values. However, an increase in the ywD value will enlarge the range of R and consequently increase the bound of R/(d1 + d2), as shown in Figure 14d.
6. Discussions on the Application
The modeling results with dimensionless variables in this study represent general behaviors of the catchment zone and capture zones of a pumping well with hydrogeological conditions that illustrated in Figure 2. It can be applied in such conditions to determine the type and the shape of the catchment zone for a well in water supply projects. In the example of Figure 1a with parameters in Table 1, the pumping site is generally located in the type-I zone so that the shape of the catchment zone is similar to that shown in Figure 3b. The width of the catchment zone on the source head, d, can be estimated with Equation (16), which is 0.7–2.9 km. The w/d value is larger than but close to d.
General results in this study can be used to optimize the location of a pumping site and to delineate protection zones for different security levels. Three major points should be concerned:
First of all, it is noticeable that the catchment zone would be one of the four types shown in Figure 3, Figure 4, Figure 5 and Figure 6. The type-I catchment has a single source head, whereas the others have two (type-II, type-III) or three (type-IV) source heads. An increase in the number of source heads would increase the risk of contamination on water supply if all the source heads could be probably influenced by pollutions. It would also increase the cost of groundwater monitoring because all the source heads should be monitored to achieve an effective response in time of pollution events. Thus, the type-I catchment is recommended for safety. As indicated in Figure 7 and Figure 8, the type of the catchment is highly dependent on the location and pumping rate of the well. When the pumping rate is fixed and less than QR (λ < 1.0), the catchment will be a type-I catchment if the position is far enough away the discharge boundary and close enough to the Y-axis. When the position of the well is fixed, it would be a type-I catchment if the pumping rate is not too high. In the example of Figure 1a, when Qw is larger than 20 × 104 m3/d, the possibility of forming a type-III catchment is high, indicating that the pumping site should be moved westward to maintain a type-I catchment zone.
Second, the shape and size of the catchment zone depend on well position, pumping rate, and aquifer parameters with different sensitivities. To reduce the risk of contamination, a catchment of small w and r is recommended. For a well with fixed pumping rate, the d value of a type-I catchment and d1 + d2 value of a type-II catchment are fixed according to Equations (17) and (18), respectively. Thus, the changes in the shape factors, w/d and r/d, for the type-I catchment, or w/(d1 + d2) and r/(d1 + d2) for the type-III catchment, can be considered to check the catchment size. The relationships between these shape factors and the parameters are shown in Figure 9 and Figure 10. Note that in the type-I catchment the w/d value increases with ywD, whereas in the type-III catchment the w/(d1 + d2) value decreases with ywD. The r/d and r/(d1 + d2) values could be nonlinearly dependent on ywD.
The third point is the dependency of the size factor, R, on the well location and parameters for capture zones with required maximum travel times. In practice, the maximum travel time is hundreds of days to high security levels and several of years to low security levels. A small R/d or R/(d1 + d2) value is recommended for the same security level to reduce the protection area. As indicated in Figure 13, R/d increases with the dimensionless travel time, γtD/(αλ), almost following a linear manner in the type-I catchment. However, R/(d1 + d2) nonlinearly increases with γtD/(αλ) in the type-III catchment with a limitation that positively depends on ywD, as shown in Figure 14. In application, one should notices the conversion between the dimensionless travel time tD and the real travel time, t, according to Equation (16).
Limitations of the model should be also paid attention to in application. One assumption in the model is the equal length of each inflow segment and inflow rate. This will be not satisfied so far if the mountain-front recharge of groundwater is significantly heterogeneous. However, the results of type-I catchment are still useful because it is dominated by a single inflow segment. The model would be invalid when the pumping rate is higher than double of the recharge rate from an inflow segment, because in this situation Divide-3 (Figure 2) and other divides far away the well could be influenced. The constant head discharge boundary is a simplification and needs to be checked in reality, especially for a pumping well located in the II and IV zones, which may significantly influence the discharge boundary. A time-dependent hc would exist on a natural discharge boundary because of the unsteady groundwater flow. When the seasonal fluctuation of groundwater level in the natural state (generally less than 2 m at the site in Figure 1a) is significantly less than hc (>100 m at the site in Figure 1), the mean annual state could be adopted in analyses to represent a steady state flow. Vertical recharge to or discharge from water table should be also checked. At the site in Figure 1, the climate is extremely dry (mean annual precipitation is less than 50 mm, whereas mean potential evaporation is higher than 1500 mm) so that infiltration recharge could be ignored. Depth of water table in the pluvial fan area is generally larger than 10 m, which does not yield a significant loss of groundwater from evapotranspiration. The model in this study is false if there is a river flowing across the whole study area and providing persistent leakage recharge to groundwater. More comprehensive models are required to analyze capture zones for a complex pumping site, however, with more uncertain parameters.
7. Conclusions
A conceptual model of the unconfined aquifer beneath fluvial fans in front of mountains is developed in this study, where the aquifer is limited by a segmental inflow boundary and a discharge boundary of constant head. The capture zone of a pumping well in such an unconfined aquifer is investigated with a numerical approach using MODFLOW and MODPATH. Shape factors are introduced to quantitatively analyze the catchment zone. Travel time distribution in the catchment zone is identified to delineate the capture zones with respect to special travel times. Results are transformed into dimensionless variables and parameters to observe general behaviors.
The characteristics of the catchment zone and capture zones for a pumping well in such an aquifer can be summarized as:
(1) The catchment zone has 4 types of shape, in terms of Type-I to type-IV in Figure 3, Figure 4, Figure 5 and Figure 6, due to different connections with the boundaries, depending on the location of the pumping well and several control parameters.
(2) The dimensionless width of the catchment zone in the vicinity of the well (related to the source head width) decreases with the relative length of inflow segments but increases with the relative pumping rate, as indicated in Figure 10 and Figure 11;
(3) The dimensionless size of capture zones (related to the source head width) increases with the relative travel time almost in a linear manner when the source is contributed by a single inflow segment, as shown in Figure 13. A significant nonlinear relationship exists when the source is contributed by double inflow segments, as shown in Figure 14.
Simplifications in the model also bring limitations of the results in application.
Author Contributions
Conceptualization, H.L. and X.-s.W.; methodology, H.L.; software, H.L.; validation, H.L. and X.-s.W.; formal analysis, H.L.; data curation, H.L.; Writing—Original Draft preparation, H.L.; Writing—Review and Editing, X.-s.W.; supervision, X.-s.W.; project administration, X.-s.W.; funding acquisition, X.-s.W.
Funding
This research was funded by the Fundamental Research Funds for the Central Universities (2652018191), the Foundation Research Project of Qinghai Province (No. 2018-ZJ-740) and the National Natural Science Foundation of China (No. 41772249).
Conflicts of Interest
The authors declare no conflict of interest.
References
- De Smedt, F. Analytical solution for capture and catchment zones of a well located on a groundwater divide. Water Resour. Res. 2014, 50, 736–740. [Google Scholar] [CrossRef]
- Muskat, M.; Meres, M.W. The flow of homogeneous fluids through porous media. Physics 1936, 7, 346–363. [Google Scholar] [CrossRef]
- Bear, J. Hydraulics of Groundwater; McGraw-Hill: New York, NY, USA, 1979; 567p. [Google Scholar]
- Javandel, I.; Tsang, C.F. Capture-zone type curves: A tool for aquifer cleanup. Groundwater 1986, 24, 616–625. [Google Scholar] [CrossRef]
- Shan, C. An analytical solution for the capture zone of two arbitrarily located wells. J. Hydrol. 1999, 222, 123–128. [Google Scholar] [CrossRef]
- Grubb, S. Analytical model for estimation of steady-state capture zones of pumping wells in confined and unconfined aquifers. Groundwater 1993, 31, 27–32. [Google Scholar] [CrossRef]
- Newsom, J.M.; Wilson, J.L. Flow of ground water to well near a stream-effect of ambient ground-water flow direction. Groundwater 1989, 26, 703–711. [Google Scholar] [CrossRef]
- Asadi-Aghbolaghi, M.; Rakhshandehroo, G.R.; Kompani-Zare, M. Analytical solutions for the capture zone of a pumping well near a stream. Hydrogeol. J. 2011, 19, 1161–1168. [Google Scholar] [CrossRef]
- Intaraprasong, T.; Zhan, H. Capture zone between two streams. J. Hydrol. 2007, 338, 297–307. [Google Scholar] [CrossRef]
- Samani, N.; Zarei-Doudeji, S. Capture zone of a multi-well system in confined and unconfined wedge-shaped aquifers. Adv. Water Resour. 2012, 39, 71–84. [Google Scholar] [CrossRef]
- De Smedt, F. Analytical solution for the catchment zone of a well located near a groundwater divide in a recharged semi-confined aquifer. J. Hydrol. 2014, 519, 1271–1277. [Google Scholar] [CrossRef]
- Simpson, M.J.; Clement, T.P.; Yeomans, F.E. Analytical model for computing residence times near a pumping well. Groundwater 2003, 41, 351–354. [Google Scholar] [CrossRef]
- Chapuis, R.P.; Chesnaux, R. Travel time to a well pumping an unconfined aquifer without recharge. Groundwater 2006, 44, 600–603. [Google Scholar] [CrossRef]
- Zhou, Y.X.; Haitjema, H. Approximate solutions for radial travel time and capture zone in unconfined aquifers. Groundwater 2012, 50, 799–803. [Google Scholar] [CrossRef] [PubMed]
- Shafer, J.M. Reverse pathline calculation of time-related capture zones in nonuniform flow. Groundwater 1987, 25, 283–298. [Google Scholar] [CrossRef]
- Pollock, D.W. Semianalytical computation of path lines for finite-difference models. Groundwater 1988, 26, 743–750. [Google Scholar] [CrossRef]
- Wang, Y.; Guo, H.; Li, J.; Huang, Y.; Liu, Z.; Liu, C. Survey and Assessment on Groundwater Resources and Relevant Environmental Problems in the Qaidam Basin; Geological Publishing House: Beijing, China, 2008. (In Chinese) [Google Scholar]
- Wilson, J.L.; Guan, H. Mountain-block hydrology and mountain-front recharge. In Groundwater Recharge in a Desert Environment: The Southwestern United States; Phillips, F.M., Hogan, J., Scanlon, B., Eds.; The American Geophysical Union: Washington, DC, USA, 2004. [Google Scholar]
- McDonald, M.G.; Harbaugh, A.W. Techniques of Water-Resources Investigations of the United States Geological Survey Chapter A1: A Modular Three-Dimensional Finite Difference Ground-Water Flow Model; United States Government Printing Office: Washington, DC, USA, 1988.
- Harbaugh, A.W.; McDonald, M.G. User’s Documentation for MODFLOW-96, an Update to the U.S. Geological Survey Modular Finite-Difference Ground-Water Flow Model; Office of Ground Water U.S. Geological Survey: Reston, VA, USA, 1996; p. 56.
- Hill, M.C. Preconditioned Conjugate-Gradient 2 (PCG2): A Computer Programfor Solving Ground-Water Flow Equations; U.S. Geological Survey: Denver, CO, USA, 1990; p. 43.
- Pollock, D.W. Documentation of Computer Programs to Compute and Display Pathlines Using Results from the U.S. Geological Survey Modular Three-Dimensional Finite Difference Ground-Water Flow Model; U.S. Geological Survey: Reston, VA, USA, 1989.
- Pollock, D.W. User Guide for MODPATH Version 6—A Particle-Tracking Model for MODFLOW; U.S. Geological Survey: Reston, VA, USA, 2012.
© 2019 by the authors. Licensee MDPI, Basel, Switzerland. This article is an open access article distributed under the terms and conditions of the Creative Commons Attribution (CC BY) license (http://creativecommons.org/licenses/by/4.0/).
