Abstract
Urban rivers are valuable elements of urban ecosystems and play a key role in urban socio-economic development. Unfortunately, the functional integrity of urban rivers is being threatened by extensive human activities associated with the social development. Urban river health evaluation is important, as it may provide policy makers with information that is fundamental for river governance and the protection of urban ecosystems. To this purpose, we first constructed an urban river health assessment index system based on the pressure–state–response (PSR) framework. Secondly, we developed an urban river health index (uRHI) using the improved fuzzy matter–element extension assessment model. Finally, we used the uRHI to assess the health state of the Jialu River from 2008 to 2017 in Zhengzhou City, China. The results indicate that the health state of the Jialu River was improved from an unhealthy state in 2008 to a sub-healthy state in 2017. The pressure, state, and response subsystems developed towards a healthier state from 2008 to 2017, thanks to the implementation of a number of actions by the local government. However, the overall health status of the Jialu River is still relatively low. The Jialu River also faces several pressures, such as substantial Chemical Oxygen Demand (COD) emissions and sewage discharge. This paper concludes that it is necessary to further strengthen the health management of the Jialu River and the protection of Zhengzhou’s water environment.
1. Introduction
As a major freshwater source, urban rivers play a critical role in supporting socio-economic development and human well-being because they provide water resources for industrial, agricultural, and domestic uses, as well for recreational activities such as fishing [1]. However, in recent years, long-term urbanization and rapid industrialization have led to the deterioration of the water conditions of urban rivers [2]. The health of urban rivers is being threatened by increasing human activities, for example agricultural production, immoderate household consumption, and sewage discharge, which have synergistic effects on the health of the interconnected social–ecological systems, such as biodiversity loss, riverbank solidification, and disturbances to the hydrological cycle [3]. The decline in the natural and economic functions of urban river ecosystems poses a serious threat to the health of urban rivers. As one of the most powerful areas of interaction between humans and natural ecosystems, the health issues pertaining to urban rivers have attracted widespread attention from governments and Non-governmental organizations (NGOs) [4,5,6]. Evaluations of urban river health can provide an effective method for diagnosing urban river health problems, with urban river health assessments gradually being applied to river protection.
The concept of “river health” was first proposed in 1996 by Scrimgeour and Wicklum [7]. Presently, there are two main methods for diagnosing river health. One is the biological monitoring method, using various biological indicators such as the presence of invertebrates, aquatic plants, and fishes. This method is based on a comparison that evaluates a river’s health by comparing the river’s biological composition (obtained by monitoring) with and without human activities [8,9,10]. The biological monitoring methods make use of the index of biotical integrity (IBI) [11] and the river invertebrate prediction and classification system (RIVPACS) [12]. The other method is the comprehensive indicator method, which includes assessing the river’s biological composition, water quality, hydrological characteristics, and socio-economic information [13], using measures such as the multi-metric index (MMI), and the river habitat quality (RHQ) [14,15]. The integrated habitat assessment system (IHAS) is the most commonly used comprehensive indicator method [16]. At present, numerous scholars have conducted rivers’ health assessments [17,18,19]. For example, Wu et al. evaluated the Taihu Basin’s water quality using the index of biotical integrity (IBI) [20]. Liu et al. assessed the health of the Luan River by constructing an integrated index system [21]. Zhang et al. analyzed the health of the Huai River Basin in terms of its physical, chemical, and biological elements [22].
These studies are points of reference for urban river health assessment. However, their evaluation of river health arguably contains specific shortcomings. On the one hand, the two main evaluation methods mentioned above generally neglect the fact that the urban river system is a complex system composed of both the ecological subsystem and the socio-economic subsystem. Urban rivers provide not only ecosystem services, but also social services. However, the socio-economic subsystem is neglected in some urban river health assessments. On the other hand, current studies ignore the influence of human factors on urban river health. The social service function of urban rivers is affected by human activities. For example, urban sewer overflow caused by poor management of the drainage system may lead to the deterioration of urban river water quality, which will cause a decline in the river social service function. In addition, inappropriate human construction activities have placed great pressures on urban rivers, potentially leading to an unfavorable development in terms of these rivers’ health. Faced with the deterioration of river health, NGOs and local authorities in China have taken a series of measures to protect the water environment. Both those negative and positive human activities have had a significant impact on the health conditions of urban rivers. However, some studies overlook the effects of human intervention on river health, especially positive human intervention. It can be argued that this overlooking of human intervention in the process of assessing river health can lead to unscientific evaluations of rivers’ health status. There is, therefore, an urgent imperative to undertake a comprehensive diagnosis of China’s urban river health by fully considering the rivers’ natural and social functions, and the impact of human factors on rivers’ health conditions.
Recently, several evaluation methods have been widely used and developed, including the analytic hierarchy process (AHP) [23], the neural network method [24,25], the matter-element extension model [26], and the fuzzy comprehensive assessment [27]. However, it is difficult to fully evaluate the health state of urban rivers with a single method. These evaluation methods are not without limitations. For example, the analytic hierarchy process (AHP) may obtain results that are disturbed by subjective factors, while the neural network method has a weak capacity to accurately analyze the characteristics of each indicator. Therefore, it is indispensable to improve the shortcomings of each model and combine the advantages of various approaches in urban river health evaluation. As an objective method to investigate various fuzzy and uncertain problems, fuzzy theory can deal with the problem of fuzziness and fuzzy decision-making more efficiently [28]. Fuzzy theory is extensively used in the analysis of water environmental quality and urban hydrology [29]. The urban river health assessment is a relatively fuzzy concept with multiple indexes. Therefore, it is acceptable to evaluate river health using fuzzy theory. In addition, multiple functions of the urban river interact reciprocally when these functions work simultaneously. Similarly, the matter-element extension analysis can be considered to solve this incompatibility problem [30]. The current study tries to apply both the fuzzy theory and the matter-element extension analysis to assess urban river health.
To improve the practicality of urban river health assessment methods, this study took the following steps. Firstly, a health assessment index system for urban rivers was built based on the pressure–state–response (PSR) model. Secondly, based on the entropy theory, an improved fuzzy matter-element extension model (FMEM) was constructed. Finally, the health of the Jialu River from 2008 to 2017 was assessed using the urban river health index (uRHI), which was calculated by applying the improved FMEM. Based on the health conditions found, the reasons for the changes in the health of the Jialu River from 2008 to 2017 were analyzed, and corresponding measures proposed. The main contributions of this study are as follows: (1) According to the characteristics of urban rivers, this study constructed an index system for urban river health assessment based on the PSR framework. This index system includes not only the natural status and the social functions of the urban rivers, but also human interventions and the positive human efforts to the urban river; (2) An urban river health index (uRHI) was developed to evaluate for the first time the health of the Jialu River in the Chinese province of Henan over the last decade (2008–2017). This study provides new insights to assess the health of urban rivers, and fills the existing gap in the quantitative assessment of the health of urban rivers.
This paper is structured as follows. Section 2 briefly describes the study region and the data sources, and introduces in detail the developed index system and the improved FMEM. Section 3 presents the results of the urban river health assessment, including a detailed discussion and relevant suggestions. Finally, Section 4 summarizes the main conclusions.
2. Materials and Methods
2.1. Study Region
The Jialu River originates in Xinmi City (affiliated to Zhengzhou City) in the Henan Province, flows through Zhengzhou City, and eventually flows into the Huaihe River, which is the main tributary of the Huaihe River Basin. As the second largest source of water resources in Zhengzhou City, the Jialu River is the largest urban river and the main flood channel in Zhengzhou City, Henan Province, China (see Figure 1). In total, the Jialu River in Zhengzhou measures approximately 137 km in length, with a basin area of 2750 km2. The Jialu River has many tributaries, including the Jinshui River, Susuo River, Xiong’er River, Qili River, and the Dongfeng Canal.
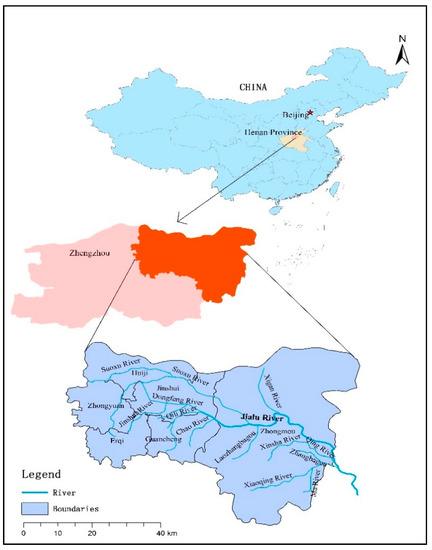
Figure 1.
Drainage map of the Jialu River in Zhengzhou.
The Jialu River is located in a warm, temperate, continental monsoon climate zone, with moderate warmth and four seasons. The annual average temperature of the Jialu River is 14.6 degrees Celsius, with a cold and wet winter, and a hot and dry summer. As the oldest river in Zhengzhou, the Jialu River has a history of over 4000 years. In recent years, the river’s water hydrologic cycle has been damaged by the high-speed economic development and continuous acceleration of urbanization in Zhengzhou, reflected by serious water environment deterioration and runoff pollution.
2.2. Index System
The pressure–state–response (PSR) framework was first proposed by Rapport and Friend in 1979, and is used in studies related to sustainable environmental development [31,32,33]. The PSR model explains the causal relationships and interactions among pressure, state, and response [34]. Applied to urban river health assessment, the PSR framework consists of three dimensions: the pressure subsystem, the state subsystem, and the response subsystem. It fully reflects the source of the pressures exerted on the health of urban rivers by social and economic development, the current state of urban river health, and the ways in which human activity responds to rivers. As such, it can provide a useful reference for policy makers in implementing river protection measures [35]. In this context, the urban river health pressure subsystem refers to the pressures exerted by economic growth and human intervention on river ecosystems. The state subsystem reflects changes in the nature and the function of an urban river generated by the pressures. The response subsystem largely reflects the series of environmental protection and governance strategies implemented in order to cope with urban river health issues, and to realize the sustainable development of human society. Following existing research [36], the PSR urban river health framework is shown in Figure 2.
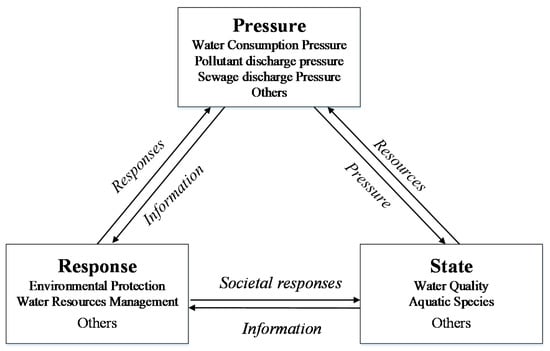
Figure 2.
The pressure–state–response (PSR) framework to assess urban river health.
The evaluation index system of urban river health used in the current study was constructed in line with the PSR model. A total of 20 evaluation indexes were determined after considering the situation of socio-economic development in Zhengzhou and the water environment of the Jialu River. The indexes (P1–P8) were mostly selected in light of pollutant discharge intensity, water resource utilization, and sewage discharge in the area. The indexes (S1–S6) were mainly determined from the aspects of river water quality, aquatic species, and stability. The indexes (R1–R6) were mainly set according to the dynamic response of human activity. With reference to related research results [37,38,39,40,41,42], the urban river health evaluation index system of the Jialu River is shown in Table 1.

Table 1.
Urban river health evaluation index system.
Urban river health is a relative fuzzy and dynamic concept; thus, it is crucial to determine the health grade in urban river health assessments, as this is the standard for assessing urban river health. However, there is currently no consistent standard [22], because it varies depending on human needs at different periods. As such, it was necessary to define the health level standard of the evaluation index. Following previous research [43,44,45,46] and the environmental quality standards for surface water [47], the health standards of all indexes were categorized into the following five grades: (I) healthy; (II) sub-healthy; (III) unhealthy; (IV) sick; and (V) very sick. The health standards of all indexes are presented in Table 2.

Table 2.
Health grade standard for the evaluation index.
2.3. Data Sources
In this study, the data of the river monitoring section located in Chen Bridge, Zhongmou County, was used to assess the health of the Jialu River in Zhengzhou. The index data related to water quality and water quantity were obtained from the Henan Water Resources Bulletin (2008–2017) [48]. The index data related to the river’s hydrology state and water environment were drawn from the River Basin Management Department of Zhengzhou City.
2.4. Improved Fuzzy Matter-Element Extension Model
Extenics was first proposed by the Chinese scholar Cai Wen in 1983 [49]. Extenics forms the basis of the matter-element analysis theory. The fuzzy matter-element extension model, combined with fuzzy matter-element theory and with an extension set, are used to analyze the possibility and regularity of an object. As a formal and quantitative solution, the matter-element extension model is often used in multi-index assessments and to solve incompatible complex problems [50,51]. Urban river health is a complex and relative fuzzy concept, and the classification standards vary according to the different evaluation indexes. The fuzzy matter-element extension model can be utilized to deal with the incompatibility among the indexes. The index system for urban river health evaluation covers 20 evaluation indexes (see Table 1). The relative importance of these evaluation indexes is different in the overall evaluation. A way to distinguish the importance of the indexes is by assigning them different weights [52]. The traditional fuzzy matter-element extension model usually employs subjective assignment methods to determine weights, such as the analytical hierarchy process (AHP) method and the expert scoring method [38]. These methods determine the index weight values by evaluating the degree of importance of each indicator in a subjective way, which underlines the subjective judgment of the decision makers. The result neglects the data information of the indexes [53]. In order to reduce this subjectivity, the improved FMEM presented in this paper introduces the entropy method to calculate the index weights.
As a method of objectively determining weights, the entropy method has a strong objectivity and operability, and has been widely used in environment science [54]. The entropy method relies on mathematical theory to calculate the weight of each index. According to the basic principle of information theory, entropy can measure the information contained in the index data and reflect the importance of different indexes [55]. The entropy theory believes that when the information entropy of the indicator is greater, the amount of information provided by the indicator is greater; the role of the indicator in the comprehensive evaluation should then be more important, and the entropy weight should be greater [56]. The entropy method can directly utilize the raw data of the index to calculate the entropy weight of the index. Compared with AHP method and expert scoring method, the entropy method can determine the index weight using the measured value of the index, which can eliminate anthropogenic interference caused by these traditional weight assignment methods. The weights calculated by the entropy method can distinguish the importance of different indicators more objectively.
According to the entropy theory, the entropy method can be used to determine the weight of each index and provide a basis for multi-index comprehensive evaluation [57]. The entropy method is seen as a more objective method that can eliminate human interference when calculating weights [58]. The improved FMEM utilizes the entropy method to calculate the weight of each index, thus overcoming the subjectivity of the traditional model. In the current study, the state of urban river health was evaluated by using the improved model, taking the following steps:
(1) Determination of the index entropy weight.
- Normalization of the index value. Given the differences in the scope of the selected indexes, the raw data of the indexes needed to be normalized before analyzing the indexes, in the following way:where represents the evaluation index, ; refers to the evaluation year, ; and represent the number of indicators and the number of years surveyed, respectively; is the initial value of the index in -th year; and is the normalized value of .
- Calculation of the information entropy of the index.where is the information entropy of the index .
- Calculation of the entropy weight of the index.where is the entropy weight of the index .
(2) Determination of the fuzzy matter-element matrix of urban river health assessment.
The matter-element theory posits that any assessment subject () be represented by matter name (), features (), and the measure values (), i.e., [59]. The matter-element refers to the ternary combination set composed of these three elements . According to this theory, a compound fuzzy matter-element of urban river health assessment () can be expressed by the urban river health assessment , evaluation indicators , …, , and the corresponding values of measure , , …, (indicator values). The fuzzy matter-element matrix of urban river health assessment can be expressed as follows:
where represents the evaluation indicator of urban river health, and represents the measured value of the evaluation indicators in -th year.
(3) Determination of the classical field.
The determination of the classical field is the basis for the urban river health evaluation. The classical field matter-element matrix consists of the evaluation indicators and the standard value ranges of indicators’ health grade. According to the classification of health grade (Table 2), the classical field includes five levels, namely, (I) healthy; (II) sub-healthy; (III) unhealthy; (IV) sick; and (V) very sick. The classical field matter-element of urban river health assessment can be expressed:
where represents the classical field matter-element of the evaluation level ( = I, II, III, IV, and V); refers to the standard value range of the index at the corresponding evaluation level ; and represent the lower limit and upper limit of the evaluation level , respectively; represents the standard value ranges of the index , …, at the evaluation level , that is, the classical field.
(4) Determine the correlation degree function.
The correlation degree function is used to reflect the health level of an urban river based on the matter-element theory. The character of the indexes in the different subsystems differs; that is, for the positive indicators (i.e., the state subsystem indexes S1–S6 and the response subsystem indexes R1–R6), the bigger the indicator value, the better the river health; for the negative indicators (i.e., the pressure subsystem indexes P1–P8), the smaller the indicator value, the better the river health. In order to unify the standards of the indicators, we needed to convert the indicators to dimensionless values. The correlation degree function has two different forms, which can be expressed as follows:
where is the relation degree of the index value in -th year. In accordance with previous research on the fuzzy matter-element extension model [6,51], represents the new threshold value between “very sick” and “sick”, and represents the new threshold value between “healthy” and “sub-healthy” in Table 2, respectively.
(5) Setting of the relation degree matrix .
The relation degree matrix is composed of the relation degree of the index values , , … in -th year. The relation degree matrix can be obtained:
(6) Calculation of the .
According to the matter-element extension theory [6,50,51], can be obtained from the entropy weight of the index and the relation degree matrix. The of the urban river health assessment in the present study was calculated by the following formula:
where refers to the urban river health integrated index in -th year. , and are the health integrated indexes of the pressure, state, and response subsystems in -th year, respectively; , and represent the relation degrees matrix of the pressure, state, and response subsystem indicators in -th year, respectively; and , and refer to the weight of the pressure, state, and response subsystem indicators, respectively.
(7) Setting of the standard.
The urban river health standard of the can be obtained by placing the converted health level threshold of each index into the improved FMEM.
3. Results and Discussion
3.1. Results
3.1.1. Entropy Weight
According to Equations (1)–(3), the index weights were calculated using the entropy model. The weight results of the index system for urban river health assessment are shown in Table 3.

Table 3.
Weight results of the index system for urban river health assessment.
As shown in Table 3, the weight of the pressure subsystem is the greatest, reaching 0.402. This means that the pressure subsystem is a core influential subsystem of this urban river’s health, and that the health of this system would thus directly affect the river’s health. The weight of the state subsystem is 0.297, which is the smallest. This subsystem thus has minimal impact on the health of the Jialu River. The weight of the response subsystem is 0.301; this means that this subsystem is an important factor in improving urban river health. The positive human response measures by NGOs and local authorities in China have had a major impact on the water environment. Thus, it is also necessary to focus on that subsystem.
In the indicator layer, the indicators of COD emission (0.051) and sewage discharge (0.05103) are considered to exert the greatest influence on the pressure subsystem. This means that the pressures on the health of the urban river mainly come from these two indicators. Water quality compliance rate (0.05106) and riparian vegetation coverage rate (0. 05104) have the largest weight values in the state subsystem. This means that these two indicators have the greatest impact on urban river health state. In the response subsystem, the indicators of rain and sewage diversion rate (R3), green space construction rate (R4), and rate of environmental protection investment to GDP (R6) have the most important impact. This implies that policy makers can improve the health state of urban rivers by improving the status of these three indicators.
3.1.2. Results of the Fuzzy Matter-Element Extension Model
According to the construction steps of the foregoing fuzzy matter-element extension model, the model construction result of the health evaluation of the Jialu River is as follows:
(1) Establishing the matter-element to be assessed.
where represents the health state of the Jialu River, and represents the measured value of index .
(2) Establishing the classical field matrix.
According to the matter-element extension theory, the classical field for the health of the Jialu River can be expressed in the following matrix form:
(3) Determination of the criterion of .
The criterion for the urban river health evaluation of the Jialu River was calculated by using the improved FMEM, as shown in Table 4.

Table 4.
Standard level of health status for the Jialu River.
(4) Obtaining the result of the Jialu River’s health.
The of the Jialu River was obtained from Equations (4)–(12). The river’s health condition from 2008 to 2017 was assessed by comparing the river’s with the standard . The and the health grade of the Jialu River from 2008 to 2017 are shown in Table 5.

Table 5.
and health grade of Jialu River.
3.2. Comprehensive Evaluation of the Jialu River’s Health
The health conditions of the Jialu River were evaluated in light of the results; the change trends of these conditions are illustrated in Figure 3, which demonstrates that the value of Jialu River has been increasing steadily during the study period, with the value increasing from 0.393 in 2008 to 0.804 in 2017. It is worth nothing that the value in 2017 is two times greater than that in 2008, indicating that the Jialu River’s health level gradually improved from 2008 to 2017. From 2008 to 2014, the values were less than 0.689, indicating that the Jialu River was in an unhealthy state during the period of 2008–2014. In 2015, the value increased to 0.701, which was more than 0.689. This means that the Jialu River’s was in a sub-healthy state in 2015. The values had increased in both 2016 and 2017, representing an improved health state. The river was in a sub-healthy state in the last three years. In particular, the value underwent a significant increase of 0.081 in 2016. This was because in 2016, the Zhengzhou municipal government issued relevant policy documents on “Jialu River governance” and funded the water environment government project of the Jialu River. In the same year, Zhengzhou City was selected as a pilot city for the Sponge City scheme of the Henan Province. “Sponge City” is a new concept in urban stormwater management, which can effectively divert rain and sewage. Both measures have improved the river’s water environment.
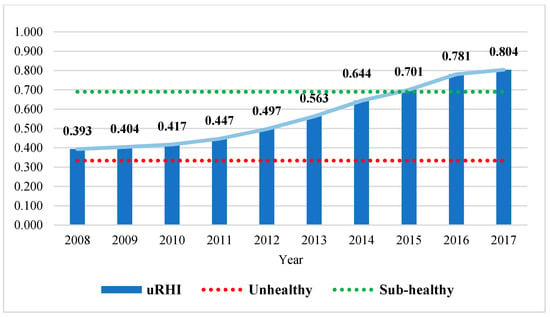
Figure 3.
The urban river health index (uRHI) trend of Jialu River from 2008 to 2017.
3.3. Assessment of Different Subsystems
3.3.1. Assessment of the Pressure Subsystem
Figure 4 shows the trends of the , which represent the change trends in the health condition of Jialu River’s pressure subsystem. Here, the values show an upward trend of fluctuation over the period of 2008–2017. Specifically, the shows a downward trend, decreasing from 0.545 in 2008 to 0.502 in 2010, and then an upward trend, increasing from 0.524 in 2011 to 0.851 in 2017. This indicates that the pressures exerted on the Jialu River’s health rose in 2008 and 2010, but decreased in other years. In 2010, the value of was the least, with 0.502. This means that the Jialu River had the worst health status, with the greatest pressure in that year. The health level of the river’s pressure subsystem remained in an unhealthy condition for the first six years, and was then in a sub-healthy condition from 2015 to 2017. It is worth noting that the value increased significantly in 2016, by 0.118, indicating that the health state of the pressure subsystem increased markedly in that year. As a whole, the value of the pressure subsystem increased.
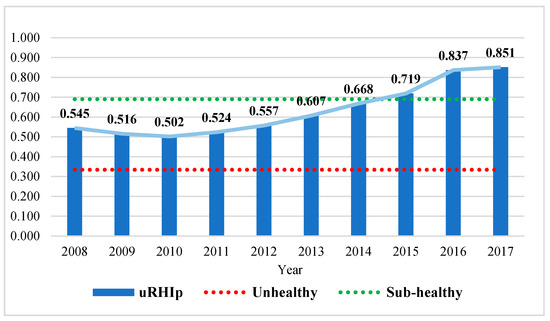
Figure 4.
Jialu River trend from 2008 to 2017.
The pressures affecting the health of the Jialu River mainly derived from: pesticide application intensity (P2), water consumption of industrial output (P5), COD emission (P7), and sewage discharge (P8). These are all negative indicators, where the smaller the value, the healthier the river. The declining value of these indicators shows that the health of the pressure subsystem improved. Figure 5 shows the comparison between the main index values and the index’s health standard values of the pressure subsystem. A comparison between the raw values and the standard values of the main indicators of the pressure subsystem is shown in Figure 5.
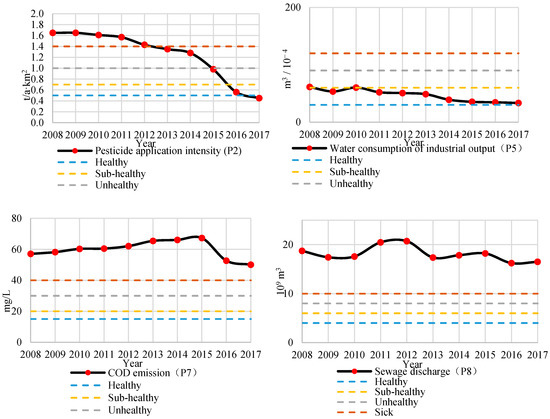
Figure 5.
Trends of the main indicators of the pressure subsystem from 2008 to 2017.
The indexes for pesticide application intensity (P2), water consumption of industrial output (P5), COD emission (P7), and sewage discharge (P8) showed a declining trend. The pesticide application intensity (P2) decreased by 0.45 tons per square kilometer, with the indicator showing a healthy state in 2017. The decline in the pesticide application intensity (P2) indicator values means that agricultural development has reduced its pressure on the Jialu River’s health. At the same time, the water consumption of industrial output (P5), one of the main indexes of the pressure subsystem, decreased to 33.4 cubic meters per 10,000 yuan from 2008 to 2017; this indicator has been in a sub-healthy state since 2011. Two other indicators, i.e., COD emission (P7) and sewage discharge (P8), show a clear fluctuating declining trend. The indicator of COD emission (P7) shows significant growth from 57.10 mg/L in 2008 to 67.3 mg/L in 2015, followed by a declining trend from 2015 to 2017. The sewage discharge (P8) indicator dropped from 18.7 hundred million cubic meters in 2008 to 16.5 hundred million cubic meters in 2017, while the river’s health condition was in a sick state at the study time. Both the indicators of COD emission (P7) and sewage discharge (P8) reflect the pressure exerted by the higher demand for water due to economic development. As an important developing city, both industrial and agricultural development in Zhengzhou are major factors affecting urban river health. Fortunately, the pressure of Zhengzhou’s economic and agricultural development on the Jialu River’s water environment has eased over the past ten years. As the findings of the current study imply, while the pressure on the Jialu River’s health may decrease in the future given the trend found in the current study, there is still room for improvement.
3.3.2. Assessment of the State Subsystem
Figure 6 shows the change trends of the health conditions of the Jialu River’s state subsystem. It can be seen that the state subsystem’s health showed an upward trend from 0.282 in 2008 to 0.762 in 2017. The values of were less than 0.334 during 2008–2009, greater than 0.334 and less than 0.689 from 2010 to 2015, and greater than 0.689 from 2016 to 2017. This means that the state subsystem’s health level varied significantly, ranking in the sick state for the first two years, then rising to the unhealthy state from 2010 to 2015, and finally remaining in a sub-healthy state for the last two years. These trends indicate that the state subsystem’s health may improve over the next few years. In particular, the indicators related to water ecosystems, the quality of the river water, and aquatic conditions were found to be moving in a healthier direction; these were the main elements contributing to the health of the state subsystem.
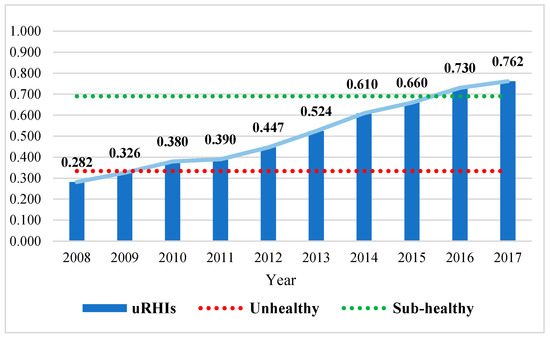
Figure 6.
Jialu River trend from 2008 to 2017.
The key indexes affecting the Jialu River’s state subsystem health were: the riparian vegetation coverage rate (S1), the water quality compliance rate (S3), the phytoplankton Shannon index (S4), and the fish diversity index (S5). These are all positive indexes, and the bigger the values, the better the health condition. The trends of the measured values of the main indexes in the state subsystem from 2008 to 2017 are shown in Figure 7.
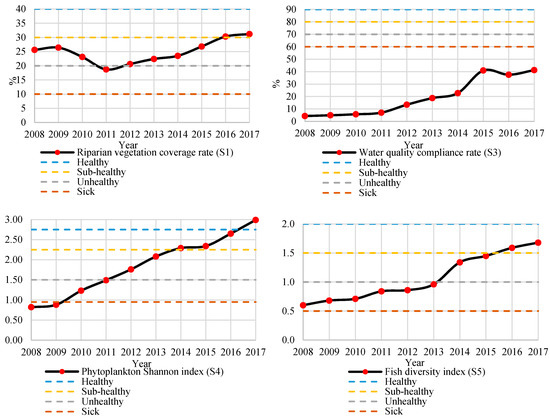
Figure 7.
Trends of the main indicators of the state subsystem from 2008 to 2017.
For the water ecosystem, the riparian vegetation coverage rate (S1) showed an upward, fluctuating trend with an inflection point in 2011, indicating a declining health from 2009 to 2011. The health level of the riparian vegetation coverage rate was on the rise in the other years. An increasing riparian vegetation coverage rate has a positive impact on river health, helping to enhance the river’s capability for conserving water and alleviating flooding. In terms of river water quality, the water quality compliance rate (S3) was found to be in a sick state in all years; however, the index values increased from 4.3% in 2008 to 41.2% in 2017, representing an increase of 9.6 times. This implies that there are great possibilities for the water quality compliance rate to develop towards a healthy state. In terms of aquatic conditions, both the phytoplankton Shannon index (S4) and the fish diversity index (S5) values steadily increased, the former from a sick state of 0.82 to a healthy state of 2.99, and the latter from an unhealthy state of 0.6 to a sub-healthy state of 1.68. Aquatic plants and organisms have a purifying effect on polluted water bodies, which can help to improve river water quality. In 2007, the government of China proposed the construction of an “ecologically civilized” city to solve outstanding water environmental problems. As the first pilot city for such construction, Zhengzhou actively responded to the country’s call, and the water environment of its urban rivers has significantly improved.
3.3.3. Assessment of the Response Subsystem
Figure 8 shows the changes in the health status of the response subsystem in the Jialu River. From Figure 6 and Figure 8, it can be seen that the overall trends of and the trends of are similar, i.e., upward-going. The value of gradually increased, with a significant growth trend, from 0.301 in 2008 to 0.783 in 2017. The health state of the response subsystem was sick in 2008 and 2009, unhealthy from 2010 to 2014, and finally moved to a sub-healthy level in 2017. This indicates that the response subsystem is shifting towards a healthier state. Based on the trends, it can be inferred that the response measures being implemented by humans are gradually working.
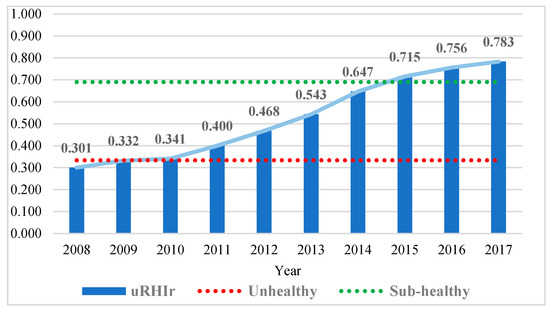
Figure 8.
Jialu River trend from 2008 to 2017.
The change trends of the main indexes in the response subsystem from 2008 to 2017 are shown in Figure 9. The indicators affecting the response subsystem health level of the Jialu River were deemed to be the following: rain and sewage diversion rates (R3), rate of green space construction (R4), annual construction rate of ecological embankments (R5), and rate of environmental protection investment to GDP (R6). These are all positive indicators, and the bigger the values, the better the subsystem’s health. The early rain and sewage diversion rates (R3) were much lower than the healthy grade. However, with the continuous development of rain and sewage diversion technology, and the construction of the “Sponge City”, the values of this index increased in the later period and attained a healthy level in 2017. In terms of ecological restoration measures, the rate of green space construction (R4) and the rate of environmental protection investment to GDP (R6) increased. The difference between them is that the rate of green space construction (R4) showed a steady upward trend, while the rate of environmental protection investment to GDP (R6) displayed a fluctuating uptrend, indicating that the treatment of the Jialu River’s water environment has been effective. The annual construction rate of ecological embankments (R5) increased from 45.2% in 2008 to 87.5% in 2017, thus moving from an unhealthy level to a healthy one. These indicators are important as they affect the health of the response subsystem. Based on the values, it can be inferred that the corresponding river governance measures are gradually taking effect.
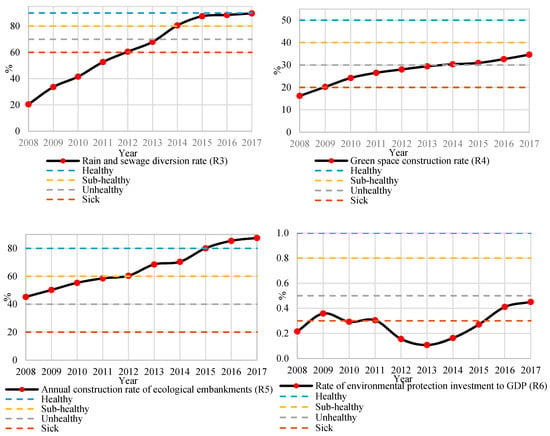
Figure 9.
Trends of the main indicators in the response sub-system from 2008 to 2017.
4. Conclusions
The urban river is a key basis of the urban water ecosystem. River health directly affects the sustainable development of a region and the health of urban residents’ lives. Developing appropriate evaluation methods for urban river health is, therefore, indispensable in urban sustainable development. Compared with the general evaluation model, the improved FMEM can effectively reflect objective facts, thereby providing a new approach for urban river health assessment. The PSR framework can display the source of the pressures exerted on urban rivers, the current health state of urban rivers, and the effectiveness of response measures, which can help policy makers easily understand urban rivers’ health state and formulate accurate measures in the future. This study combined the PSR framework with an improved FMEM to assess the health state of the Jialu River from 2008 to 2017. Overall, the health state of the Jialu River was found to have improved. The pressure, state, and response subsystems showed an upward trend and developed in a healthy direction from 2008 to 2017. However, the overall health level is still low. The protection of the water environment of the Jialu River should be further strengthened. According to the findings of this study, the following recommendations are proposed.
On the one hand, the local government should pay more attention to relieve the pressures on urban river health when formulating the new urban development plan. In order to relieve the pressures caused by rapid urban economic development and severe water environmental pollution, it is necessary to optimize the industrial structure, eliminate highly polluting factories, and develop a clean industry to reduce COD emissions and sewage discharge. In addition, the local government should improve water utilization efficiency to reduce water resource consumption.
On the other hand, the local government needs to further strengthen the response measures for urban river environmental restoration. The government can increase environmental protection investments to increase the construction area of green space. It is also necessary to vigorously develop both water environment treatment technologies and adequate rain and sewage treatment facilities to effectively separate rain and sewage. In addition, the government can improve the sewage treatment capacity by building more sewage treatment plants.
When using the improved FMEM to evaluate the health status of urban rivers, it is necessary to determine the health grade criteria for each indicator. They may vary due to the different evaluation periods and regions. The method used in this paper may be limited by the study period and region. Therefore, the assessment indicator criteria could be updated in future studies to meet the needs of various urban river regions. In addition, urban river health is a dynamic concept. It is important to obtain the dynamic parameter through the advanced monitoring method. Therefore, further study should focus on how to make a comprehensive evaluation of urban river health status by introducing the essential hydrodynamic parameters.
Author Contributions
K.Z.’s contribution was data collection and composition, and proposing the study ideas and the methods of the first draft. J.S., H.H., and Y.J. presented the revised suggestions to the paper.
Funding
This study was funded by the National Natural Science Foundation of China (No.71801130), the Foundation for Postgraduate Research and Practice Innovation Program of Jiangsu Province (No. KYCX18_0513) and Fundamental Research Funds for the Central Universities of China (No. 2018B714X14).
Conflicts of Interest
The authors declare no conflict of interest.
References
- Jia, Y.T.; Chen, Y.F. River health assessment in a large river: Bioindicators of fish population. Ecol. Indic. 2013, 26, 24–32. [Google Scholar] [CrossRef]
- Luo, Z.L.; Zuo, Q.T.; Shao, Q.X. A new framework for assessing river ecosystem health with consideration of human service demand. Sci. Total Environ. 2018, 640, 442–453. [Google Scholar] [CrossRef] [PubMed]
- Pan, G.; Xu, Y.; Yu, Z. Analysis of river health variation under the background of urbanization based on entropy weight and matter-element model: A case study in Huzhou City in the Yangtze River Delta, China. Environ. Res. 2015, 139, 31–35. [Google Scholar] [CrossRef] [PubMed]
- Zhai, X.; Zhang, Y.; Wang, X.; Xia, J.; Liang, T. Non-point source pollution modelling using Soil and Water Assessment Tool and its parameter sensitivity analysis in Xin’anjiang catchment, China. Hydrol. Process. 2014, 28, 1627–1640. [Google Scholar] [CrossRef]
- Song, Q.H.; Yang, Z.F. Thinking of integrated management of urban rivers in China. Adv. Water Sci. 2002, 13, 377–382. [Google Scholar]
- Xu, W.; Dong, Z.C.; Hao, Z.C.; Li, D.Y. River health evaluation based on the Fuzzy matter-element extension assessment model. Pol. J. Environ. Study 2017, 26, 1353–1361. [Google Scholar] [CrossRef]
- Scrimgeour, G.J.; Wicklum, D. Aquatic Ecosystem Health and Integrity: Problems and Potential Solutions. J. N. Am. Benthol. Soc. 1996, 15, 8. [Google Scholar] [CrossRef]
- Smith, M.J.; Kay, W.R.; Edward, D.H.D. AusRivAS: Using macroinvertebrates to assess ecological condition of rivers in Western Australia. Freshw. Biol. 2010, 41, 269–282. [Google Scholar] [CrossRef]
- Sylvain, D.; Statzner, B. Invertebrate traits for the biomonitoring of large European rivers: An assessment of specific types of human impact. Freshw. Biol. 2008, 53, 617–634. [Google Scholar]
- Schofield, N.J.; Davies, P.E. Measuring the health of our rivers. Water 1996, 5, 39–43. [Google Scholar]
- Petesse, M.L.; Siqueira-Souza, F.K.; Freitas, C. Selection of reference lakes and adaptation of a fish multimetric index of biotic integrity to six amazon floodplain lakes. Ecol. Eng. 2016, 97, 535–544. [Google Scholar] [CrossRef]
- Hering, D.; Feld, C.K.; Moog, O. Cook book for the development of a Multimetric Index for biological condition of aquatic ecosystems: Experiences from the European AQEM and STAR projects and related initiatives. Hydrobiologia 2006, 566, 311–324. [Google Scholar] [CrossRef]
- Deng, X.J.; Xu, Y.P.; Zhai, L.X.; Liu, Y.; Li, Y. Establishment and application of the index system for urban river health assessment. Acta Ecol. Sin. 2014, 34, 993–1001. [Google Scholar]
- Chen, K.; Chen, Q.W.; Yu, H.Y. Methods and prospects of index of biological integrity used for China river ecological health assessment. China Environ. Sci. 2018, 8, 1589–1600. [Google Scholar]
- Ladson, A.R. Development and testing of an Index of Stream Condition for waterway management in Australia. Freshw. Biol. 1999, 41, 453–468. [Google Scholar] [CrossRef]
- Dean, J.; Charles, B.; Helen, F. Preliminary testing of the Integrated Habitat Assessment System (IHAS) for aquatic macroinvertebrates. J. Limnol. Soc. S. Afr. 2006, 31, 14. [Google Scholar]
- Growns, I.; Rourke, M.; Gilligan, D. Toward river health assessment using species distributional modeling. Ecol. Indic. 2013, 29, 138–144. [Google Scholar] [CrossRef]
- Guan, B.; An, S.; Gu, B. Assessment of ecosystem health during the past 40 years for Lake Taihu in the Yangtze River Delta, China. Limnology 2011, 12, 47–53. [Google Scholar] [CrossRef]
- Xu, Z.H.; Xu, Y.P.; Zhang, Y.; Deng, X.J. Assessment of river health in urbanized area based on entropy weight and matter element model: A case study in Huzhou city at different stages of urbanization. Acta Sci. Circumstantiae 2014, 34, 3188–3193. [Google Scholar]
- Wu, Z.X.; Kong, M.; Cai, Y.J.; Wang, X.L.; Li, K.Y. Index of biotic integrity based on phytoplankton and water quality index: Do they have a similar pattern on water quality assessment? A study of rivers in Lake Taihu Basin, China. Sci. Total Environ. 2019, 658, 395–404. [Google Scholar] [CrossRef]
- Liu, Q.; Dong, Z.; Xu, W.; Fu, X.; Tan, J.; Chen, X.; Yang, G. Health Assessment of Luanhe River Based on Fuzzy Matter-element Model. Water Resour. Power 2014, 32, 47–55. [Google Scholar]
- Deng, X.J.; Xu, Y.P.; Han, L.F.; Yu, Z.H.; Yang, M.N.; Pan, G.B. Assessment of river health based on an improved entropy-based fuzzy matter-element model in the Taihu Plain, China. Ecol. Indic. 2015, 57, 85–95. [Google Scholar] [CrossRef]
- Chen, W.; Li, W.P.; Chai, H.C.; Hou, E.K.; Li, X.Q.; Ding, X. GIS-based landslide susceptibility mapping using analytical hierarchy process (AHP) and certainty factor (CF) models for the Baozhong region of Baoji City, China. Environ. Earth Sci. 2016, 75, 14. [Google Scholar] [CrossRef]
- Xie, J.X.; Cheng, C.T.; Chau, K.W.; Pei, Y.Z. A hybrid adaptive time-delay neural network model for multi-step-ahead prediction of sunspot activity. Int. J. Environ. Pollut. 2006, 28, 364–381. [Google Scholar] [CrossRef]
- Tchórzewska-Cieślak, B. Bayesian model of urban water safety management. Glob. Nest J. 2014, 16, 667–675. [Google Scholar]
- Liu, D.J.; Zou, Z.H. Water quality evaluation based on improved fuzzy matter-element method. J. Environ. Sci. 2012, 24, 1210–1216. [Google Scholar] [CrossRef]
- Zhao, Y.W.; Yang, Z.F. Integrative fuzzy hierarchical model for river health assessment: A case study of Yong River in Ningbo City, China. Commun. Nonlinear Sci. Numer. Simul. 2009, 14, 1729–1736. [Google Scholar] [CrossRef]
- Valis, D.; Zak, L.; Walek, A. Selected mathematical functions used for operation data information. In Safety, Reliability and Risk Analysis: Beyond the Horizon; CRC Press-Taylor & Francis Group: Boca Raton, FL, USA, 2014; pp. 1303–1308. [Google Scholar]
- Yang, D.; Mak, C.M. An assessment model of classroom acoustical environment based on fuzzy comprehensive evaluation method. Appl. Acoust. 2017, 127, 292–296. [Google Scholar] [CrossRef]
- Cai, W.; Guo, K.; Huang, Y. Matter element analysis and value engineering. J. Guangdong Univ. Technol. 1984, 1, 7–12. [Google Scholar]
- Wang, Q.; Li, S.Q.; He, G. Evaluating water resource sustainability in Beijing, China: Combining PSR model and matter-element extension method. J. Clean. Prod. 2019, 206, 171–179. [Google Scholar] [CrossRef]
- Huang, B.; Wei, N.; Meng, W. Marine biodiversity evaluation based on the pressure-state-response (PSR) model of Changhai County, Liaoning Province. Biodivers. Sci. 2016, 24, 48–54. [Google Scholar] [CrossRef]
- Wang, Q.; Li, S.Q.; He, G. Evaluating sustainability of water-energy-food (WEF) nexus using an improved matter-element extension model: A case study of China. J. Clean. Prod. 2018, 202, 1097–1106. [Google Scholar] [CrossRef]
- Wolfslehner, B.; Vacik, H. Evaluating sustainable forest management strategies with the Analytic Network Process in a Pressure-State-Response framework. J. Environ. Manag. 2008, 88, 1–10. [Google Scholar] [CrossRef] [PubMed]
- Zhao, Y.W.; Zhou, L.Q.; Dong, B.Q. Dai Health assessment for urban rivers based on the pressure, state and response framework—A case study of the Shiwuli River. Ecol. Indic. 2019, 99, 324–331. [Google Scholar] [CrossRef]
- Liu, N.N.; Liu, C.Z.; Xia, Y.Y.; Da, B.W. Examining the coordination between urbanization and eco-environment using coupling and spatial analyses: A case study in China. Ecol. Indic. 2018, 93, 1163–1175. [Google Scholar] [CrossRef]
- Feng, Z.; Zhang, J.; Wu, R.; Ma, Q.; Yang, J. Ecosystem health assessment based on DPSIRM framework and health distance model in Nansi Lake, China. Stoch. Environ. Res. Risk Assess. 2016, 30, 1235–1247. [Google Scholar]
- Xia, T.; Zhu, W.; Xin, P.; Li, L. Assessment of urban stream morphology: An integrated index and modelling system. Environ. Monit. Assess. 2010, 167, 447–460. [Google Scholar] [CrossRef]
- Liang, K.M.; Zhang, J.E.; Zhao, B.L.; Ye, Y.Q.; Kong, X.H. Review on the Application and Research of Ecological Riverbanks for Water Systems. Trop. Geogr. 2014, 89, 280–283. [Google Scholar]
- Singh, P.K.; Saxena, S. Towards developing a river health index. Ecol. Indic. 2018, 85, 999–1011. [Google Scholar] [CrossRef]
- Pinto, U.; Maheshwari, B. A framework for assessing river health in peri-urban landscapes. Ecohydrol. Hydrobiol. 2014, 14, 121–131. [Google Scholar] [CrossRef]
- Smith, M.W.; Bracken, L.J.; Cox, N.J. Toward a dynamic representation of hydrological connectivity at the hillslope scale in semiarid areas. Water Resour. Res. 2010, 46. [Google Scholar] [CrossRef]
- Wang, T.; Liu, S.; Qian, X.; Shimizu, T.; Dente, S.M.; Hashimoto, S.; Nakajima, J. Assessment of the municipal water cycle in China. Sci. Total Environ. 2017, 607, 761–770. [Google Scholar] [CrossRef] [PubMed]
- Zhang, S.; Fan, W.; Yi, Y.; Zhao, Y.; Liu, J. Evaluation method for regional water cycle health based on nature-society water cycle theory. J. Hydrol. 2017, 551, 352–364. [Google Scholar] [CrossRef]
- Dong, G.H.; Shen, J.Q.; Jia, Y.Z.; Sun, F.H. Comprehensive Evaluation of Water Resource Security: Case Study from Luoyang City, China. Water 2018, 10, 1106. [Google Scholar] [CrossRef]
- Amores, M.J.; Meneses, M.; Pasqualino, J. Environmental assessment of urban water cycle on Mediterranean conditions by LCA approach. J. Clean. Prod. 2013, 43, 84–92. [Google Scholar] [CrossRef]
- State Environmental Protection Administration. Environmental Quality Standards for Surface Water (GB3838-2002); State Environmental Protection Administration: Beijing, China, 2002.
- Water Resources Department of Henan Province. Henan Water Resources Bulletin (2008–2017); Water Resources Department of Henan Province: Zhengzhou, China, 2017.
- Cai, W. Extension theory and its application. Chin. Sci. Bull. 1999, 44, 1538–1548. [Google Scholar] [CrossRef]
- Liu, B.; Sun, F.H. Research on the Risk Assessment Method of PPP Project based on the Improved Matter Element Model. Sci. Iran. 2019, 39, 98–110. [Google Scholar] [CrossRef]
- Han, H.; Li, H.M.; Zhang, K.Z. Urban water ecosystem health evaluation based on the improved fuzzy matter-element extension assessment model: Case study from Zhengzhou City, China. Math. Probl. Eng. 2019, 2019, 1–14. [Google Scholar] [CrossRef]
- Xu, L.; Shen, J.; Marinova, D.; Gao, X.; Sun, F. Changes of public environmental awareness in response to the Taihu blue-green algae bloom incident in China. Environ. Dev. Sustain. 2013, 15, 1281–1302. [Google Scholar] [CrossRef]
- Lirn; Thanopoulou, H.A.; Beynon, M.J.; Beresford, A.K.C. An application of AHP on transhipment port selection: A global perspective. Marit. Econ. Logist. 2004, 6, 70–91. [Google Scholar] [CrossRef]
- Zou, Z.H.; Yun, Y.; Sun, J.N. Entropy method for determination of weight of evaluating indicators in fuzzy synthetic evaluation for water quality assessment. J. Environ. Sci. 2006, 18, 1020–1023. [Google Scholar] [CrossRef]
- Xie, T.; Wang, M.; Su, C.; Chen, W. Evaluation of the natural attenuation capacity of urban residential soils with ecosystem-service performance index (EPX) and entropy-weight methods. Environ. Pollut. 2018, 238, 222–229. [Google Scholar] [CrossRef]
- Qiu, Y.H. Management Decision Entropy and its Application; China Electric Power Press: Beijing, China, 2011. [Google Scholar]
- Han, B.L.; Liu, H.X.; Wang, R.S. Urban ecological security assessment for cities in the Beijing-Tianjin-Hebei metropolitan region based on fuzzy and entropy methods. Ecol. Model. 2015, 318, 217–225. [Google Scholar] [CrossRef]
- Delgado, A.; Romero, I. Environmental conflict analysis using an integrated grey clustering and entropy-weight method: A case study of a mining project in Peru. Environ. Model. Softw. 2016, 77, 108–121. [Google Scholar] [CrossRef]
- Li, B.; Yang, G.S.; Wang, R.R.; Hörmann, G. Dynamic water quality evaluation based on fuzzy matter-element model and functional data analysis, a case study in Poyang Lake. Environ. Sci. Pollut. Res. 2017, 24, 19138–19148. [Google Scholar] [CrossRef]
© 2019 by the authors. Licensee MDPI, Basel, Switzerland. This article is an open access article distributed under the terms and conditions of the Creative Commons Attribution (CC BY) license (http://creativecommons.org/licenses/by/4.0/).