Extreme Precipitation in China in Response to Emission Reductions under the Paris Agreement


Abstract
1. Introduction
2. Data and Methods
2.1. Emission Scenarios
2.2. Data Description
2.3. Extreme Precipitation Indices
2.4. Exposure and Avoided Impacts
3. Results
3.1. Changes in the Extreme Precipitation Indices
3.2. Changes in the Exposure to Precipitation-Related Extremes
3.3. Impacts Avoided in Low-Warming Scenarios
4. Discussion
5. Conclusions
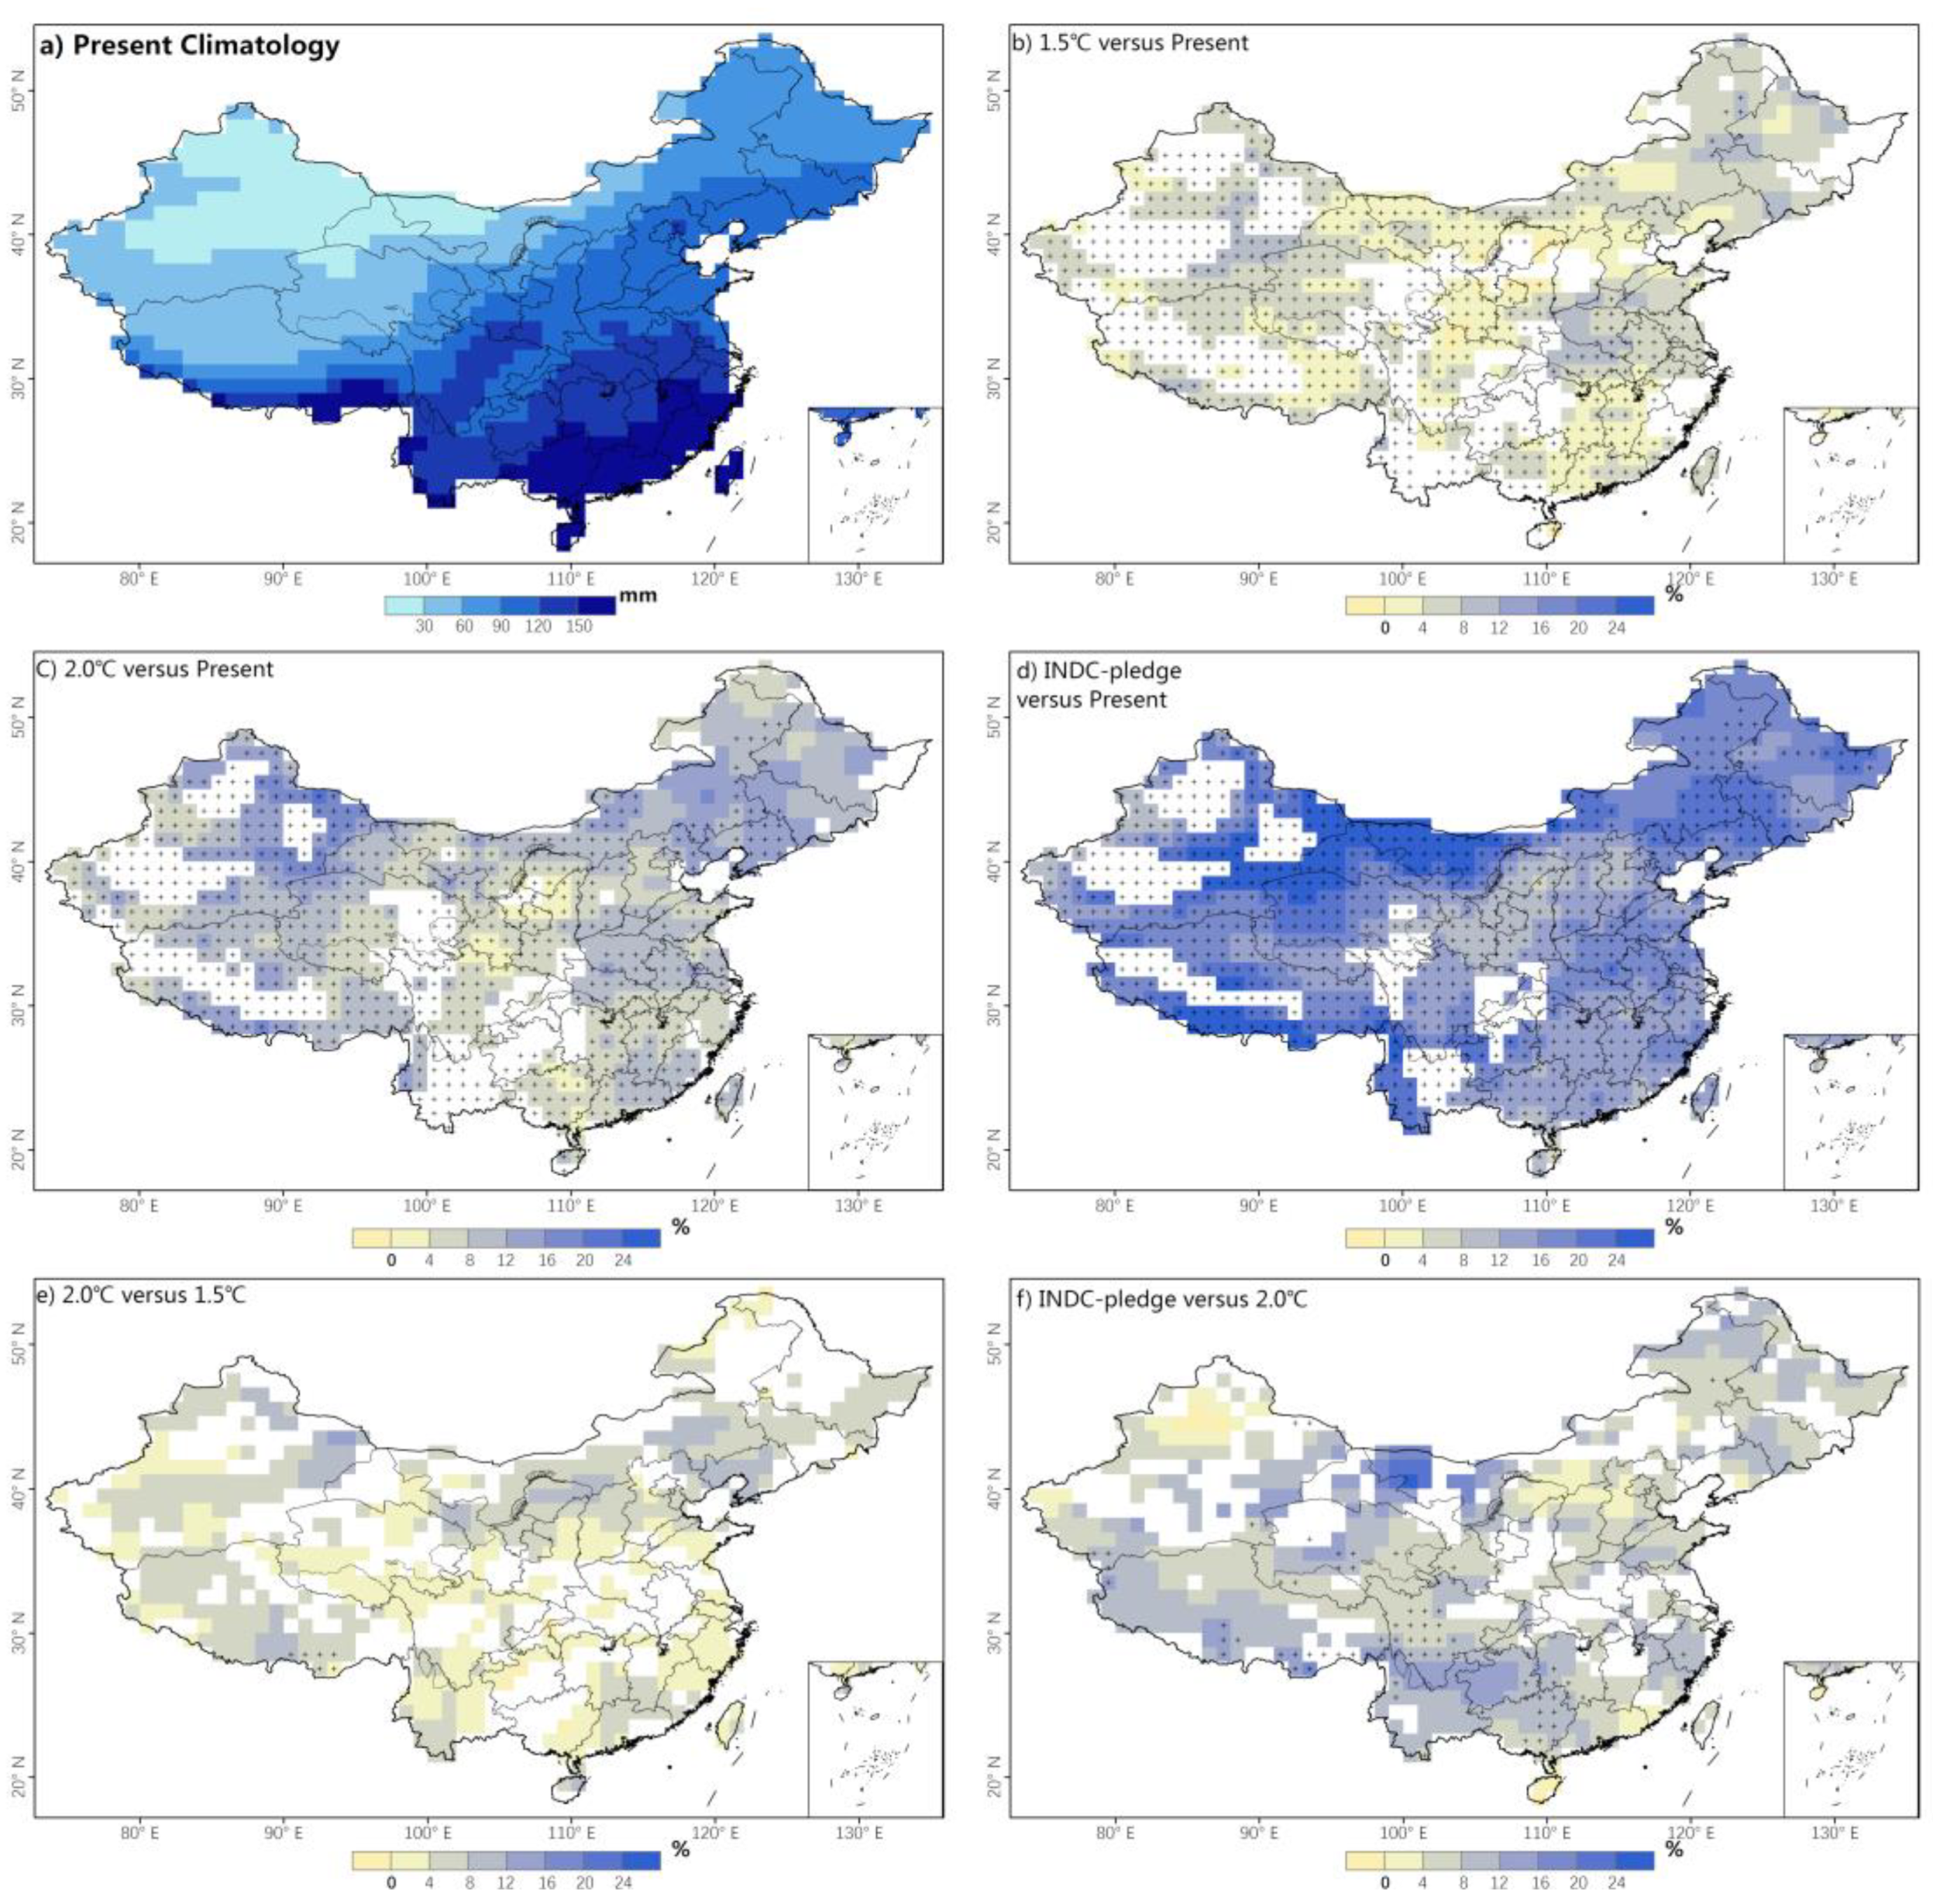
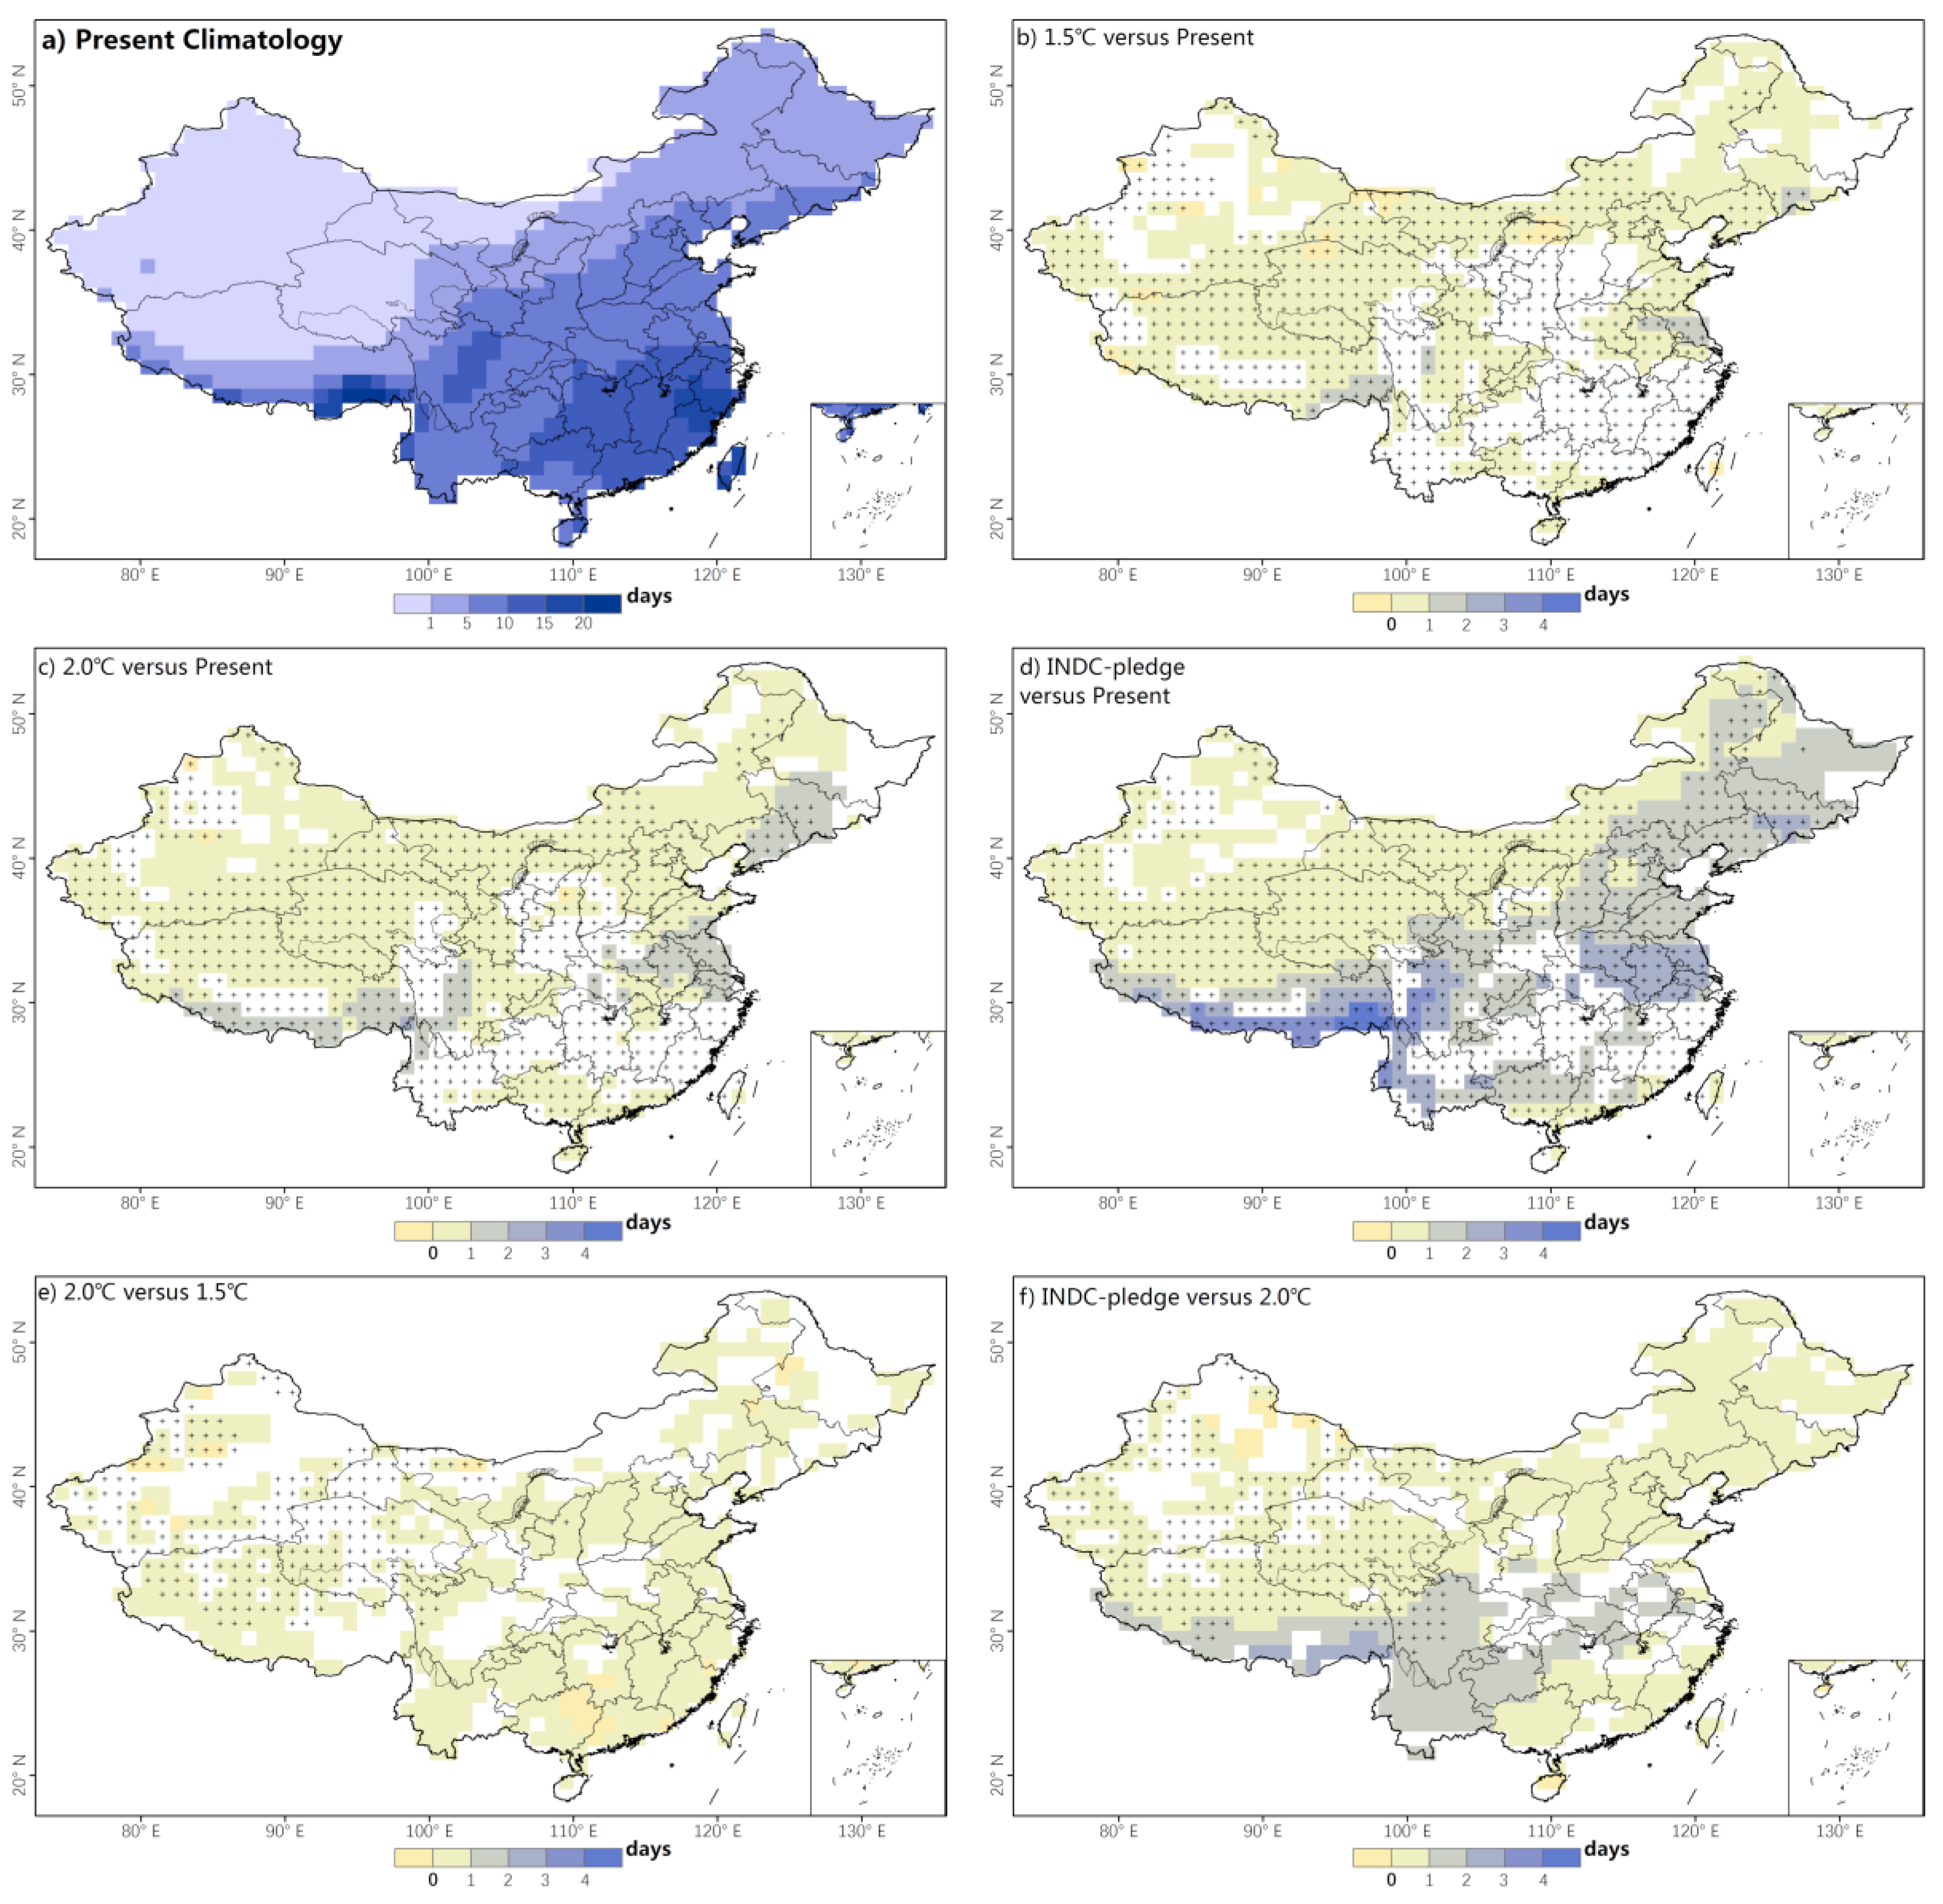
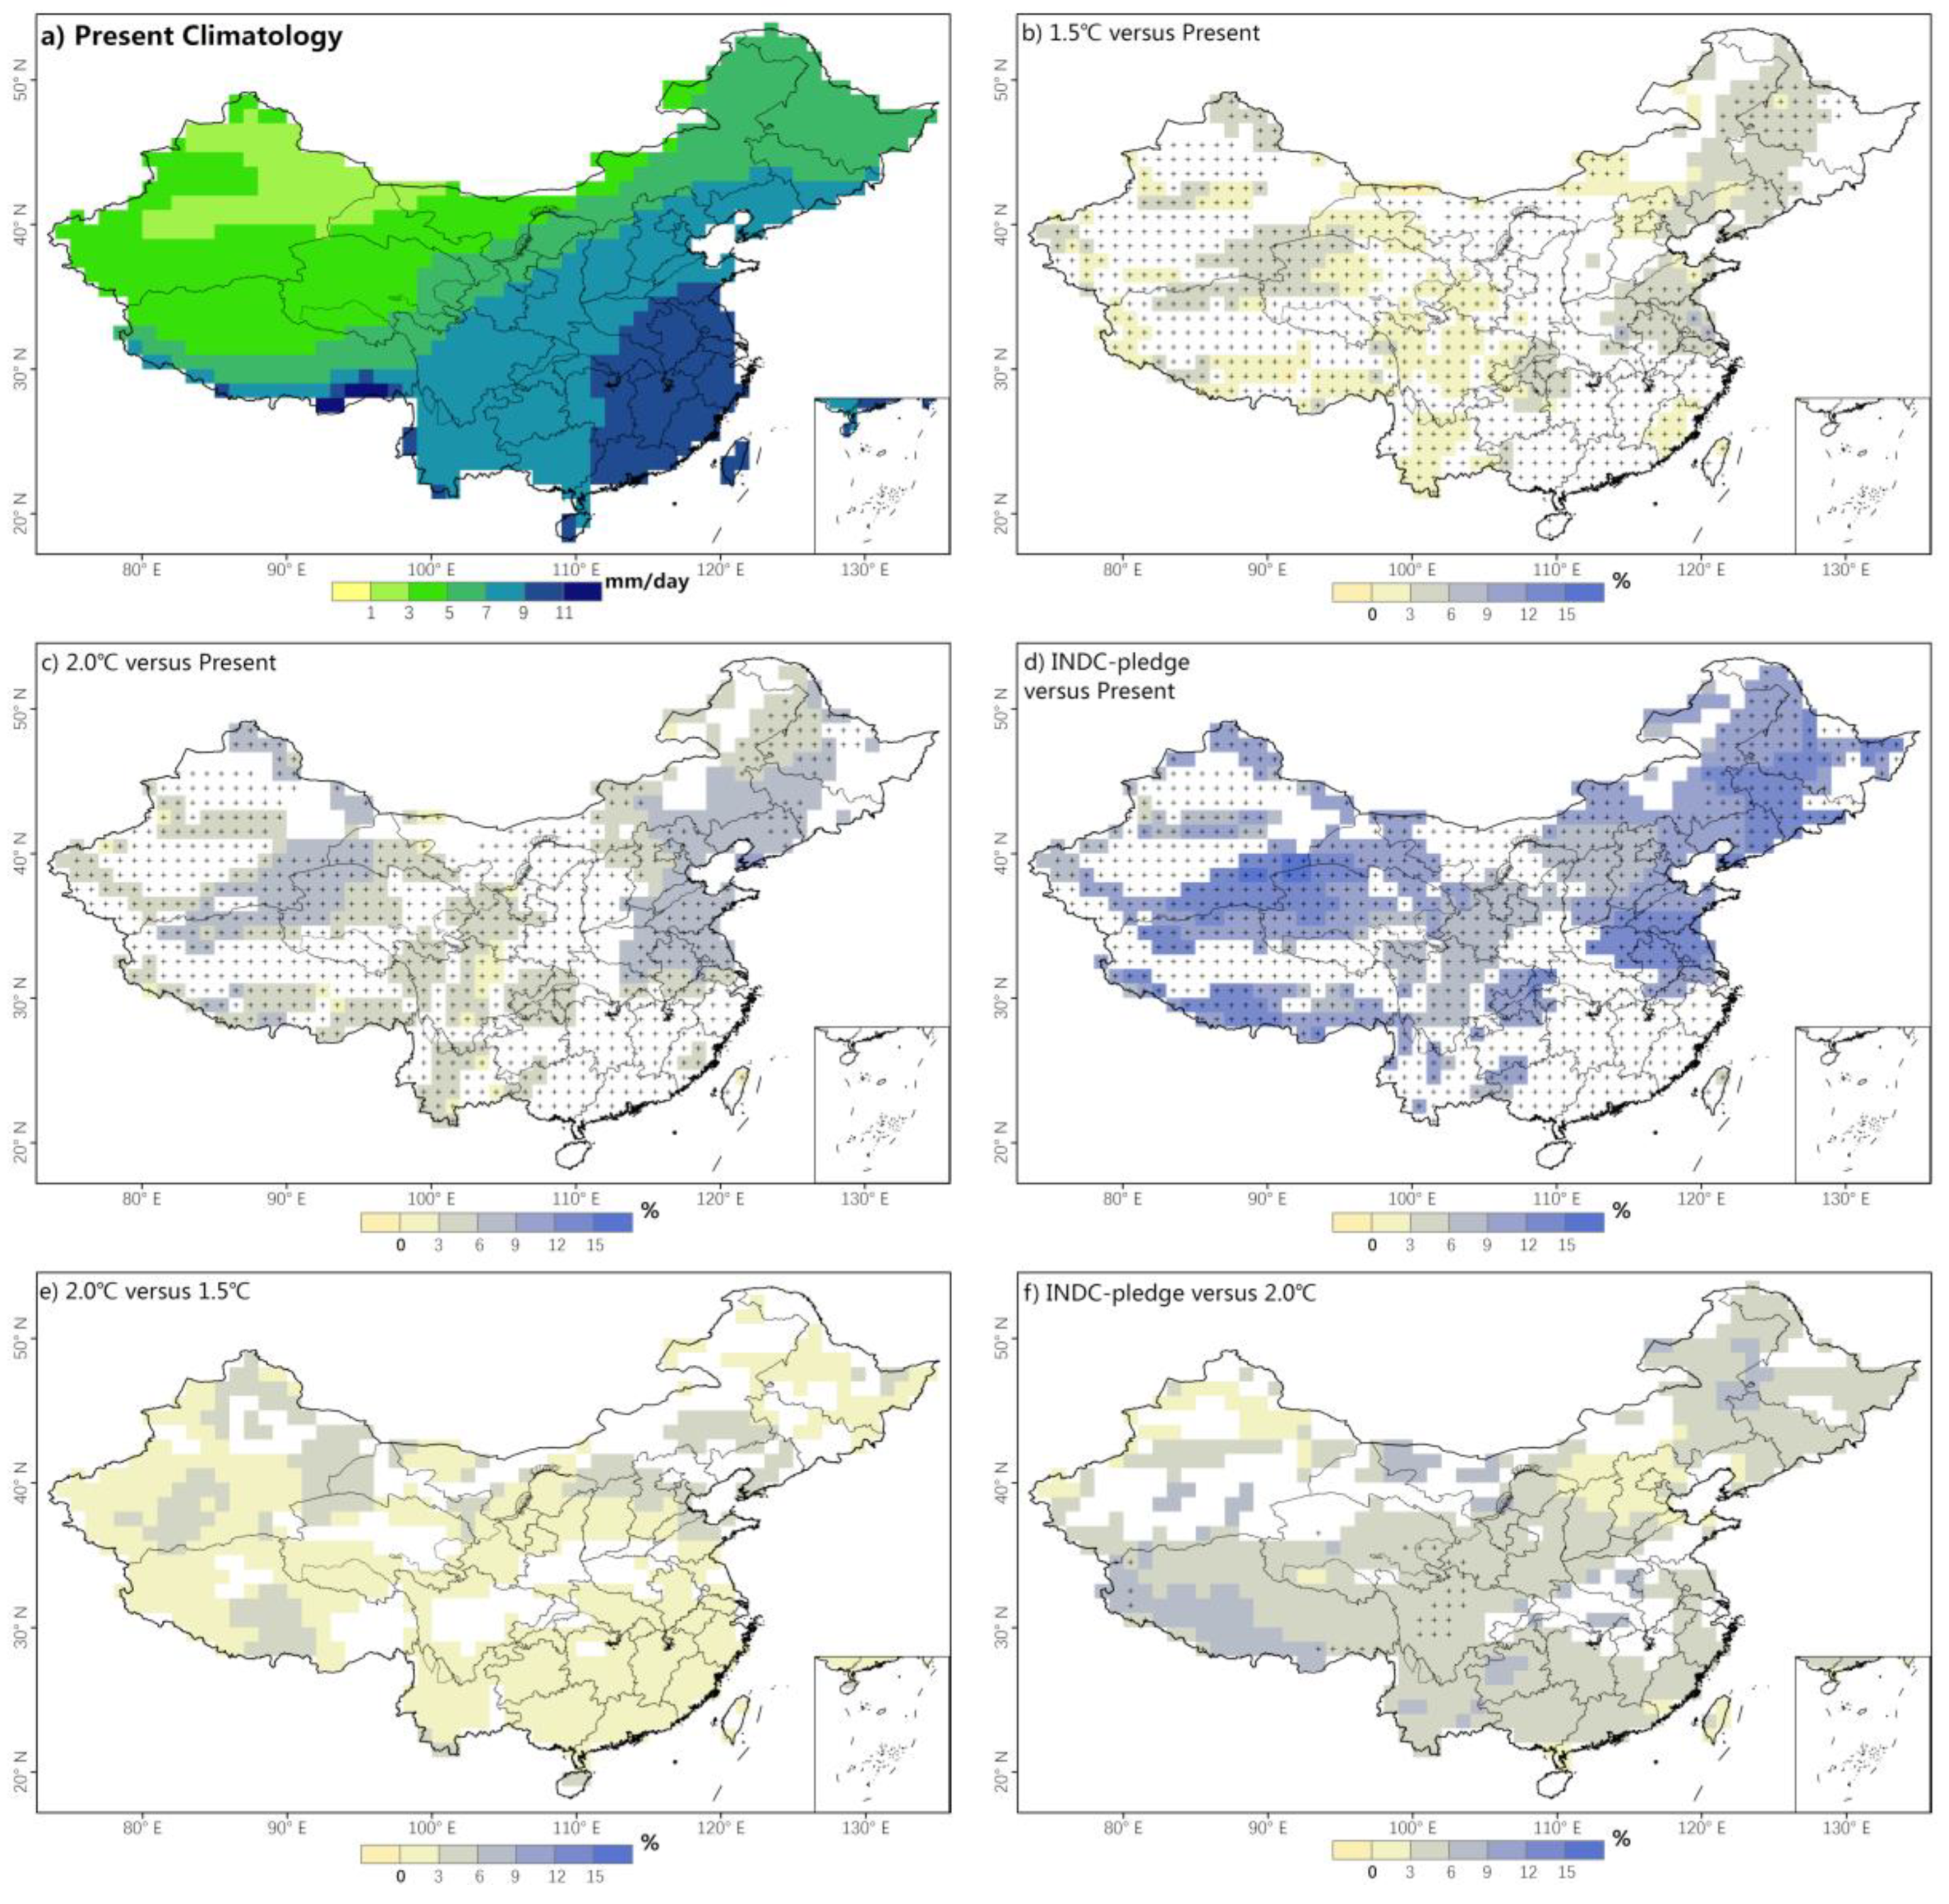
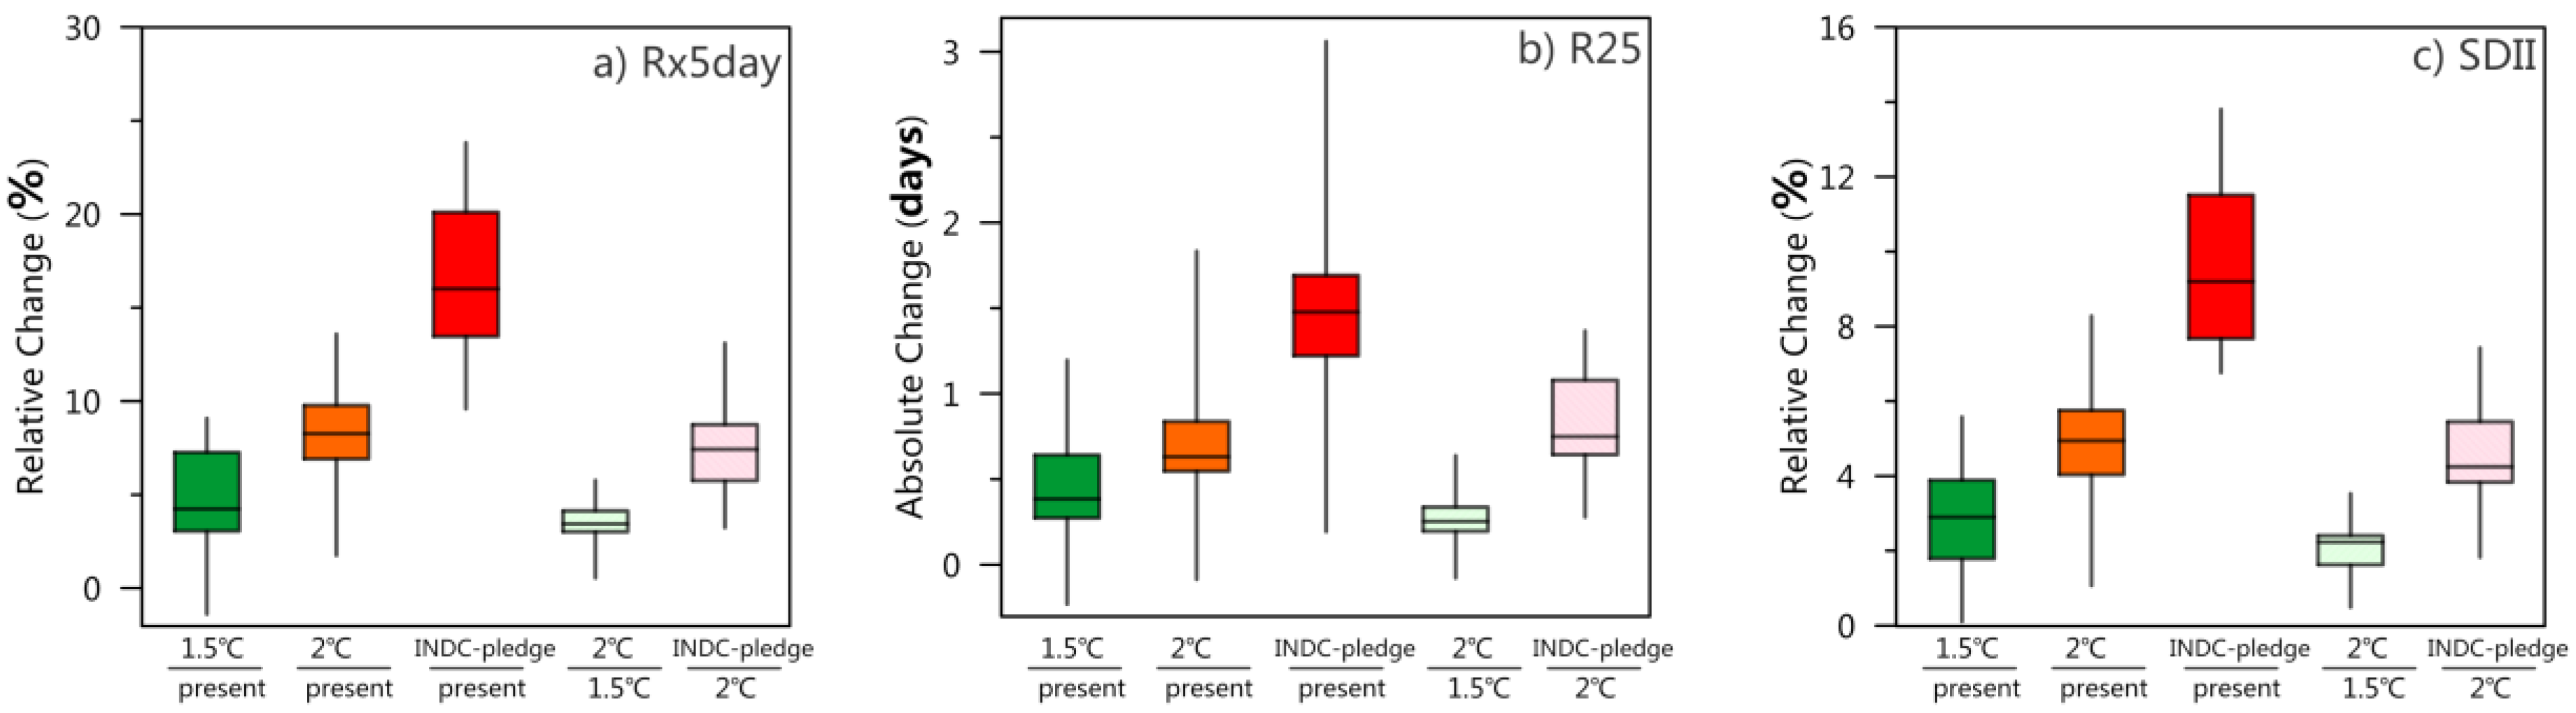
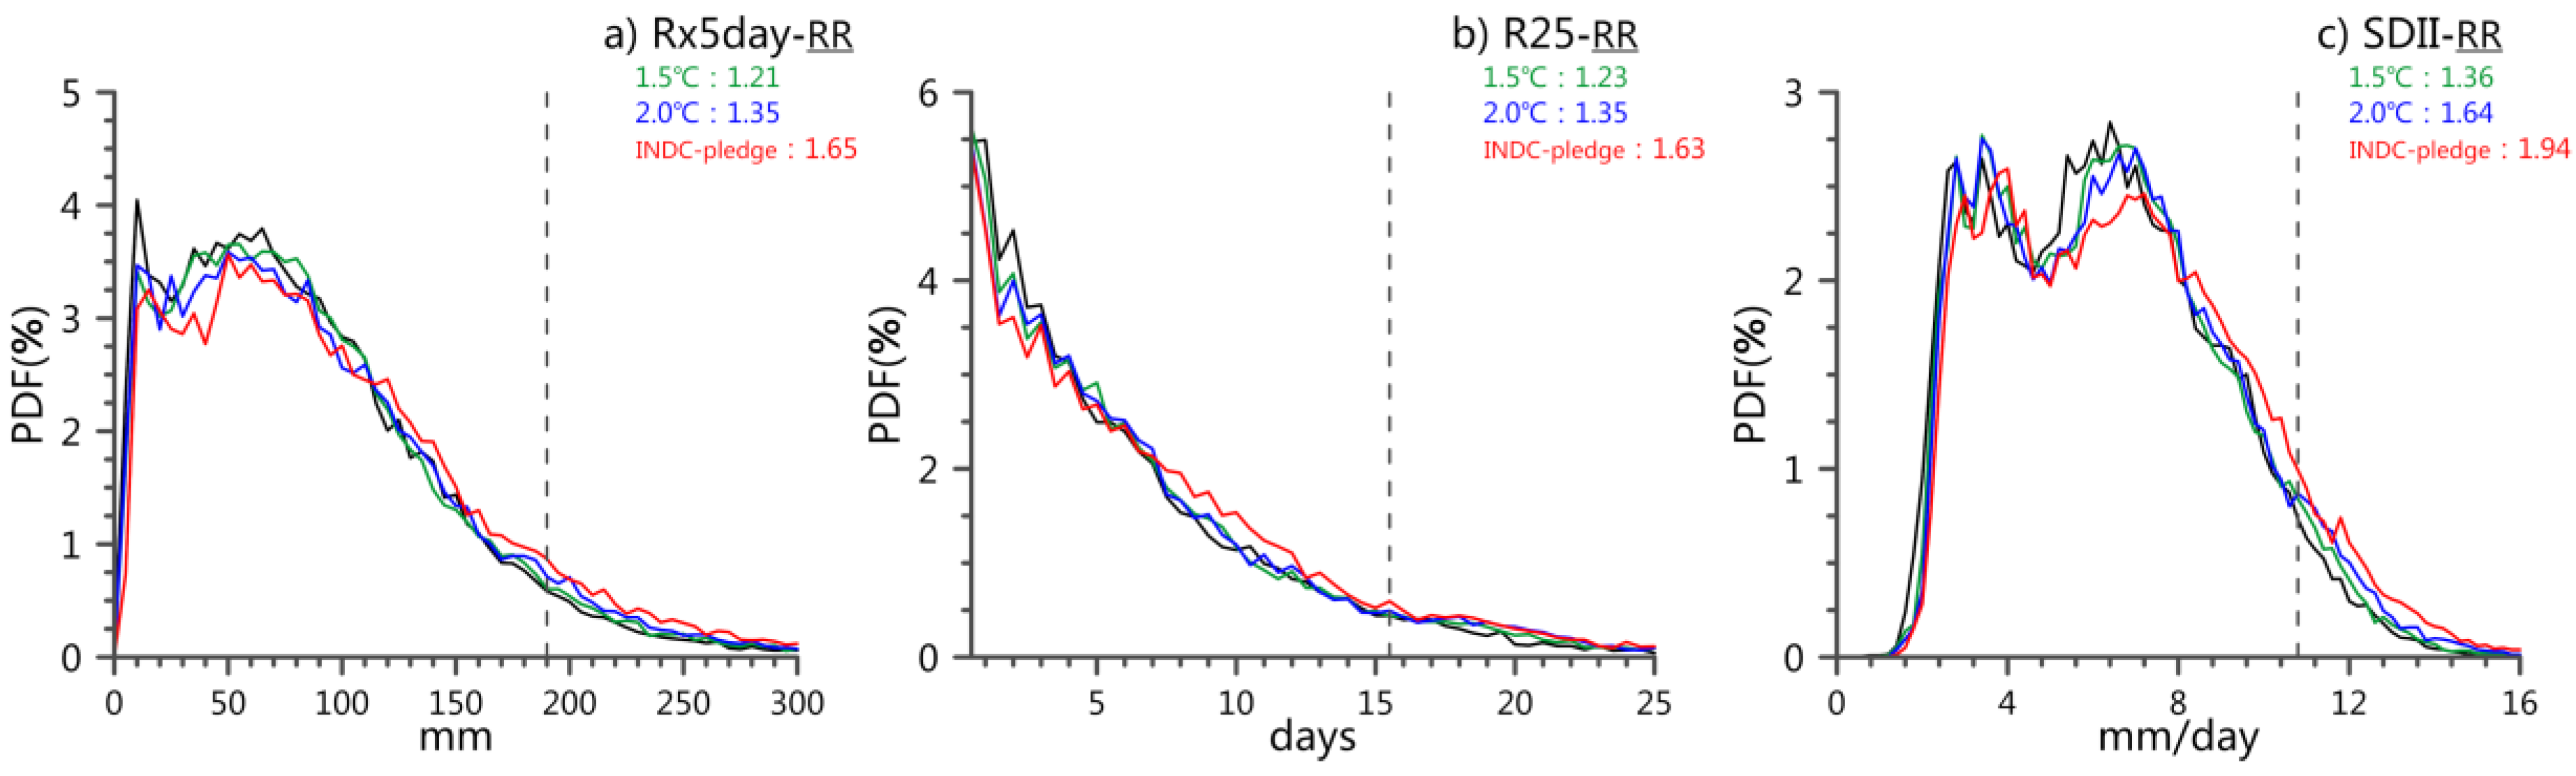
- With the enhancement of global warming, the intensity and frequency of extreme precipitation will gradually increase in most regions in China. Changes in the Rx5day are more prominent than those of SDII, while the spatial patterns are similar. The number of days during which the daily precipitation exceeds 25 mm (i.e., R25) increases in the monsoon area in eastern China. The probability distributions of extreme precipitation events are projected to become wider, resulting in the occurrence of more record-breaking heavy precipitation in China in the future despite the relatively small rise in the mean value.
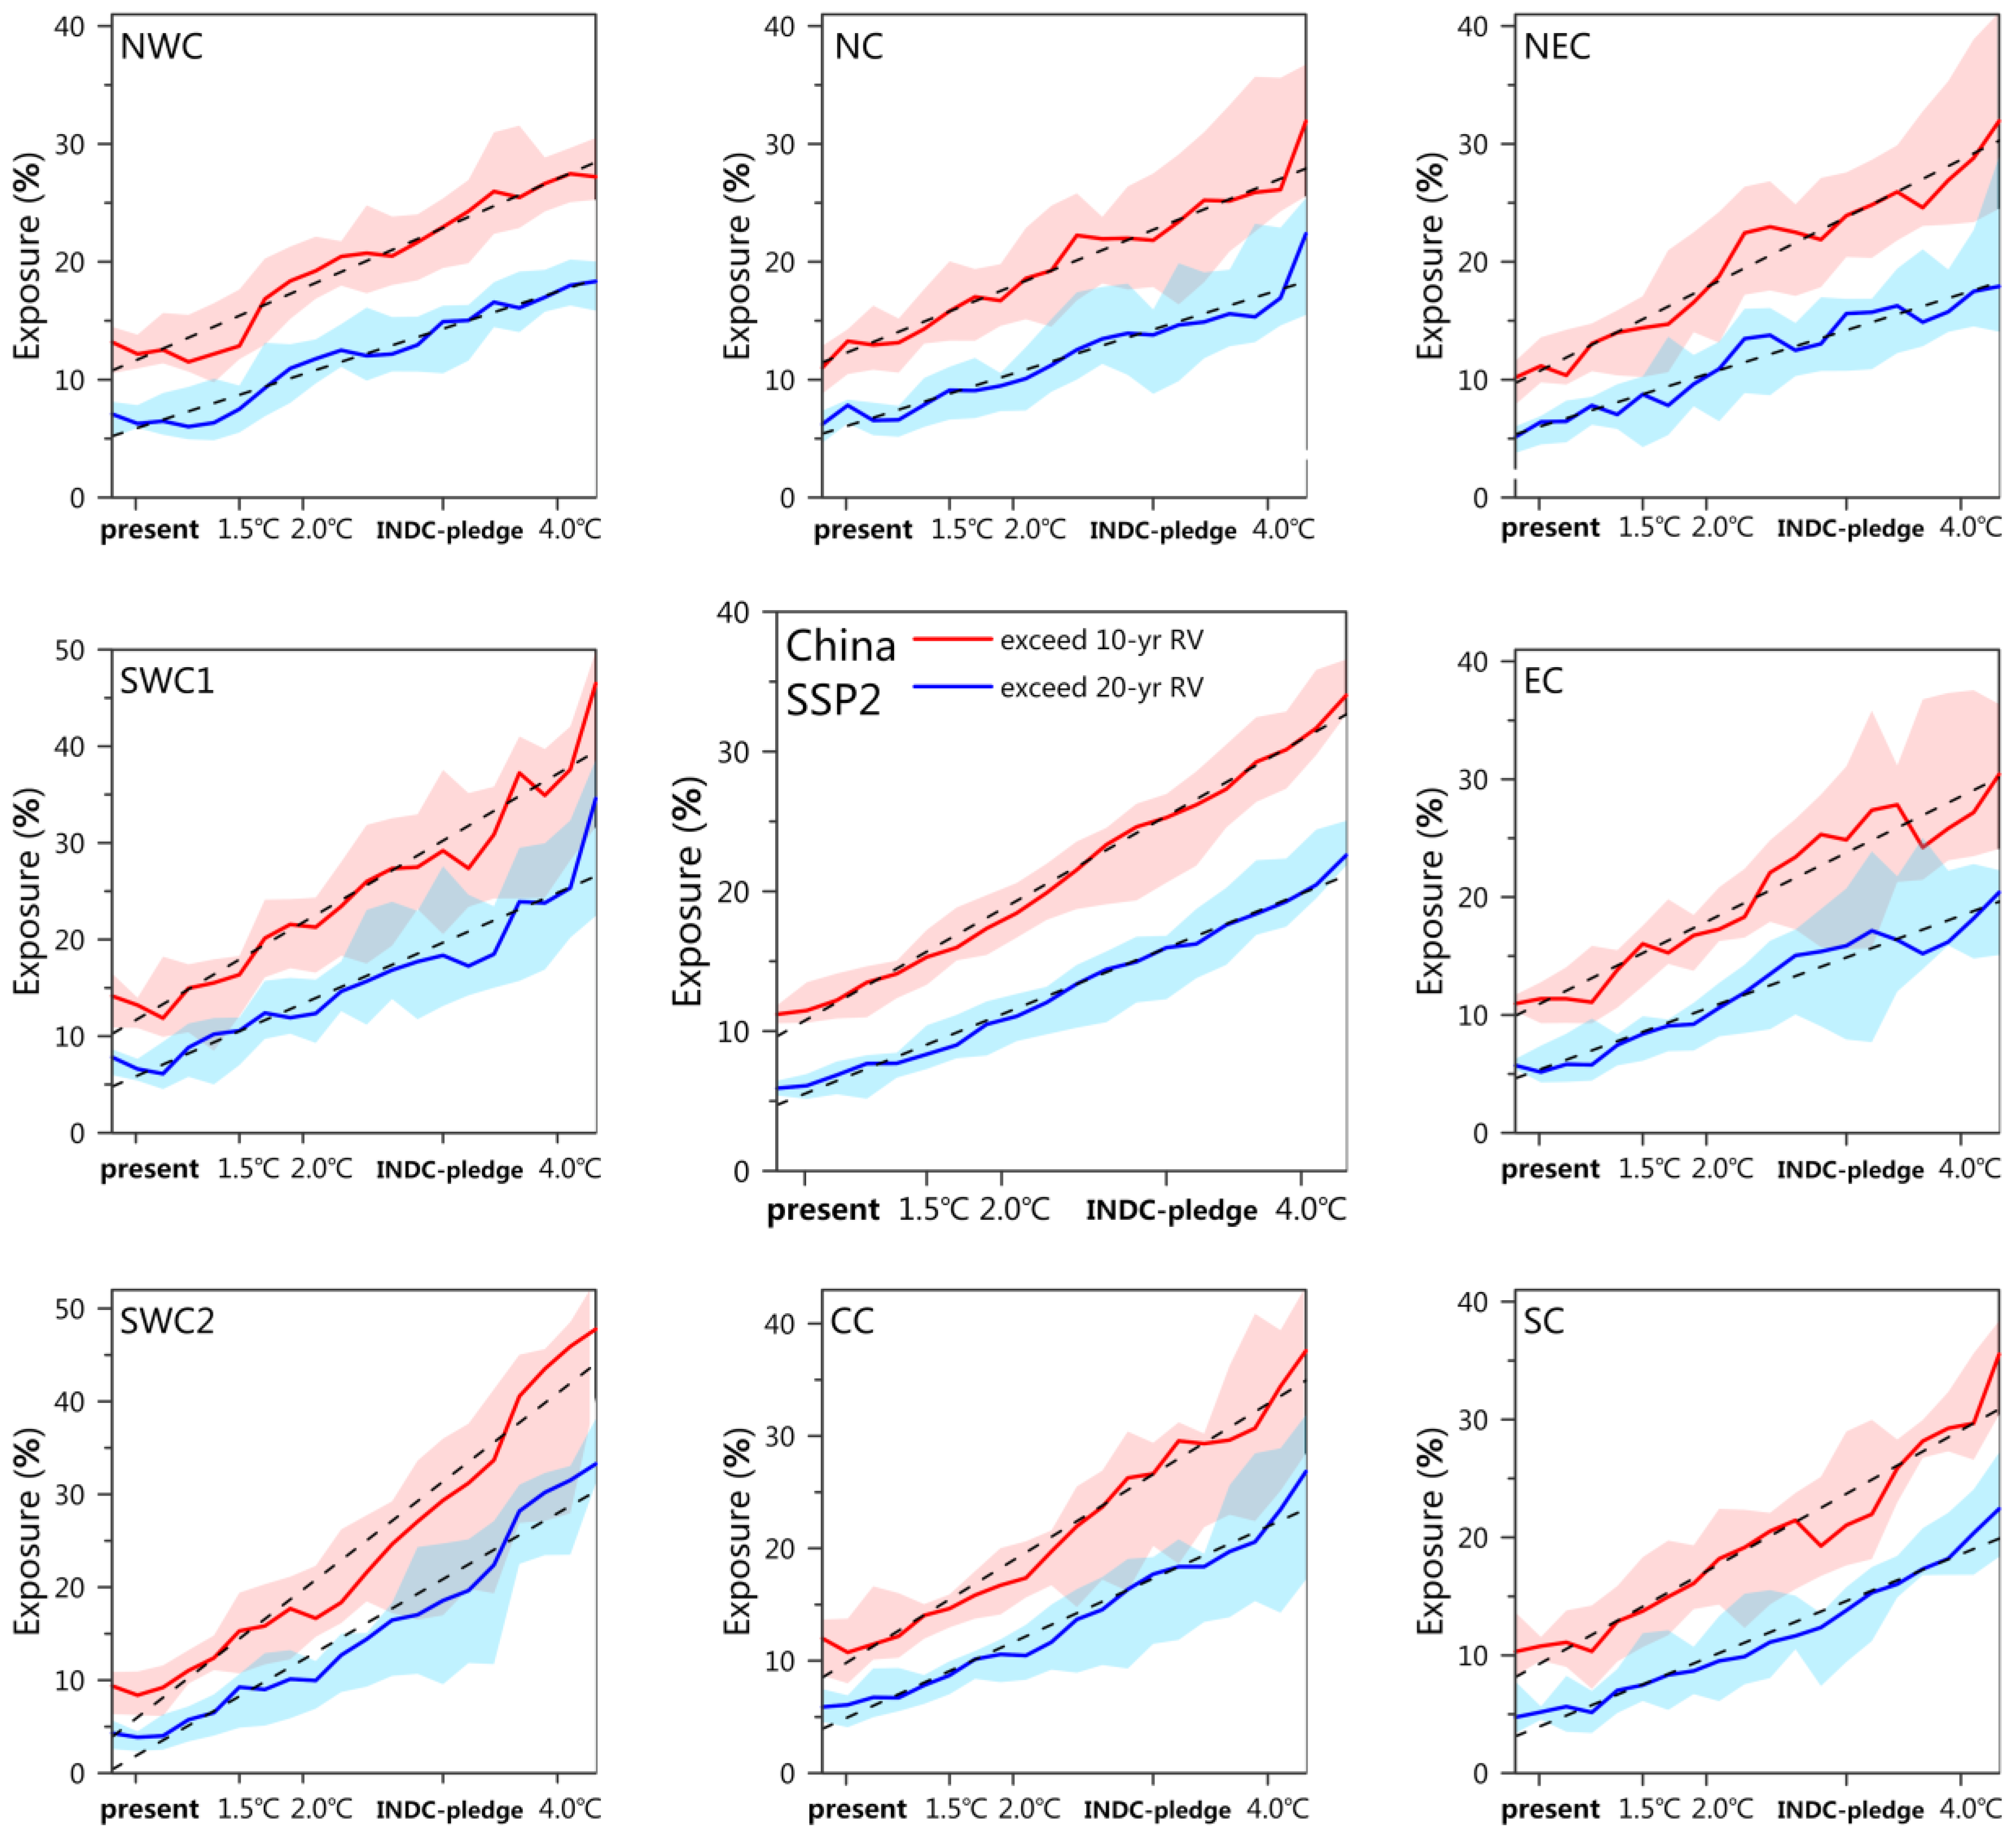
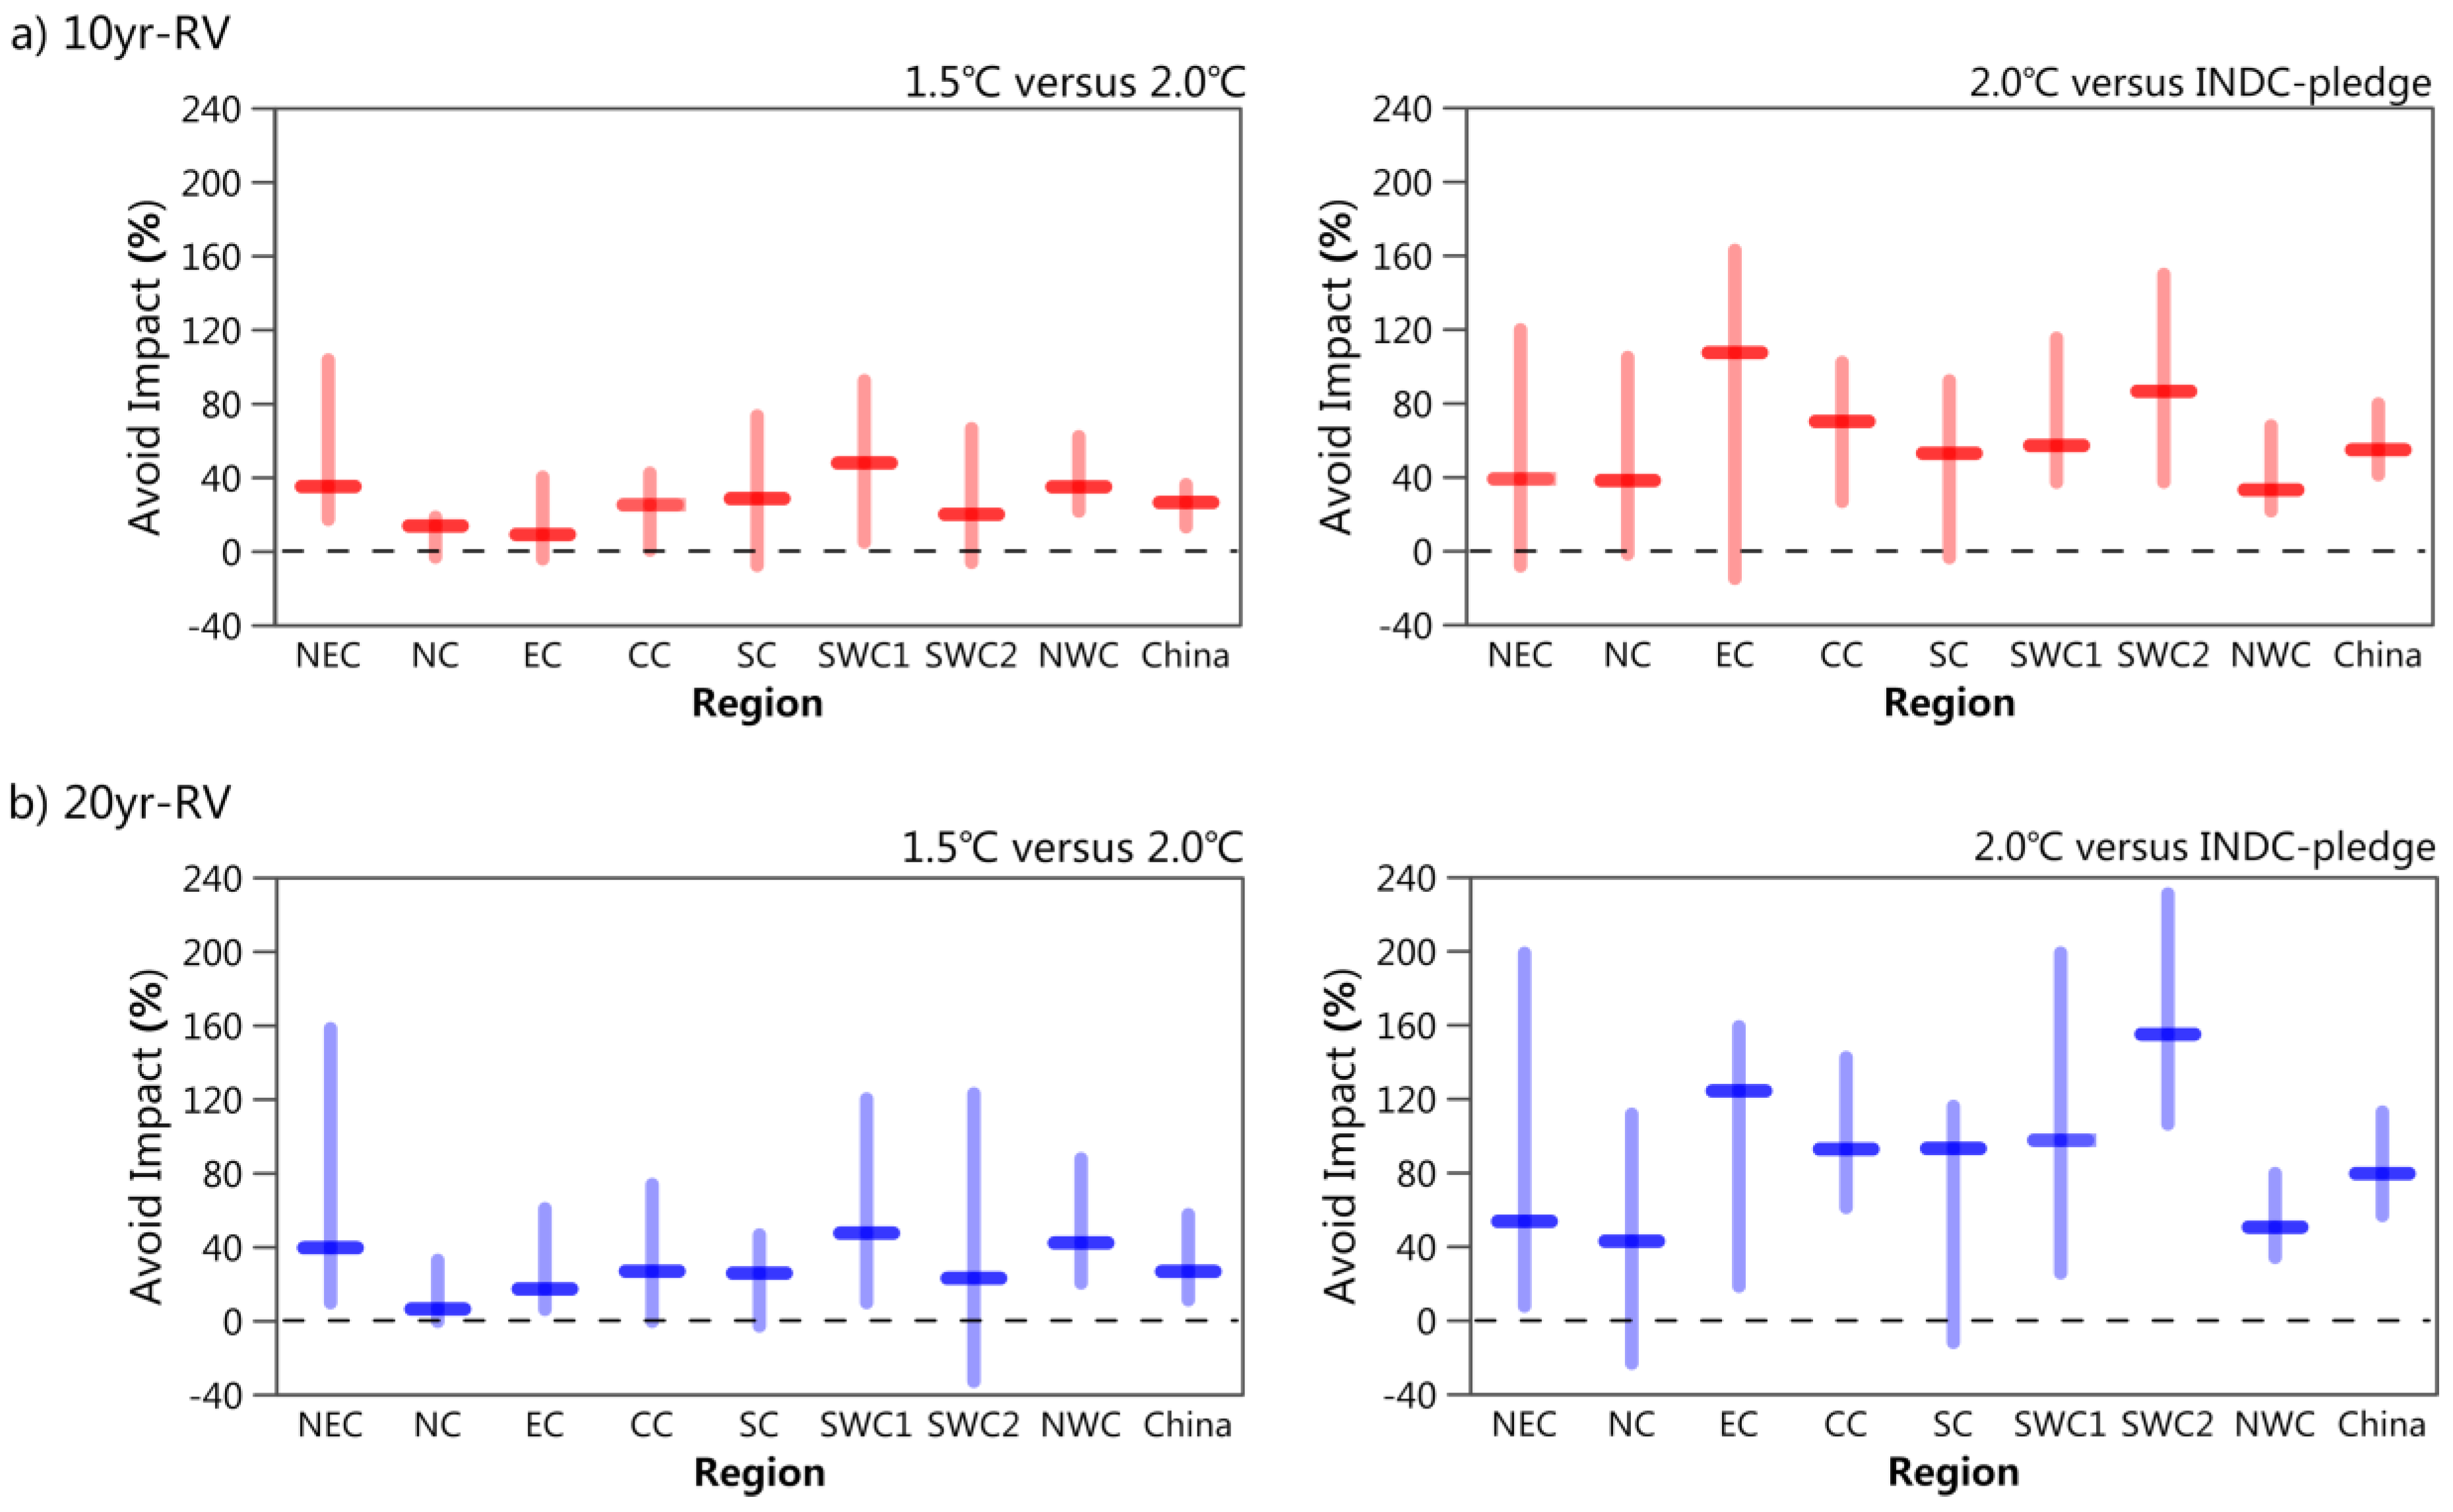
- The population exposure to dangerous (e.g., exceeding the 20-year RV) extreme precipitation events in China is projected to consistently increase because of climate change, following an approximately linear trend. Less warming would reduce the population exposure to once-in 20 years extreme rainfall events by 27% (12–58%; 1.5 °C versus 2.0 °C) and 57% (80–113%; 2.0 °C versus INDC), respectively. Our results improve the understanding of future risks associated with extreme precipitation, which is critical for the design of mitigation and adaptation policies in China, which is home to more than 1.4 billion people.
Supplementary Materials
Author Contributions
Funding
Acknowledgments
Conflicts of Interest
References
- Yin, H.; Changan, L.I. Human impact on floods and flood disasters on the Yangtze River. Geomorphology 2001, 41, 105–109. [Google Scholar] [CrossRef]
- Wang, K.; Wei, Y.M.; Ye, M. Beijing storm of July 21, 2012: Observations and reflections. Nat. Hazards 2013, 67, 969–974. [Google Scholar] [CrossRef]
- Trenberth, K.E. Conceptual Framework for Changes of Extremes of the Hydrological Cycle with Climate Change. Clim. Chang. 1999, 42, 327–339. [Google Scholar] [CrossRef]
- Haerter, J.O.; Berg, P. Unexpected rise in extreme precipitation caused by a shift in rain type? Nat. Geosci. 2009, 2, 372–373. [Google Scholar] [CrossRef]
- Collins, M.; Knutti, R.; Arblaster, J.; Dufresne, J.-L.; Fichefet, T.; Friedlingstein, P.; Gao, X.; Gutowski, W.J.; Johns, T.; Krinner, G.; et al. Long-term Climate Change: Projections, Commitments and Irreversibility. In Climate Change 2013: The Physical Science Basis. Contribution of Working Group I to the Fifth Assessment Report of the Intergovernmental Panel on Climate Change; Stocker, T.F., Qin, D., Plattner, G.-K., Tignor, M., Allen, S.K., Boschung, J., Nauels, A., Xia, Y., Bex, V., Midgley, P.M., et al., Eds.; Cambridge University Press: Cambridge, UK; New York, NY, USA, 2013. [Google Scholar]
- UNFCCC. Adoption of the Paris Agreement: Proposal by the President, FCCC/CP/2015/L.9/Rev.1, ed.; UNFCCC: Geneva, Switzerland, 2015. [Google Scholar]
- UNFCCC. Synthesis Report on the Aggregate Effect of the Intended Nationally Determined Contributions, FCCC/CP/2015/7, ed.; UNFCCC: Paris, France, 2015. [Google Scholar]
- Gupta, S.; Tirpak, D.; Burger, N.; Gupta, J.; Höhne, N.; Boncheva, A.; Kanoan, G.; Kolstad, C.; Kruger, J.; Michaelowa, A.; et al. Policies, instruments, and co-operative arrangements. In Climate Chang. 2007: Mitigation. Contribution of Working Group III to the Fourth Assessment Report of the Intergovernmental Panel on Climate Change; Metz, O.B., Bosch, P., Dave, R., Meyer, L., Eds.; Cambridge University Press: Cambridge, UK; New York, NY, USA, 2007; pp. 745–807. [Google Scholar]
- Dosio, A.; Fischer Erich, M. Will Half a Degree Make a Difference? Robust Projections of Indices of Mean and Extreme Climate in Europe Under 1.5 °C, 2 °C, and 3 °C Global Warming. Geophys. Res. Lett. 2017, 45, 935–944. [Google Scholar] [CrossRef]
- Schleussner, C.-F.; Lissner, T.K.; Fischer, E.M.; Wohland, J.; Perrette, M.; Golly, A.; Rogelj, J.; Childers, K.; Schewe, J.; Frieler, K.; et al. Differential climate impacts for policy-relevant limits to global warming: The case of 1.5 °C and 2 °C. Earth Syst. Dyn. 2016, 7, 327–351. [Google Scholar] [CrossRef]
- Xu, Y.; Zhou, B.-T.; Wu, J.; Han, Z.-Y.; Zhang, Y.-X.; Wu, J. Asian climate change under 1.5–4 °C warming targets. Adv. Clim. Chang. Res. 2017, 8, 99–107. [Google Scholar] [CrossRef]
- Zhang, W.; Zhou, T.; Zou, L.; Zhang, L.; Chen, X. Reduced exposure to extreme precipitation from 0.5 °C less warming in global land monsoon regions. Nat. Commun. 2018, 9, 3153. [Google Scholar] [CrossRef]
- Hoegh-Guldberg, O.; Jacob, D.; Taylor, M.; Bindi, M.; Brown, S.; Camilloni, I.; Diedhiou, A.; Djalante, R.; Ebi, K.; Engelbrecht, F.; et al. Impacts of 1.5°C global warming on natural and human systems. In Global Warming of 1.5°C. An IPCC Special Report on the Impacts of Global Warming of 1.5°C above Pre-Industrial Levels and Related Global Greenhouse Gas Emission Pathways, in the Context of Strengthening the Global Response to the Threat of Climate Change, Sustainable Development, and Efforts to Eradicate Poverty; Masson-Delmotte, V., Zhai, P., Pörtner, H.O., Roberts, D., Skea, J., Shukla, P.R., Pirani, A., Moufouma-Okia, W., Péan, C., Pidcock, R., et al., Eds.; Cambridge University Press: Cambridge, UK; New York, NY, USA, 2018; in press. [Google Scholar]
- Sanderson, B.M.; O’Neill, B.C.; Tebaldi, C. What would it take to achieve the Paris temperature targets? Geophys. Res. Lett. 2016, 43, 7133–7142. [Google Scholar] [CrossRef]
- Rogelj, J.; den Elzen, M.; Höhne, N.; Fransen, T.; Fekete, H.; Winkler, H.; Schaeffer, R.; Sha, F.; Riahi, K.; Meinshausen, M. Paris Agreement climate proposals need a boost to keep warming well below 2 °C. Nature 2016, 534, 631. [Google Scholar] [CrossRef]
- CAT. Addressing Global Warming. Available online: https://climateactiontracker.org/global/temperatures/ (accessed on 31 December 2017).
- UNEP. The Emissions Gap Report; UNEP: Nairobi, Kenya, 2017. [Google Scholar]
- IPCC. Climate Change 2014: Synthesis Report. Contribution of Working Groups I, II and III to the Fifth Assessment Report of the Intergovernmental Panel on Climate Change; Cambridge University Press: Cambridge, UK; New York, NY, USA, 2014. [Google Scholar]
- IPCC. Global Warming of 1.5 °C; Cambridge University Press: Cambridge, UK; New York, NY, USA, 2018. [Google Scholar]
- UNFCCC. National Inventory Submissions; UNFCCC: Geneva, Switzerland, 2019. [Google Scholar]
- Taylor, K.E.; Stouffer, R.J.; Meehl, G.A. An Overview of CMIP5 and the Experiment Design. Bull. Am. Meteorol. Soc. 2011, 93, 485–498. [Google Scholar] [CrossRef]
- Wang, F.; Tokarska, K.B.; Zhang, J.; Ge, Q.; Hao, Z.; Zhang, X.; Wu, M. Climate Warming in Response to Emission Reductions Consistent with the Paris Agreement. Adv. Meteorol. 2018, 2018, 1–9. [Google Scholar] [CrossRef]
- Wang, F.; Ge, Q.; Chen, D.; Luterbacher, J.; Tokarska, K.B.; Hao, Z. Global and regional climate responses to national-committed emission reductions under the Paris agreement. Geografiska Annaler Ser. A Phys. Geogr. 2018, 100, 240–253. [Google Scholar] [CrossRef]
- Jia, W. A gridded daily observation dataset over China region and comparison with the other datasets. Chin. J. Geophys. 2013, 56, 1102–1111. [Google Scholar]
- Gao, X.-J.; Wang, M.-L.; Filippo, G. Climate Change over China in the 21st Century as Simulated by BCC_CSM1.1-RegCM4.0. Atmos. Ocean. Sci. Lett. 2013, 6, 381–386. [Google Scholar]
- Ji, Z.; Kang, S. Evaluation of extreme climate events using a regional climate model for China. Int. J. Climatol. 2015, 35, 888–902. [Google Scholar] [CrossRef]
- Robert, V.; Andreas, G.; Stefan, S.; Erik, K.; Annemiek, S.; Paul, W.; Thomas, M.; Oskar, L.; Grigory, N.; Claas, T.; et al. The European climate under a 2 °C global warming. Environ. Res. Lett. 2014, 9, 034006. [Google Scholar]
- Huang, J.; Yu, H.; Dai, A.; Wei, Y.; Kang, L. Drylands face potential threat under 2 °C global warming target. Nat. Clim. Chang. 2017, 7, 417. [Google Scholar] [CrossRef]
- Zhang, X.; Alexander, L.; Hegerl, G.C.; Jones, P.; Tank, A.K.; Peterson, T.C.; Trewin, B.; Zwiers, F.W. Indices for monitoring changes in extremes based on daily temperature and precipitation data. Wiley Interdiscip. Rev. Clim. Chang. 2011, 2, 851–870. [Google Scholar] [CrossRef]
- Sun, Y.; Solomon, S.; Dai, A.; Portmann, R.W. How Often Does It Rain? J. Clim. 2006, 19, 916–934. [Google Scholar] [CrossRef]
- Huang, J.; Sun, S.; Zhang, J. Detection of trends in precipitation during 1960–2008 in Jiangxi province, southeast China. Theor. Appl. Climatol. 2013, 114, 237–251. [Google Scholar] [CrossRef]
- Zhai, P.; Zhang, X.; Wan, H.; Pan, X. Trends in Total Precipitation and Frequency of Daily Precipitation Extremes over China. J. Clim. 2005, 18, 1096–1098, 1100–1108. [Google Scholar] [CrossRef]
- Lavell, A.; Oppenheimer, M.; Diop, C.; Hess, J.; Lempert, R.; Li, J.; Muir-Wood, R.; Myeong, S. Climate change: New dimensions in disaster risk, exposure, vulnerability, and resilience. In Managing the Risks of Extreme Events and Disasters to Advance Climate Change Adaptation; Field, C.B., Barros, V., Stocker, T.F., Qin, D., Dokken, D.J., Ebi, K.L., Mastrandrea, M.D., Mach, K.J., Plattner, G.-K., Allen, S.K., et al., Eds.; A Special Report of Working Groups I and II of the Intergovernmental Panel on Climate Change (IPCC); Cambridge University Press: Cambridge, UK; New York, NY, USA, 2012; pp. 25–64. [Google Scholar]
- Cox, D.R.; Hinkley, D.V. Theoretical Statistics; Chapman and Hall: London, UK, 1974; p. 511. [Google Scholar]
- Kharin, V.V.; Zwiers, F.W. Estimating Extremes in Transient Climate Change Simulations. J. Clim. 2005, 18, 1156–1173. [Google Scholar] [CrossRef]
- Jones, B.; O’Neill, B.C. Spatially explicit global population scenarios consistent with the Shared Socioeconomic Pathways. Environ. Res. Lett. 2016, 11, 084003. [Google Scholar] [CrossRef]
- Ying, X.; Jie, W.; Ying, S.; Bo-Tao, Z.; Rou-Ke, L.; Jia, W. Change in Extreme Climate Events over China Based on CMIP5. Atmos. Ocean. Sci. Lett. 2015, 8, 185–192. [Google Scholar] [CrossRef]
- Seneviratne, S.I.; Donat, M.G.; Pitman, A.J.; Knutti, R.; Wilby, R.L. Allowable CO2 emissions based on regional and impact-related climate targets. Nature 2016, 529, 477. [Google Scholar] [CrossRef] [PubMed]
- Lenton, T.M.; Held, H.; Kriegler, E.; Hall, J.; Lucht, W.; Rahmstorf, S.; Schellnhuber, H. Tipping elements in the Earth’s climate system. Proc. Natl. Acad. Sci. USA 2008, 105, 1786–1793. [Google Scholar] [CrossRef] [PubMed]
- Jiang, D.; Sui, Y.; Lang, X. Timing and associated climate change of a 2 °C global warming. Int. J. Climatol. 2016, 36, 4512–4522. [Google Scholar] [CrossRef]
- Jiang, Z.; Wei, L.; Xu, J.; Li, L. Extreme Precipitation Indices over China in CMIP5 Models. Part I: Model Evaluation. Adv. Sci. Serv. Soc. 2015, 28. [Google Scholar] [CrossRef]
- Rajendran, K.; Kitoh, A.; Yukimoto, S. South and East Asian summer monsoon climate and variation in MRI coupled model (MRI-CGCM2). Adv. Sci. Serv. Soc. 2004, 17, 763–782. [Google Scholar] [CrossRef]
- Lin, Z.; Fu, Y.; Lu, R. Intermodel Diversity in the Zonal Location of the Climatological East Asian Westerly Jet Core in Summer and Association with Rainfall over East Asia in CMIP5 Models. Adv. Atmos. Sci. 2019, 36, 614–622. [Google Scholar] [CrossRef]


| Extreme Precipitation Indices | Definition (Unit) |
|---|---|
| Rx5day | Maximum consecutive 5 day precipitation (mm) |
| SDII | Simple precipitation intensity index. Let be the daily precipitation amount on wet days, mm in period . If represents the number of wet days in period , then (mm/day). |
| R25 | Cumulative number of precipitation days during which the daily precipitation exceeds 25 mm per year (days) |
© 2019 by the authors. Licensee MDPI, Basel, Switzerland. This article is an open access article distributed under the terms and conditions of the Creative Commons Attribution (CC BY) license (http://creativecommons.org/licenses/by/4.0/).
Share and Cite
Zhang, J.; Wang, F. Extreme Precipitation in China in Response to Emission Reductions under the Paris Agreement. Water 2019, 11, 1167. https://doi.org/10.3390/w11061167
Zhang J, Wang F. Extreme Precipitation in China in Response to Emission Reductions under the Paris Agreement. Water. 2019; 11(6):1167. https://doi.org/10.3390/w11061167
Chicago/Turabian StyleZhang, Jintao, and Fang Wang. 2019. "Extreme Precipitation in China in Response to Emission Reductions under the Paris Agreement" Water 11, no. 6: 1167. https://doi.org/10.3390/w11061167
APA StyleZhang, J., & Wang, F. (2019). Extreme Precipitation in China in Response to Emission Reductions under the Paris Agreement. Water, 11(6), 1167. https://doi.org/10.3390/w11061167