Water Use Effectiveness Is Enhanced Using Film Mulch Through Increasing Transpiration and Decreasing Evapotranspiration
Abstract
1. Introduction
2. Material and Methods
2.1. Experimental Site and Design
2.2. Data Measurements
2.2.1. Meteorological Data
2.2.2. Canopy Cover
2.2.3. Soil Water Content
2.2.4. Evapotranspiration
2.3. Model Description
2.3.1. Model Principles and Algorithms
2.3.2. Parameters Sensitivity Analysis
2.3.3. Model calibration and Performance Evaluation
3. Results and Discussion
3.1. Differences in Model Parameters Sensitivity and Calibration with and without Mulch
3.2. Differences in Canopy Cover and Growth With and without Mulch
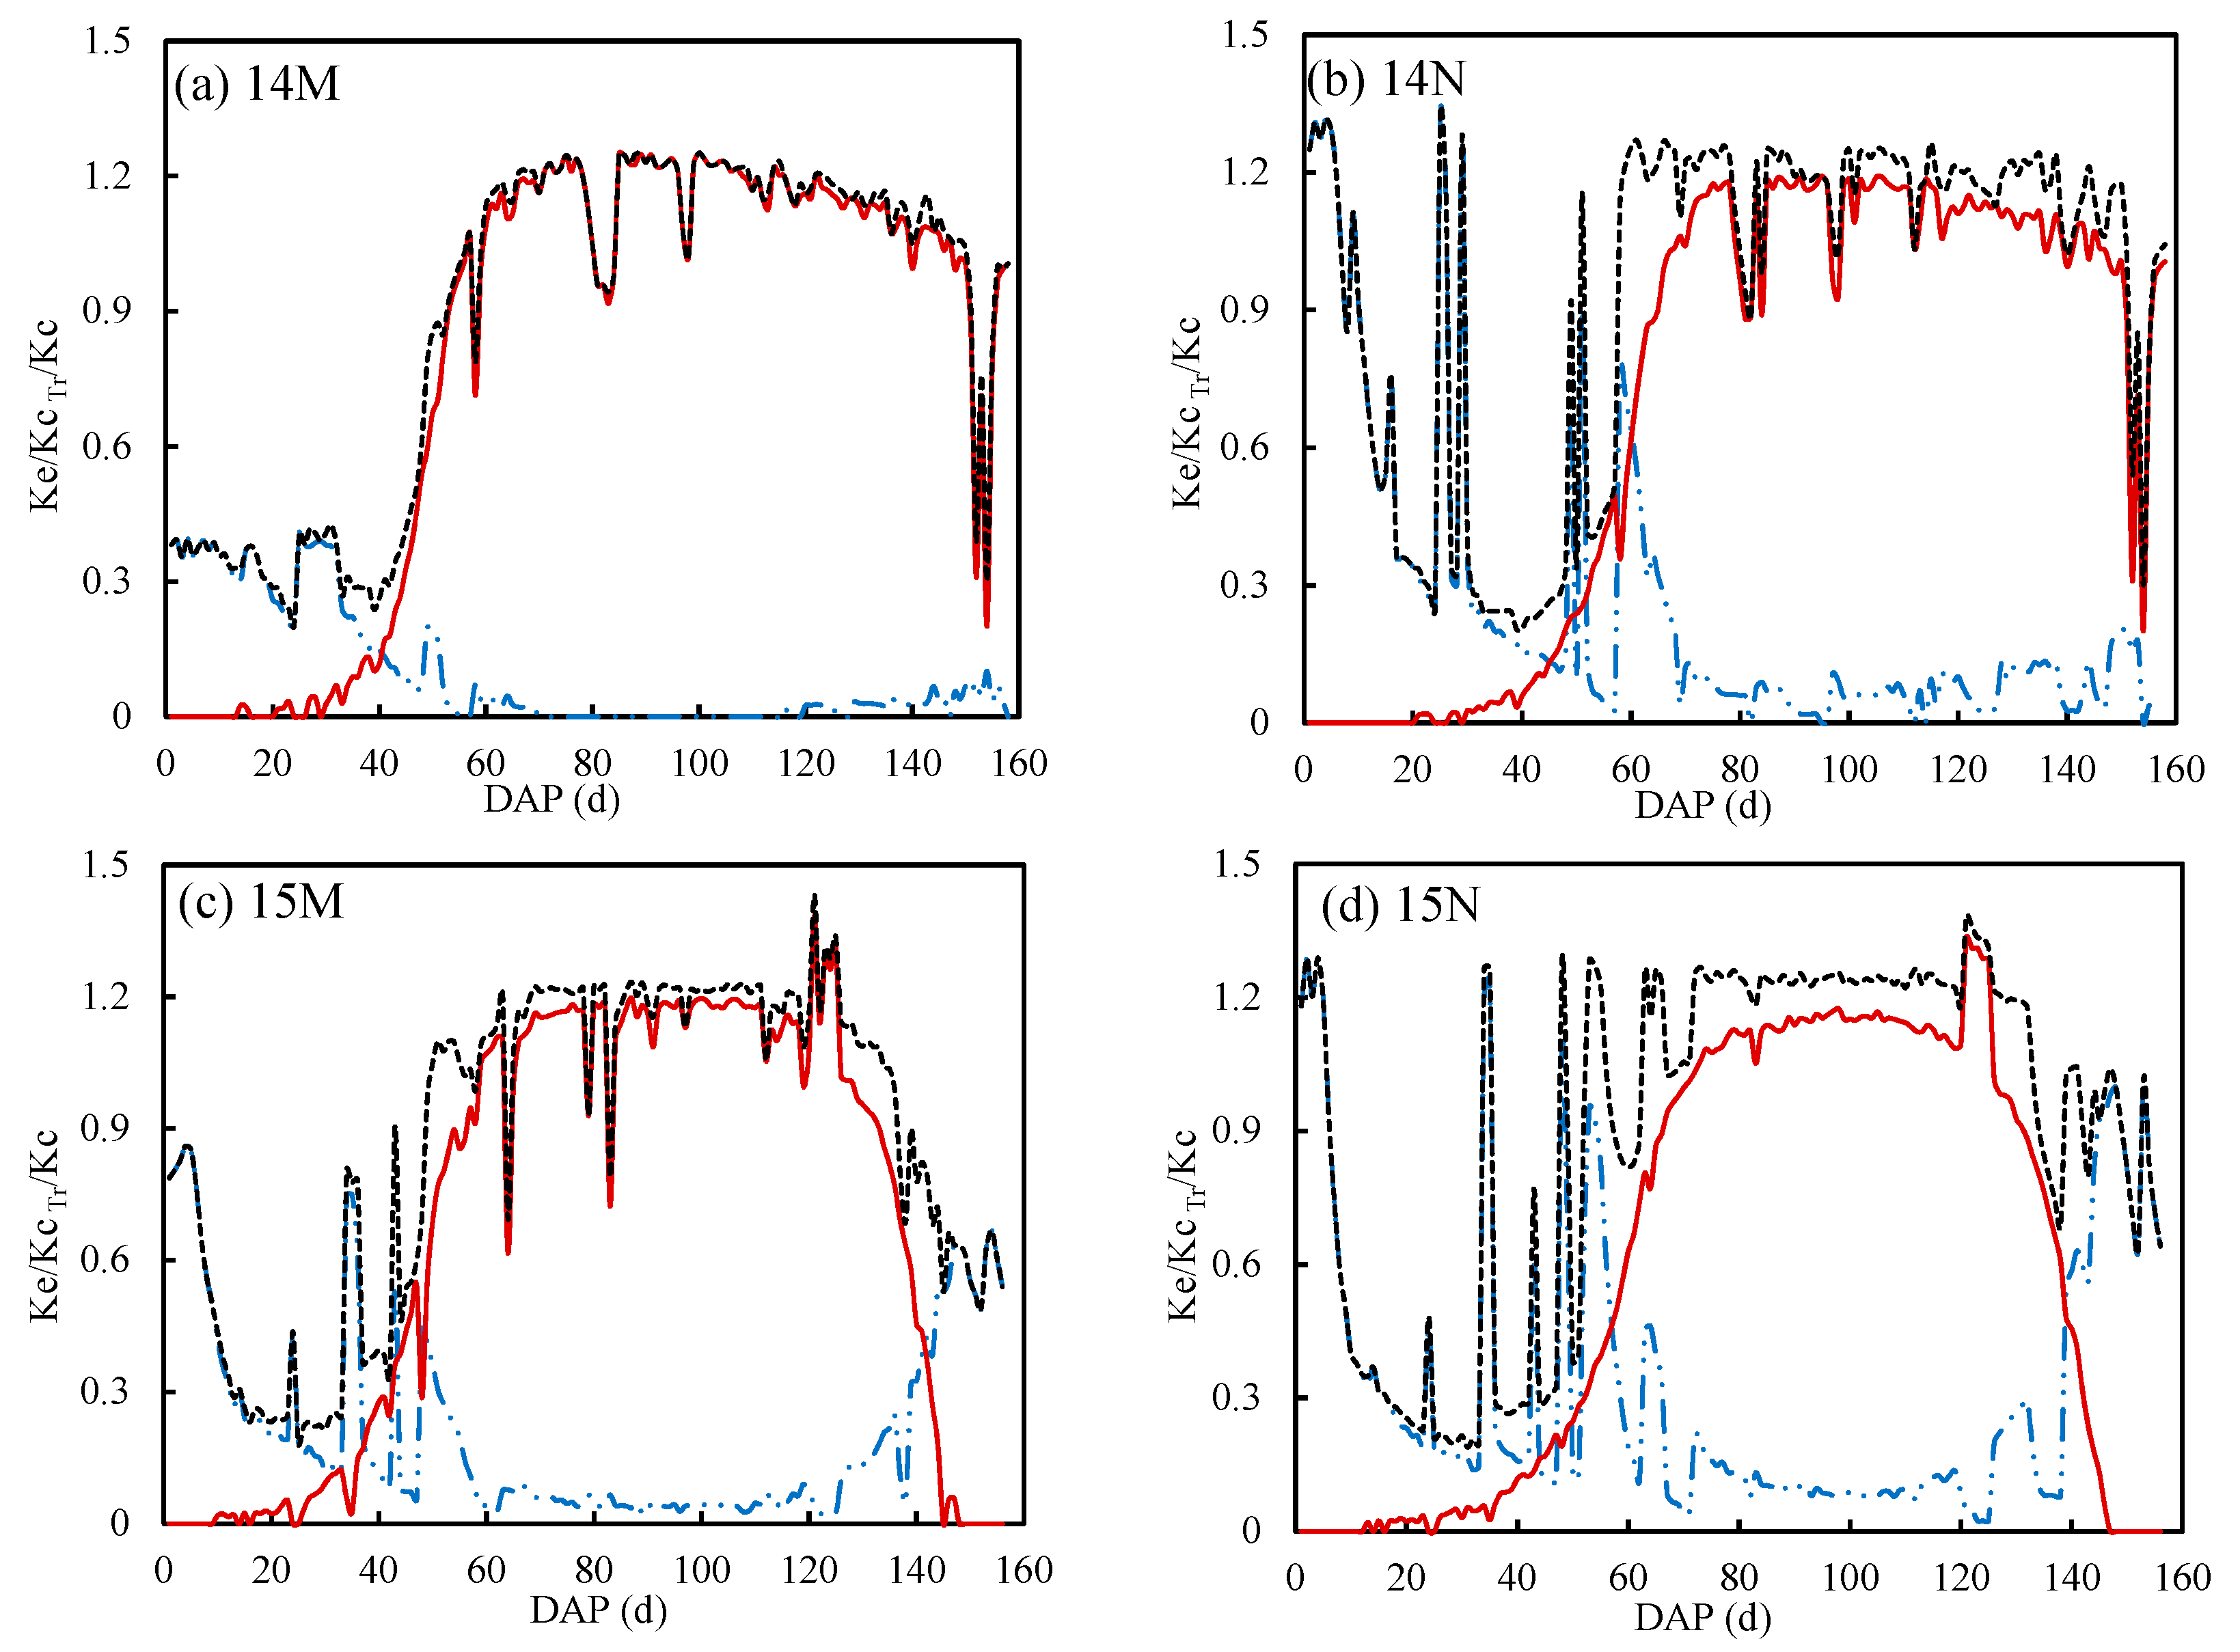
3.3. Differences in Evapotranspiration with and without Mulch
3.4. Differences in Transpiration and Evaporation with and without Mulch
4. Conclusions
Author Contributions
Funding
Acknowledgments
Conflicts of Interest
References
- Sinclair, T.R.; Devi, J.; Shekoofa, A.; Choudhary, S.; Sadok, W.; Vadez, V.; Riar, M.; Rufty, T. Limited-transpiration response to high vapor pressure deficit in crop species. J. Cit. Rep. 2017, 260, 109–118. [Google Scholar] [CrossRef] [PubMed]
- Lobell, D.B.; Roberts, M.J.; Schlenker, W.; Braun, N.; Little, B.B.; Rejesus, R.M.; Hammer, G.L. Greater sensitivity to drought accompanies maize yield increase in the US Midwest. Science 2014, 344, 516–519. [Google Scholar] [CrossRef]
- Leuning, R.; Zhang, Y.Q.; Rajaud, A.; Cleugh, H.; Tu, K. A simple surface conductance model to estimate regional evaporation using MODIS leaf area index and the Penman-Monteith equation. Water Resour. Res. 2008, 44, W10419. [Google Scholar] [CrossRef]
- Liu, H.J.; Yang, H.Y.; Zheng, J.H.; Jia, D.D.; Wang, J.; Li, Y.; Huang, G.H. Irrigation scheduling strategies based on soil matric potential on yield and fruit quality of mulched-drip irrigated chili pepper in Northwest China. Agric. Water Manag. 2012, 115, 232–241. [Google Scholar] [CrossRef]
- Rana, G.; Katerji, N. Measurement and estimation of actual evapotranspiration in the field under Mediterranean climate: A review. Eur. J. Agron. 2000, 13, 125–153. [Google Scholar] [CrossRef]
- Allen, R.G. Using the FAO-56 dual crop coefficient method over an irrigated region as part of an evapotranspiration intercomparison study. J. Hydrol. 2000, 229, 27–41. [Google Scholar] [CrossRef]
- Ding, R.S.; Kang, S.Z.; Li, F.S.; Zhang, Y.Q.; Tong, L. Evapotranspiration measurement and estimation using modified Priestley-Taylor model in an irrigated maize field with mulching. Agric. For. Meteorol. 2013, 168, 140–148. [Google Scholar] [CrossRef]
- Pieruschka, R.; Huber, G.; Berry, J.A. Control of transpiration by radiation. In Proceedings of the National Academy of Sciences of The United States of America, Stanford, CA, USA, 16 June 2010; Volume 107, pp. 13372–13377. [Google Scholar]
- Er-Raki, S.; Chehbouni, A.; Boulet, G.; Williams, D.G. Using the dual approach of FAO-56 for partitioning ET into soil and plant components for olive orchards in a semi-arid region. Agric. Water Manag. 2010, 97, 1769–1778. [Google Scholar] [CrossRef]
- Katerji, N.; Campi, P.; Mastrorilli, M. Productivity, evapotranspiration, and water use efficiency of corn and tomato crops simulated by AquaCrop under contrasting water stress conditions in the Mediterranean region. Agric. Water Manag. 2013, 130, 14–26. [Google Scholar] [CrossRef]
- Jones, J.W.; Hoogenboom, G.; Porter, C.H.; Boote, K.J.; Batchelor, W.D.; Hunt, L.A.; Wilkens, P.W.; Singh, U.; Gijsman, A.J.; Ritchie, J.T. The DSSAT cropping system model. Eur. J. Agron. 2003, 18, 235–265. [Google Scholar] [CrossRef]
- Diepen, C.A.; Wolf, J.; Keulen, H.; Rappoldt, C. WOFOST: A simulation model of crop production. Soil Use Manag. 1989, 5, 16–24. [Google Scholar] [CrossRef]
- Keating, B.A.; Carberry, P.S.; Hammer, G.L.; Probert, M.E.; Robertson, M.J.; Holzworth, D.; Huth, N.I.; Hargreaves, J.N.G.; Meinke, H.; Hochman, Z.; et al. An overview of APSIM, a model designed for farming systems simulation. Eur. J. Agron. 2003, 18, 267–288. [Google Scholar] [CrossRef]
- Sharpley, A.N.; Williams, J.R. EPIC-Erosion/Productivity Impact Calculator: 1. Model Documentation; Technical Bulletin-United States Department of Agriculture; Agricultural Research Service: Beltsville, MA, USA, 1990. [Google Scholar]
- Ko, J.; Piccinni, G.; Steglich, E. Using EPIC model to manage irrigated cotton and maize. Agric. Water Manag. 2009, 96, 1323–1331. [Google Scholar] [CrossRef]
- Kang, S.; Zhang, L.; Liang, Y.; Dawes, W. Simulation of winter wheat yield and water use efficiency in the Loess Plateau of China using WAVES. Agric. Syst. 2003, 78, 355–367. [Google Scholar] [CrossRef]
- Stöckle, C.O.; Donatelli, M.; Nelson, R. CropSyst, a cropping systems simulation model. Eur. J. Agron. 2003, 18, 289–307. [Google Scholar] [CrossRef]
- Steduto, P.; Hsiao, T.C.; Raes, D.; Fereres, E. AquaCrop—The FAO crop model to simulate yield response to water: I. Concepts and underlying principles. Agron. J. 2009, 101, 426–437. [Google Scholar] [CrossRef]
- Raes, D.; Steduto, P.; Hsiao, T.C.; Fereres, E. AquaCrop-the FAO crop model to simulate yield response to water: II. Main algorithms and software description. Agron. J. 2009, 101, 438–447. [Google Scholar] [CrossRef]
- Stricevic, R.; Cosic, M.; Djurovic, N.; Pejic, B.; Maksimovic, L. Assessment of the FAO AquaCrop model in the simulation of rainfed and supplementally irrigated maize, sugar beet and sunflower. Agric. Water Manag. 2011, 98, 1615–1621. [Google Scholar] [CrossRef]
- Nyakudya, I.W.; Stroosnijder, L. Effect of rooting depth: Plant density and planting date on maize (zea mays L.) yield and water use efficiency in semi-arid Zimbabwe: Modelling with AquaCrop. Agric. Water Manag. 2014, 146, 280–296. [Google Scholar] [CrossRef]
- Abedinpour, M.; Sarangi, A.; Rajput, T.B.S.; Singh, M.; Pathak, H.; Ahmad, T. Performance evaluation of AquaCrop model for maize crop in a semi-arid environment. Agric. Water Manag. 2012, 110, 55–66. [Google Scholar] [CrossRef]
- Hsiao, T.C.; Heng, L.; Steduto, P.; Rojas-Lara, B.; Raes, D.; Fereres, E. AquaCrop-the FAO crop model to simulate yield response to water: III. Parameterization and testing for maize. Agron. J. 2009, 101, 448–459. [Google Scholar] [CrossRef]
- Paredes, P.; de Melo-Abreu, J.P.; Alves, I.; Pereira, L.S. Assessing the performance of the FAO AquaCrop model to estimate maize yields and water use under full and deficit irrigation with focus on model parameterization. Agric. Water Manag. 2014, 144, 81–97. [Google Scholar] [CrossRef]
- Mkhabela, M.S.; Bullock, P.R. Performance of the FAO AquaCrop model for wheat grain yield and soil moisture simulation in Western Canada. Agric. Water Manag. 2012, 110, 16–24. [Google Scholar] [CrossRef]
- Wang, X.; Wang, Q.; Fan, J.; Fu, Q. Evaluation of the AquaCrop model for simulating the impact of water deficits and different irrigation regimes on the biomass and yield of winter wheat grown on China’s Loess Plateau. Agric. Water Manag. 2013, 129, 95–104. [Google Scholar]
- Andarzian, B.; Bannayan, M.; Steduto, P.; Mazraeh, H.; Barati, M.E.; Barati, M.A.; Rahnama, A. Validation and testing of the AquaCrop model under full and deficit irrigated wheat production in Iran. Agric. Water Manag. 2011, 100, 1–8. [Google Scholar] [CrossRef]
- Iqbal, M.A.; Shen, Y.; Stricevic, R.; Pei, H.; Sun, H.; Amiri, E.; Penas, A.; Rio, S. Evaluation of the FAO AquaCrop model for winter wheat on the North China Plain under deficit irrigation from field experiment to regional yield simulation. Agric. Water Manag. 2014, 135, 61–72. [Google Scholar] [CrossRef]
- Toumi, J.; Er-Raki, S.; Ezzahar, J.; Khabba, S.; Jarlan, L.; Chehbouni, A. Performance assessment of AquaCrop model for estimating evapotranspiration, soil water content and grain yield of winter wheat in Tensift Al Haouz (Morocco): Application to irrigation management. Agric. Water Manag. 2016, 163, 219–235. [Google Scholar] [CrossRef]
- Linker, R.; Ioslovich, I.; Sylaios, G.; Plauborg, F.; Battilani, A. Optimal model-based deficit irrigation scheduling using AquaCrop: A simulation study with cotton, potato and tomato. Agric. Water Manag. 2016, 163, 236–243. [Google Scholar] [CrossRef]
- Garcia-Vila, M.; Fereres, E.; Mateos, L.; Orgaz, F.; Steduto, P. Deficit irrigation optimization of cotton with AquaCrop. Agron. J. 2009, 101, 477–487. [Google Scholar] [CrossRef]
- Maniruzzaman, M.; Talukder, M.S.U.; Khan, M.H.; Biswas, J.C.; Nemes, A. Validation of the AquaCrop model for irrigated rice production under varied water regimes in Bangladesh. Agric. Water Manag. 2015, 159, 331–340. [Google Scholar] [CrossRef]
- Todorovic, M.; Albrizio, R.; Zivotic, L.; Saab, M.T.A.; Stöckle, C.; Steduto, P. Assessment of AquaCrop, CropSyst, and WOFOST models in the simulation of sunflower growth under different water regimes. Agron. J. 2009, 101, 509–521. [Google Scholar] [CrossRef]
- Araya, A.; Keesstra, S.D.; Stroosnijder, L. Simulating yield response to water of Teff (Eragrostis tef) with FAO’s AquaCrop model. Field Crops Res. 2010, 116, 196–204. [Google Scholar] [CrossRef]
- Dong, H.Z.; Li, W.J.; Tang, W.; Zhang, D.M. Early plastic mulching increases stand establishment and lint yield of cotton in saline fields. Field Crops Res. 2009, 111, 269–275. [Google Scholar] [CrossRef]
- Zhao, W.; Liu, B.; Zhang, Z. Water requirements of maize in the middle Heihe River basin, China. Agric. Water Manag. 2010, 97, 215–223. [Google Scholar] [CrossRef]
- Hou, X.Y.; Wang, F.X.; Han, J.J.; Kang, S.Z.; Feng, S.Y. Duration of plastic mulch for potato growth under drip irrigation in an arid region of Northwest China. Agric. For. Meteorol. 2010, 150, 115–121. [Google Scholar] [CrossRef]
- Allen, R.G.; Pereira, L.S.; Raes, D.; Smith, M. Crop evapotranspiration. guide-lines for computing crop water requirements. In FAO Irrigation and Drainage Paper 56; Food and Agriculture Organization of United Nations: Rome, Italy, 1998. [Google Scholar]
- Paredes, P.; Wei, Z.; Liu, Y.; Xu, D.; Xin, Y.; Zhang, B.; Pereira, L.S. Performance assessment of the FAO AquaCrop model for soil water, soil evaporation, biomass and yield of soybeans in North China plain. Agric. Water Manag. 2015, 152, 57–71. [Google Scholar] [CrossRef]
- Pereira, L.S.; Paredes, P.; Rodrigues, G.C.; Neves, M. Modeling malt barley water use and evapotranspiration partitioning in two contrasting rainfall years. Assessing AquaCrop and SIMDualKc models. Agric. Water Manag. 2015, 159, 239–254. [Google Scholar] [CrossRef]
- Ran, H.; Kang, S.Z.; Li, F.S.; Tong, L.; Ding, R.S.; Du, T.S.; Li, S.E.; Zhang, X.T. Performance of AquaCrop and SIMDualKc models in evapotranspiration partitioning on full and deficit irrigated maize for seed production under plastic film-mulch in an arid region of China. Agric. Syst. 2017, 151, 20–32. [Google Scholar] [CrossRef]
- Campolongo, F.; Cariboni, J.; Saltelli, A. An effective screening design for sensitivity analysis of large models. Environ. Model. Softw. 2007, 22, 1509–1518. [Google Scholar] [CrossRef]
- Confalonieri, R.; Bellocchi, G.; Tarantola, S.; Acutis, M.; Donatelli, M.; Genovese, G. Sensitivity analysis of the rice model WARM in Europe: Exploring the effects of different locations, climates and methods of analysis on model sensitivity to crop parameters. Environ. Model. Softw. 2010, 25, 479–488. [Google Scholar] [CrossRef]
- Saltelli, A.; Ratto, M.; Andres, T.; Campolongo, F.; Cariboni, J.; Gatelli, D.; Saisana, M.; Tarantola, S. Global Sensitivity Analysis: The Primer; John Wiley: Chichester, UK, 2008; p. 292. [Google Scholar]
- Saltelli, A.; Annoni, P. How to avoid a perfunctory sensitivity analysis. Environ. Model. Softw. 2010, 25, 1508–1517. [Google Scholar] [CrossRef]
- Cariboni, J.; Gatelli, D.; Liska, R.; Saltelli, A. The role of sensitivity analysis in ecological modelling. Ecol. Model. 2007, 203, 167–182. [Google Scholar] [CrossRef]
- Elsawwaf, M.; Willems, P.; Feyen, J. Assessment of the sensitivity and prediction uncertainty of evaporation models applied to Nasser Lake, Egypt. J. Hydrol. 2010, 395, 10–22. [Google Scholar] [CrossRef]
- Saltelli, A.; Tarantola, S.; Campolongo, F. Sensitivity analysis as an ingredient of modeling. Stat. Sci. 2000, 15, 377–395. [Google Scholar]
- Morris, M.D. Factorial sampling plans for preliminary computational experiments. Technometrics 1991, 33, 161–174. [Google Scholar] [CrossRef]
- Sobol, I.M. Sensitivity estimates for nonlinear mathematical models. Math. Model. Comput. Exp. 1993, 1, 407–414. [Google Scholar]
- Kendall, C.D.; James, C.A. II.; Mehdi, A.; Allan, A.A.; Mazdak, A. Global sensitivity and uncertainty analysis of a dynamic agroecosystem model under different irrigation treatments. Ecol. Model. 2012, 231, 113–125. [Google Scholar]
- Rosa, R.D.; Paredes, P.; Rodrigues, G.C.; Fernando, R.M.; Alves, I.; Pereira, L.S.; Allen, R.G. Implementing the dual crop coefficient approach in interactive software: 2. Model testing. Agric. Water Manag. 2012, 103, 62–77. [Google Scholar] [CrossRef]
- Nash, J.E.; Sutcliffe, J.V. River flow forecasting through conceptual models part I—A discussion of principles. J. Hydrol. 1970, 10, 282–290. [Google Scholar] [CrossRef]
- Willmott, C.J. On the validation of models. Phys. Geogr. 1981, 2, 184–194. [Google Scholar] [CrossRef]
- Zeleke, K.T.; Luckett, D.; Cowley, R. Calibration and testing of the FAO AquaCrop model for canola. Agron. J. 2011, 103, 1610–1618. [Google Scholar] [CrossRef]
- Farahani, H.J.; Izzi, G.; Oweis, T.Y. Parameterization and evaluation of the AquaCrop model for full and deficit irrigated cotton. Agron. J. 2009, 101, 469–476. [Google Scholar] [CrossRef]
- Abi Saab, N.T.; Todorovic, M.; Albrizio, R. Comparing AquaCrop and CropSyst models in simulating barley growth and yield under different water and nitrogen regimes. Does calibration year influence the performance of crop growth models? Agric. Water Manag. 2015, 147, 21–33. [Google Scholar] [CrossRef]
- Fan, Y.Q.; Ding, R.S.; Kang, S.Z.; Hao, X.M.; Du, T.S.; Tong, L. Plastic mulch decreases available energy and evapotranspiration and improves yield and water use efficiency in an irrigated maize cropland. Agric. Water Manag. 2017, 179, 122–131. [Google Scholar] [CrossRef]
- Zhou, L.M.; Li, F.M.; Jin, S.L.; Song, Y.J. How two ridges and the furrow mulched with plastic film affect soil water, soil temperature and yield of maize on the semiarid Loess Plateau of China. Field Crops Res. 2009, 113, 41–47. [Google Scholar] [CrossRef]
- Liu, C.; Zhang, X.; Zhang, Y. Determination of daily evaporation and evapotranspiration of winter wheat and maize by large-scale weighing lysimeter and micro-lysimeter. Agric. For. Meteorol. 2002, 111, 109–120. [Google Scholar] [CrossRef]
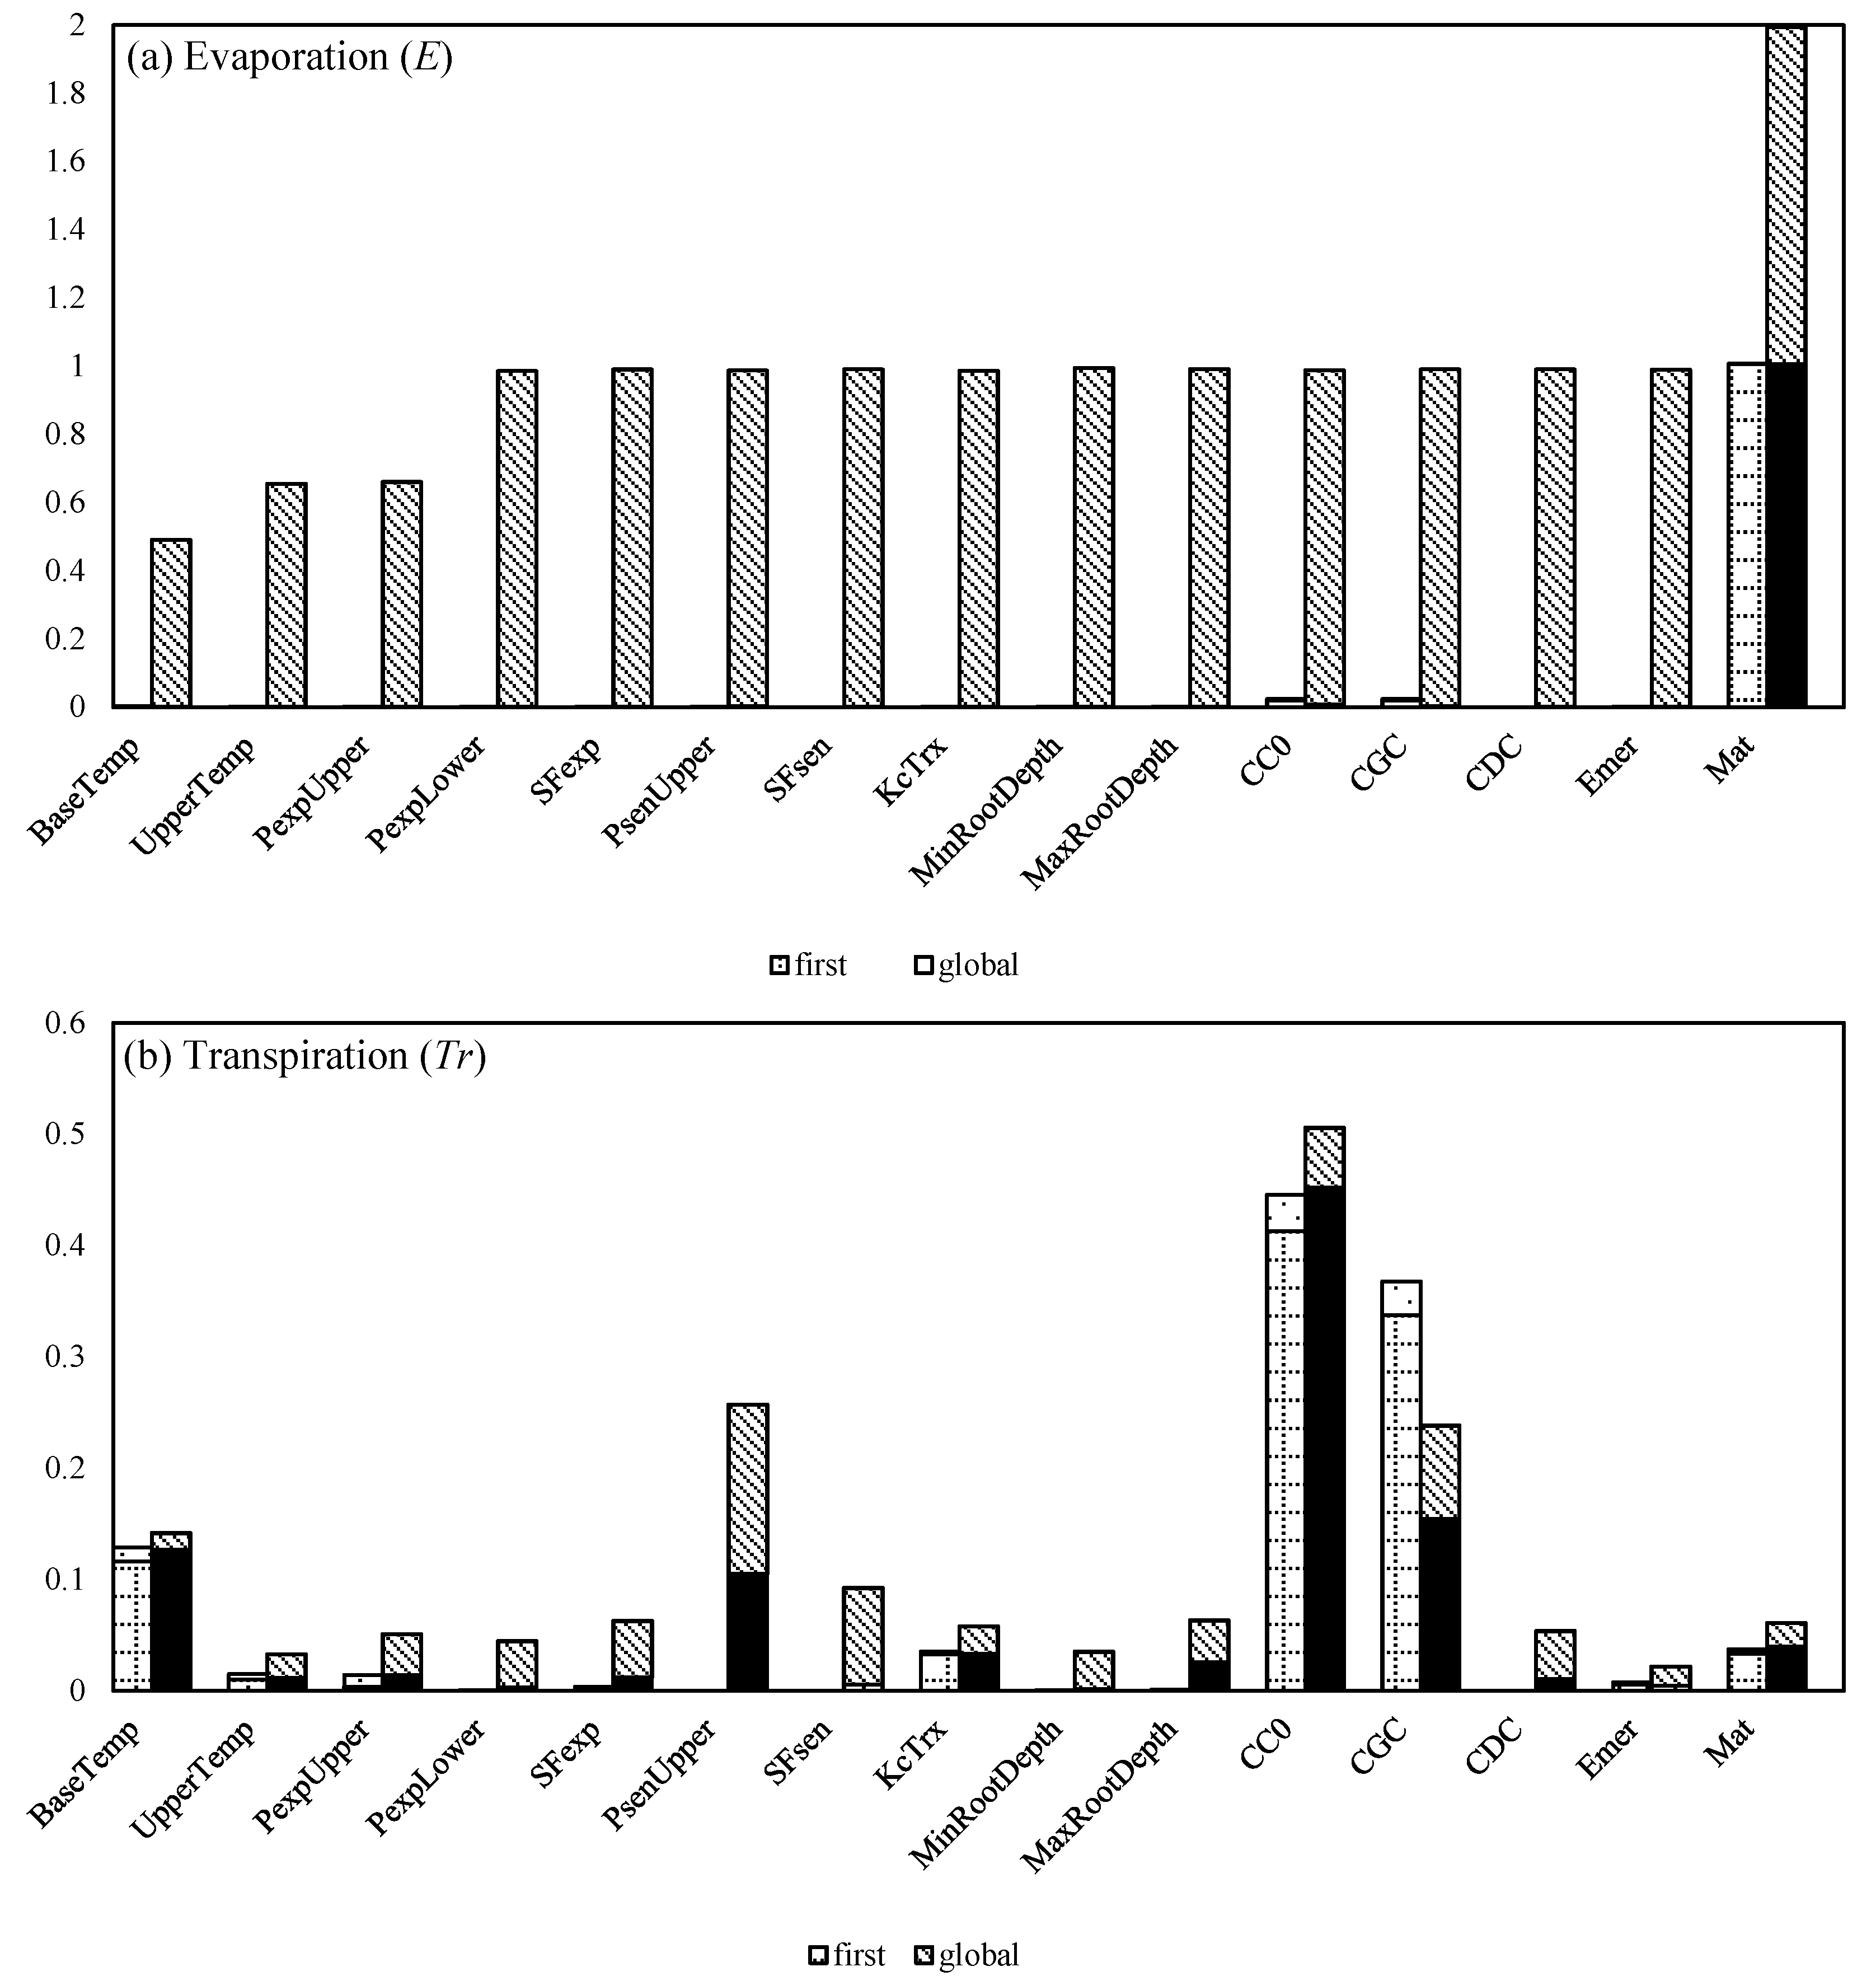
 ; N,
; N,  ), and first order sensitivity analysis (SA, M,
  ; N,
; N,  ) indices for the AquaCrop model output of evaporation (E) and transpiration (Tr). Model input parameters were those sensitive by the Morris screening method.
 ; N,
; N,  ), and first order sensitivity analysis (SA, M,
  ; N,
; N,  ) indices for the AquaCrop model output of evaporation (E) and transpiration (Tr). Model input parameters were those sensitive by the Morris screening method.

| Years | Treatments | Irrigation Schedules and Irrigation Depth (mm) | Irrigation (I) | Precipitation (P) | I + P | ||||||||||||
|---|---|---|---|---|---|---|---|---|---|---|---|---|---|---|---|---|---|
| 6/8 | 6/13 | 6/27 | 7/7 | 7/12 | 7/19 | 7/25 | 7/31 | 8/6 | 8/15 | 8/20 | 8/21 | 9/2 | (mm) | (mm) | (mm) | ||
| 2014 | M | 80.6 | 80.6 | 80.6 | 30.7 | 272.5 | 241.0 | 513.5 | |||||||||
| N | 86.4 | 98.6 | 98.6 | 53.8 | 337.4 | 241.0 | 578.4 | ||||||||||
| 2015 | M | 69.1 | 53.6 | 72.9 | 87.2 | 51.9 | 90.6 | 425.3 | 150.6 | 575.9 | |||||||
| N | 69.1 | 75.7 | 77.0 | 78.5 | 72.2 | 102.9 | 475.4 | 150.6 | 626.0 | ||||||||
| Description | Default Values | Calibrated Values | |||
|---|---|---|---|---|---|
| Base temperature, °C | 8 | 8 | |||
| Upper temperature, °C | 30 | 30 | |||
| Leaf growth threshold (PexpUpper) | 0.14 | 0.14 | |||
| Leaf growth threshold (PexpLower) | 0.72 | 0.72 | |||
| Leaf growth stress coefficient curve shape (SFexp) | 2.9 | 2.9 | |||
| Minimum effective rooting depth (MinRootDepth), m | 0.3 | 0.3 | |||
| Maximum effective rooting depth (MaxRootDepth), m | Up to 2.80 | 0.8 | |||
| Senescence stress coefficient curve shape (SFsen) | 2.7 | 2.7 | |||
| Canopy cover per seedling at 90% emergence (CC0), cm2 per plant | 6.5 | 6.5 | |||
| Stomatal conductance threshold (PstoUpper) | 0.69 | 0.45 | |||
| Senescence stress coefficient (PsenUpper) | 0.69 | 0.5 | |||
| Crop coefficient for transpiration at CC = 100% (KcTr,x) | 1.05 | 1.25 | |||
| Time from sowing to emergence (Emer), GDD, °C d | 50–100 | 30–77 | |||
| Time from sowing to maturity (Mat), GDD, °C d | TSE a + 1450 − 1750 | 1551–1691 | |||
| 14M | 14N | 15M | 15N | ||
| Canopy growth coefficient (CGC), % (°C d)−1 | 1.2–1.3 | 1.34 | 1.15 | 1.18 | 0.94 |
| Canopy decline coefficient (CDC), % (°C d)−1 | 1.0 | 0.29 | 0.29 | 0.68 | 0.66 |
| Maximum canopy cover (CCx), % | 65–99 | 96 | 89 | 90 | 87 |
| Treatments | N | R2 | RMSE (%/mm) | NRMSE (%) | EF | d |
|---|---|---|---|---|---|---|
| CC (%) | ||||||
| 2014 M | 10 | 1.00 | 3.6 | 5.5 | 0.99 | 1.00 |
| 2014 N | 10 | 0.99 | 4.1 | 7.4 | 0.99 | 1.00 |
| 2015 M | 11 | 0.99 | 4.1 | 6.1 | 0.98 | 1.00 |
| 2015 N | 11 | 1.00 | 4.0 | 6.7 | 0.98 | 1.00 |
| ET (mm) | ||||||
| 2014 M | 12 | 0.98 | 17.827 | 8.1 | 0.99 | 1.00 |
| 2014 N | 12 | 0.98 | 19.471 | 8.3 | 0.99 | 1.00 |
| 2015 M | 21 | 1.00 | 10.740 | 4.4 | 1.00 | 1.00 |
| 2015 N | 21 | 0.99 | 15.198 | 6.3 | 0.99 | 1.00 |
| Treatments | Stage | DAP | Days | Tr (mm) | Daily Tr (mm⸱d−1) | E (mm) | Daily E (mm⸱d−1) | ET (mm) | Daily ET (mm⸱d−1) | Tr/ET | E/ET |
|---|---|---|---|---|---|---|---|---|---|---|---|
| 14 M | Initial | 1–42 d | 42 | 6.3 | 0.15 | 44.7 | 1.06 | 51 | 1.21 | 12.35% | 87.65% |
| Development | 43–57 d | 15 | 45 | 3.00 | 4.9 | 0.33 | 49.9 | 3.33 | 90.18% | 9.82% | |
| Mid-season | 58–150 d | 93 | 391.1 | 4.21 | 4.3 | 0.05 | 395.4 | 4.25 | 98.91% | 1.09% | |
| Late-season | 151–158 d | 8 | 15.4 | 1.93 | 0.9 | 0.11 | 16.3 | 2.04 | 94.48% | 5.52% | |
| Whole | 1–158 d | 158 | 457.8 | 2.90 | 54.8 | 0.35 | 512.6 | 3.24 | 89.31% | 10.69% | |
| 14 N | Initial | 1–48 d | 48 | 7.5 | 0.16 | 82.3 | 1.71 | 89.8 | 1.87 | 8.35% | 91.65% |
| Development | 49–68d | 20 | 48.2 | 2.41 | 24.4 | 1.22 | 72.6 | 3.63 | 66.39% | 33.61% | |
| Mid-season | 69–147 d | 79 | 323.6 | 4.10 | 18.7 | 0.24 | 342.3 | 4.33 | 94.54% | 5.46% | |
| Late-season | 148–158 d | 11 | 21.7 | 1.97 | 2.8 | 0.25 | 24.5 | 2.23 | 88.57% | 11.43% | |
| Whole | 1–158 d | 158 | 401 | 2.54 | 128.2 | 0.81 | 529.2 | 3.35 | 75.77% | 24.23% | |
| 15 M | Initial | 1–37d | 37 | 5.9 | 0.16 | 54.4 | 1.47 | 60.3 | 1.63 | 9.78% | 90.22% |
| Development | 38–59 d | 22 | 58.1 | 2.64 | 18.9 | 0.86 | 77 | 3.50 | 75.45% | 24.55% | |
| Mid-season | 60–126 d | 67 | 301 | 4.49 | 12.3 | 0.18 | 313.3 | 4.68 | 96.07% | 3.93% | |
| Late-season | 127–156d | 30 | 46.2 | 1.54 | 29.6 | 0.99 | 75.8 | 2.53 | 60.95% | 39.05% | |
| Whole | 1–156 d | 156 | 411.2 | 2.64 | 115.2 | 0.74 | 526.4 | 3.37 | 78.12% | 21.88% | |
| 15 N | Initial | 1–46 d | 46 | 8.4 | 0.18 | 72.5 | 1.58 | 80.9 | 1.76 | 10.38% | 89.62% |
| Development | 47–71 d | 25 | 61.5 | 2.46 | 40.7 | 1.63 | 102.2 | 4.09 | 60.18% | 39.82% | |
| Mid-season | 72–124 d | 53 | 236 | 4.45 | 20.2 | 0.38 | 256.2 | 4.83 | 92.12% | 7.88% | |
| Late-season | 125–156 d | 32 | 53.3 | 1.67 | 41.9 | 1.31 | 95.2 | 2.98 | 55.99% | 44.01% | |
| Whole | 1–156 d | 156 | 359.2 | 2.30 | 175.3 | 1.12 | 534.5 | 3.43 | 67.20% | 32.80% |
| Components | Treatments | Initial | Development | Mid-Season | Late-Season |
|---|---|---|---|---|---|
| Ke | M | 0.34 | 0.13 | 0.03 | 0.21 |
| N | 0.48 | 0.36 | 0.08 | 0.31 | |
| Kc Tr | M | 0.04 | 0.62 | 1.14 | 0.58 |
| N | 0.04 | 0.60 | 1.13 | 0.63 | |
| Kc | M | 0.38 | 0.76 | 1.17 | 0.79 |
| N | 0.52 | 0.96 | 1.21 | 0.94 |
© 2019 by the authors. Licensee MDPI, Basel, Switzerland. This article is an open access article distributed under the terms and conditions of the Creative Commons Attribution (CC BY) license (http://creativecommons.org/licenses/by/4.0/).
Share and Cite
Shen, Q.; Ding, R.; Du, T.; Tong, L.; Li, S. Water Use Effectiveness Is Enhanced Using Film Mulch Through Increasing Transpiration and Decreasing Evapotranspiration. Water 2019, 11, 1153. https://doi.org/10.3390/w11061153
Shen Q, Ding R, Du T, Tong L, Li S. Water Use Effectiveness Is Enhanced Using Film Mulch Through Increasing Transpiration and Decreasing Evapotranspiration. Water. 2019; 11(6):1153. https://doi.org/10.3390/w11061153
Chicago/Turabian StyleShen, Qianxi, Risheng Ding, Taisheng Du, Ling Tong, and Sien Li. 2019. "Water Use Effectiveness Is Enhanced Using Film Mulch Through Increasing Transpiration and Decreasing Evapotranspiration" Water 11, no. 6: 1153. https://doi.org/10.3390/w11061153
APA StyleShen, Q., Ding, R., Du, T., Tong, L., & Li, S. (2019). Water Use Effectiveness Is Enhanced Using Film Mulch Through Increasing Transpiration and Decreasing Evapotranspiration. Water, 11(6), 1153. https://doi.org/10.3390/w11061153


