1. Introduction
Increasing world population and consequent increase in fossil fuels consumption emerge the necessity of looking for new sources of energy; resources that are clean, cheap and renewable. The extracted energy from the sea is one of the alternatives to fossil fuels.
The possibility of converting wave energy into usable energy has been an inspiration to many inventors and researchers [
1]. Wave energy converters (WEC) are devices which convert sea waves to electrical energy. These devices are categorized into several types. Alamian et al. in 2014 evaluated the existing systems for converting the wave energy into electricity with the idea that they could be used in the Caspian Sea, which is the same sea studied in this paper [
2]. To achieve this, significant devices in this field along with the most critical design parameters were identified and analyzed. Based on the studies done, point absorbers with dominant oscillations in pitch direction are more consistent with the characteristics of the Caspian Sea. It is noteworthy that in addition to determining the type of wave energy converter, identifying the optimal dimensions and geometry according to the wave characteristics of each sea is of great importance.
Obtaining an optimal geometry can be achieved either by experimental tests or numerical simulations. Kofoed in 2005 carried out experimental hydraulic optimization on the Seawave Slot-Cone Generator WEC (SSG), which is an overtopping type WEC [
3]. They tested various geometries for the SSG with a scale of 1:25. They presented the improved SSG geometry with maximum power capture. In another investigation for this WEC in 2016, Oliveira et al. analyzed the effect of wave focusing walls (i.e., wave concentrators) on the performance of isolated SSG [
4]. They used a physical model built on a geometric scale of 1:40. In this study, they defined seven configurations by changing the opening angle and the crest level of those elements. Their test results proved that the use of wave concentrators would be advantageous. Flocard and Finnigan in 2010, performed an experimental study to investigate the influence of parameters, such as damping and inertia modification (ballasting) on the performance of bottom-pivoted pitching wave energy converters in simulated scaled sea states [
5]. Their results indicated that this type of WEC performs best in moderate sea states, although the net power output would be greater in larger sea states. In 2015, Lejerskog et al. presented the experimental results on power absorption from a directly driven point absorbing WEC at the Lysekil research site in Sweden [
6]. They changed the buoy size and the translator weight for the WEC and considered the absorbed power and the speed of the translator as their objective functions. Their results showed that the buoy size and also the translator weight have a high impact on the performance of the WEC. In 2017, Alamian et al. examined the effects of sea depth on the performance of a modified point absorber WEC using an experimental study [
7]. In their study, WEC oscillation in the directions of heave, surge, and pitch are measured and compared in different still water depths. The analysis of these results showed that the use of point absorber WEC with the dominant motion of pitch in deep water can provide better conditions for energy extraction.
There are very limited experimental investigations on the topic of geometry optimization of WECs. The reason is that although experimental tests are more accurate, they are costly and time consuming; moreover, the cases that can be surveyed in the experiments are limited, which is not the case in the numerical simulations. Hence there can be found more works on the numerical optimization of the WECs.
In 2006, Babarit and Clement used a multi-objective genetic algorithm (GA) for the shape optimization of SEAREV WEC [
8]. They consider several geometries for investigation of the optimized shape with regard to wave characteristics at the site of Yeu Island. In their research, they consider the absorbed power and displacement as two objective functions for the optimization process. By comparing the Pareto fronts for different shapes, they presented the optimized geometry for their WEC. McCabe et al. in 2010 optimized the shape of two degrees of freedom (surge and pitch) WEC using GA [
9]. They used a single non-dimensional objective function with maximum absorbed power in the numerator and a product involving the submerged volume and velocity in the denominator. The geometries which were applied for the optimization process were based on bi-cubic B-spline with either one or two planes of symmetry. They presented a unisymmetric geometry, with a bulbous body and ‘wings’ that slope backwards from the bottom upwards as the optimized shape for their WEC. In 2012, Gomes et al. optimized the geometry of a floating oscillating water column [
10]. A boundary element method code was used to calculate the hydrodynamic coefficients. Their results showed that the diameter of the floater, the submerged length, and the air chamber height have a large impact on the annual average power extraction. Kurniawan and Moan in 2012 applied a multi-objective genetic algorithm (GA) for obtaining the optimized geometry for one degree of freedom WEC [
11]. Their WEC was a horizontal composite circular cylinder oscillating about a horizontal axis fixed at the bottom. They used the mean absorbed power and submerged surface area as two objective functions for their GA. By variation of body dimensions, they obtained the optimized ones for their geometry. In another research in 2013, they optimized different wave absorbers oscillating about a fixed submerged horizontal axis [
12]. They studied geometric configurations with uniform simple cross-sectional shapes, viz. line, circle, and elliptical sections, and used reaction force and submerged surface area as two objective functions for the optimization process. Their simulation results revealed that among the cross sections considered, the elliptical one performed best. Shadman et al. in 2018, applied an optimization process on a one-body heaving point absorber for a nearshore region of the Rio de Janeiro coast [
13]. The optimized geometry of the WEC was determined by running a few simulations in the frequency domain and using the design of experiment method. They used software ANSYS-AQWA for the hydrodynamic diffraction analysis.
There are few published works regarding the optimal wave absorber geometries because of computational considerations; however, with the progress of computing capabilities, this procedure becomes more feasible. In this article, the optimization process is explained and studied for a point absorber wave energy converter with the dominant motion of pitch (for power take-off (
PTO) system). For the optimization process, the multi-objective GA is used with mean absorbed power and submerged surface area as the objective functions. The mean absorbed power is calculated with regards to the wave characteristics of the Caspian Sea. For the hydrodynamic simulation of the wave-body interaction, the boundary element method is employed as it is one of the most useful methods for modelling the boundary value problems, particularly for problems related to the hydrodynamic of marine structures [
14]. In this study, various shapes are considered for WEC geometry. The parallelepipedic hull shape is selected as the basic shape for the optimization process. All other geometries are obtained by implementing modifications on the upside and bottom part of this geometry and also changing the dimensions. After implementing the optimization process for these geometries, the Pareto fronts obtained from each shape are compared and the superior shape between these geometries is introduced for further investigation and optimization.
2. Theory
In this section, the theories and wave characteristics of the installation site are presented. First, the numerical formulation of the wave-body interaction is described, and then the specifications and wave characteristics of the Caspian Sea (the installation site) are presented. In the following, the extractable mean wave energy from this sea is studied. Finally, the multi-objective algorithm is explained.
2.1. Simulation of Wave-Body Interaction
For achieving the optimized shape of a WEC, we should be able to evaluate the performance of each shape in the target site. For computing the response of the device for each case, the simulation of wave-body interaction is necessary. Having the response of the WEC, the annual energy production at the given site can be derived, and it can be used as the core of optimization.
For simulation of the wave-body interaction, the NEMOH software (version 2.03, LHEEA Research Laboratory, École Centrale de Nantes, Nantes, Pays de la Loire, France) is used. NEMOH is a numerical solver for calculations of first order hydrodynamic coefficients in the frequency domain. It is based on linear free surface potential flow theory. It has been developed at Ecole Centrale Nantes for 30 years. It became open source in January 2014 [
15]. The theoretical and numerical aspects of the NEMOH are detailed in [
15,
16].
In the linear theory, the power take-off (
PTO) systems can be simulated in two ways. It can be considered either as a damper or as a spring and damper system. The simplest model to simulate the
PTO in wave energy converters is a linear damper system (
Figure 1), which is the typical case for the optimization problems.
For this case, the
PTO force can be obtained through the following equation:
is
PTO force,
is
PTO damping coefficient and
is velocity. The equation of motion for a sample WEC including a
PTO system is written as follows for the pitch direction:
where
is body mass,
is body rotation in the pitch direction,
is wave-body interaction force and
is gravity force. Writing Equation (2) in the frequency domain gives the below equation:
where
is added pitch moment of inertia,
is radiation damping coefficient in the pitch direction,
is hydrostatic stiffness coefficient in the pitch direction,
is wave amplitude and
is excitation force in pitch direction which includes Froude–Krylov and diffraction forces.
Importing the body specifications and wave characteristics, the NEMOH gives all the coefficients and also the excitation force in Equation (3). Having all the coefficients and the excitation force, the WEC rotation in pitch direction can be obtained by using Equation (3). Subsequently, the absorbed power by the WEC is calculated by the following relation:
2.2. The Caspian Sea
According to the literature, the WECs are optimized or designed concerning the characteristic of a specified sea or region; on this basis in recent years, many seas around the world have been studied by researchers [
17,
18,
19,
20,
21,
22,
23,
24]. Having in mind that the optimization process for this study is based on the wave specifications of the Caspian Sea, this section is dedicated to briefly introducing and exploring the characteristics of this sea. Furthermore, in this section, the sea data, used in this study is described, and wave energy potential near the coast of northern Iran is investigated.
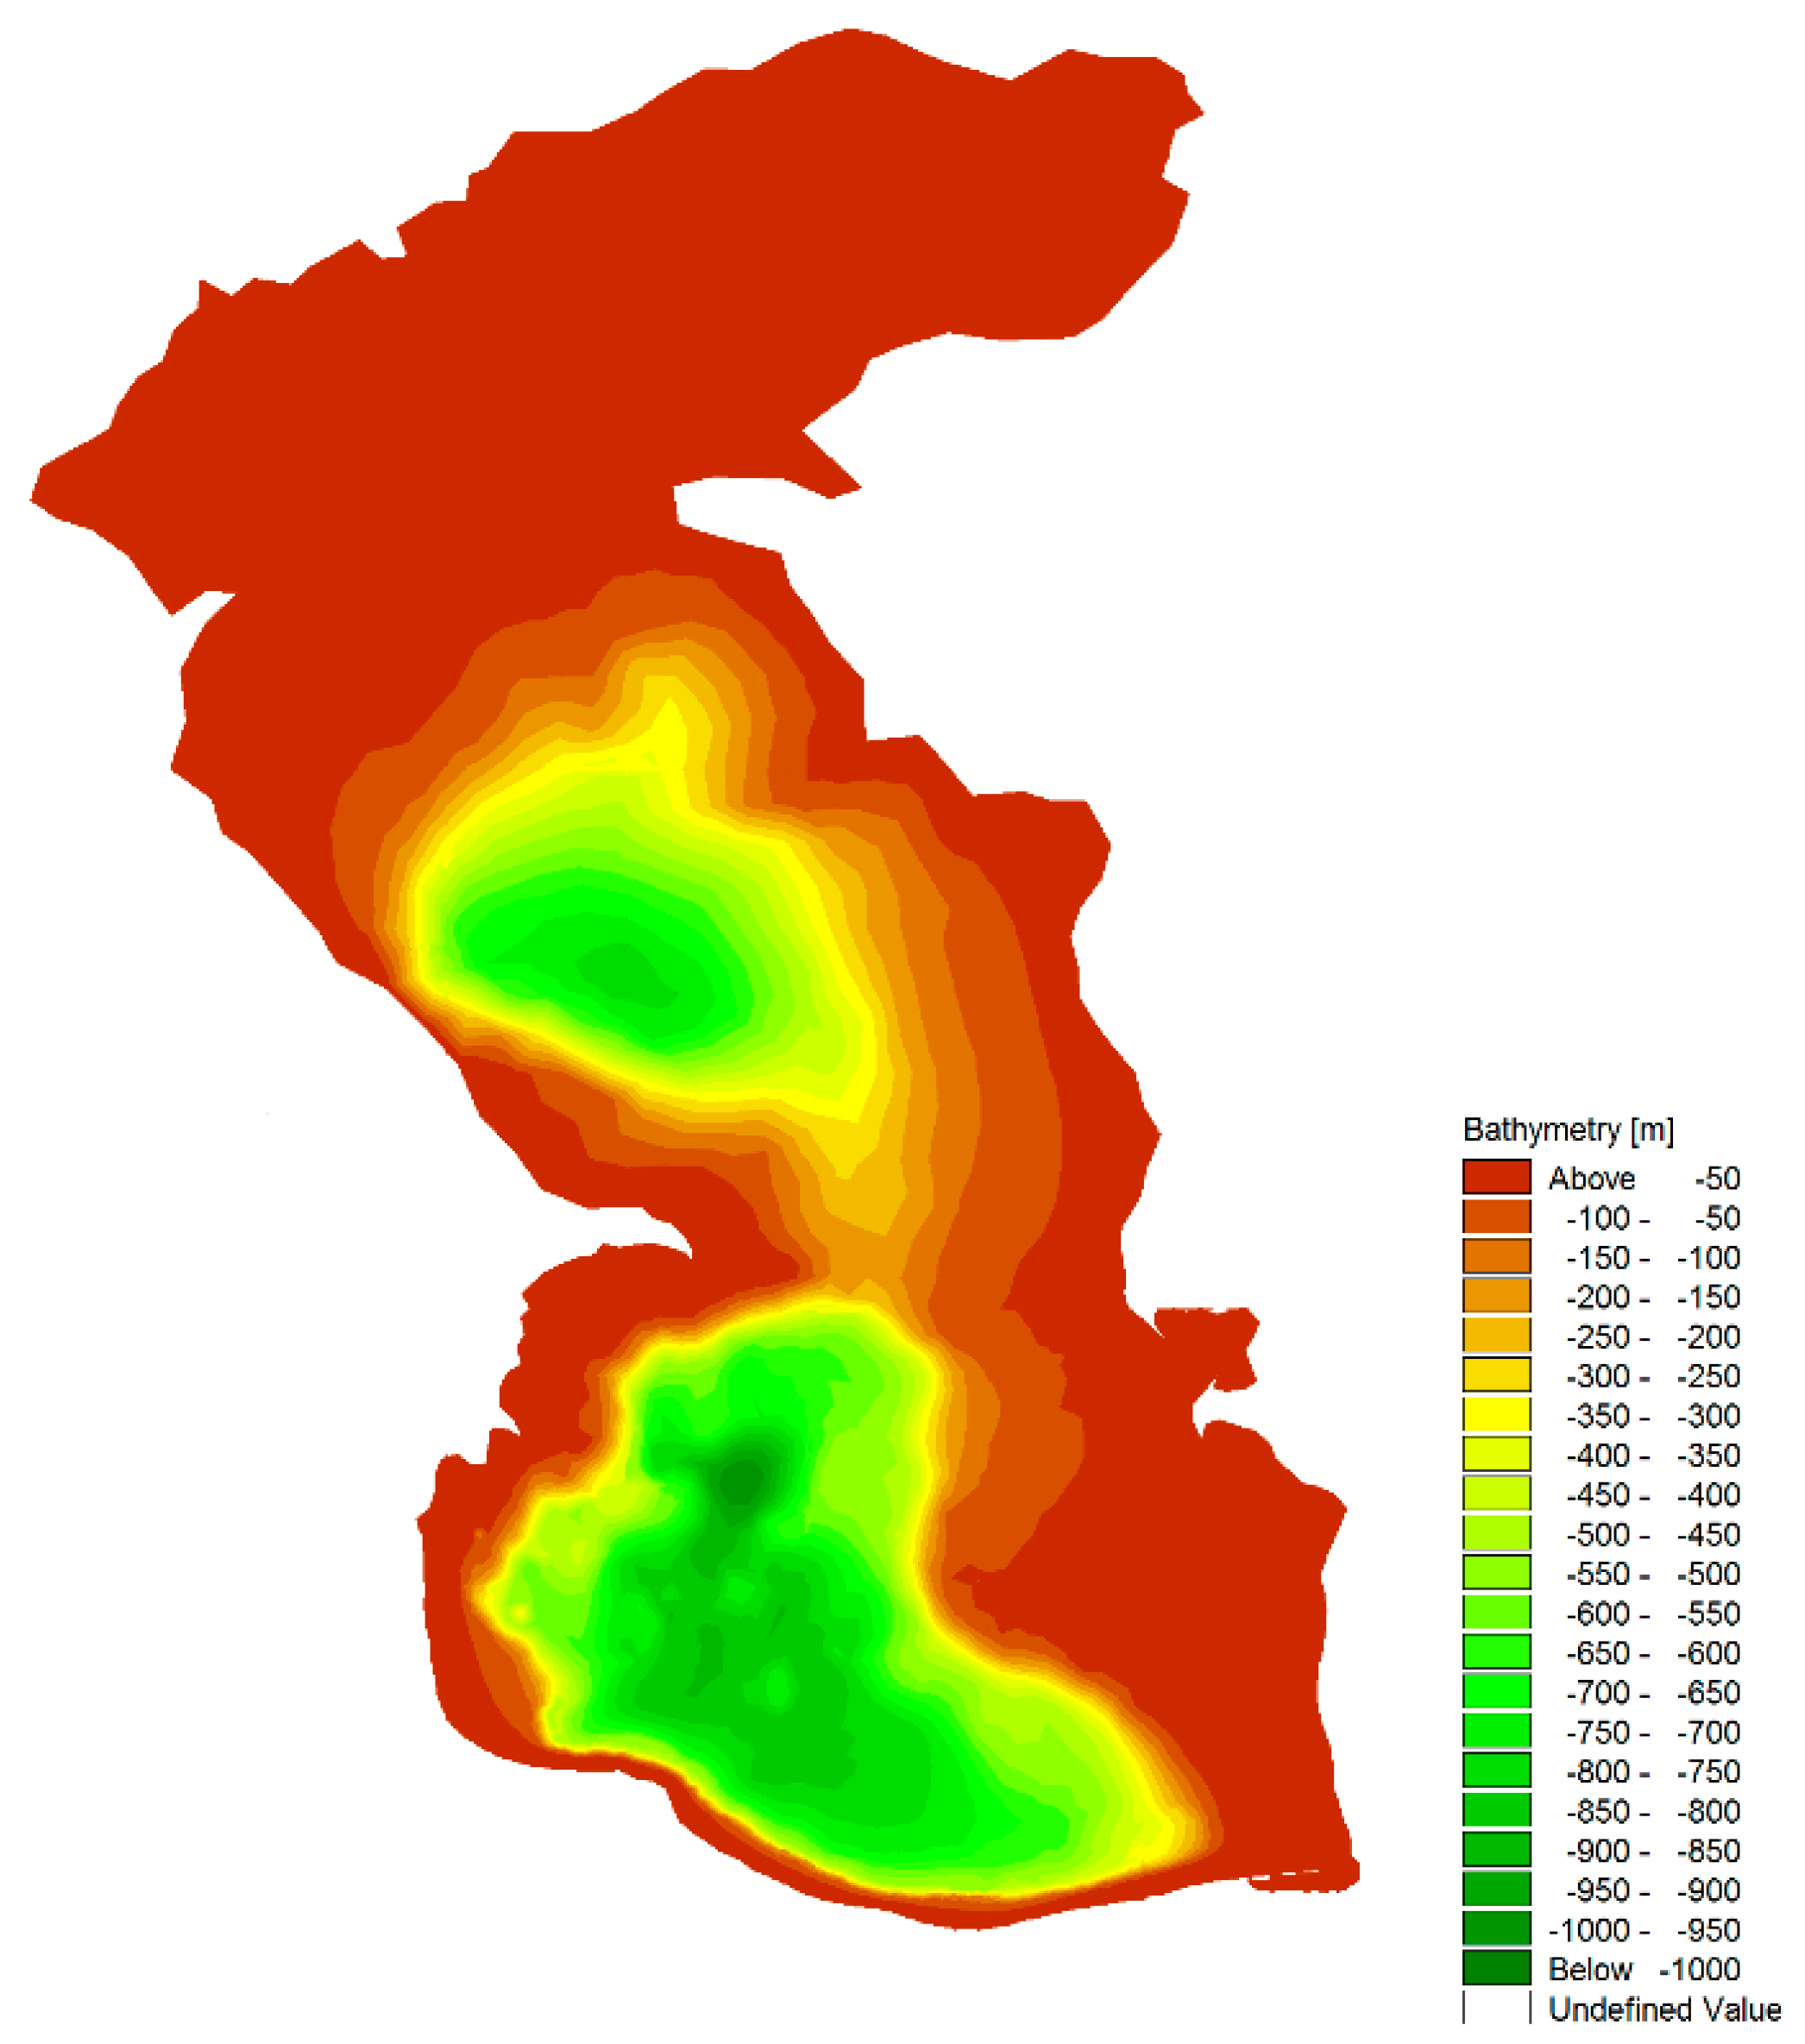
The Caspian Sea is the largest lake on the Earth, a closed basin in the northern hemisphere. It is situated where Southern and Eastern Europe meet the Asia continent, between latitudes 47°7’48” N and 36°20’24” N and longitudes 46°25’47.9994” E and 54°30’35.9994” E [
25]. The Caspian Sea is bounded on the south by Iran, on the east and northeast by Turkmenistan and Kazakhstan, on the northwest and west by Russia, and the west by Azerbaijan. Its coastline length is about 7000 km long which about 1000 km of it, belongs to Iran (from Astara to Atrak River). Although the Caspian Sea is a closed water basin, however, due to the large area and depth of the sea as well as different weather systems passing over it, most of the time it experiences storms and strong winds which subsequently result in storm waves. The northern part of the sea is very shallow so that only 0.5 percent of the sea water exists in the northern quarter of the Sea. The sea depth increases from north to south and reaches about 900–1000 m in some regions. The bathymetric contour map of the Caspian Sea is shown in
Figure 2.
The data used in this study, includes wave period, significant wave height, and wave energy from 2001–2015 in the southern part of the Caspian Sea in the maritime border of Iran that is extracted from the European Centre for Medium-Range Weather Forecasts (ECMWF) server at six-hour intervals [
27]. The ECMWF is assimilation meteorological data project for predicting the wave and wind future state for analyzing the long term measuring data and using the numerical modelling. The numerical models are applied based on the time evolution of the climate system from an initial state. The obtained data have been used in literature extensively and results produced based on these data has been validated against the experimental results of the installed buoys which are in excellent agreement [
28,
29,
30,
31].
2.3. Mean Annual Extracted Power
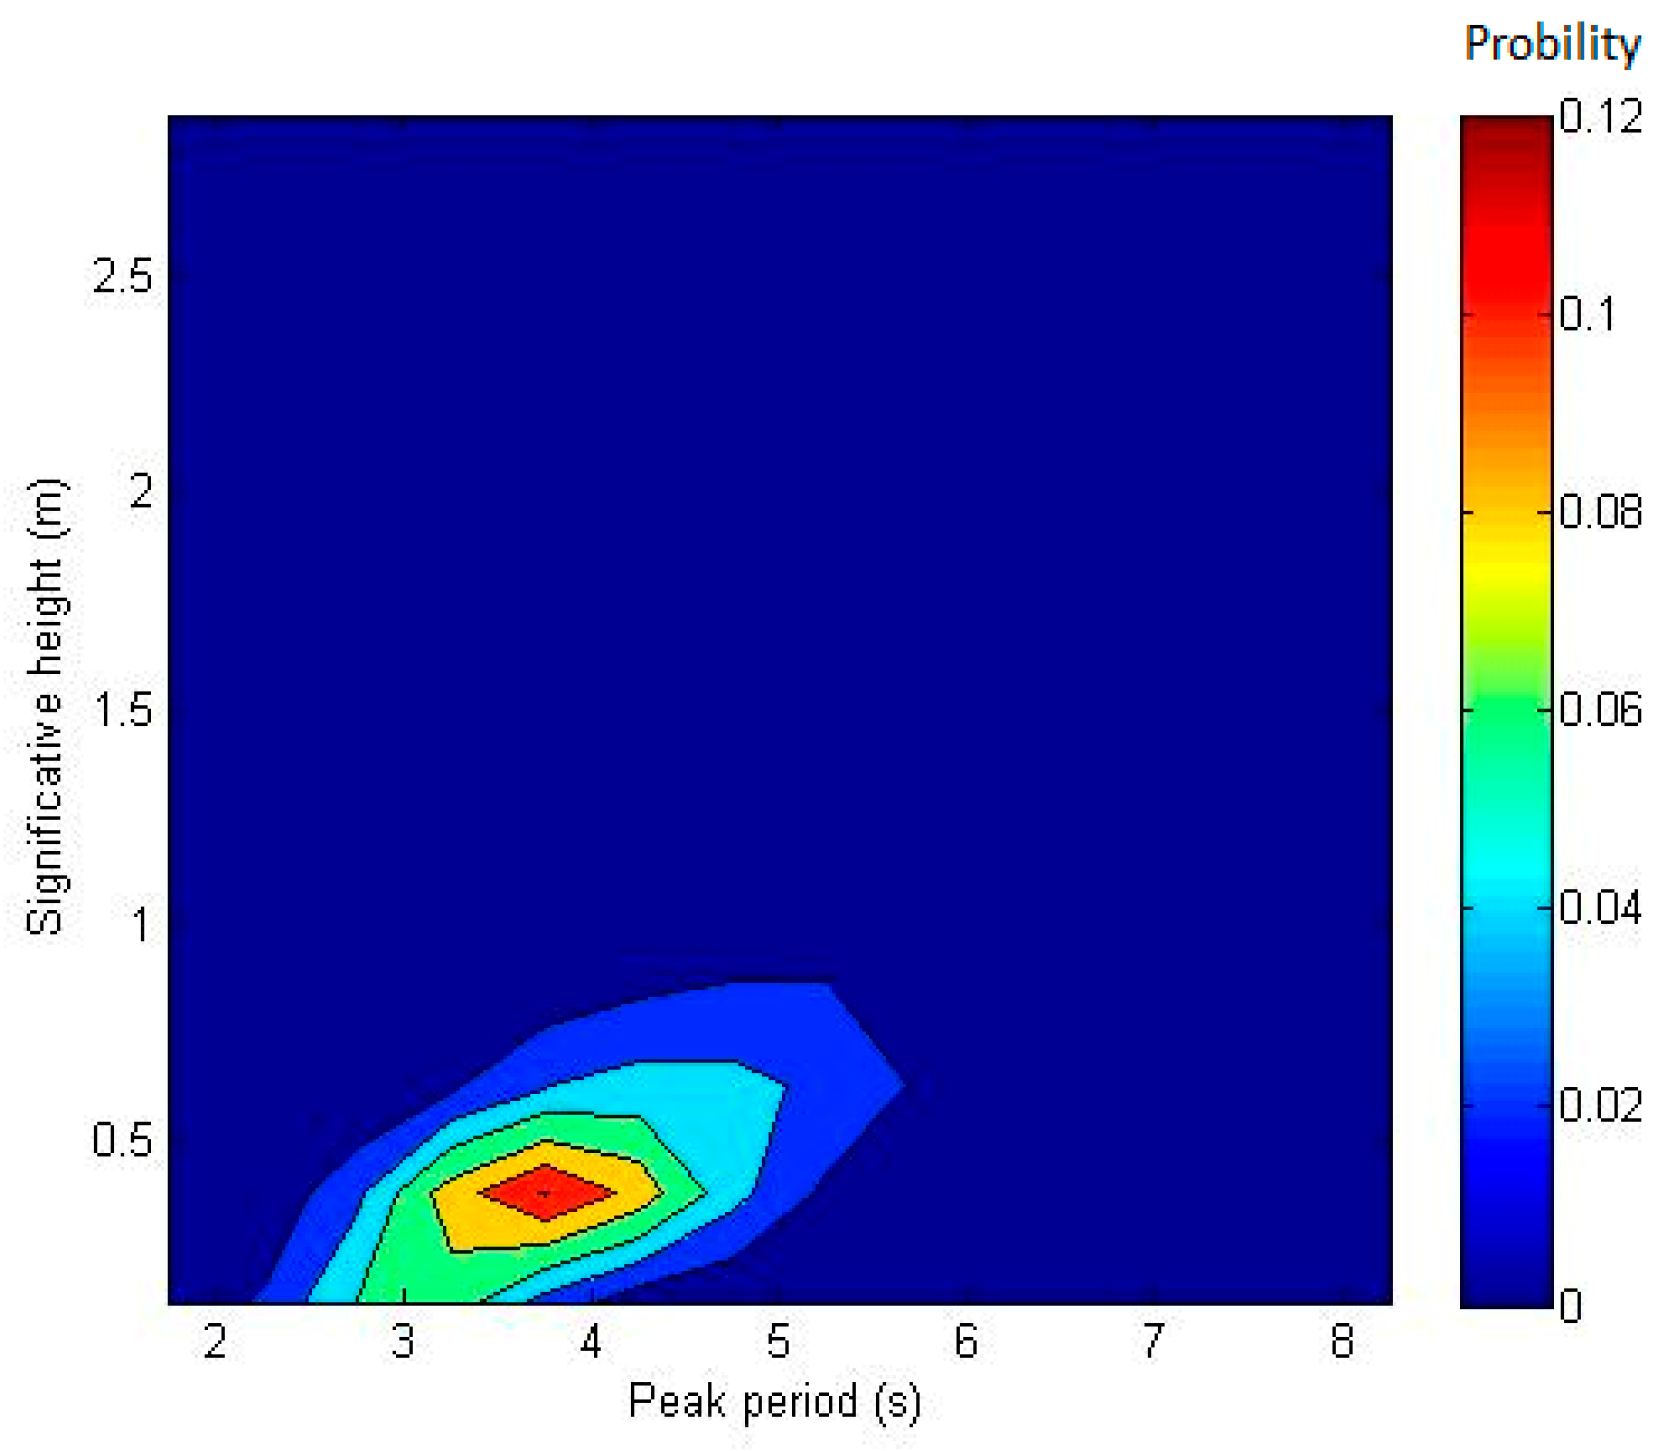
The mean annual extracted power for each shape is needed for the optimization process. For calculation of this parameter, the specifications of the site which the WEC will be installed in is needed. In this research, Babolsar on the North Coast of Iran is considered as the test case site [
27]. It is located at the southern part of the Caspian Sea. For this site, the fifteen year average of sea state statistics is shown in
Figure 3.
The mean annual power on this site is around 1 kW/m, which is not considerable; however, the amount of power is ideal for the entertainment platforms or touristic structures in the sea. In this case, the electricity transmission cost to the beach, which is considerable will be removed or decreased.
Importing the irregular wave characteristics is implemented by the energy spectrum model. The two most common models are JONSWAP (Joint North Sea Wave Project) and Bretschneider spectrum; however, the JONSWAP spectrum is more suitable for describing a developing sea state, as in the case of the Caspian Sea. The JONSWAP spectrum is an empirical relationship that defines the distribution of energy with frequency within the ocean. This spectrum is used to model the waves. The JONSWAP spectrum model is given by the following relation:
In the above equations,
is the wave spectrum,
is the wave frequency,
is the peak wave period,
is the significant wave height, and
is the frequency distribution parameter, which is considered as 1 for the wind driven waves. To obtain
the following formulas are used:
Moreover, the wave amplitude is calculated by:
In linear theory, the mean absorbed power for a given sea state is as follows:
In the above equation,
only depends on the sea state and
is calculated by Equation (4). For calculating the total absorbed power (
E) for a complete year, the absorbed power for all possible sea states (considering their probability of occurrence) should be summed together which gives the following relation:
From the above equation, it can be seen that the annual energy production depends on the test site and also the mean absorbed power.
2.4. Genetic Algorithm
In this research, the optimization process is based on a genetic algorithm (GA). Implementation of the optimization algorithm is conducted in several steps. The algorithm starts with the generation of an initial population; the population is then evaluated based on its objective functions. Afterward, from among this population, some members will be elected; by applying genetic mutation and crossover operators on them, the next generation of the so-called children will be produced.
In the next step, if the defined stop conditions for the problem have been satisfied, the optimization process ends and the point at which the current generation have the highest fitness value will be introduced as the optimal point. Otherwise, the previous steps are repeated and generation number increases.
Multi-objective optimization methods are capable of optimizing issues which have complex equations and also have multiple variables and objective functions. The objectives for the current optimization problem are based on maximizing the mean absorbed power, which is related to the efficiency of the WEC and also minimizing the submerged surface area, which is considered as a parameter to reduce the cost of the system. For the current study, the population and generation sizes are considered as 40 and 100, respectively. With selection of these quantities, the genetic algorithm calls NEMOH 4041 times to reach optimal results for each parameter. The genetic algorithm flowchart for the shape optimization of the WEC is depicted in
Figure 4.
3. Results and Discussion
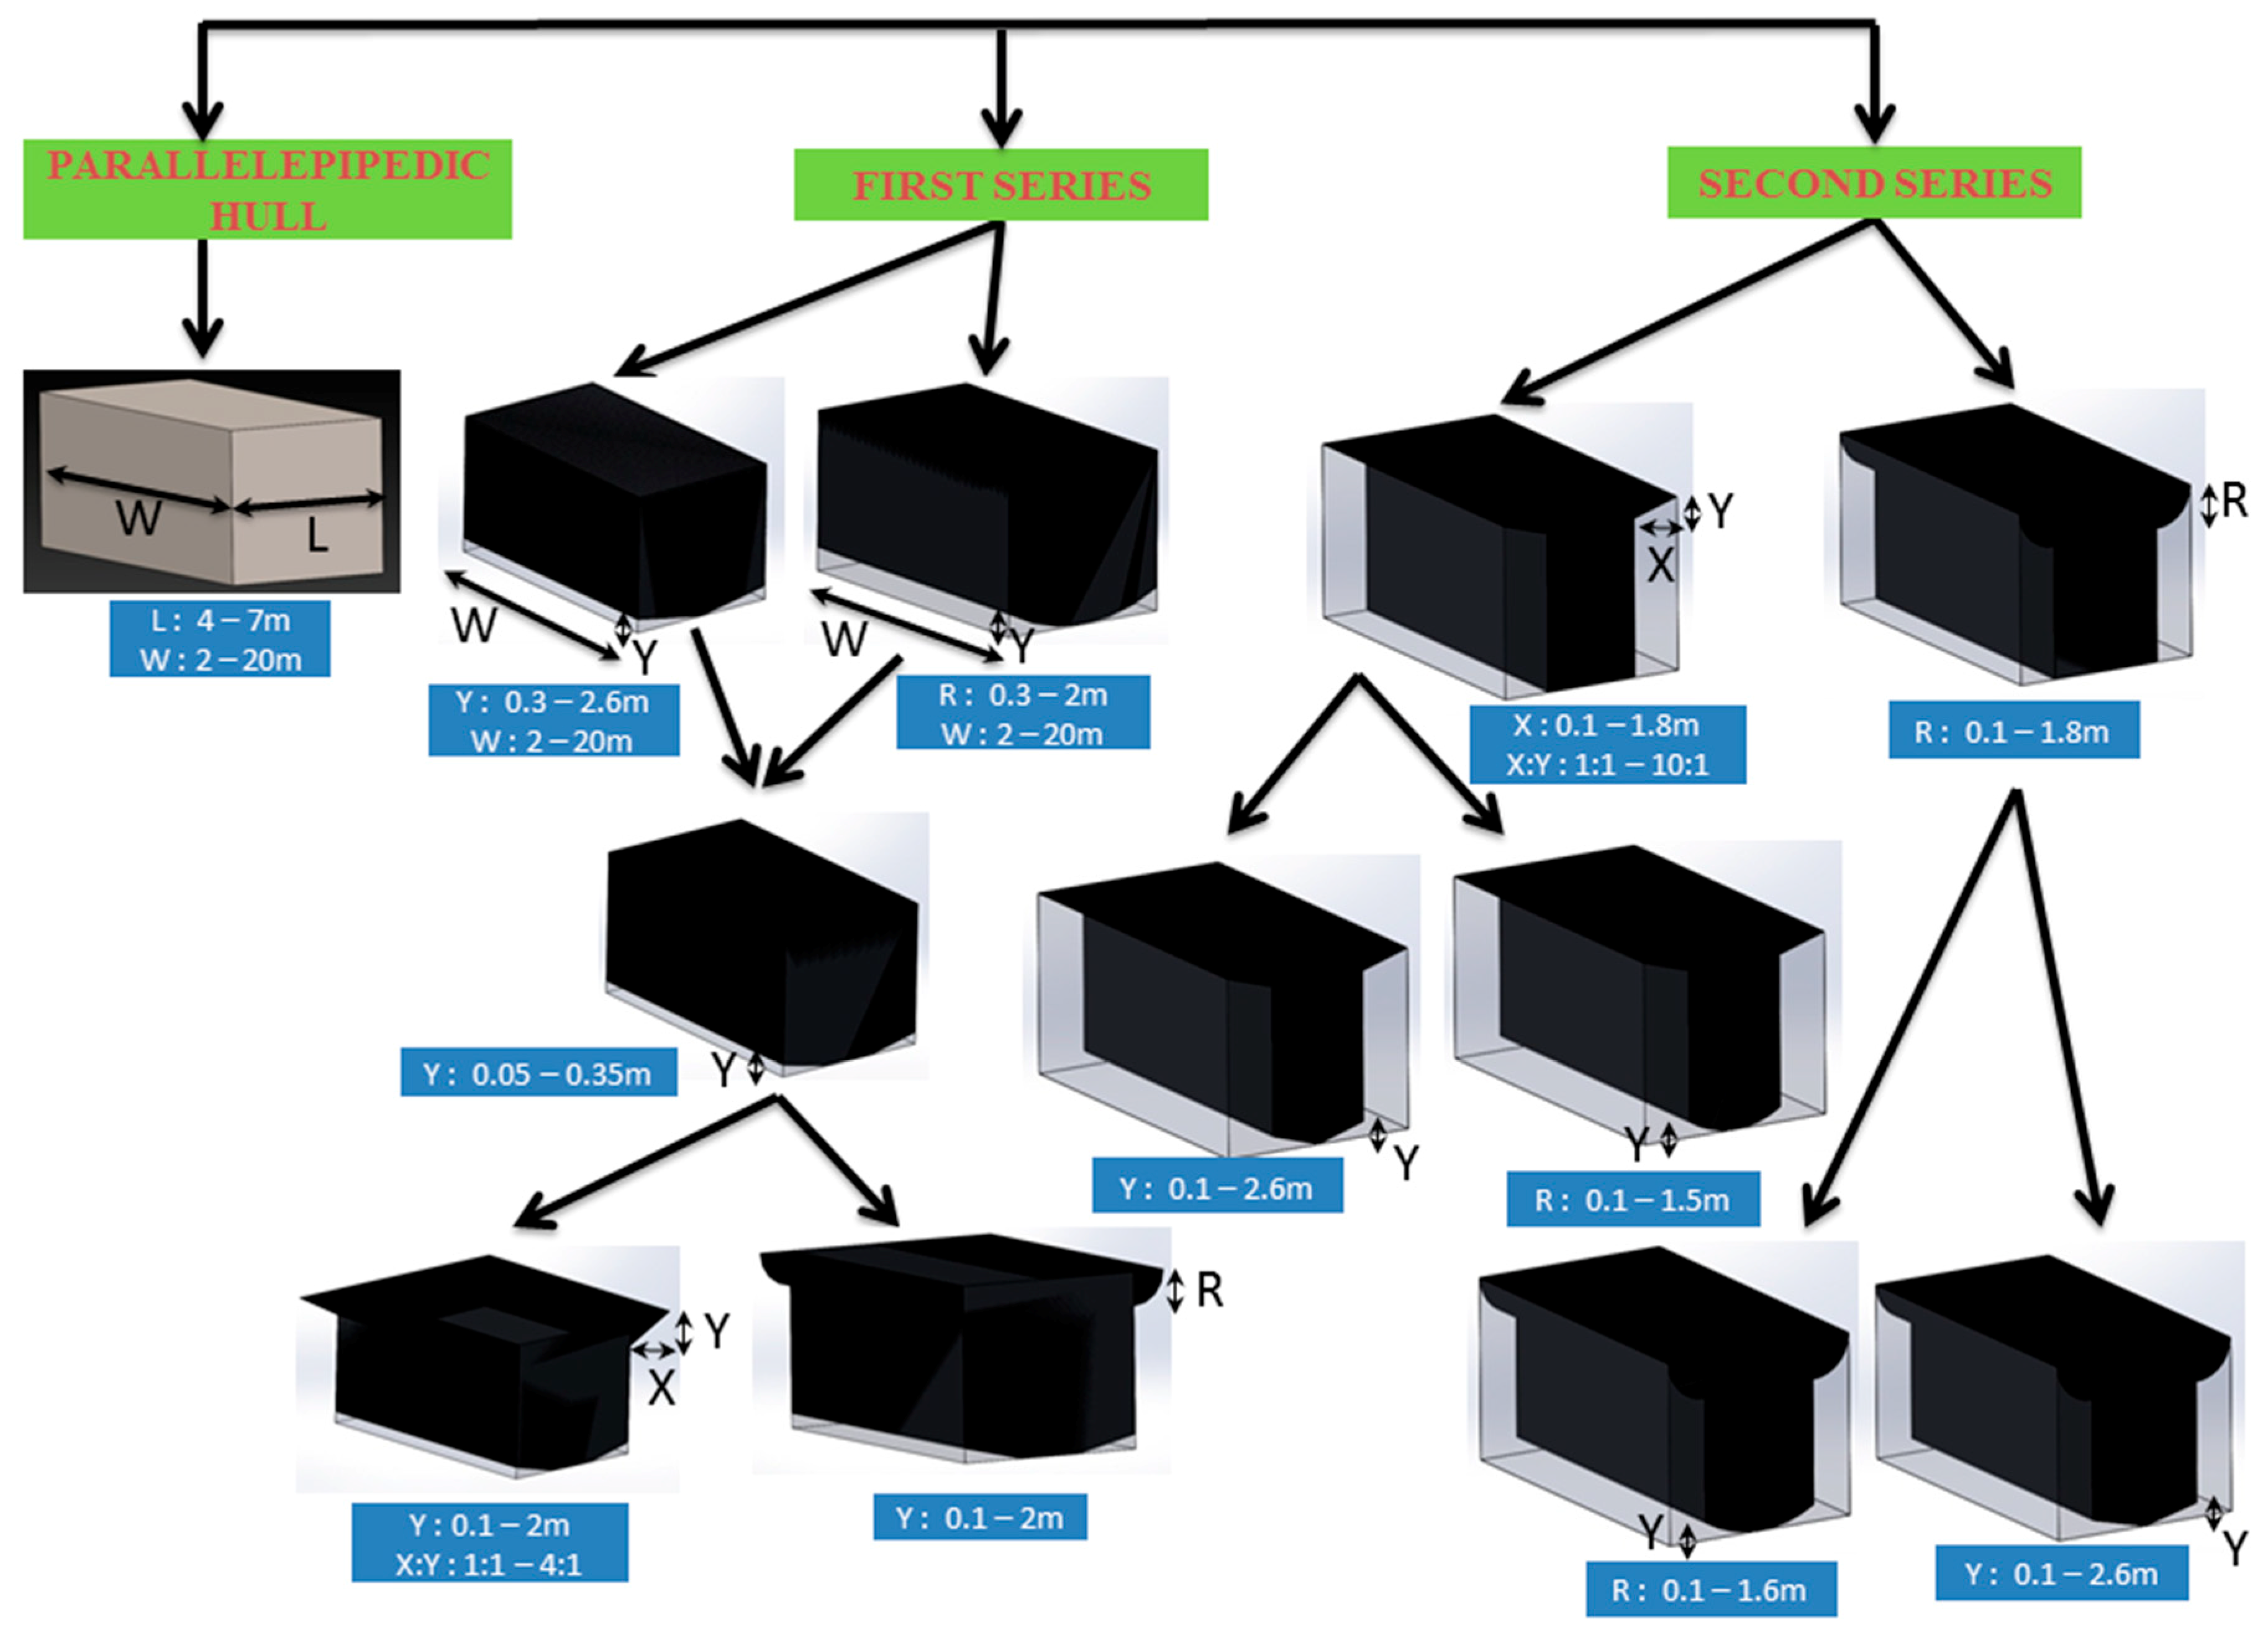
In this section, the results are reported and analyzed in three sections. The first one is dedicated to the simple shape of parallelepipedic hull geometry. The second section deals with the effects of shape variation on the parallelepipedic hull geometry with keeping the minimum length of the body the same as the optimized length of the parallelepipedic hull. This means that the upside wings of the second series geometries are added to the main parallelepipedic hull geometry. In the third section the shape variation is also implemented on the parallelepipedic hull geometry; however, the difference here is that in these series the maximum length of the bodies is equal to the optimized length of the parallelepipedic hull.
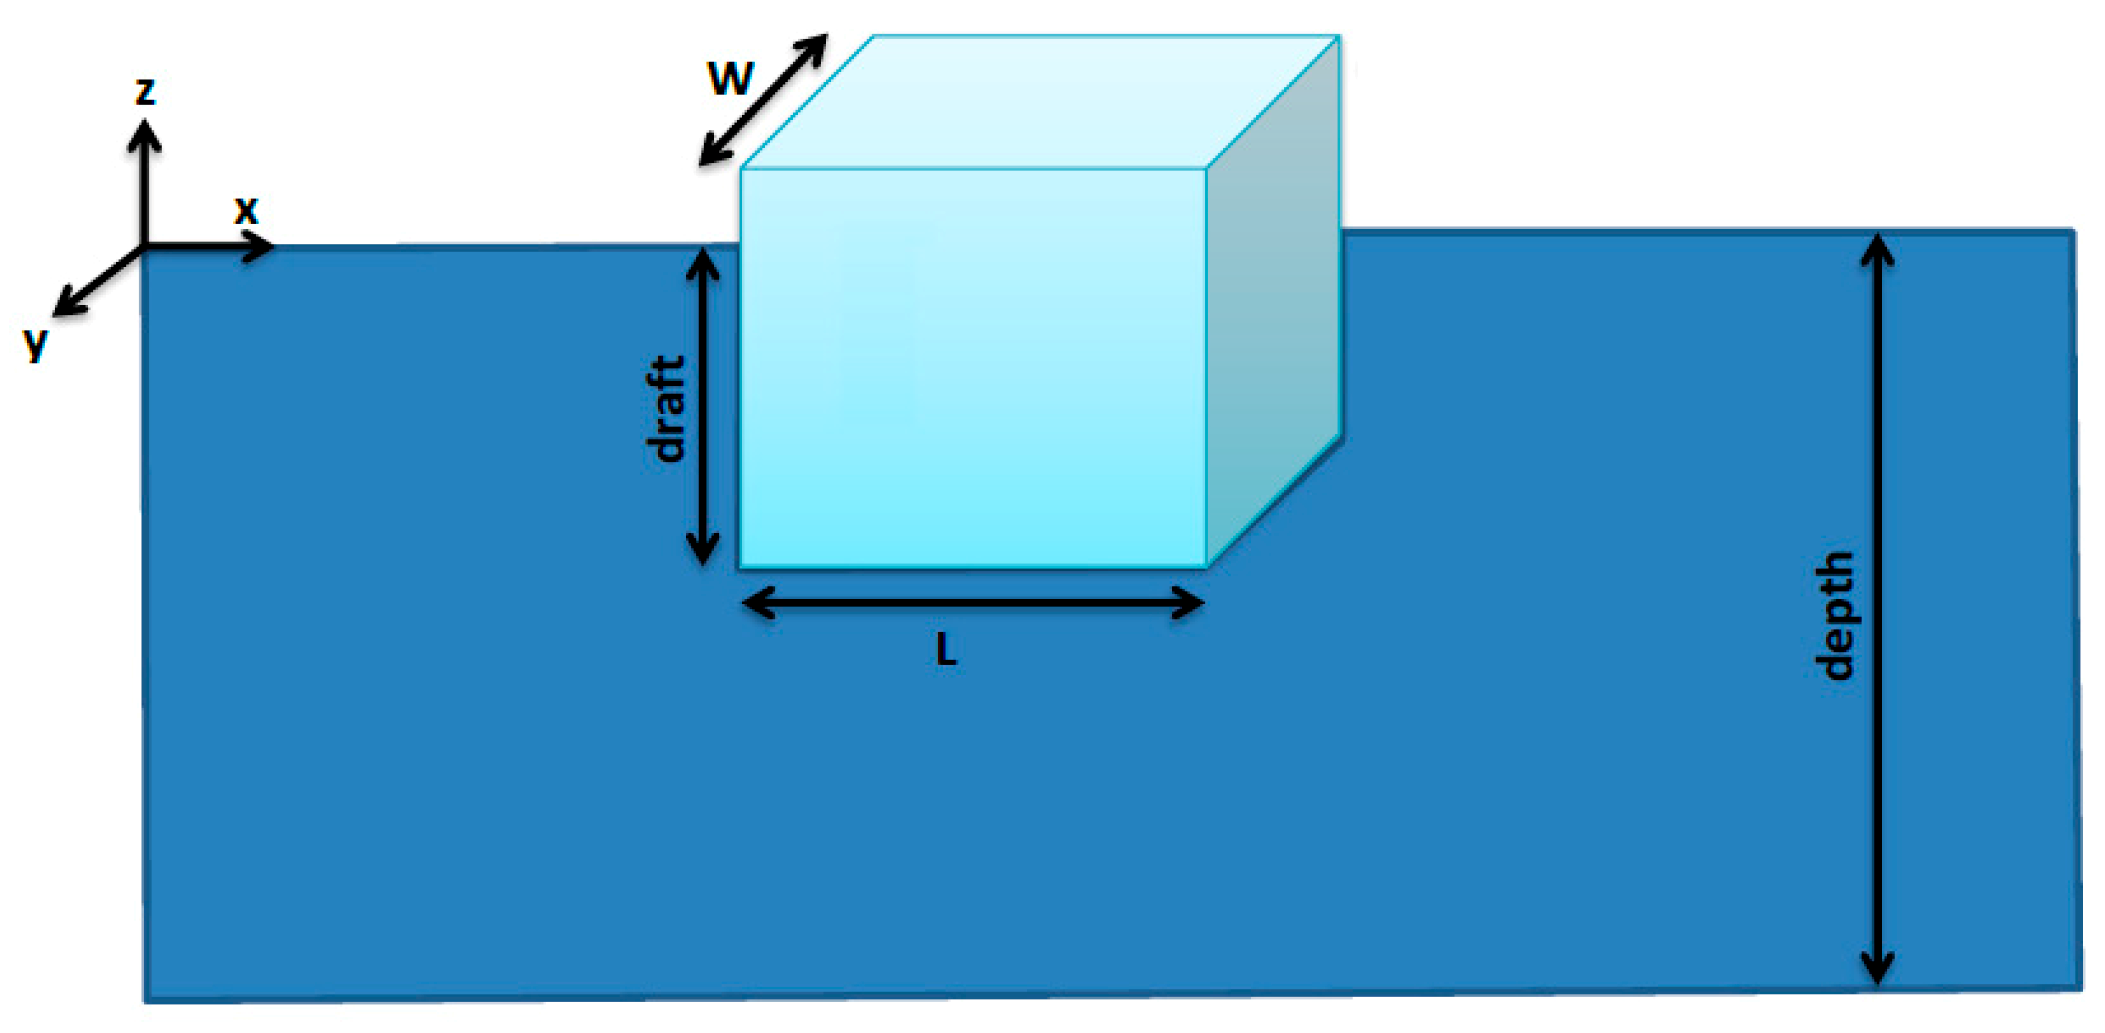
Figure 5 shows the various shapes used for the optimization process; also, it can be seen in this figure that how the geometries are changed in three different sections. In the optimization process, the water depth and body draft are 8.5 m and 3.6 m, respectively, for all geometries.
To survey the stability of the above models, it is necessary to carry out the related calculations. To determine the stability of the models, metacentric point is defined. If the floating object is slightly disturbed from its equilibrium position, the center of buoyancy changes, but the axis of symmetry does not change. To find the metacentric point, the new vector of buoyancy force extends to cut the axis of symmetry. This point is indicated by M. For the equilibrium state of the floating objects there are the following situations:
If the center of gravity is lower than the metacentric point, the object will have a stable equilibrium.
If the center of gravity is higher than the metacentric point, the object will be unstable.
If the center of gravity matches the metacentric point, the object has a neutral equilibrium.
The following formula can be used to determine the stability state of the model:
On the above equation,
Vsub is submerged volume of the body and
I0 is the area moment of inertia of the waterline footprint of the body about its tilt axis O. If the metacentric height
MG is positive, the body is stable and if it is negative, it will be unstable. This is shown in
Figure 6.
With considering above calculations, stability evaluation was conducted for the mentioned models in
Figure 6 in order to ensure that the model is stable under the selected ranges that are considered for the optimization process.
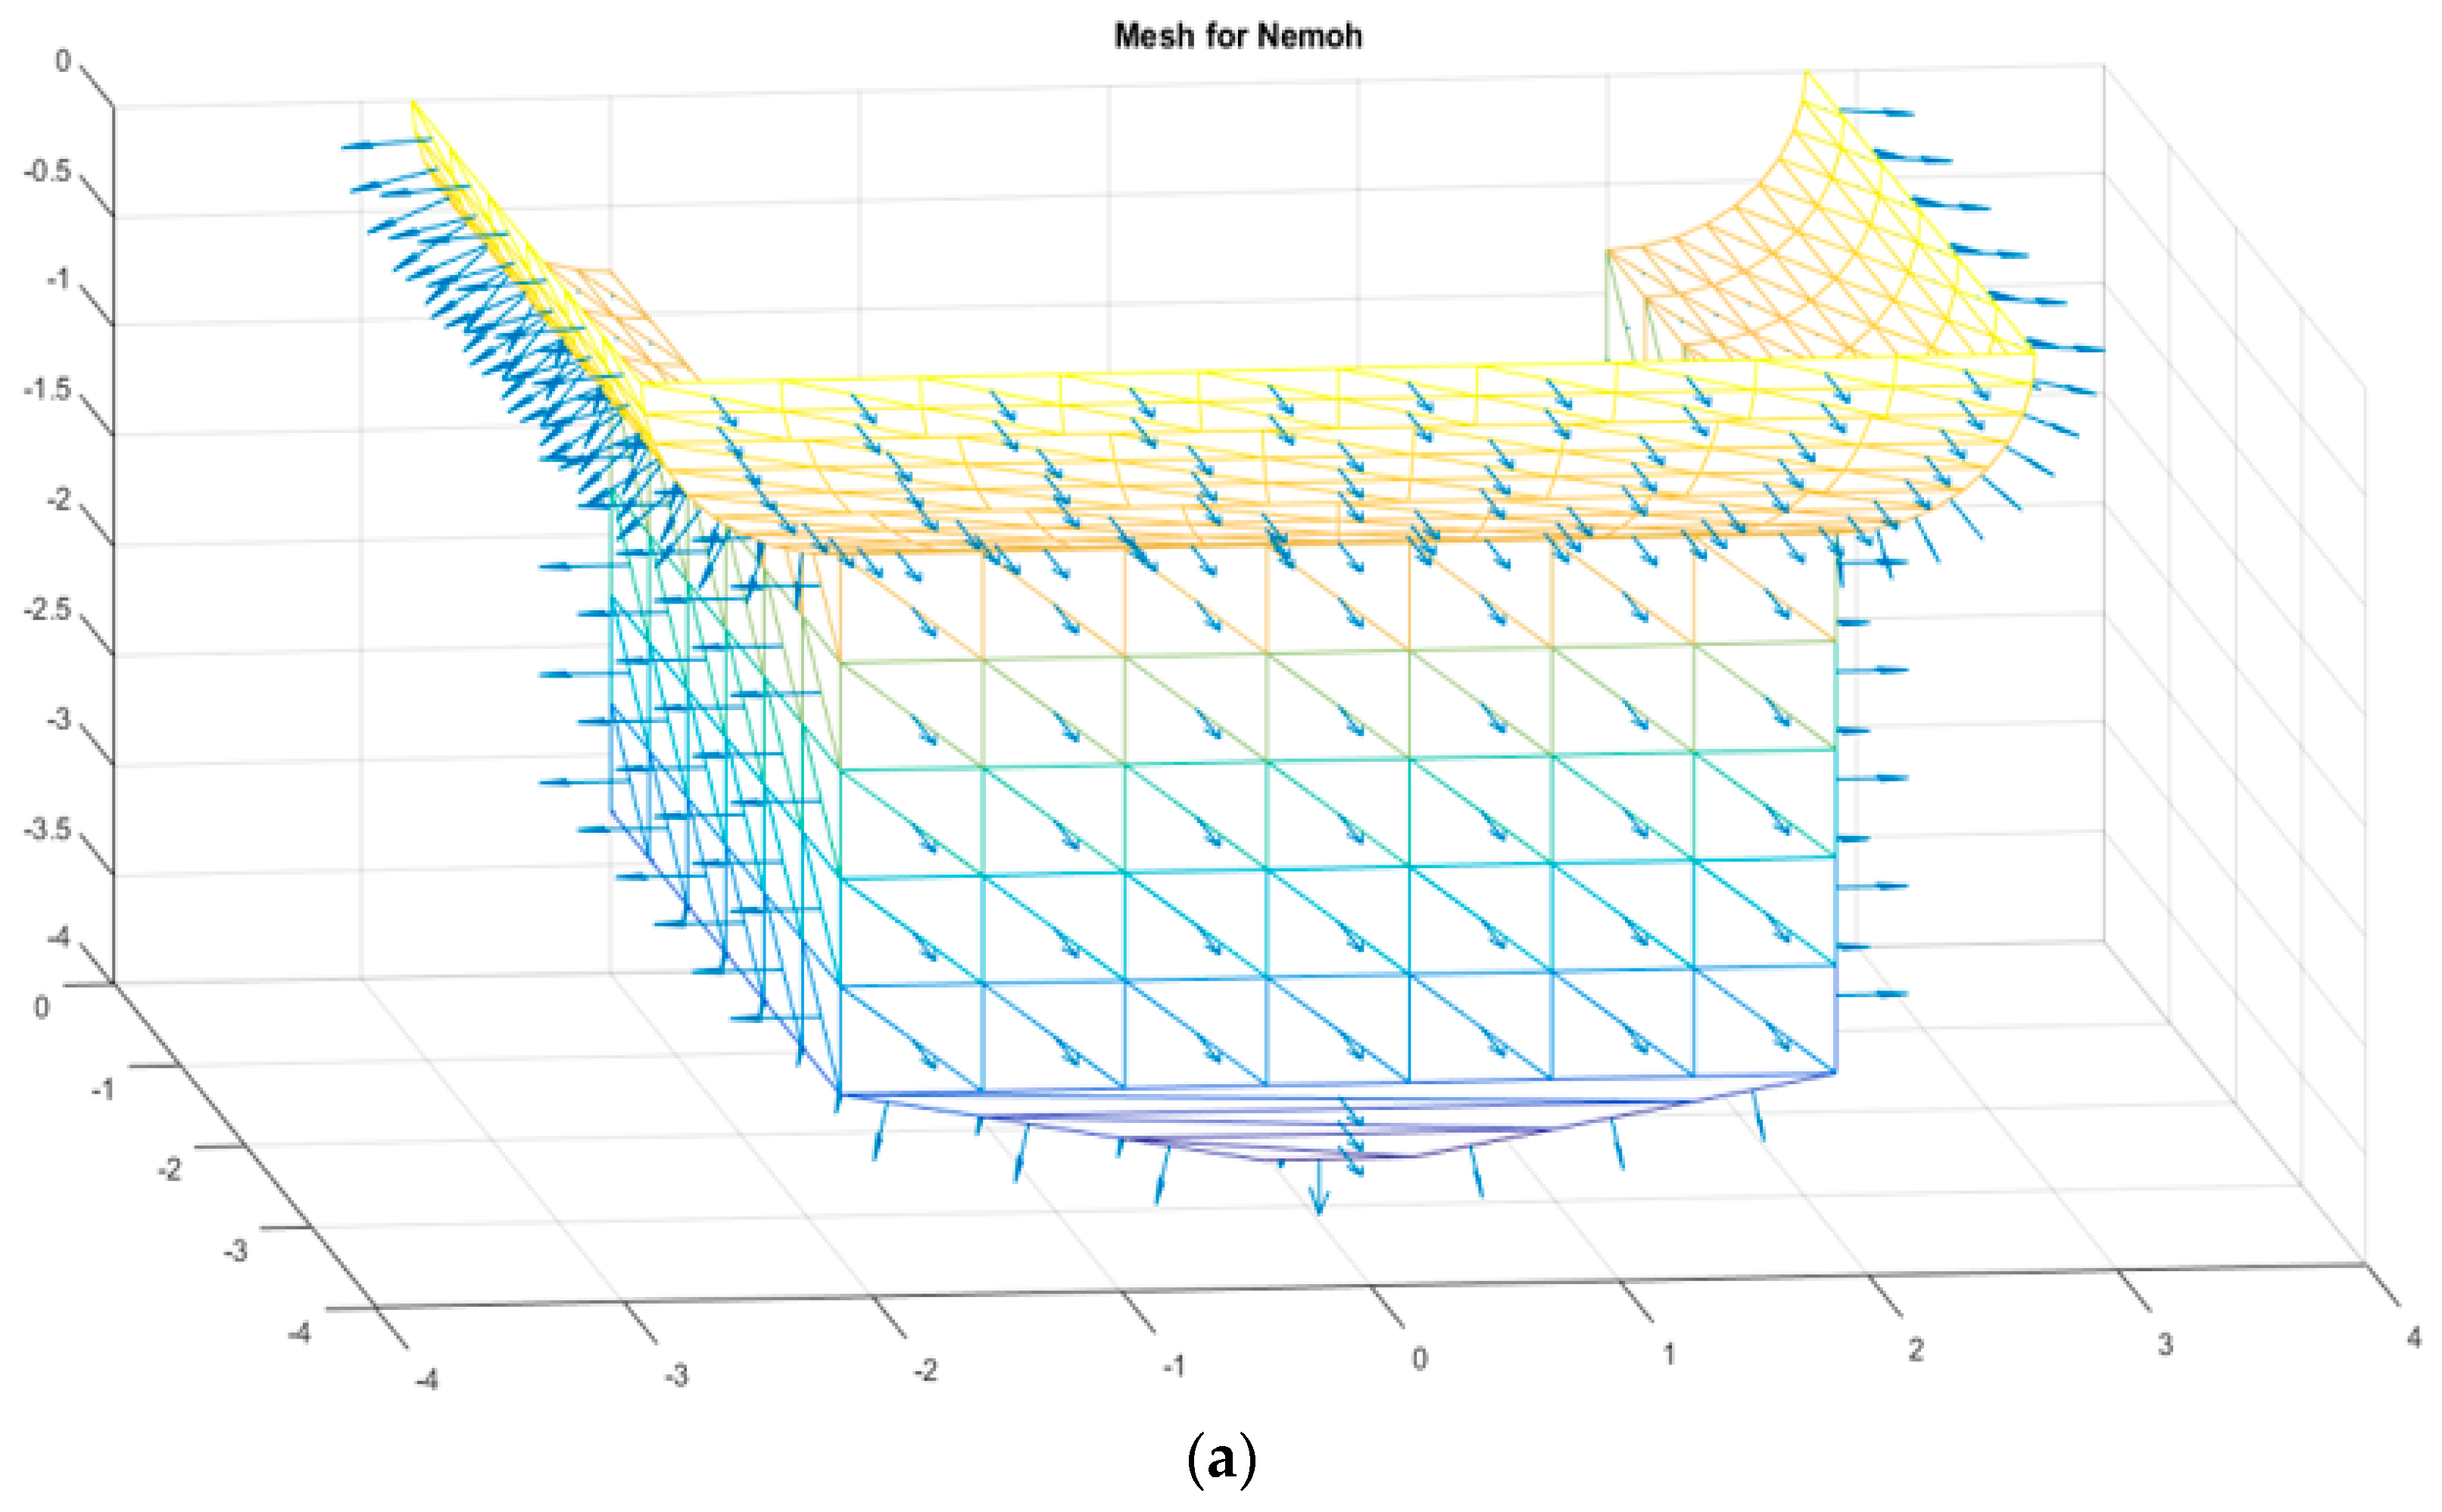
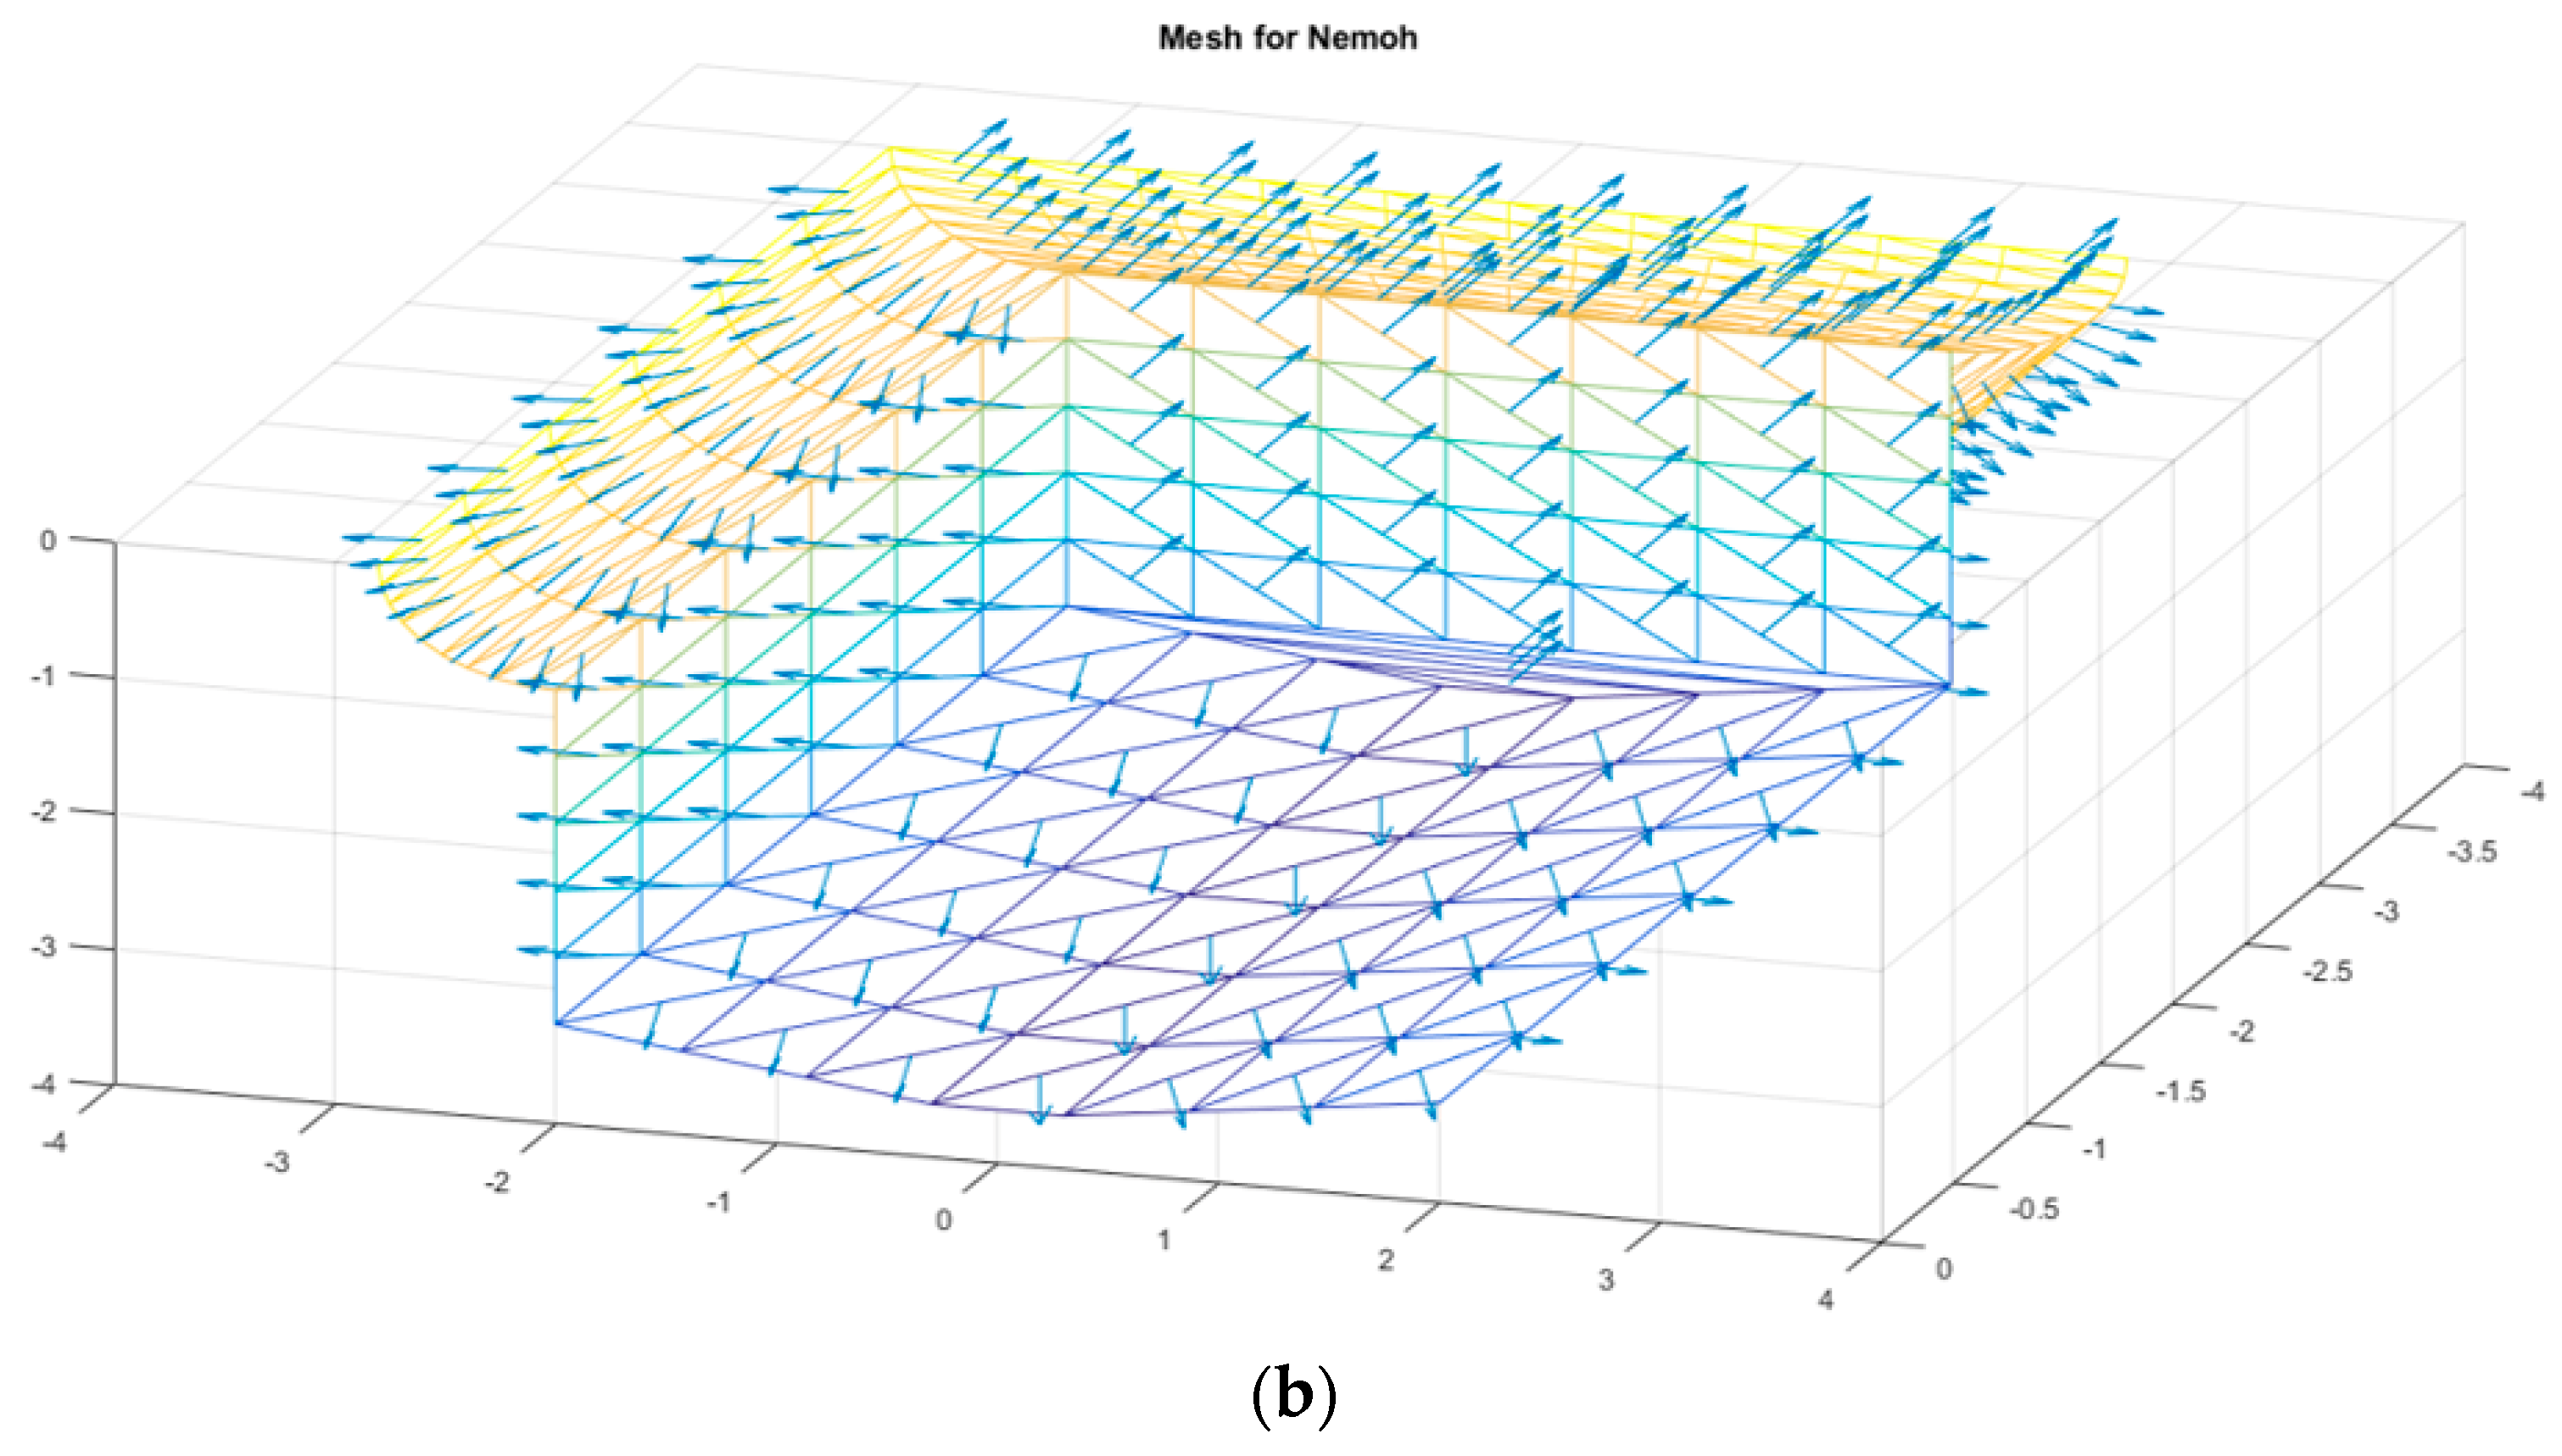
As mentioned in previous section, the NEMOH software is used for numerical simulations in this research. This software uses triangular panels to produce mesh. In
Figure 7, the generated mesh is shown for one of the geometries used in the numerical simulation process. In this sample geometry, 326 panels are used for meshing. The arrows represent the direction of normal vector for each panel. To ensure considering proper mesh quantity to solve the hydrodynamic problem, a mesh independence study is carried out for this geometry as an example. To do this, the geometry shown in
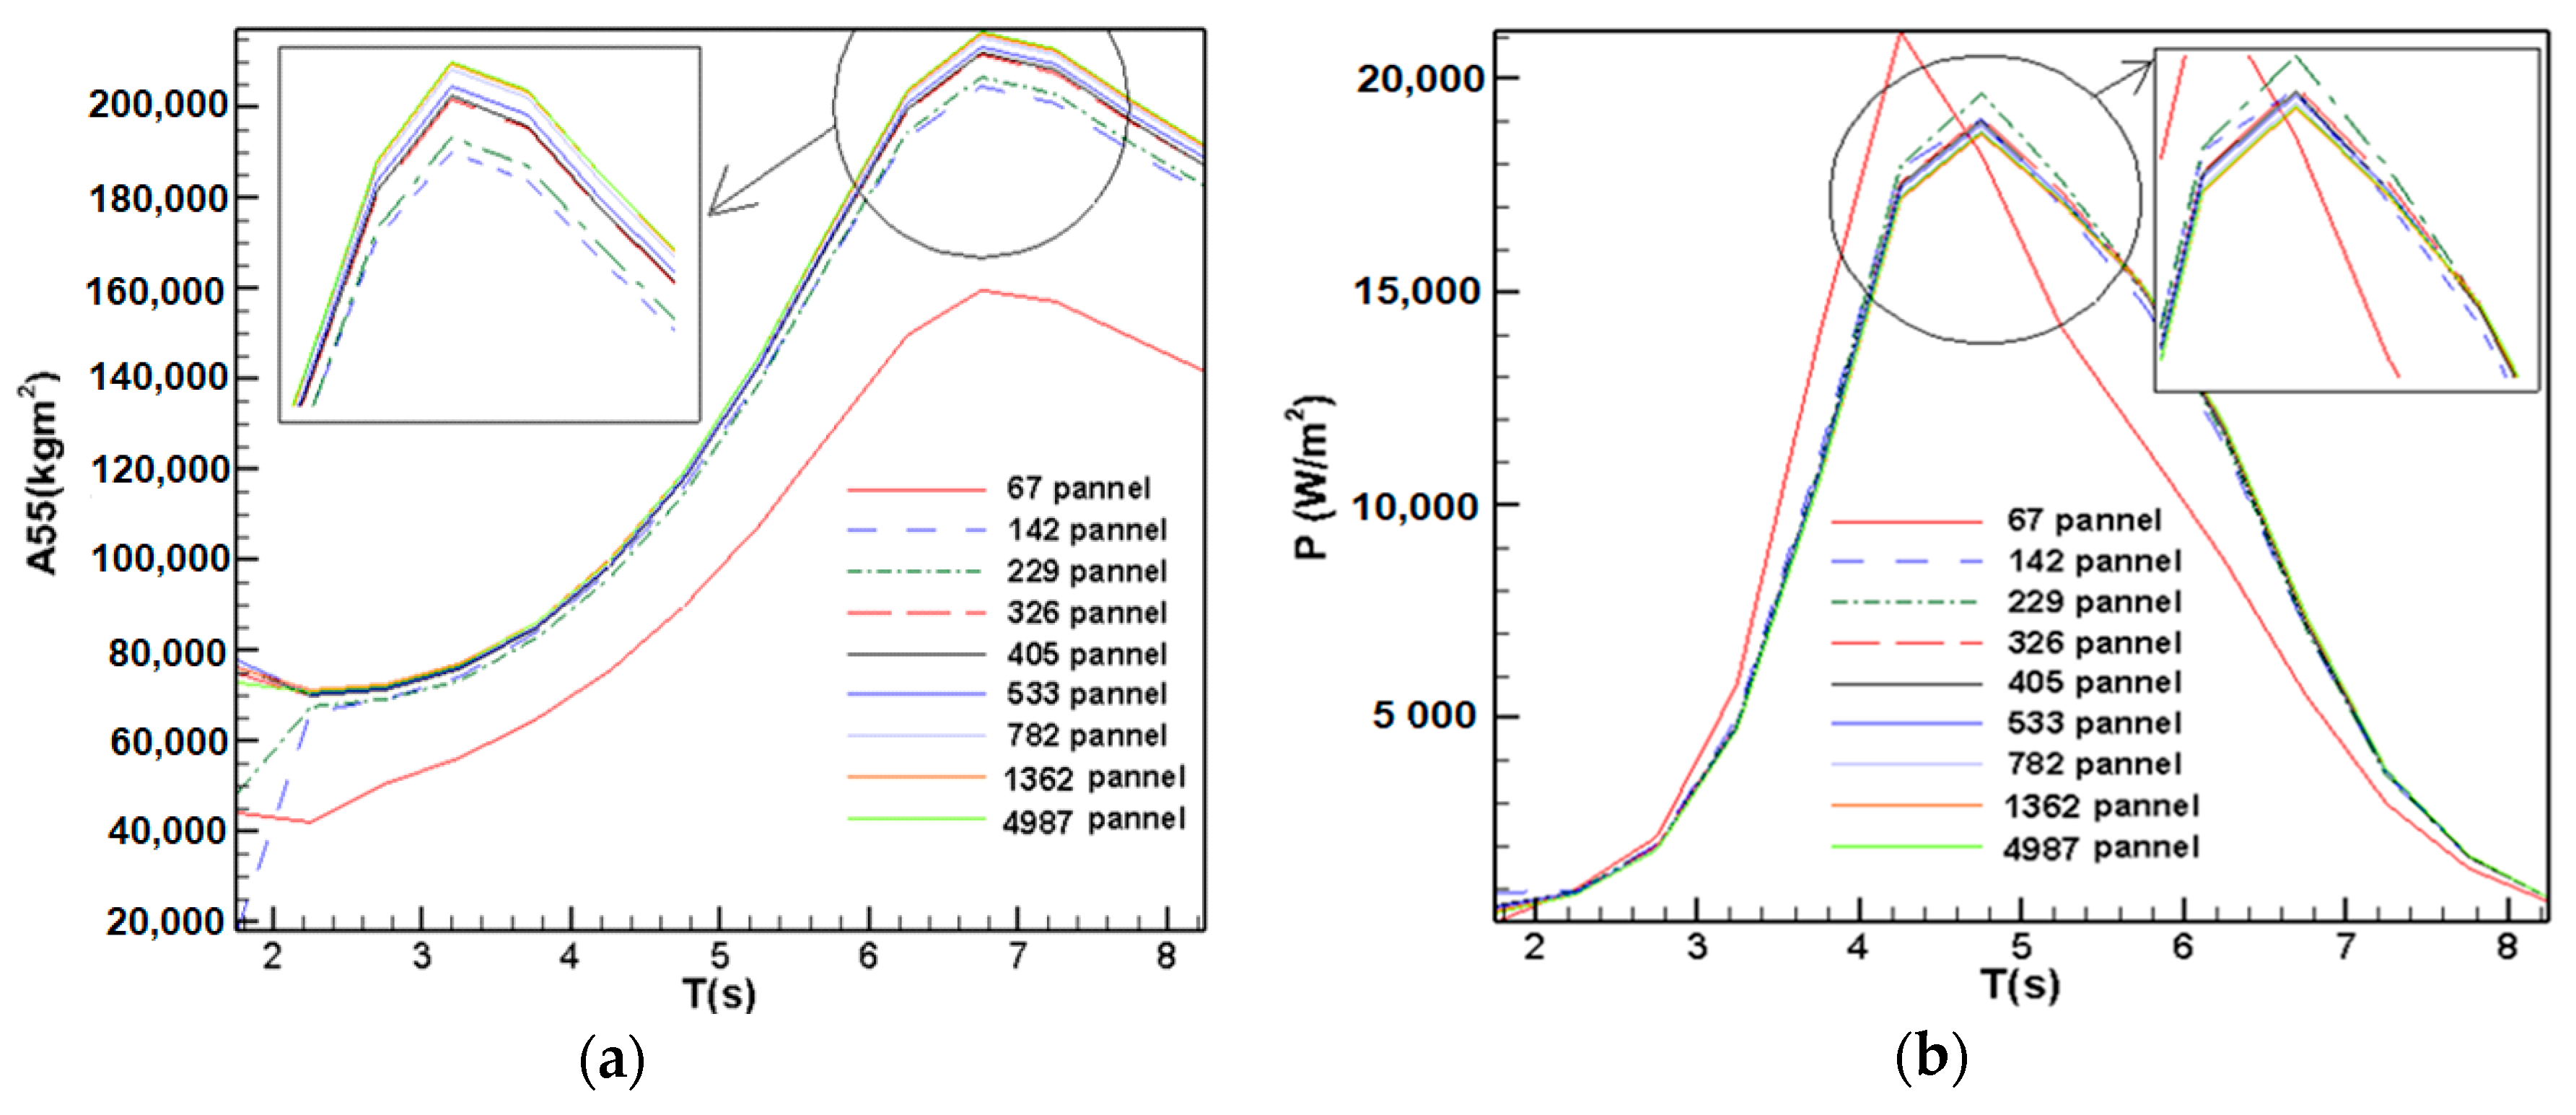
Figure 7 is numerically simulated with the panel numbers of 67, 142, 229, 326, 405, 533, 589, 743, 782, 887, 963, 1362, 1839, and 4987 panels. The simulation results are shown in
Figure 8a,b for the added pitch moment of inertia
and the power obtained from the converter in different periods. Horizontal axis in these figures shows the wave period that have been selected from 1.75–8.25 seconds due to the characteristics of Caspian Sea waves. It is worth noting that some results have not been shown to make the results clearer in these figures.
Considering the simulation results for 4987 panels as a criterion, the maximum error for the rest of the simulations is shown in
Table 1 and
Table 2. As shown in these tables, for more than 229 panels, the error rate is below 5%, which indicates the suitability of choosing 326 panels for the simulation of this geometry. The same process is done for all geometries in order to find the proper panel numbers for them.
3.1. Parallelepipedic Hull
The first geometry considered for the optimization is the simplest shape, which is a parallelepipedic hull, and it is illustrated in
Figure 9. This geometry is set to be a base foundation for the sequent geometries. The parameters which are considered to be optimized for this geometry are length (L) and width (W). In the optimization process, for each parameter, a minimum and maximum should be defined based on the installation site and also construction limitations. The interval between these two endpoints is the range which each parameter can vary. The variation ranges for the length and width are considered between 4–7 m and 2–20 m, respectively.
The results of the genetic algorithm for the length parameter of the parallelepipedic hull are shown in
Figure 10. This figure shows that with changing the WEC length between 4 and 7 m, the absorbed power and submerged surface area of the device varies between 0.306–0.467 kW and 73.4–92.5 m
2, respectively. From this figure, it can be seen that choosing a smaller length will lead to more absorbed power and less cost. Therefore, the optimal length of 4 m has been selected for this model.
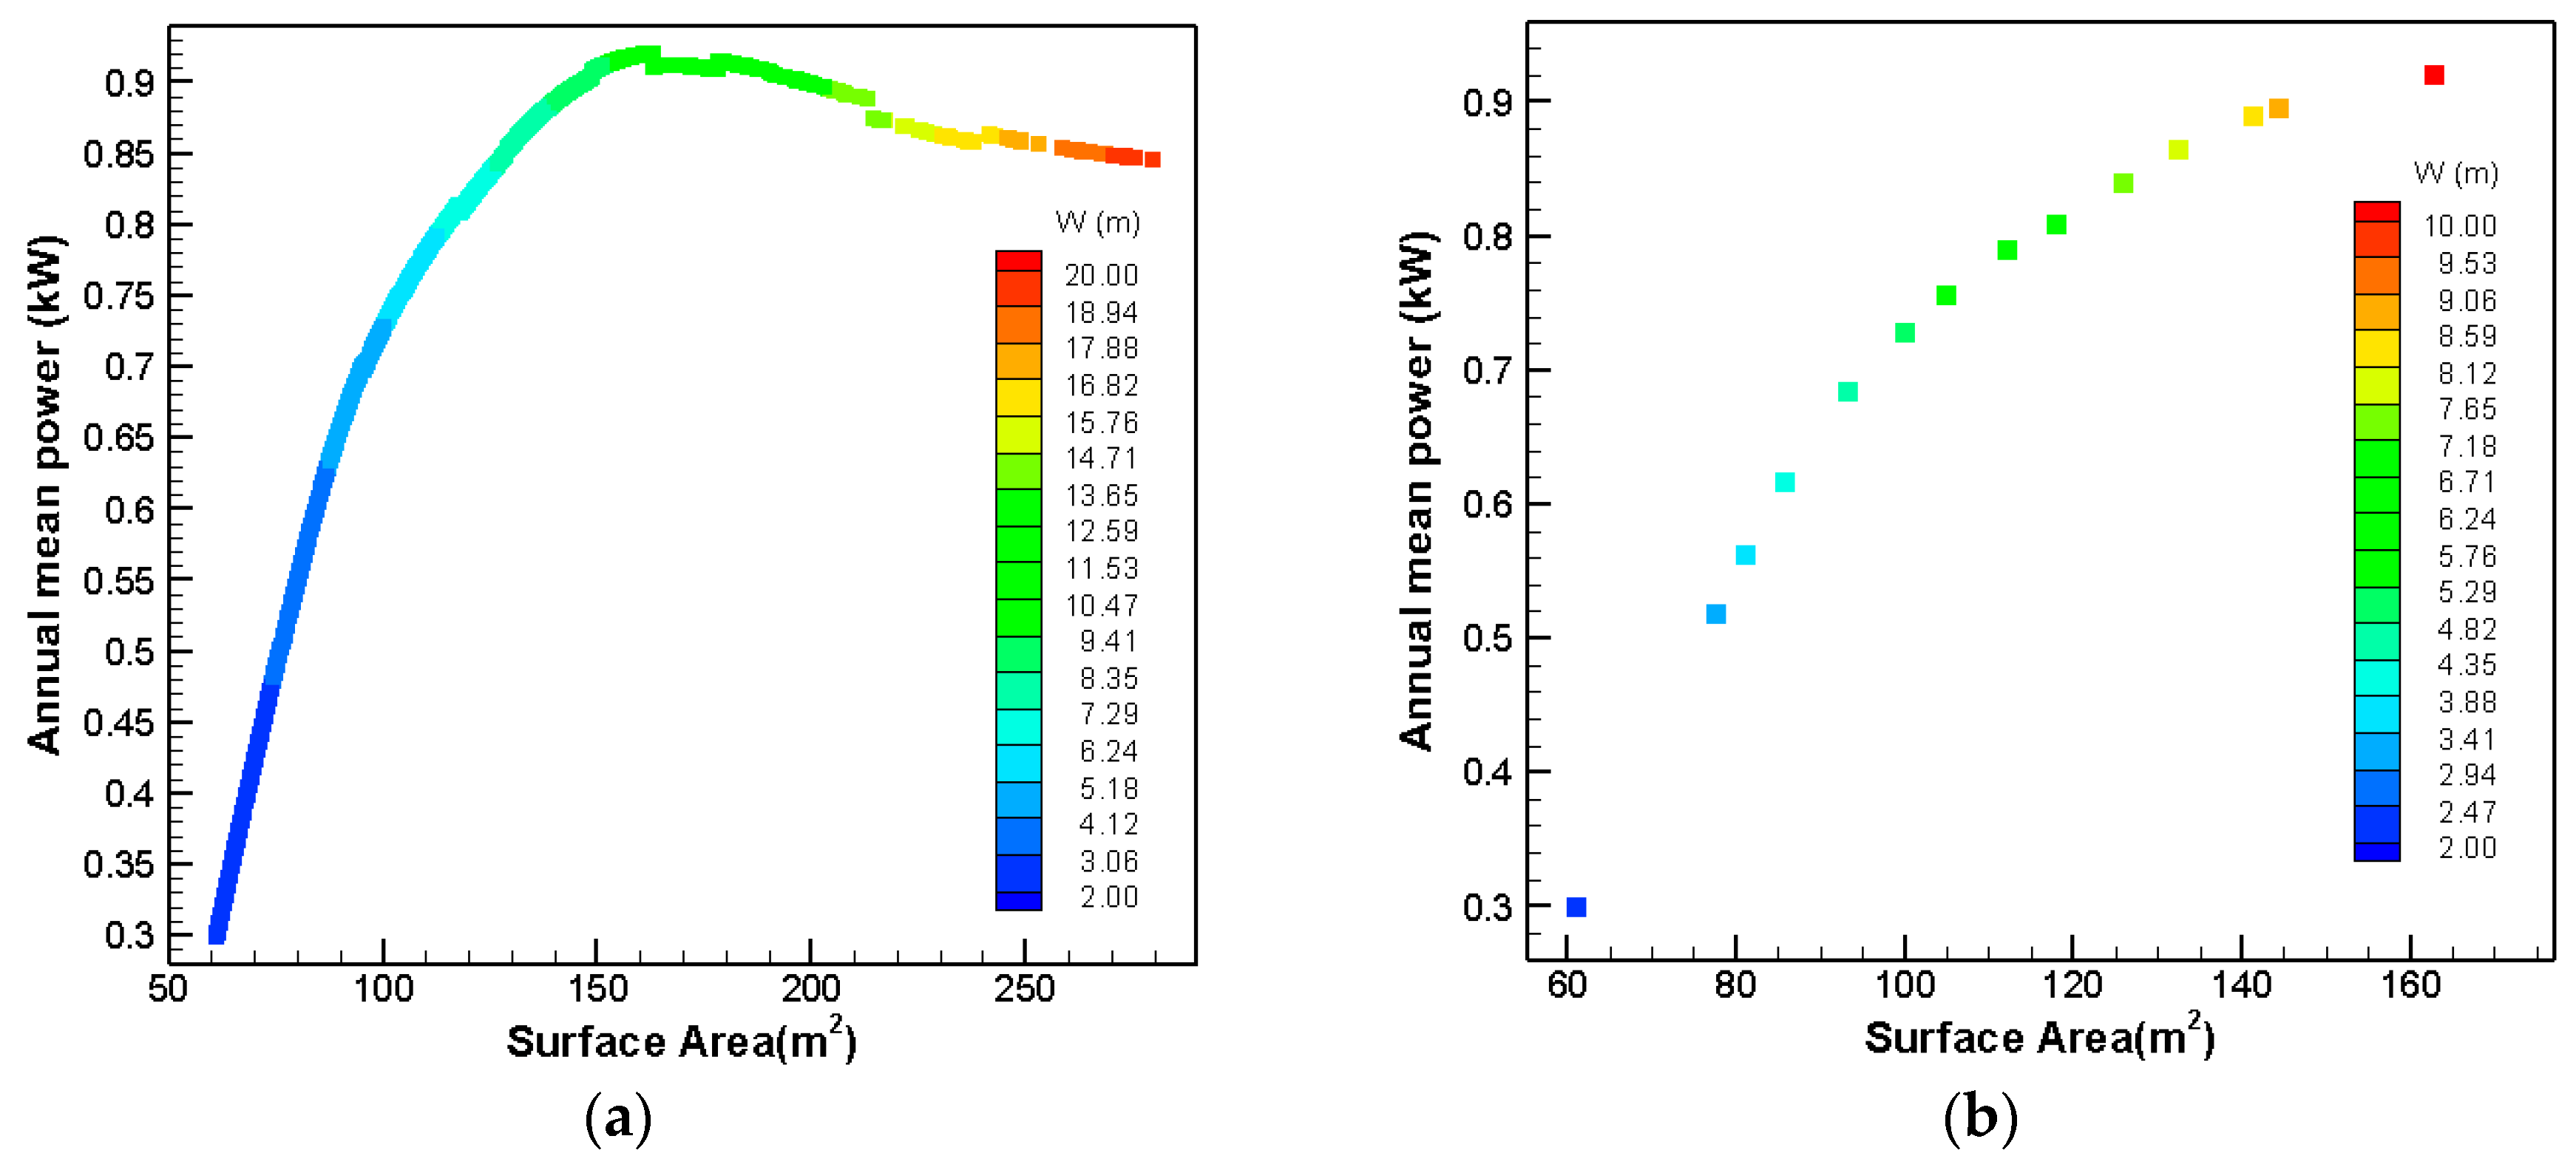
Figure 11a shows the optimization results of the parallelepipedic hull shape for width parameter. In this figure, the best choices are the ones which give us the most energy with the least submerged surface area. These individuals should be situated at the left upper part of the graph (like
Figure 10); however most of the times, this region is empty. Therefore, the Pareto front is defined for this type of problem. The Pareto front is a frontier in which the optimal solutions are gathered, and there are no solutions on or above of them. By looking at the optimization plots, one can easily see that many of the configurations are not optimal and it shows the fact that the shape optimization is vital for the practicality of the WEC design.
From
Figure 11a it can be seen that the ranges of absorbed power and submerged surface area vary between 0.3–0.92 kW and 61.2–280 m
2, respectively, with changing the width between 2 and 20 m.
Figure 11b shows the Pareto front of the parallelepipedic hull shape for width parameter. It can be seen in this figure that increasing the width of the device up to 10.28 m will lead to absorbed power increment; however, this increase will lead to submerged surface area increment which will increase the cost of the device. Having this in mind, another factor is considered to take both parameters regarding their weight factor into account, which is defined as cubic absorbed power divided to the submerged surface area (P
3/S). Calculating P
3/S for all individuals in
Figure 11b shows that the width of 8.8 m with maximum P
3/S of 0.005 kW
3/m
2 is the optimal width for this shape.
3.2. Modification Results on Parallelepipedic Hull: First Series
In this section, a series of geometries are considered to be assessed in order to achieve the optimal geometry. For this series of geometries, the variation is implemented on the parallelepipedic hull presuming 4m as the minimum length for the body. The variations on these bodies are first considered for the bottom part of the parallelepipedic hull, and then the top part of the modified parallelepipedic hull is changed.
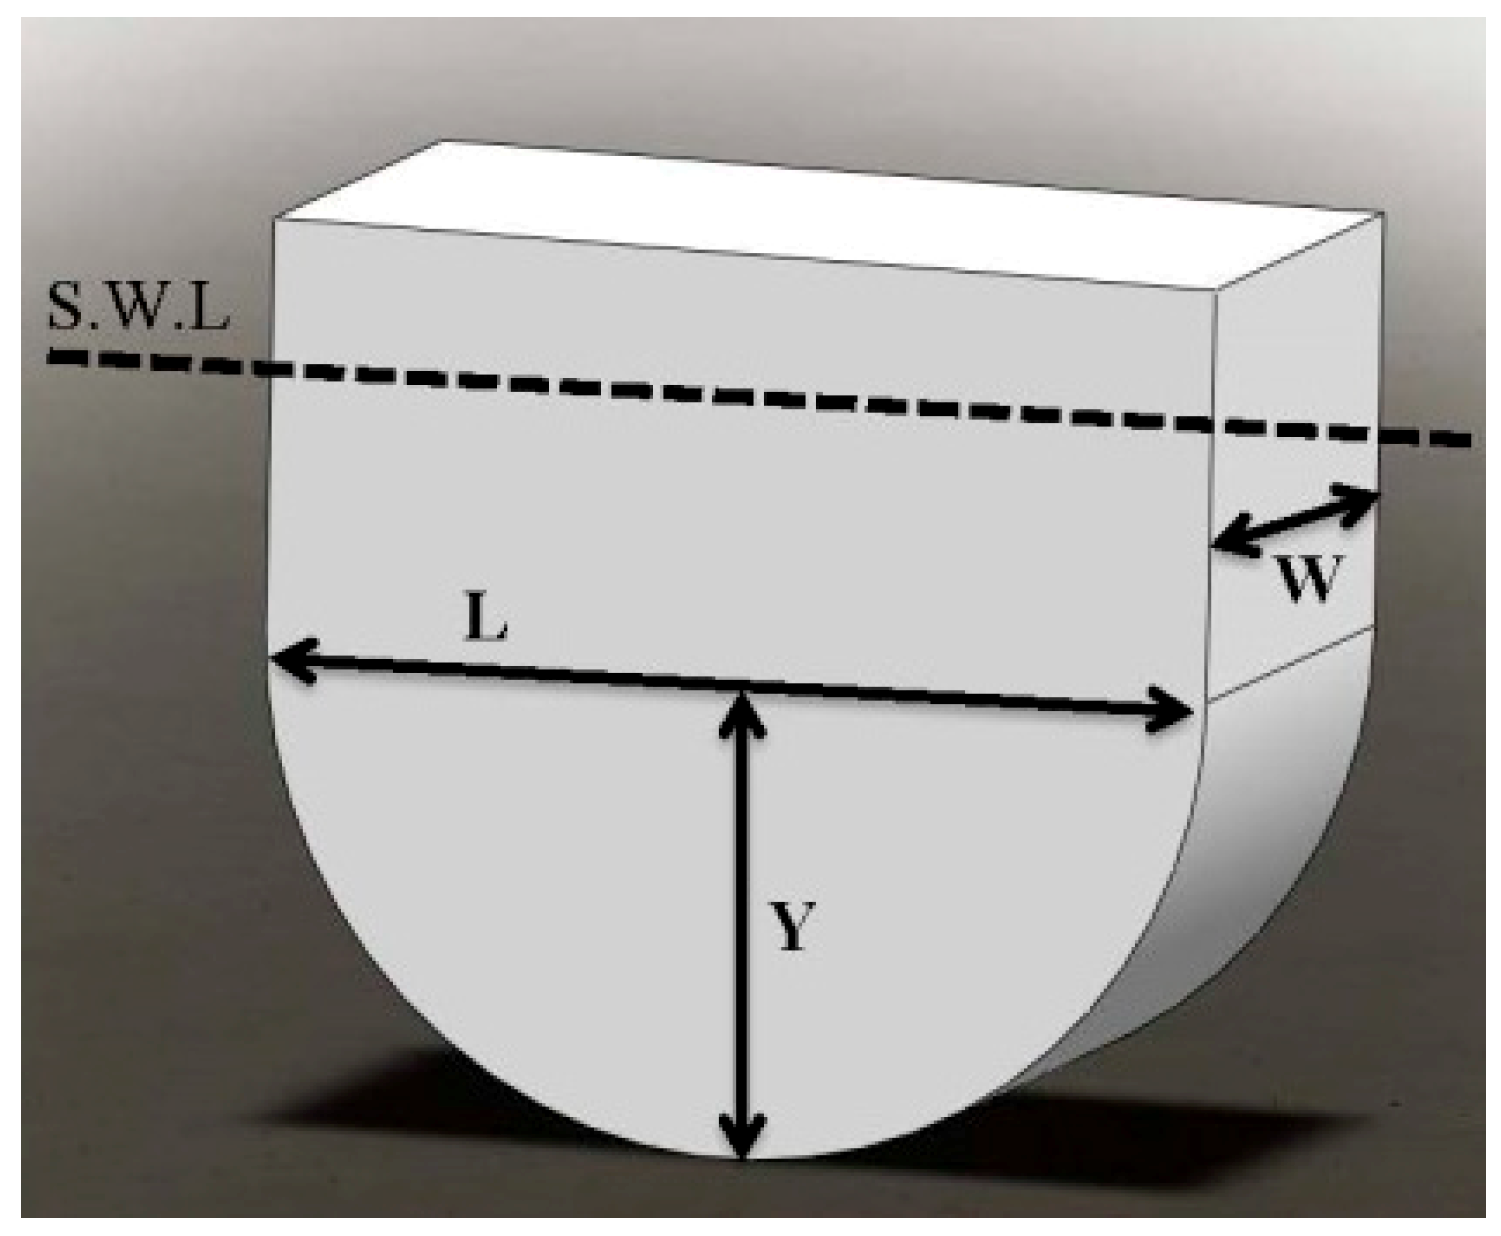
The first geometry in this series of optimization is obtained with symmetrically chamfering the bottom part of the parallelepipedic hull. This geometry is shown in
Figure 12. The parameters for the optimization process in this shape are the width (W) and height of the triangular part (Y). The variation ranges for these parameters in the optimization process are considered between 2–20 m for width and 0.3–2.6 m for the height of the triangular part.
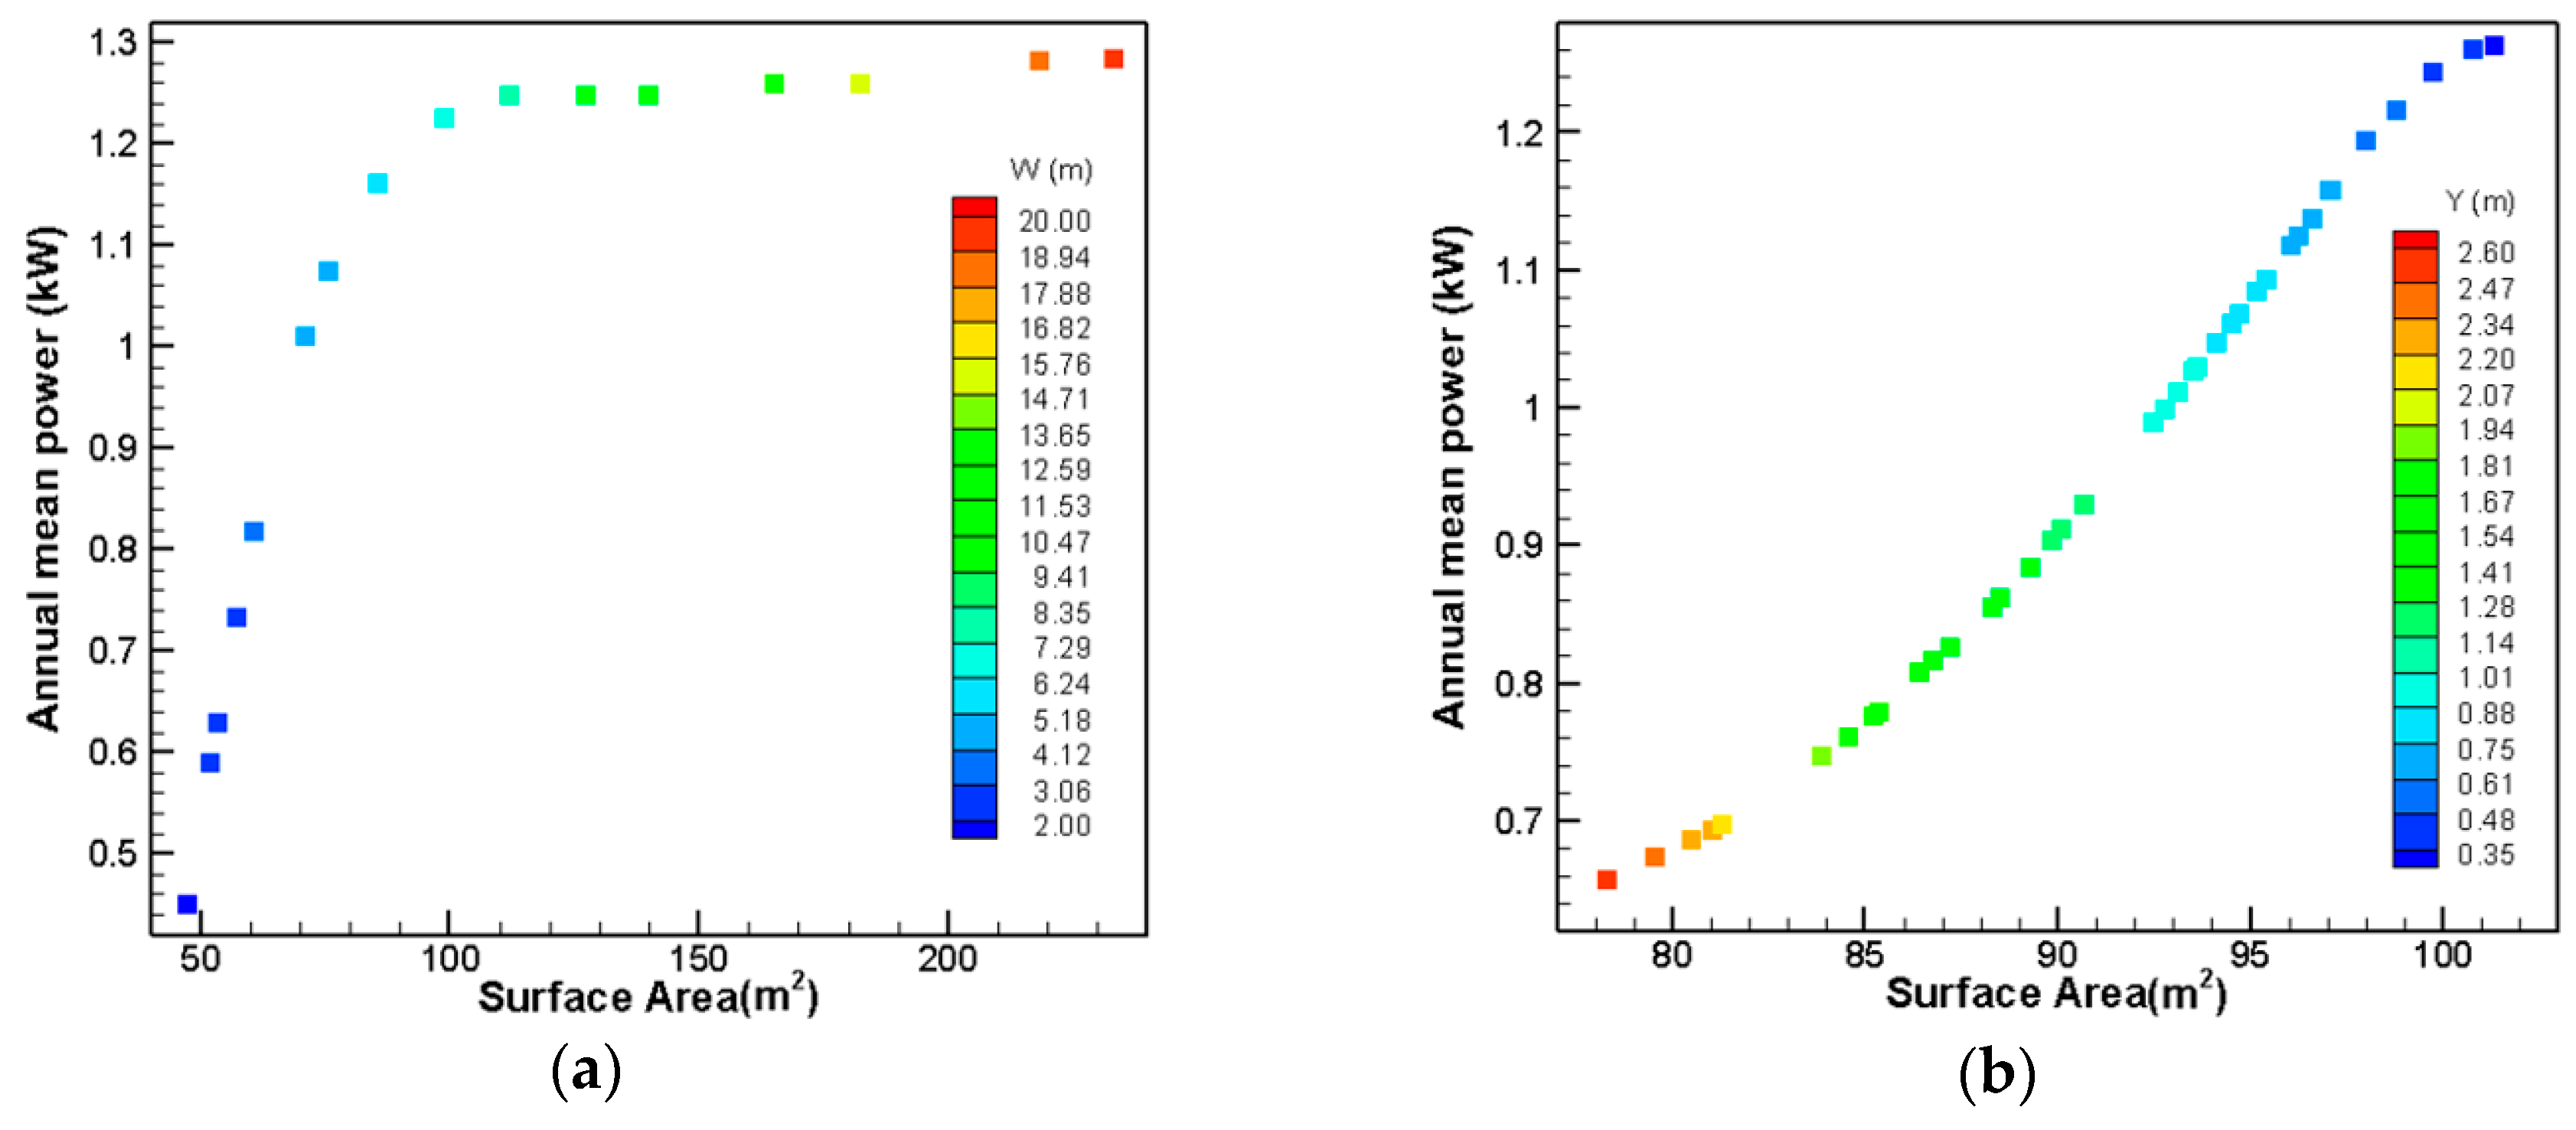
The Pareto fronts for this shape are shown in
Figure 13. For optimization of this shape, first the width of the body is optimized, and then the optimization process for the height of the triangular part is done with considering the optimized width for the width of the body. Calculating the P
3/S parameter for all individuals shows that the width of 7 m with a maximum P
3/S of 0.0186 kW
3/m
2 and also a height 0.35 m for the triangular part with a maximum P
3/S of 0.02 kW
3/m
2 are the optimal ones for this shape.
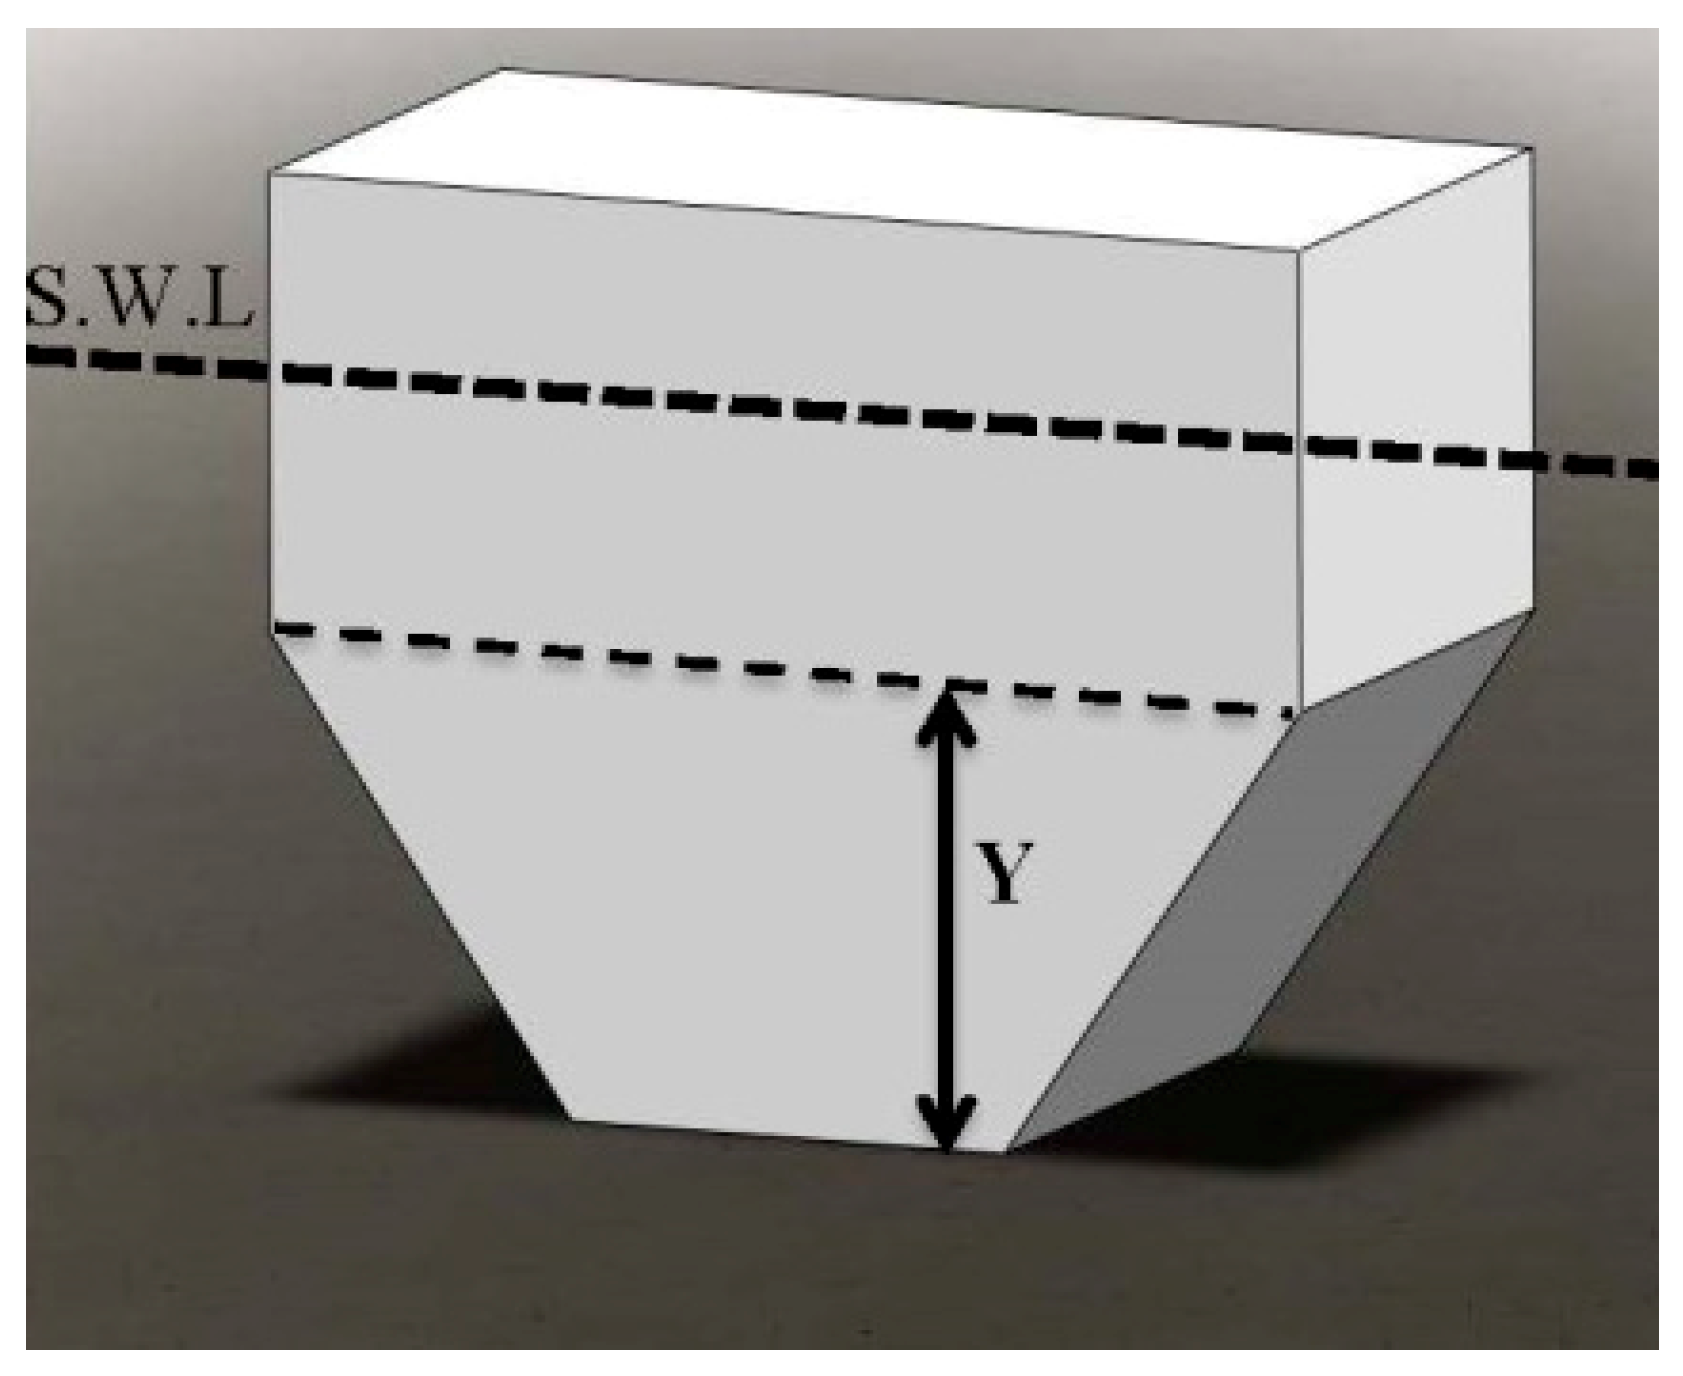
For the second geometry in this series, the bottom part of the parallelepipedic hull was filleted symmetrically, which is shown in
Figure 14. The parameters for the optimization process in this shape are the width (W) and height of the circular part (Y). The variation ranges for these parameters in the optimization process are considered between 2 and 20 m for the width and 0.3 and 2 m for the height of the circular part.
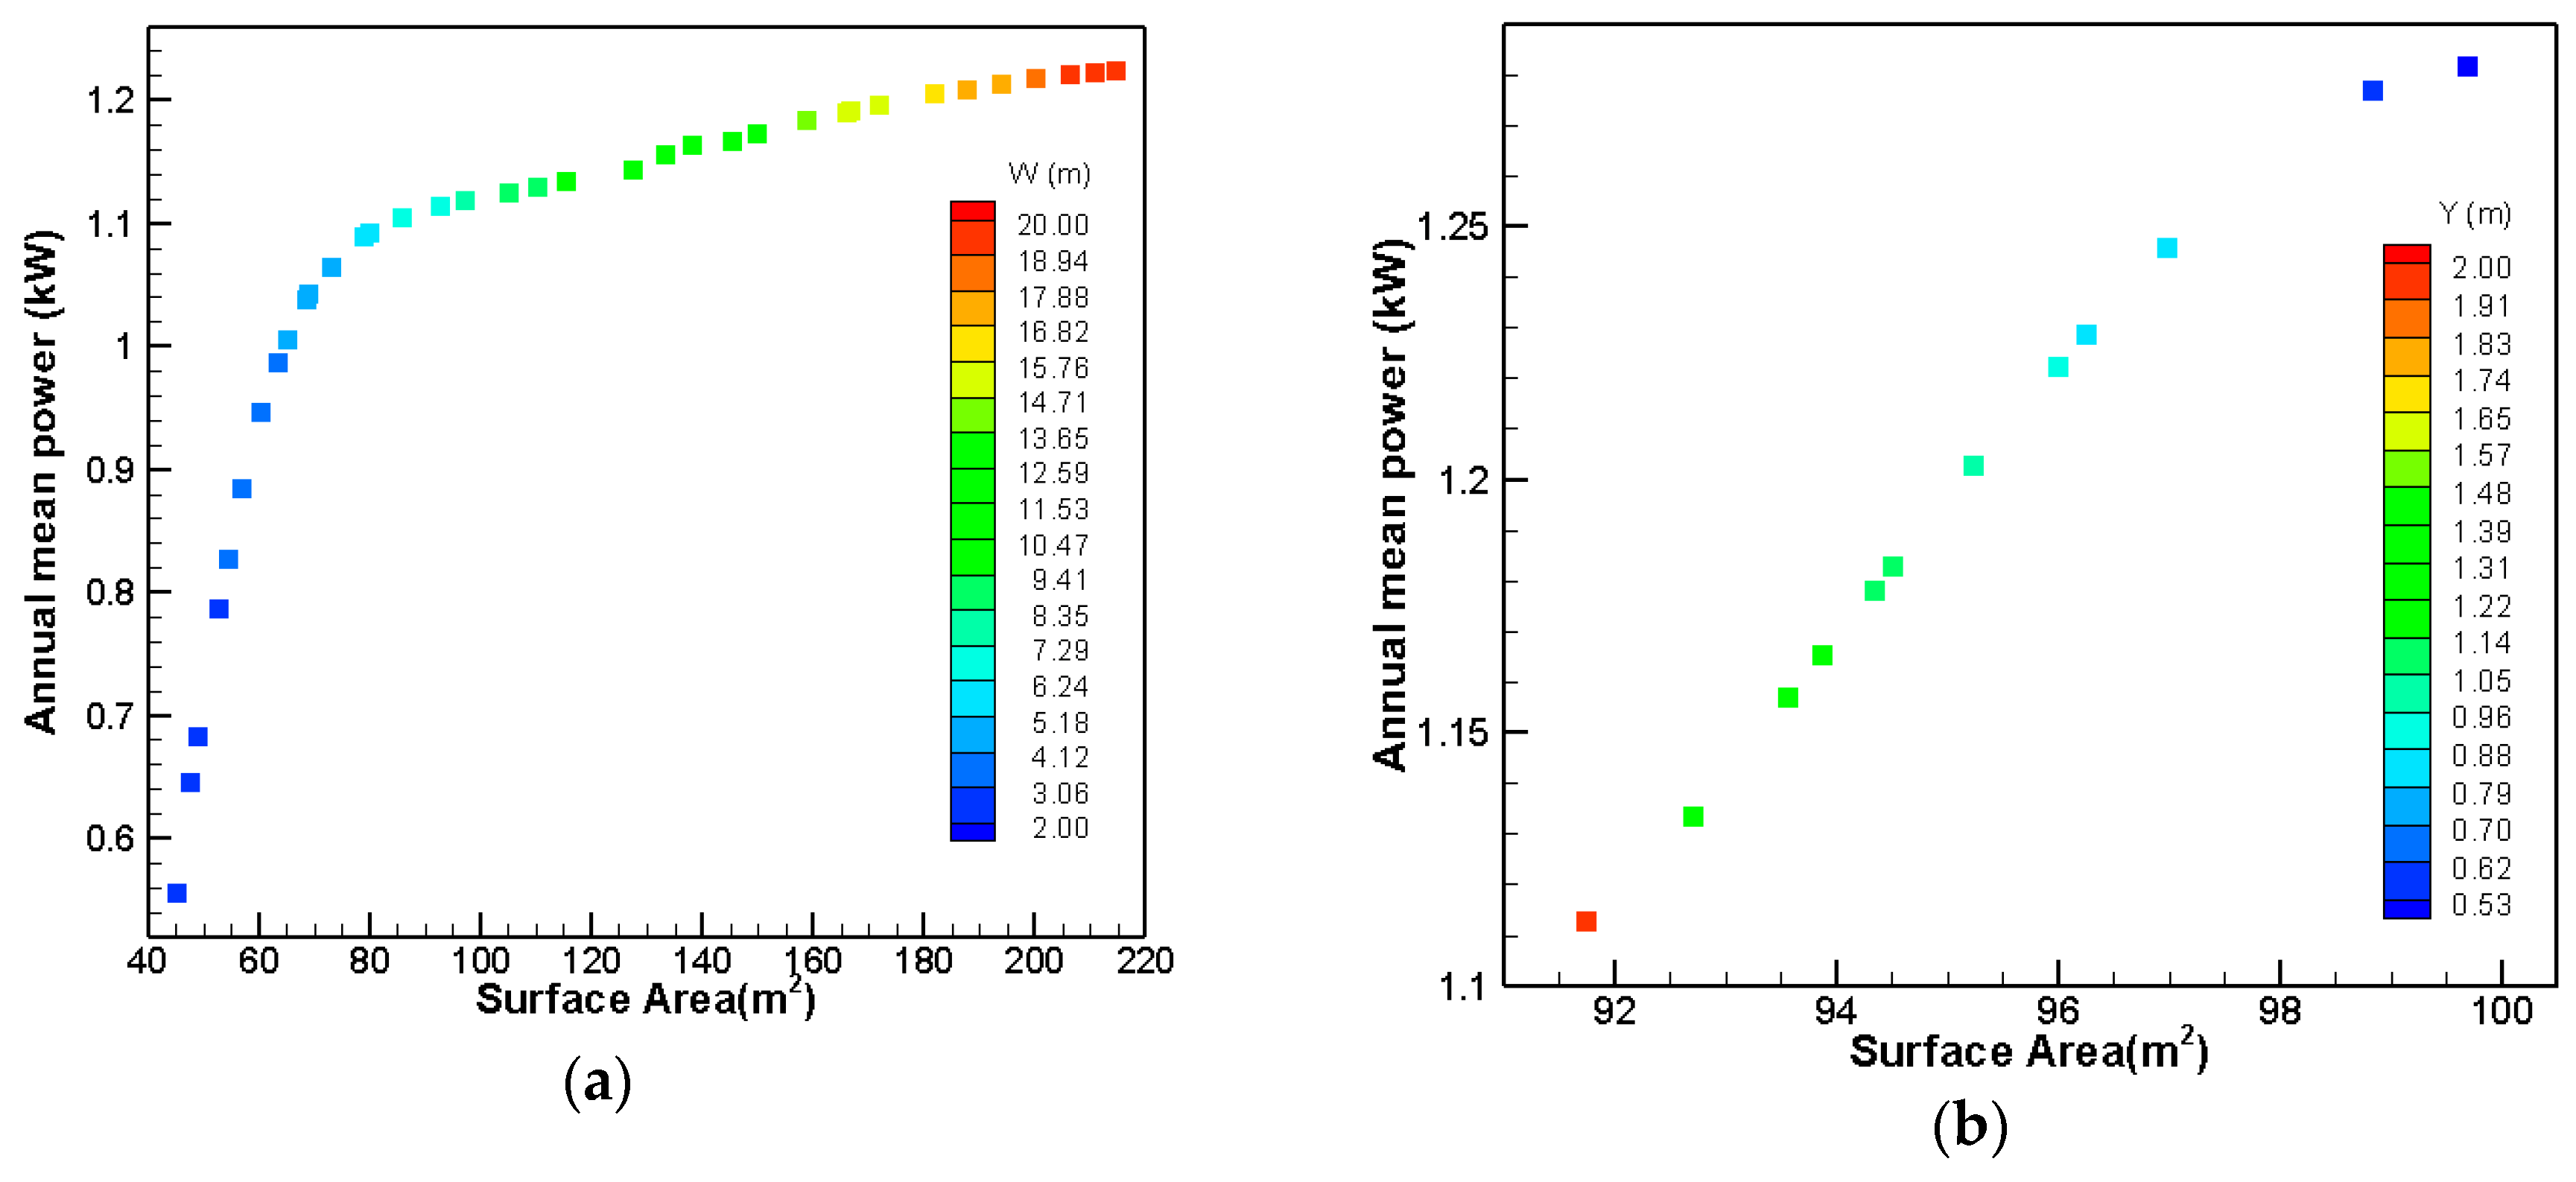
Figure 15 shows the Pareto fronts for the bottom filleted shape. The parameter P
3/S was calculated for all individuals in the Pareto fronts for both width and height of circular part parameters. The calculations reveal that a width of 5 m with maximum P
3/S of 0.0164 kW
3/m
2 and a height of 0.53 m for the triangular part with maximum P
3/S of 0.0211 kW
3/m
2 are the optimal width and height for this shape.
In the next step, the final Pareto fronts for the three shapes are compared together.
Figure 16 shows the results of this comparison. It is evident from
Figure 16 that the second and third geometries have better conditions than the first geometry and they can absorb much more power with the same submerged surface area. The decision of choosing between the second and third geometry is a little trickier. The advantage of the circular bottom geometry is that the amount of absorbed power in this geometry is about 20 watts more than the triangular bottom geometry; however, construction of the triangular bottom geometry is more accessible than the circular bottom geometry, and it will cost less. Due to a slight increase in power, it seems that the parameters of cost and ease of construction are more prominent here. Thus, the geometry with a triangular bottom is selected as the optimal geometry.
For the next optimization in this series, the bottom part of the second geometry, which is introduced as the best geometry so far is cut. The schematic of this geometry is shown in
Figure 17. The only parameter, which is investigated for this shape is the height of the chamfered part. This parameter is varied between 0.05 and 0.35 m, and the results are shown in
Figure 18.
It can be seen in
Figure 18 that increasing the height of the chamfered part will lead to higher extractable power and less submerged surface area and, therefore, this optimization has a unique answer, which is 0.35 m. Given that in this case, there is a single optimal answer, the Pareto front is meaningless. Comparing the results of this geometry with the second geometry, it can be concluded that cutting the bottom part of the geometry is not very effective for increasing the extracted power and it only increases the power about 10 watts which are very little. It also increases the immersed surface area about 13 m
2, which leads to a greater cost of construction. Nevertheless, the bottom cut shape is selected as the best geometry so far to continue the implementation of the optimization process. One of the main reasons for this decision is to create a flat surface at the bottom part which would make it balanced in a standing position; this could be very useful in the processes of construction, transportation, installation, and testing.
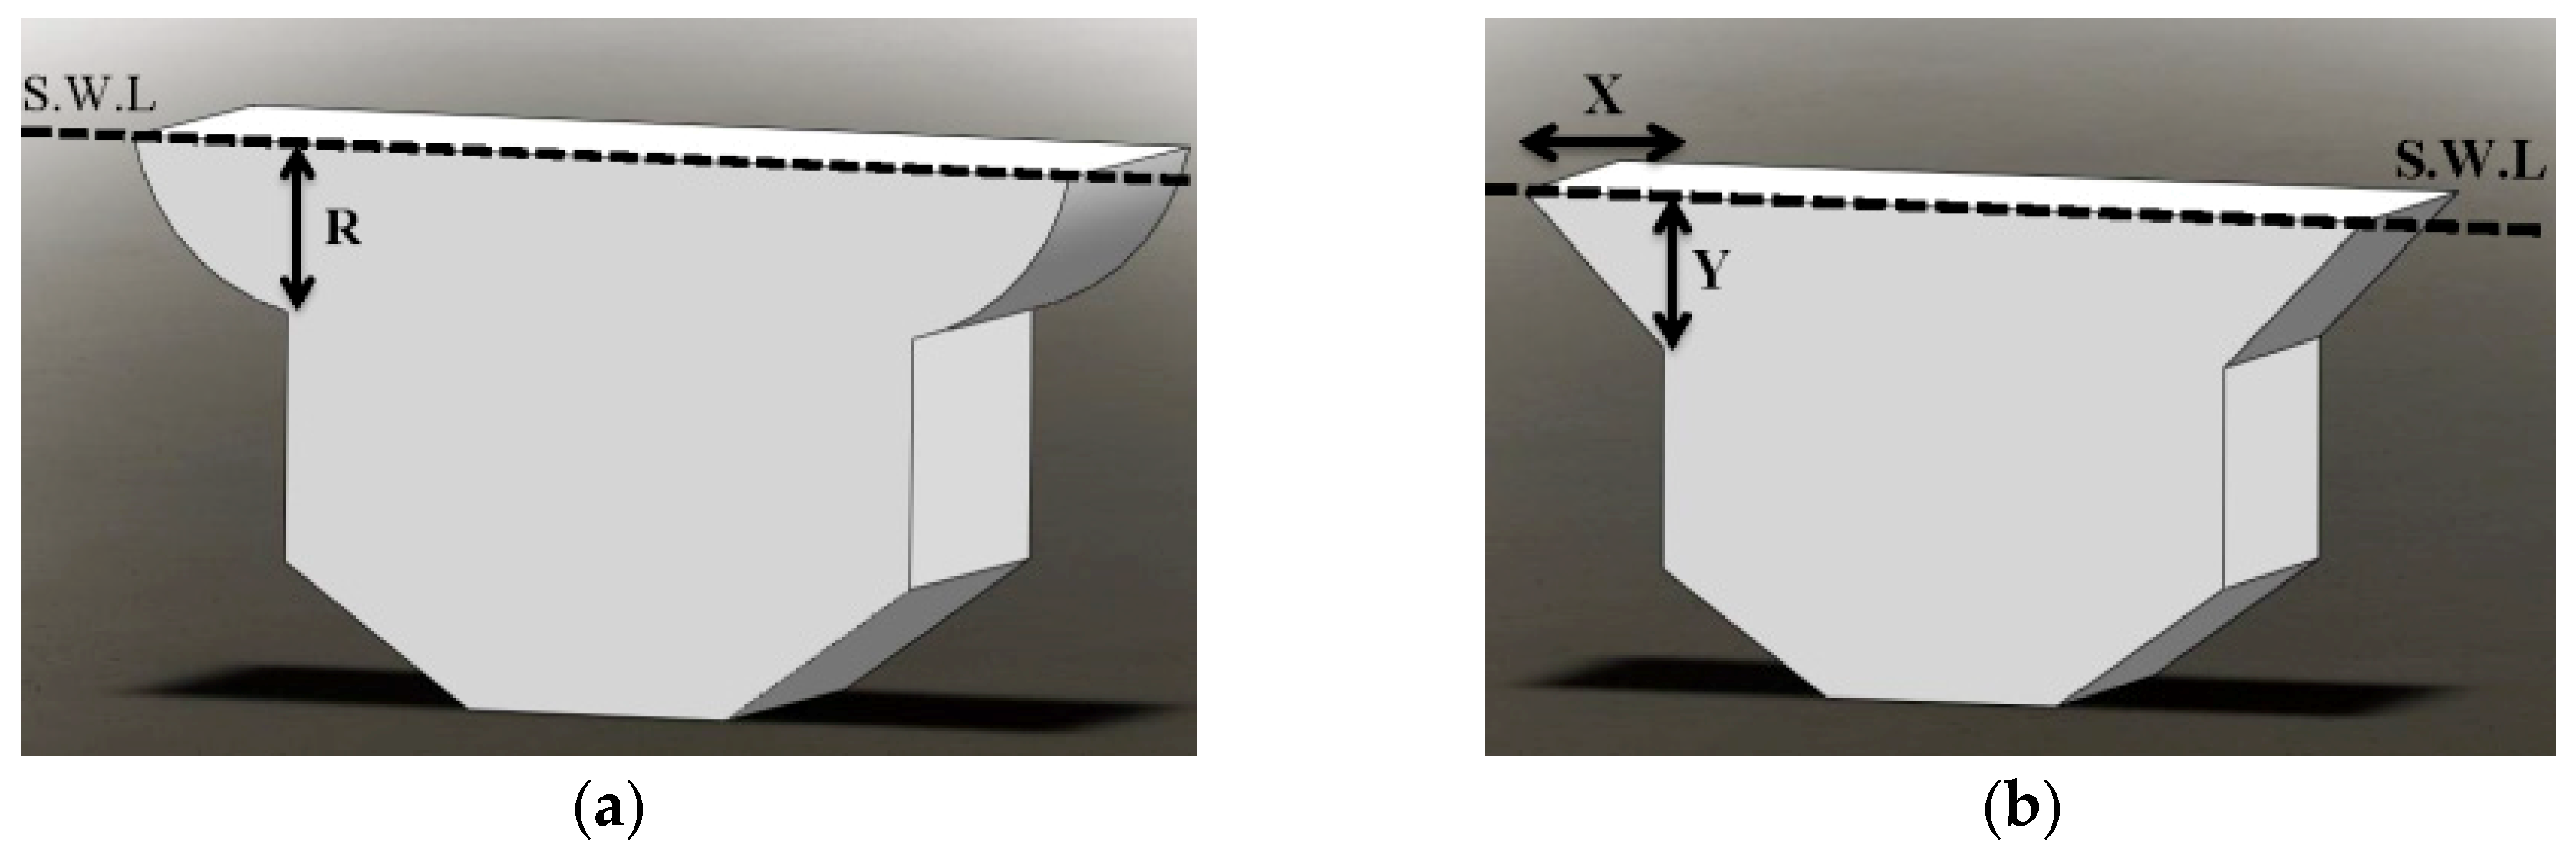
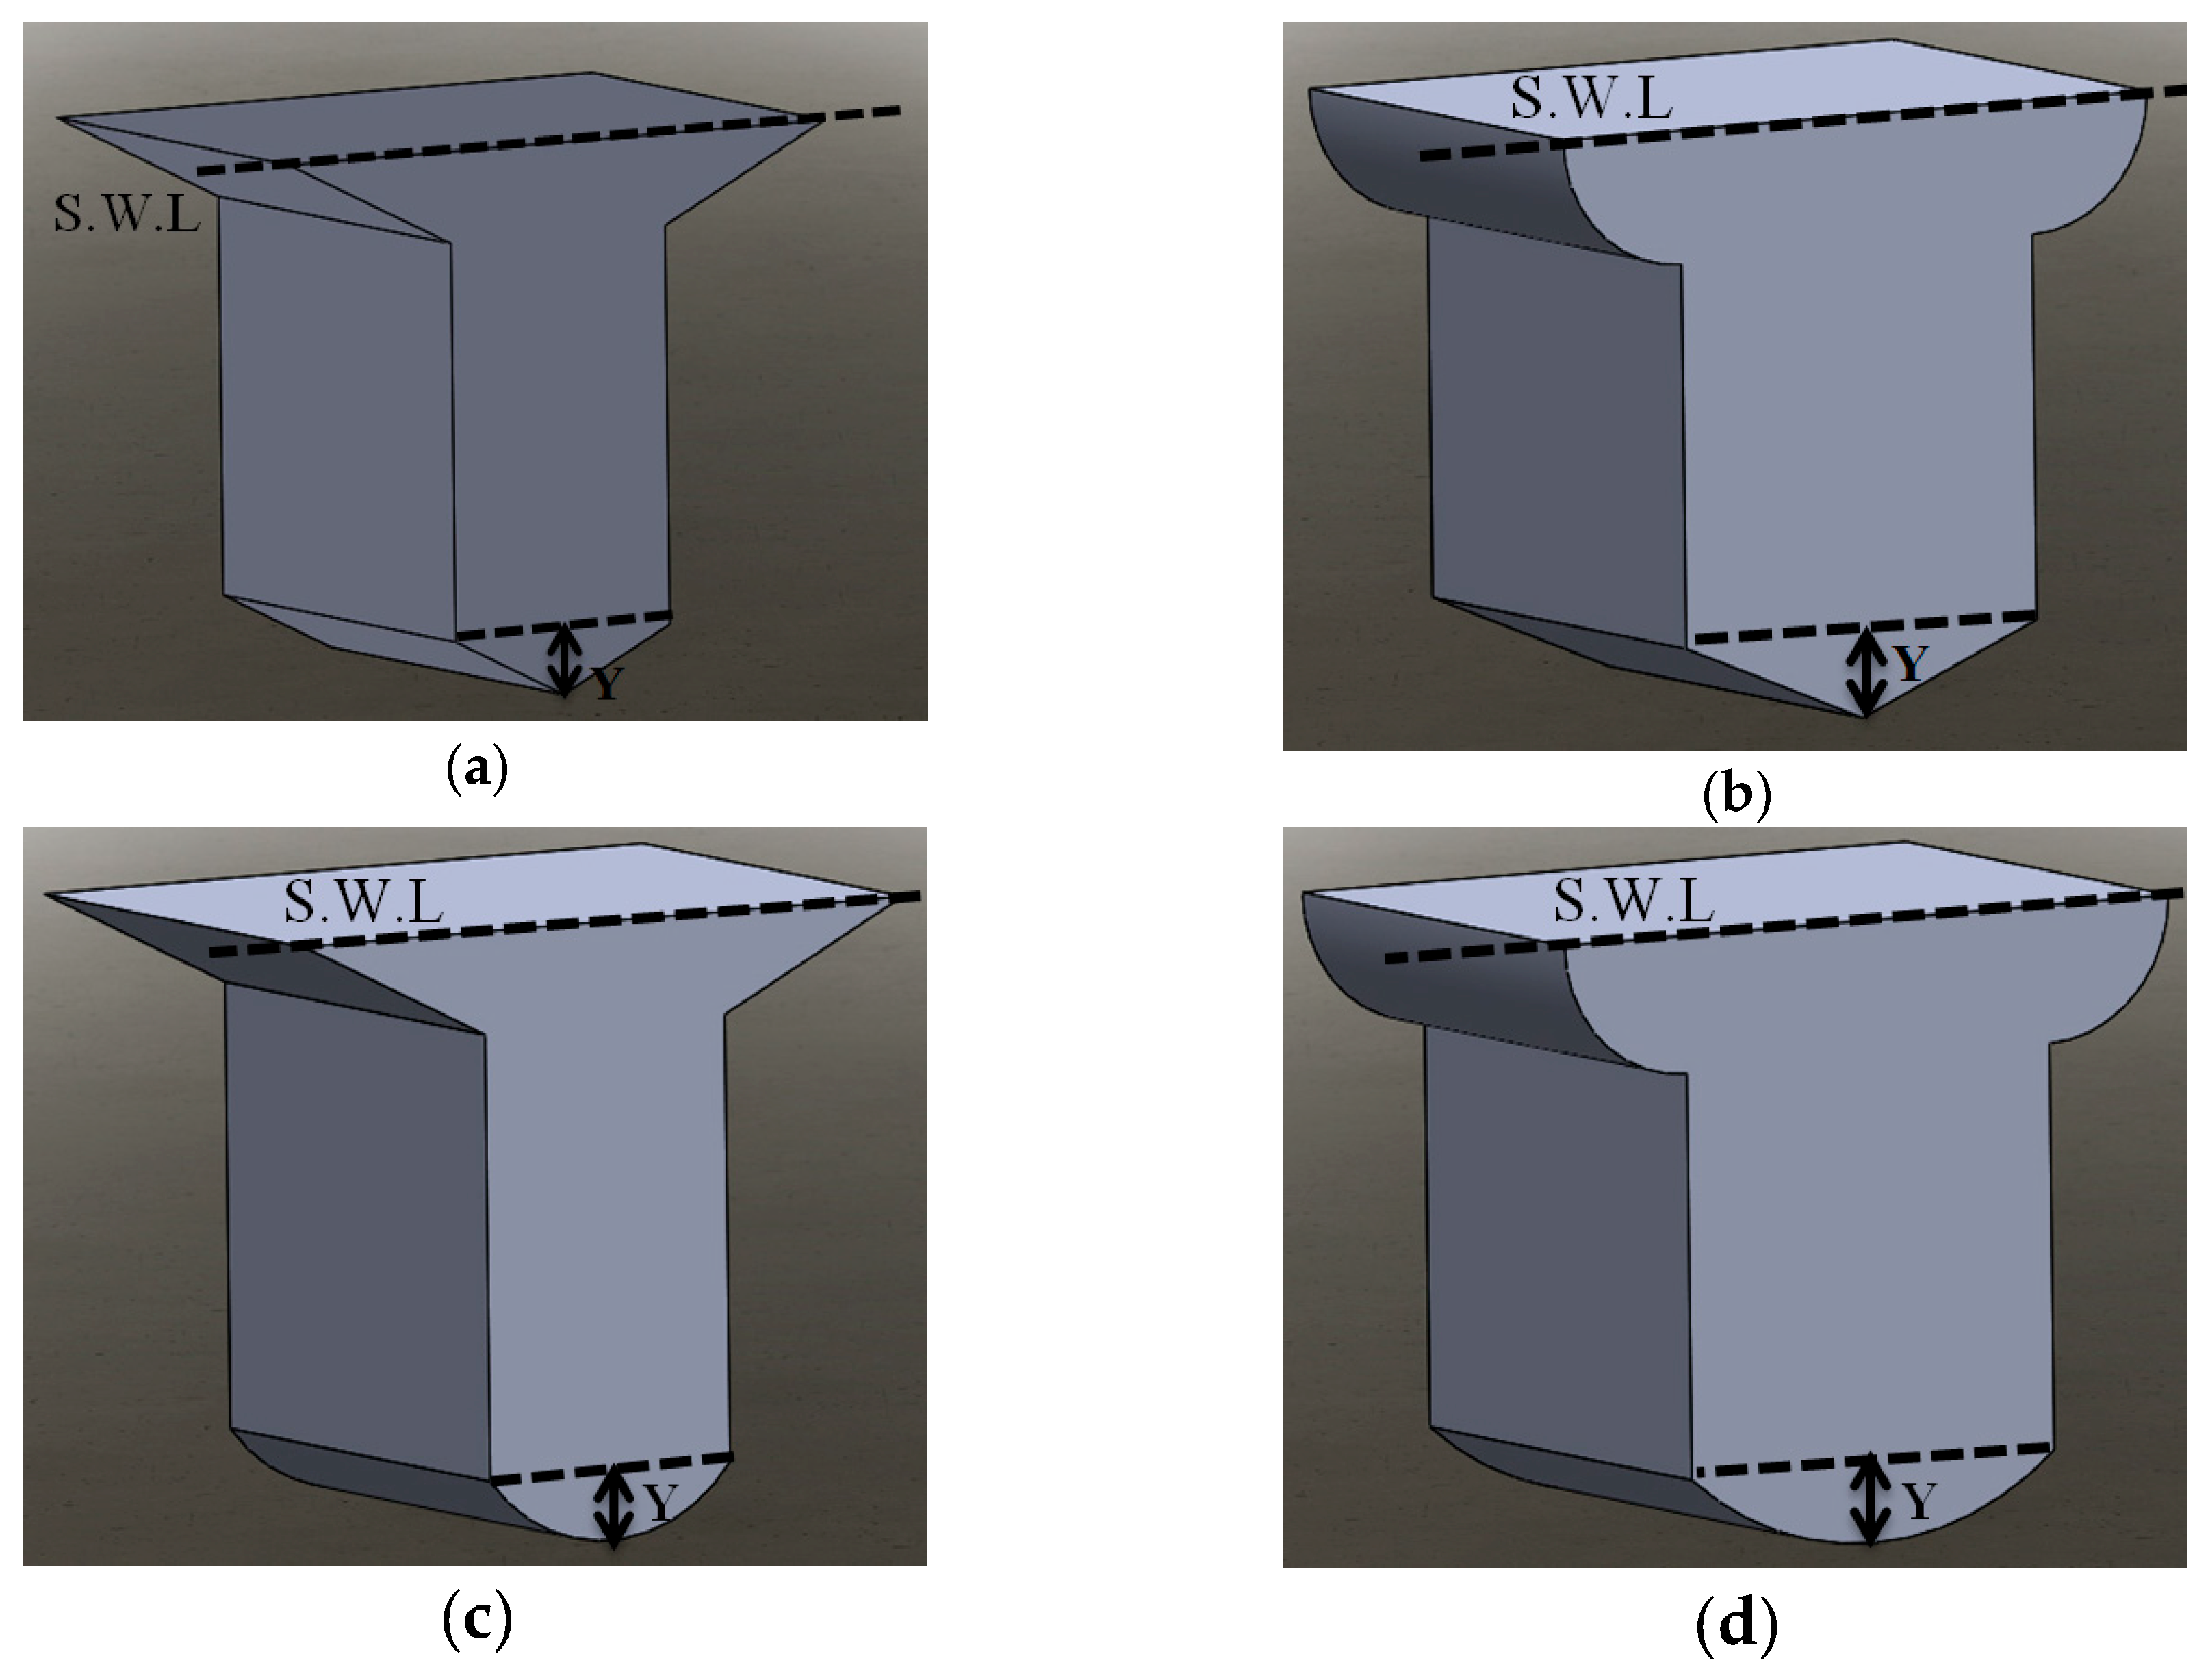
For the final optimization in this series, the upside part of the geometry is changed. The schematics of these geometries are shown in
Figure 19. As can be seen in this figure, the upside part of the previous geometry is filleted (
Figure 19a) and chamfered (
Figure 19b). For the upside filleted geometry, a quarter circle is used. However, for the upside chamfered geometry, four magnitudes are chosen for the ratio between X and Y. These ratios include X:Y of 1:1, 2:1, 3:1, and 4:1. It should be noted that for all of these configurations, the chamfered and filleted parts are added to the main length of 4 m and, therefore, the length of the middle part of the geometry still remains 4 m.
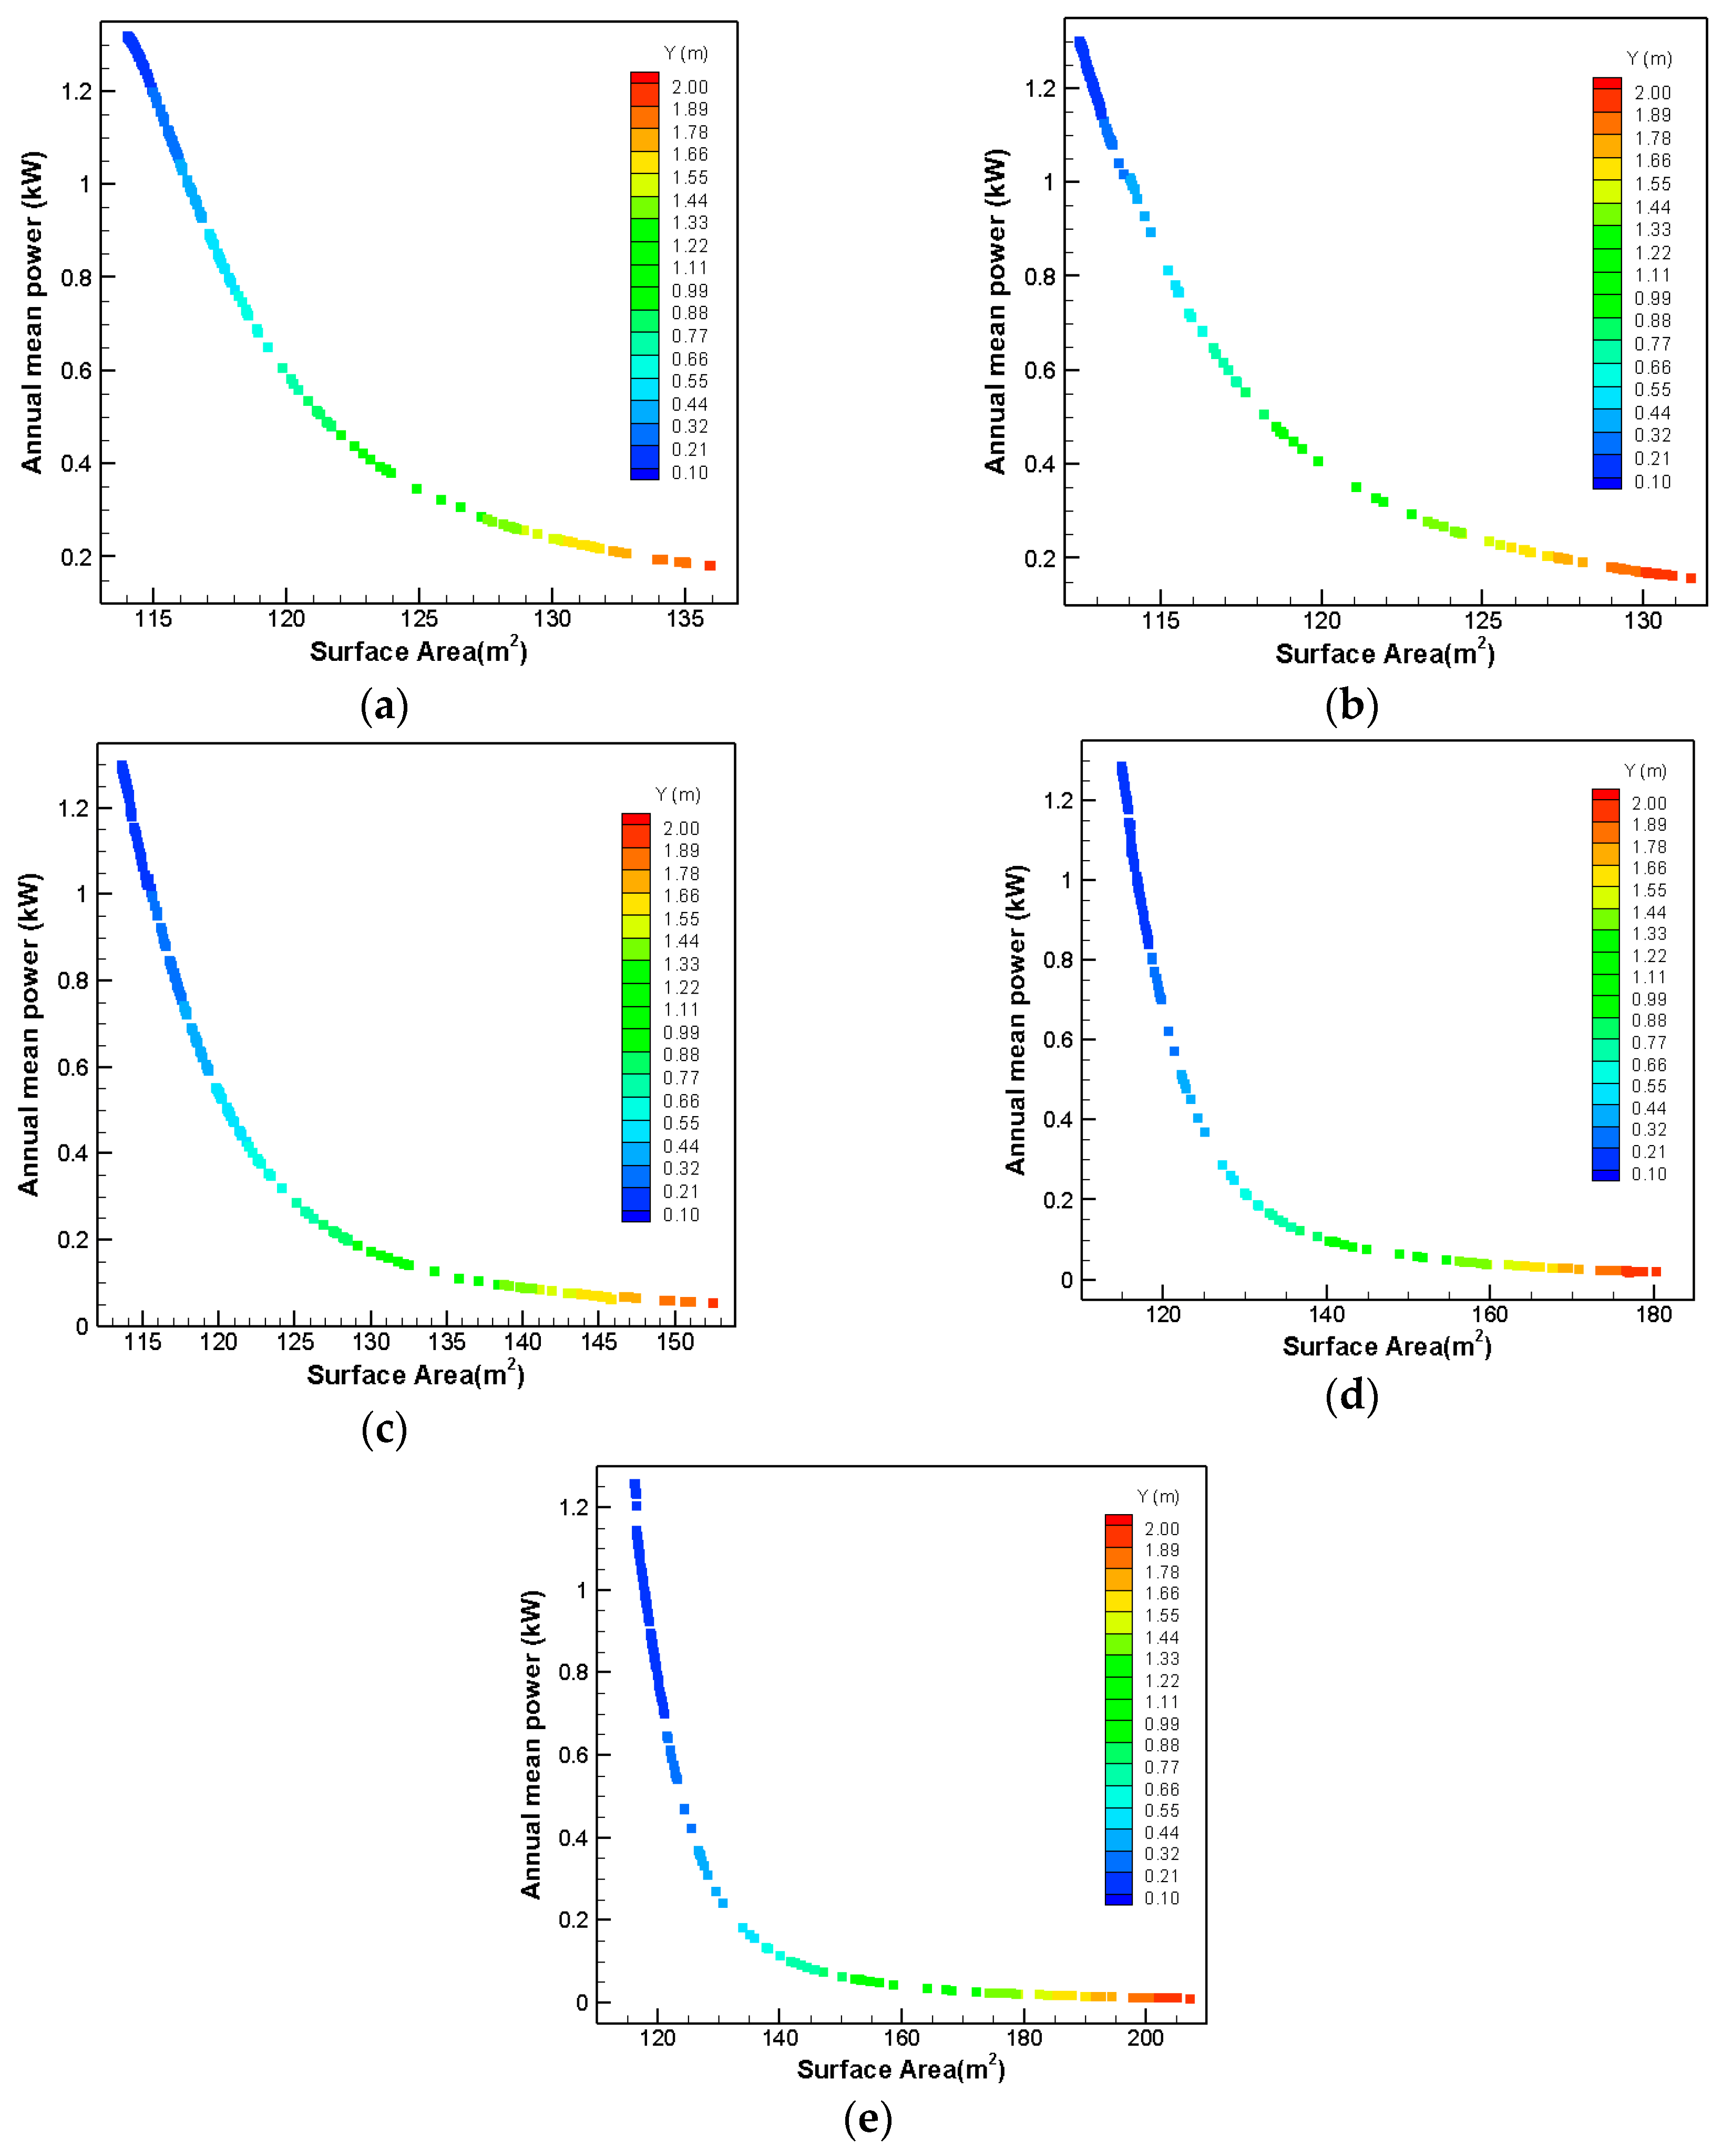
For these geometries, the parameter R in the upside filleted shape, and the parameter Y in the upside chamfered shape are varied between 0.1 to 2 m. The results from the optimization of these figures are shown in
Figure 20.
As can be seen in
Figure 20, all cases have a unique answer, which is 0.1 m. The final optimized values for these cases are shown in
Table 3. Calculation of P
3/S for all configurations shows that the upside filleted geometry is the best geometry among all the geometries introduced for the first series in order to be used as the geometry of a WEC.
3.3. Modification Results on Parallelepipedic Hull: Second Series
For the second series of modification on the parallelepipedic hull, the variations are implemented on the body considering 4 m as the maximum length of the body. The modifications are first considered for the upside part of the body, and then they are implemented on the bottom part of the geometry.
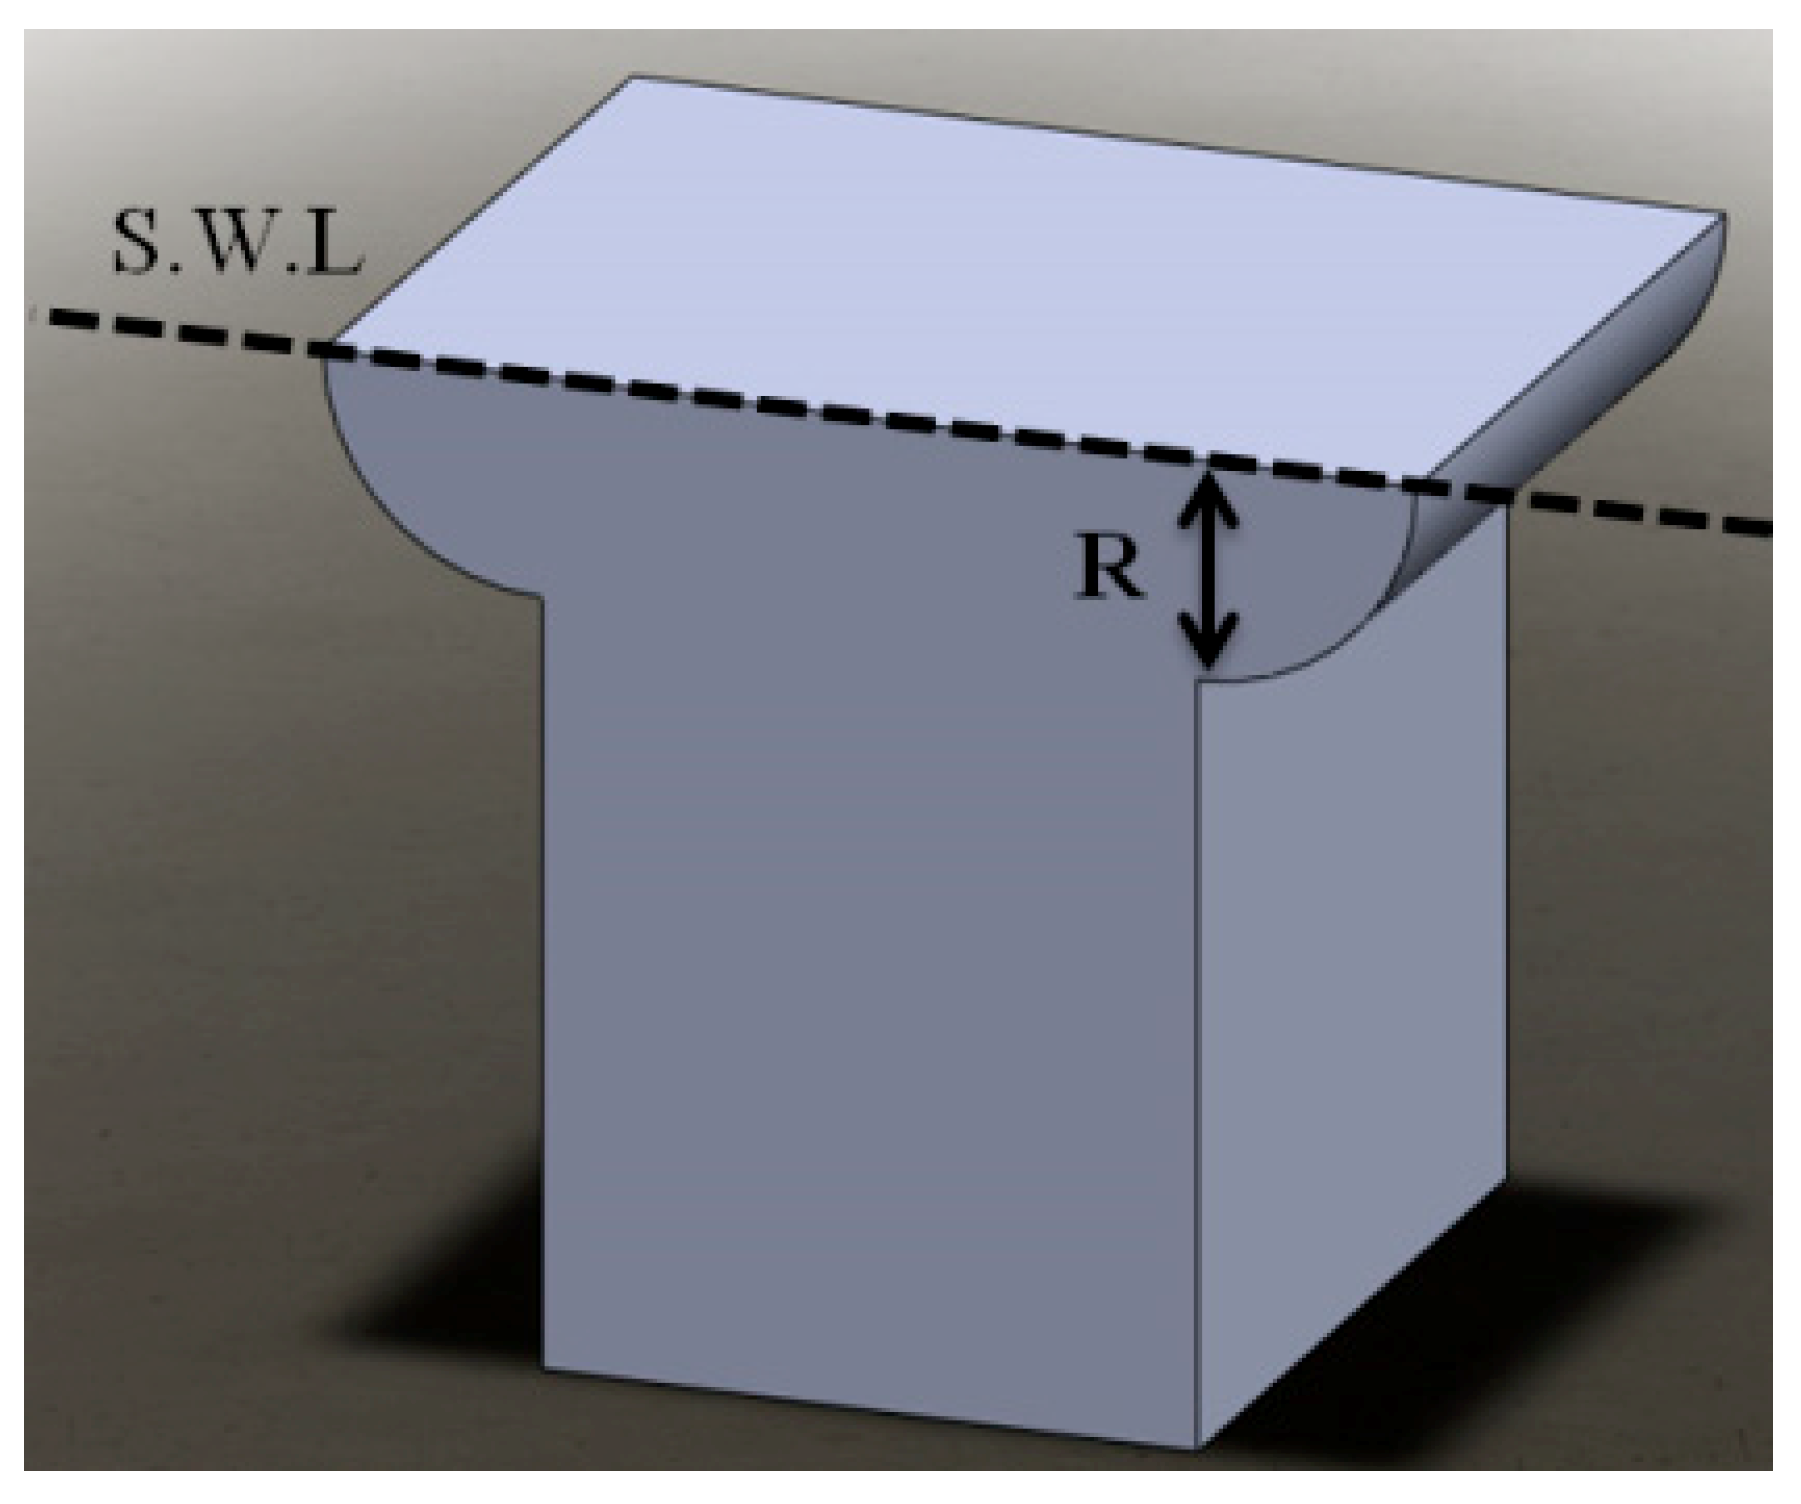
For the first modification in these series, the upside part of the parallelepipedic hull is filleted symmetrically, which is shown in
Figure 21. The parameter, which is varied in this shape for the optimization investigation, is the radius of the filleted part. This parameter is changed between 0.1 and 1.8 m.
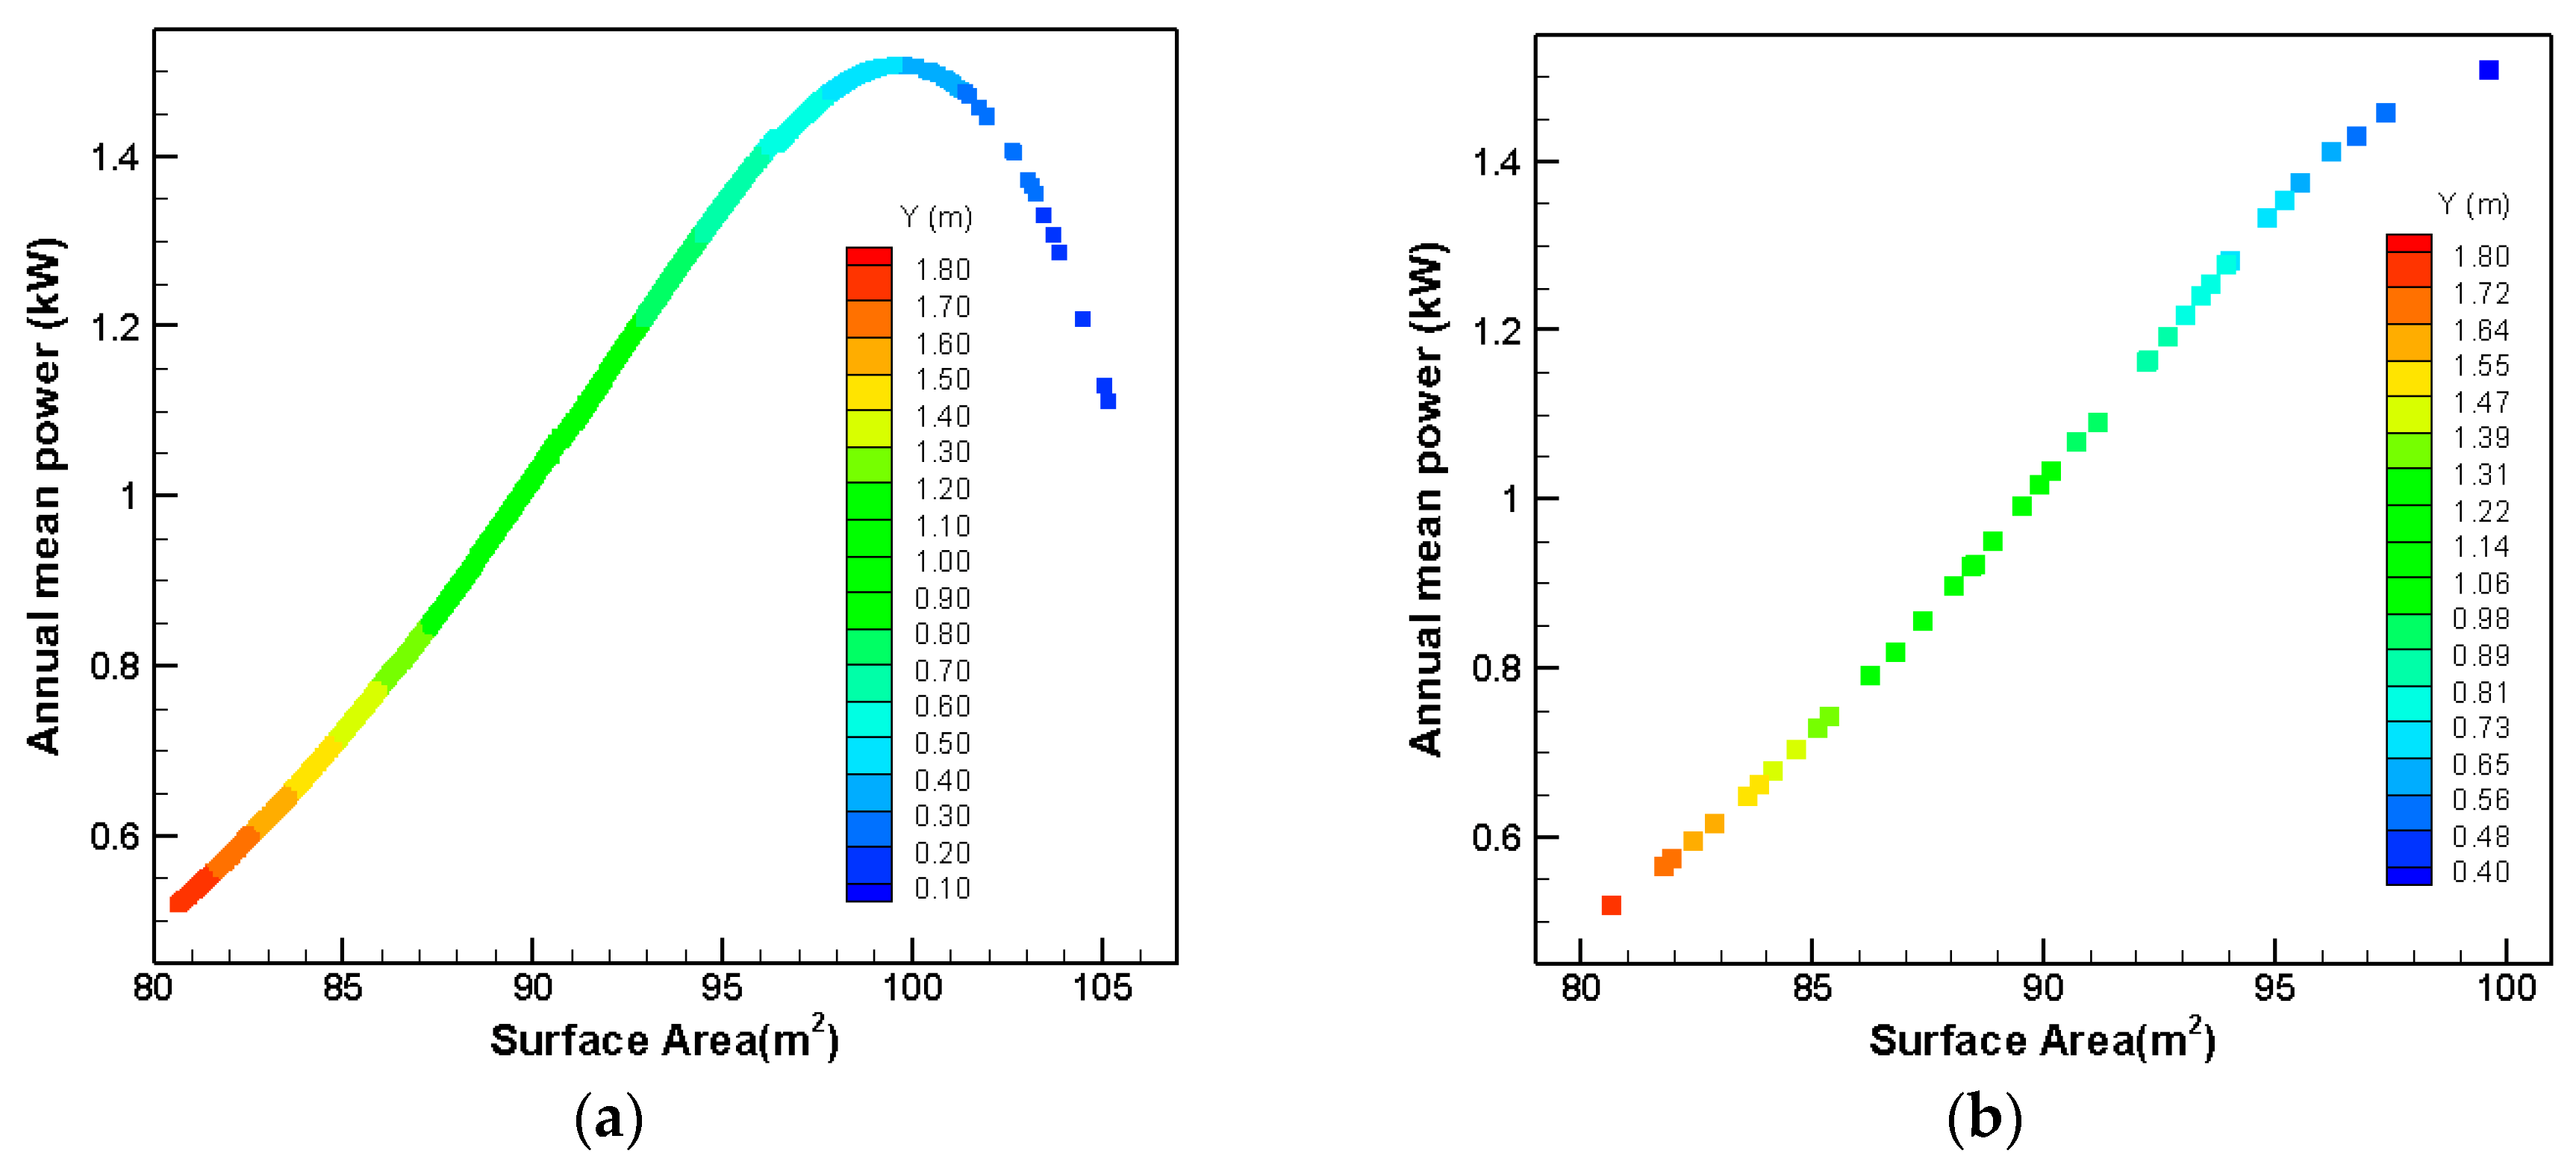
The optimization results for this shape are shown in
Figure 22. With changing the radius from 0.1–1.8 m, it can be seen that the extracted power and immersed surface area change from 0.52–1.5 kW and 80.6–105.2 m
2, respectively. For obtaining the optimized radius, the P
3/S for each result in
Figure 22b needs to be calculated. The calculation shows that 0.4 m is the optimized radius with a maximum P
3/S of 0.0343 kW
3/m
2 for this shape.
The second geometry that is considered for this series is shown in
Figure 23. For this geometry, the upside part of the parallelepipedic hull is chamfered symmetrically. The parameters changed for this geometry are X and Y.
This geometry is studied for various ratios of X:Y from 1:1 to 10:1. The variation ranges for Y and also the optimized results for these configurations are shown in
Table 4.
It can be seen that the optimized shape between the ten shapes introduced in
Table 4 is the one with the X:Y ratio of 10:1 and Y length of 0.1 m; however, unlike the previous cases, four cases are selected in order to continue the optimization process. The selected cases include: the upside filleted shape and the chamfered shapes with X:Y ratios of 1:1, 3:1, and 10:1.
The reasons for considering several cases for continuing the optimization process with is that, first, a possibility is considered that despite better efficiency with the X:Y ratio increment, they may act differently when the bottom part of these shapes are changed. Second, there will be an experimental investigation in a future study and different shapes are needed for this study in order to see how they will react in reality. Therefore, an upside filleted shape, upside chamfered shapes with low, medium, and high X:Y ratios are selected for further comparison.
For the final step in the optimization process for this series, the bottom part of the selected shapes is chamfered and filleted symmetrically. These geometries are shown in
Figure 24.
As mentioning all results for these configurations will take up much space, which is not necessary, so just the final results are shown in
Table 5 and
Table 6. Looking at the results show that Y of 0.1 m is the best choice for all cases. With comparing the results from the optimization of these eight shapes, it can be seen that bottom filleted and upside chamfered with the X:Y ratio of 10:1 is the best choice among them.
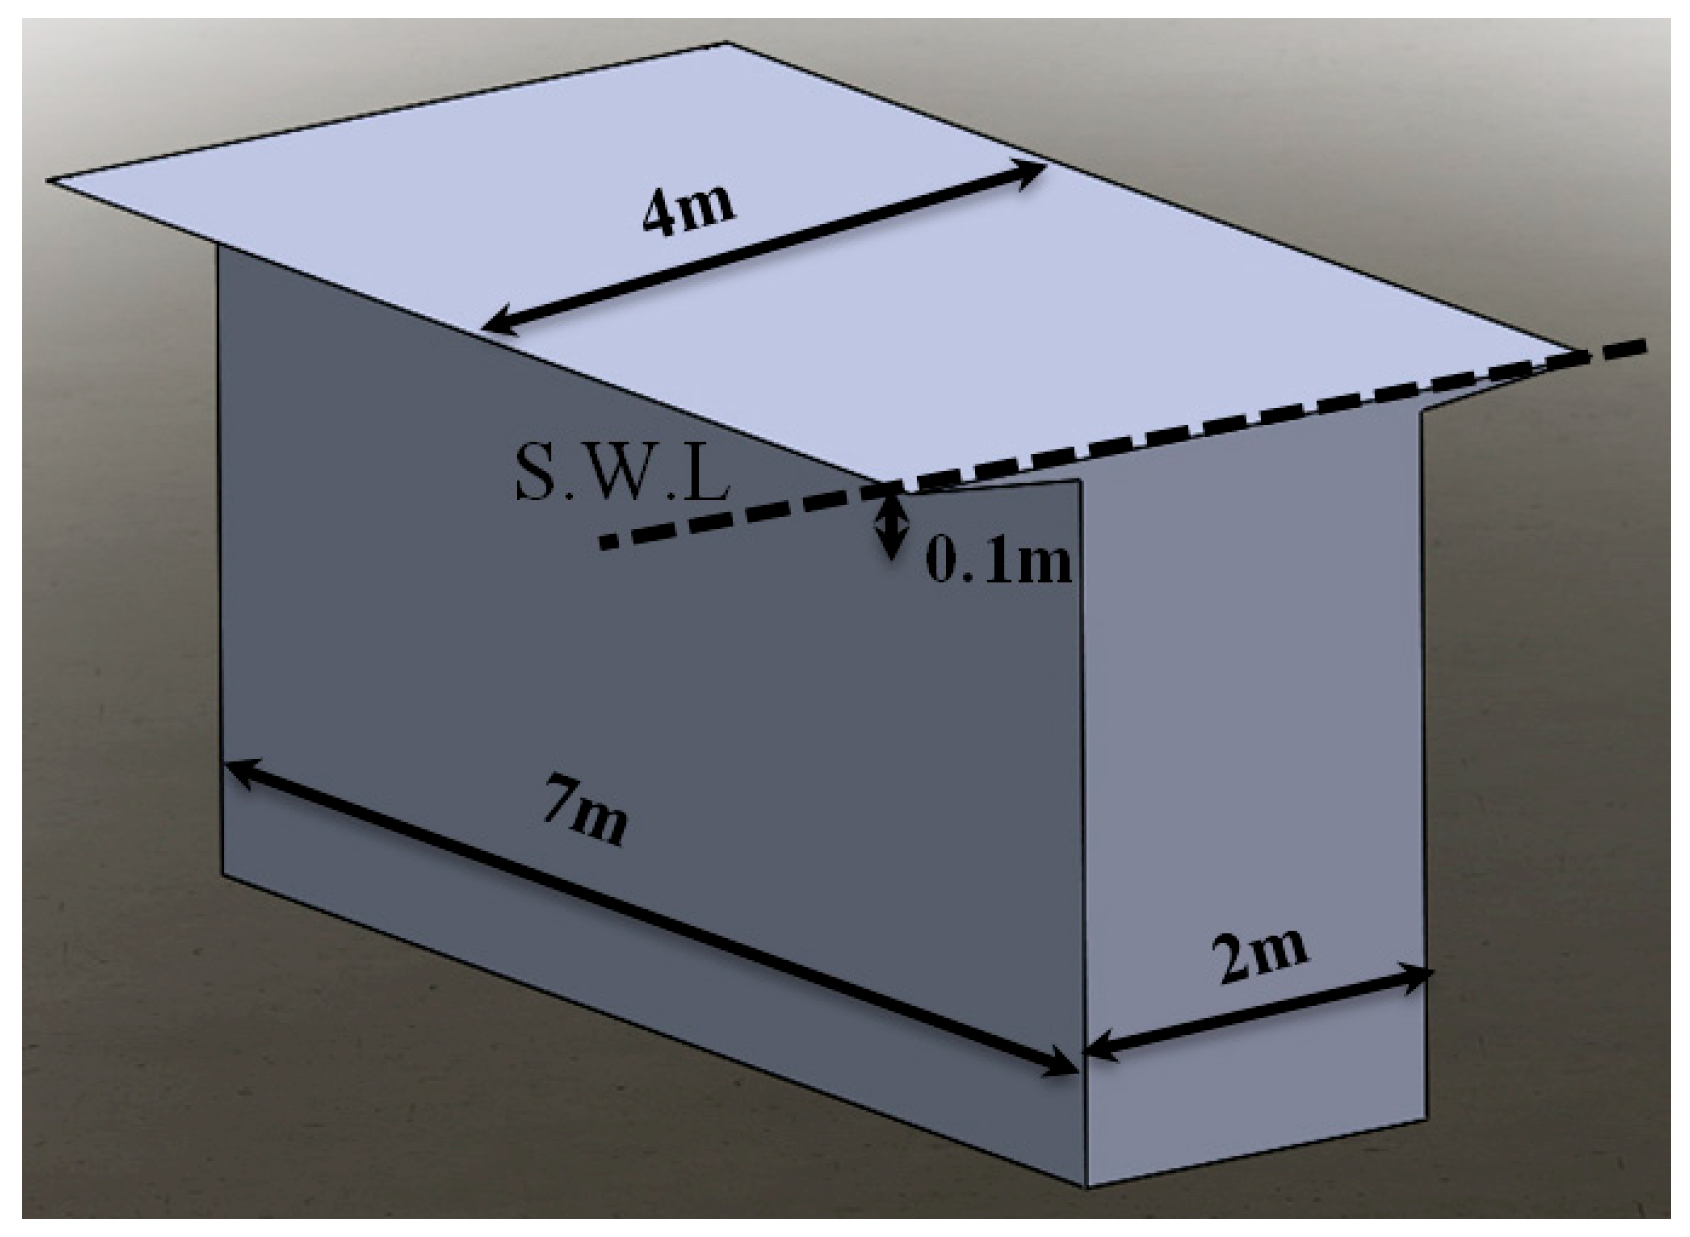
In this article, various geometries are investigated in order to obtain an optimized shape for the WEC application by considering the characteristics of the Caspian Sea waves. Comparing the P
3/S parameter for all results reveals that the bottom flat and upside chamfered geometry with an X:Y ratio of 10:1 from the second series is the best geometry for the desired application. This geometry with the optimized dimensions is shown in
Figure 25.
4. Conclusions
In this paper, the process for shape optimization of a sample wave energy converter is described. For optimizing the shape of the WEC, various shapes are investigated which are divided into three different sections. The parallelepipedic hull shape is chosen as the base geometry for the optimization process. The other geometries are obtained with modifying the upside and bottom parts of this geometry and also changing the dimensions. The optimization is implemented for the characteristics of the Caspian Sea waves. The NEMOH software is used for modelling each geometry hydrodynamically, while multi-objective GA is used for optimization of the models. Mean absorbed power, and submerged surface area are selected as two objective functions for the optimization process. With comparing the results obtained from the optimization process, following conclusions can be derived:
The WEC oscillations are increased by decreasing its length.
The WEC power is increased 73% by chamfering or filleting the bottom of parallelepipedic hull shape.
The WEC power of the upside chamfered geometry with X:Y ratio of 10:1 is 48% more than the upside filleted geometry.
Bottom filleted shape has better performance in comparison to bottom chamfered shape.
Analyzing the results reveals that the bottom flat and upside chamfered geometry with an X:Y ratio of 10:1 from the third series is the best geometry for the specified application. It can also be seen that the extractable power from this geometry (2.158 kW) is around 2.5 times greater than the extractable power from the optimized parallelepipedic hull shape (0.92 kW). Additionally, the submerged surface area for the final shape is 0.6 times smaller than the submerged surface area for the optimized parallelepipedic hull shape. This implies that, after optimizing the geometry of the WEC, more extractable power with less cost can be achieved. This shows that the shape optimization process is vital for the success of this type of projects.


