Article

Construction of Comprehensive Drought Monitoring Model in Jing-Jin-Ji Region Based on Multisource Remote Sensing Data

1
Institute of Geographic Sciences and Natural Resources Research, Chinese Academy of Sciences, Beijing 100101, China
2
University of Chinese Academy of Sciences, Beijing 100049, China
*
Author to whom correspondence should be addressed.
Water 2019, 11(5), 1077; https://doi.org/10.3390/w11051077
Submission received: 13 April 2019 / Revised: 20 May 2019 / Accepted: 20 May 2019 / Published: 23 May 2019

Abstract

:
Drought is a complex hazard that has more adverse effects on agricultural production and economic development. Studying drought monitoring techniques and assessment methods can improve our ability to respond to natural disasters. Numerous drought indices deriving from meteorological or remote sensing data are focused mainly on monitoring single drought response factors such as soil or vegetation, and the ability to reflect comprehensive information on drought was poor. This study constructed a comprehensive drought-monitoring model considering the drought factors including precipitation, vegetation growth status, and soil moisture balance during the drought process for the Jing-Jin-Ji region, China. The comprehensive drought index of remote sensing (CDIR), a drought indicator deduced by the model, was composed of the vegetation condition index (VCI), the temperature condition index (TCI), and the precipitation condition index (PCI). The PCI was obtained from the Tropical Rainfall Measuring Mission (TRMM) satellite. The VCI and TCI were obtained from a moderate-resolution imaging spectroradiometer (MODIS). In this study, a heavy drought process was accurately explored using the CDIR in the Jing-Jin-Ji region in 2016. Finally, a three-month scales standardized precipitation index (SPI-3), drought affected crop area, and standardized unit yield of wheat were used as validation to evaluate the accuracy of this model. The results showed that the CDIR is closely related to the SPI-3, as well as variations in the drought-affected crop area and standardized unit yield of crop. The correlation coefficient of the CDIR with SPI-3 was between 0.45 and 0.85. The correlation coefficient between the CDIR and drought affected crop was between −0.81 and −0.86. Moreover, the CDIR was positively correlated with the standardized unit yield of crop. It showed that the CDIR index is a decent indicator that can be used for integrated drought monitoring and that it can synthetically reflect meteorological and agricultural drought information.

1. Introduction

Drought is one of the most widespread disasters in the world that causes the largest loss of agriculture that supports human society [1,2]. In addition, especially in the context of global warming, drought events have clearly increased, causing harm and loss to the development of society. According to the statistics of natural disaster loss in China, the loss from meteorological disasters accounts for 61% of all the natural disasters in China, and the loss from drought accounts for 55% of the loss from meteorological disasters [3,4]. It can be seen that drought has become one of the most severe natural disasters in China. Therefore, the quantitative monitoring of drought is imminent and of great practical significance.
Researchers across the globe have conducted many studies on combined index for comprehensive drought risk assessment, and some good results have been achieved. The multivariate standardized drought index (MSDI) that probabilistically combined the standardized precipitation index (SPI) and the standardized soil moisture index (SSI) for drought characterization was proposed by Hao et al. [5]. The MSDI incorporated the meteorological and agricultural drought conditions for overall characterization of drought and it was used to characterize the drought conditions in USA [6]. Ganguli et al. [7] developed a new index, the multivariate standardized water stress index (MSWSI), which considered the joint probability of warmer and scarcer water, and computed uncertainties arising from climate model imperfections and intrinsic variability. The index was used to study the US power production at risk from water stress in the context of climate change. The occurrence and development of drought are too complex and difficult to observe directly. Drought events are usually quantified by constructing drought indices [8,9]. According to different observations, the monitoring based on drought index can be divided into two types: one is based on observational data from ground-measured stations, and the other is based on satellite remote sensing data [10].
The site-based drought monitoring originated early, developed for a long time, and was widely used. It can be traced back to 1906, when the precipitation anomaly (Pa) was used to characterize the wet and dry conditions [11]. After continuous development, the representative indices were: palmer drought severity index (PDSI), standardized precipitation index (SPI), composite index of meteorological drought (CI) [12], etc. Palmer took into account the factors including precipitation, temperature, soil effective water content, and so on and put forward the PDSI index, which was of epoch-making significance. The index was mainly used in the United States [13]. The SPI index was based on the precipitation sequence data, which can be used to calculate different scales, each of which can reflect different types of drought [14]. The CI index was specified in the Chinese National Standard for Meteorological Drought. The CI index considered both the precipitation and evaporation factors and had superiority as compared with the SPI drought index that simply used precipitation. It has been used widely for drought monitoring and assessment business in China [15,16]. The site-based drought monitoring is more mature in theory, however, there are some drawbacks. It is impossible to cover the region of interest completely and to get the continuous drought index in space. In addition, the response of surface vegetation to drought is not considered in this mechanism, and therefore highlights obvious temporal and spatial advantages of remote sensing-based monitoring.
As compared with traditional site-based drought monitoring, remote sensing-based monitoring has the advantages of wide coverage, fast information acquisition, and real-time dynamic and high efficiency. With the development of the remote drought sensing-based monitoring model, many drought indices have been produced. The representative indices are as follows: vegetation condition index (VCI), temperature condition index (TCI) and derived combination types. Bannari [17] et al. and Kogan [18] put forward the VCI on the basis of the normalized difference vegetation index (NDVI), which was a more effective method. Kogan [19] proposed a temperature condition index (TCI) from surface temperature considerations. The TCI reflected the relationship between temperature and vegetation growth. High temperatures impeded plant growth, while low temperature indicated that plant growth was normal, that is to say, the lower the TCI the more severe the drought. The vegetation index and the surface temperature better reflected the vegetation cover and soil moisture status, and they could be used to estimate surface evapotranspiration, to retrieve surface heat flux, and to estimate surface water condition. Therefore, a variety of remote sensing-based indices were derived from the vegetation index and surface temperature, such as the vegetation health index (VHI) [20], the vegetation supply water index (VSWI) [21], the temperature vegetation drought index (TVDI) [22], and the vegetation temperature condition index (VTCI) [23].
As is known to all, drought is a complex natural coupling process, which involves not only the growth of vegetation and the supply and demand of soil moisture, but also atmospheric precipitation. With the launch of the Tropical Rainfall Measuring Mission satellite (TRMM) [24], real-time data on atmospheric precipitation in the tropical and subtropical regions of the world can be obtained, which provides spatially continuous precipitation data support for drought monitoring study.
The Jing-Jin-Ji region is a major winter high-quality wheat-producing area in China, where the national food security is directly affected by the fluctuations of wheat yield. However, the precipitation in an abundant or deficient year generally varies by four to five times in this region, which is likely to cause frequent droughts and floods in the region [25]. Previous studies on remote sensing-based monitoring in the Jing-Jin-Ji region mainly focused on single drought factors such as soil and vegetation, however, lacked the ability to consider other factors and integrate comprehensive information [3,25,26,27,28,29]. Hence, the drought factors in this study including precipitation, vegetation growth, as well as surplus and loss of soil moisture were fully taken into account. We used the land surface temperature (LST) to calculate the TCI values as the soil component, the NDVI to calculate the VCI values as the vegetation component, and the TRMM data to calculate the PCI as the precipitation component. Finally, based on a multiple regression analysis, a comprehensive drought monitoring model was constructed for providing scientific support for drought monitoring and assessment in the Jing-Jin-Ji region.

2. Materials and Methods

2.1. Study Area

Jing-Jin-Ji is the abbreviation of provincial-level administrative units in China, where Jing is the abbreviation of the Beijing municipality, Jin is the abbreviation of the Tianjin municipality, and Ji is the abbreviation of the Hebei province (Figure 1). The study area is located in the north-central part of the Great Plains of North China, with Yanshan Mountain in the north, Taihang Mountain in the west, and Bohai Sea in the east. The terrain is high in the northwest and low in the southeast. The total area of the region is about 21.80 × 10⁴ km2. The six prefecture cities (Shijiazhuang, Baoding, Cangzhou, Hengshui, Xingtai, Handan) are the main producing areas of winter wheat. The study area has a typical warm-temperate continental climate, being dry and windy in spring, hot and rainy in summer, balmy and refreshing in autumn, cold and less snowy in winter. The annual total precipitation is between 500 and 800 mm with the following characteristics: precipitation descends from the southeast to the west in the northern region and is low in most southern region [30]. The basic situation of the climate elements in the study area is shown in Table 1 [30].
It can be seen that the maximum values of four factors such as annual precipitation, annual average sunshine hours, annual average relative humidity, and annual average wind speed all appeared in the 1960s, and the minimum values appeared around 2000, while the average annual temperature was the opposite.

2.2. Remote Sensing Data

2.2.1. MODIS

The moderate-resolution imaging spectrometer (MODIS) is a very important sensor mounted on the TERRA and AQUA satellites. These two solar-synchronous polar orbit satellites are the main satellites of the Earth Observation System (EOS). The MODIS image data of most parts of the world can be obtained through the joint observation of the two satellites. The scanning width of the MODIS sensor is 2330 km, and its spatial resolution has three levels: 250 m, 500 m, and 1000 m. The spectral range is 0.4–14.4 μm. The number of bands reaches 36. The bandwidth ranges from visible light to thermal infrared. The MODIS has more advantages than the National Oceanic and Atmospheric Administration-Advanced Very High Resolution Radiometer (NOAA-AVHRR) sensor in time, space, and spectrum resolution. It is widely used in remote sensing-based monitoring of the world and its regions [31].
The NDVI is widely used in the study of vegetation dynamics from global to regional scales and has a good response to climate change, regional identification of land degradation, vegetation productivity, and carbon balance [32,33]. It can be obtained using near-infrared (NIR) and red channels. Some researchers have found that the NDVI can be used as a response factor to identify and quantify drought disturbances in arid and semi-arid regions [18]. The MOD13A3 is a monthly synthetic surface vegetation index product with 1 km resolution, which mainly includes the normalized vegetation index (NDVI) and the enhanced vegetation index (EVI) and related data quality control information. In this study, the Terra MODIS monthly synthesis NDVI data product with 1 km resolution (MOD13A3) was downloaded from the NASA [34] for the 2007–2016 period, and the data were spliced and re-projected to the Universal Transverse Mercator (UTM) projection using the MRT (MODIS re-projection tool) batch processing tool.
LST was a key parameter reflecting surface temperature and biochemical processes, and it could reflect the changes of surface energy. The MOD11A2 was a surface temperature product synthesized every 8 days with 1 km resolution. The data included daytime surface temperature, night surface temperature, and related data quality control information. It mainly used the split window algorithm to obtain the surface temperature [35]. Similarly, Terra MODIS 8-day composite LST values with 1-km resolution (MOD11A2, collection v005) from 2007 to 2016 were derived from the NASA [34] and re-projected to the UTM projection. Then, in order to ensure the consistency of the temporal resolution of the dataset, the maximum synthetic method was used to generate the LST data with monthly resolution.

2.2.2. TRMM

The Tropical Rainfall Measuring Mission (TRMM) is the first meteorological satellite to quantify precipitation in tropical/subtropical regions developed by NASA and NASDA. The TRMM satellite has an altitude of 350 km, and its orbit range is between 35° N and 35° S. Its orbit period is about 90 min, with an average of 15.7 orbits per day. The TRMM satellite operates in a near-equatorial non-solar synchronous orbit. The local time of the satellite passing through the same location is different, which is conducive to the study of the diurnal variation of precipitation. Because of its stable performance, in order to increase the service life of the satellite, the orbit range of the satellite has been adjusted to between 50° N and 50° S after 24 August 2001. This study used TRMM 3B43 monthly precipitation data, the spatial resolution of the data was 0.25° × 0.25° [36]. Analogously, TRMM 3B43 data from 2007 to 2016 was downloaded from NASA [37] and resampled to 1 km resolution using the same projection as the NDVI and the LST.

2.3. Meteorological Station Data

The observed monthly precipitation data and the monthly temperature data from 2007 to 2016 were obtained from the China Meteorological Data Sharing Service Website [38]. In the study area, a total of 23 meteorological stations were selected (Figure 1). Each prefecture city had one meteorological station except Handan.

2.4. Statistical Yearbook Data

The drought affected crop area and the wheat unit yield data, used to validate the model, were derived from the statistical yearbooks of Beijing municipality, Tianjin municipality, and Hebei province [39].

2.5. Methods

The objective of this study was to construct a comprehensive drought monitoring model based on multisource remote sensing data, but different remote sensing data have different resolution, and therefore they could not be used directly. Therefore, the multisource remote sensing data was scaled and deduced to a series of standardized drought parameters. The research flow chart is shown in Figure 2.

2.5.1. Vegetation Condition Index (VCI)

The NDVI reflects the growth status of the vegetation. When drought occurs, it will affect the normal growth of vegetation and the NDVI value will be low. However, NDVI does not directly characterize the effects of drought on vegetation. In addition, vegetation growth in the Jing-Jin-Ji region is more cyclical. NDVI in different months cannot be directly compared. Therefore, VCI was used to reflect the state of the vegetation during different growth cycles [18,40]. The equation is as follows:
VCI = NDVI NDVI min NDVI max NDVI min
where, NDVImax is the maximum value of each NDVI raster in the same month for 2007–2016 years and NDVImin is the minimum value of each NDVI raster in the same month for 2007–2016 years.

2.5.2. Temperature Condition Index (TCI)

Thermal stress will occur on the surface at the time of the drought. However, surface temperature changes with the seasons and cannot be directly used for drought monitoring. On the basis of the idea of the VCI index, the TCI index was proposed [18,40]. The equation is as follows:
TCI = LST max LST LST max LST min
where, LST stands for land surface temperature. The LST is a key factor in surface physical processes at regional and global scales. It is also an important parameter for studying material exchange and energy exchange between surface and atmosphere. Many applications such as drought, high temperature, and forest fire require LST. The LSTmax is the maximum value of each LST raster in the same month for 2007–2016 years; LSTmin is the minimum value of each LST raster in the same month for 2007–2016 years.

2.5.3. Precipitation Condition Parameters (PCI)

Downscaling TRMM monthly data can accurately reflect the temporal and spatial characteristics of precipitation, and it can provide high precision data for drought modeling. For this reason, a similar method was used to standardize the downscaling TRMM.
PCI = TRMM TRMM min TRMM max TRMM min
where, TRMMmax is the maximum value of each TRMM raster in the same month for 2007–2016 years; TRMMmin is the minimum value of each TRMM raster in the same month for 2007–2016 years.

2.5.4. Comprehensive Drought Index (CI)

The CI index is a drought index recommended by the Chinese National Standard for meteorological drought promulgated by the China Meteorological Administration [15]. It is obtained by compounding the nearly 30 days and nearly 90 days SPI index and the nearly 30 days relative humidity index. The CI index reflects both the short-term (monthly) and long-term (seasonal) precipitation anomalies and the water deficits on short-term scales. Thus, the CI index is suitable for real-time meteorological drought monitoring and assessment of historical meteorological drought. The expression is as follows:
CI = a Z 30 + b Z 90 + c M 30
where, Z30 represents the SPI values with time scale of 30 days, a is the coefficient of Z30 and it is obtained from the average value of Z30 which reaches the level of mild drought divided by the minimum value of Z30 in history, and the average value of a is 0.4. Similarly, Z90 represents the SPI values with time scale of 90 days, b is the coefficient of Z90 and it is obtained from the average value of Z90 which reaches the level of mild drought divided by the minimum value of Z90 in history, and the average value of b is 0.4. M30 is a relative humidity index of 30 days, c is the coefficient of M30 and it is obtained from the average value of M30 which reaches the level of mild drought divided by the minimum value of M30 in history, and the average value of c is 0.8.
M = ( P P E ) / P E
where, P is the monthly precipitation and PE is the monthly evapotranspiration. The PE is calculated by the Thornthwaite method [41,42]. The Thornthwaite method is the internationally accepted method to calculate PE, particularly applicable to month-to-month data. The Thornthwaite method has also carried out many related applications in China, and its results are consistent with the actual situation [43,44,45]. The input data required by this method are easy to obtain and the calculations are simple.
E T T h o = { 0 , T i 0   ° C 1.6 × L d × ( 10 T i I ) α , 0 T i 26.5   ° C L d × ( 415.85 + 32.24 T i 0.43 T i 2 ) , T i > 26.5   ° C
L d = d 12 + N 30
I = i = 1 12 ( T i 5 ) 1.514
α = 0.49 + 0.0179 × I 7.71 × 10 5 × I 2 + 6.75 × 10 7 × I 3
where, ETTho is the evapotranspiration, Ti is the monthly-mean temperature, Ld is the correction coefficient associated with the day length and latitude, α is the empirical coefficient, I is the heat index, D is the daily length of fifteenth day per month, N is the number of days per month.

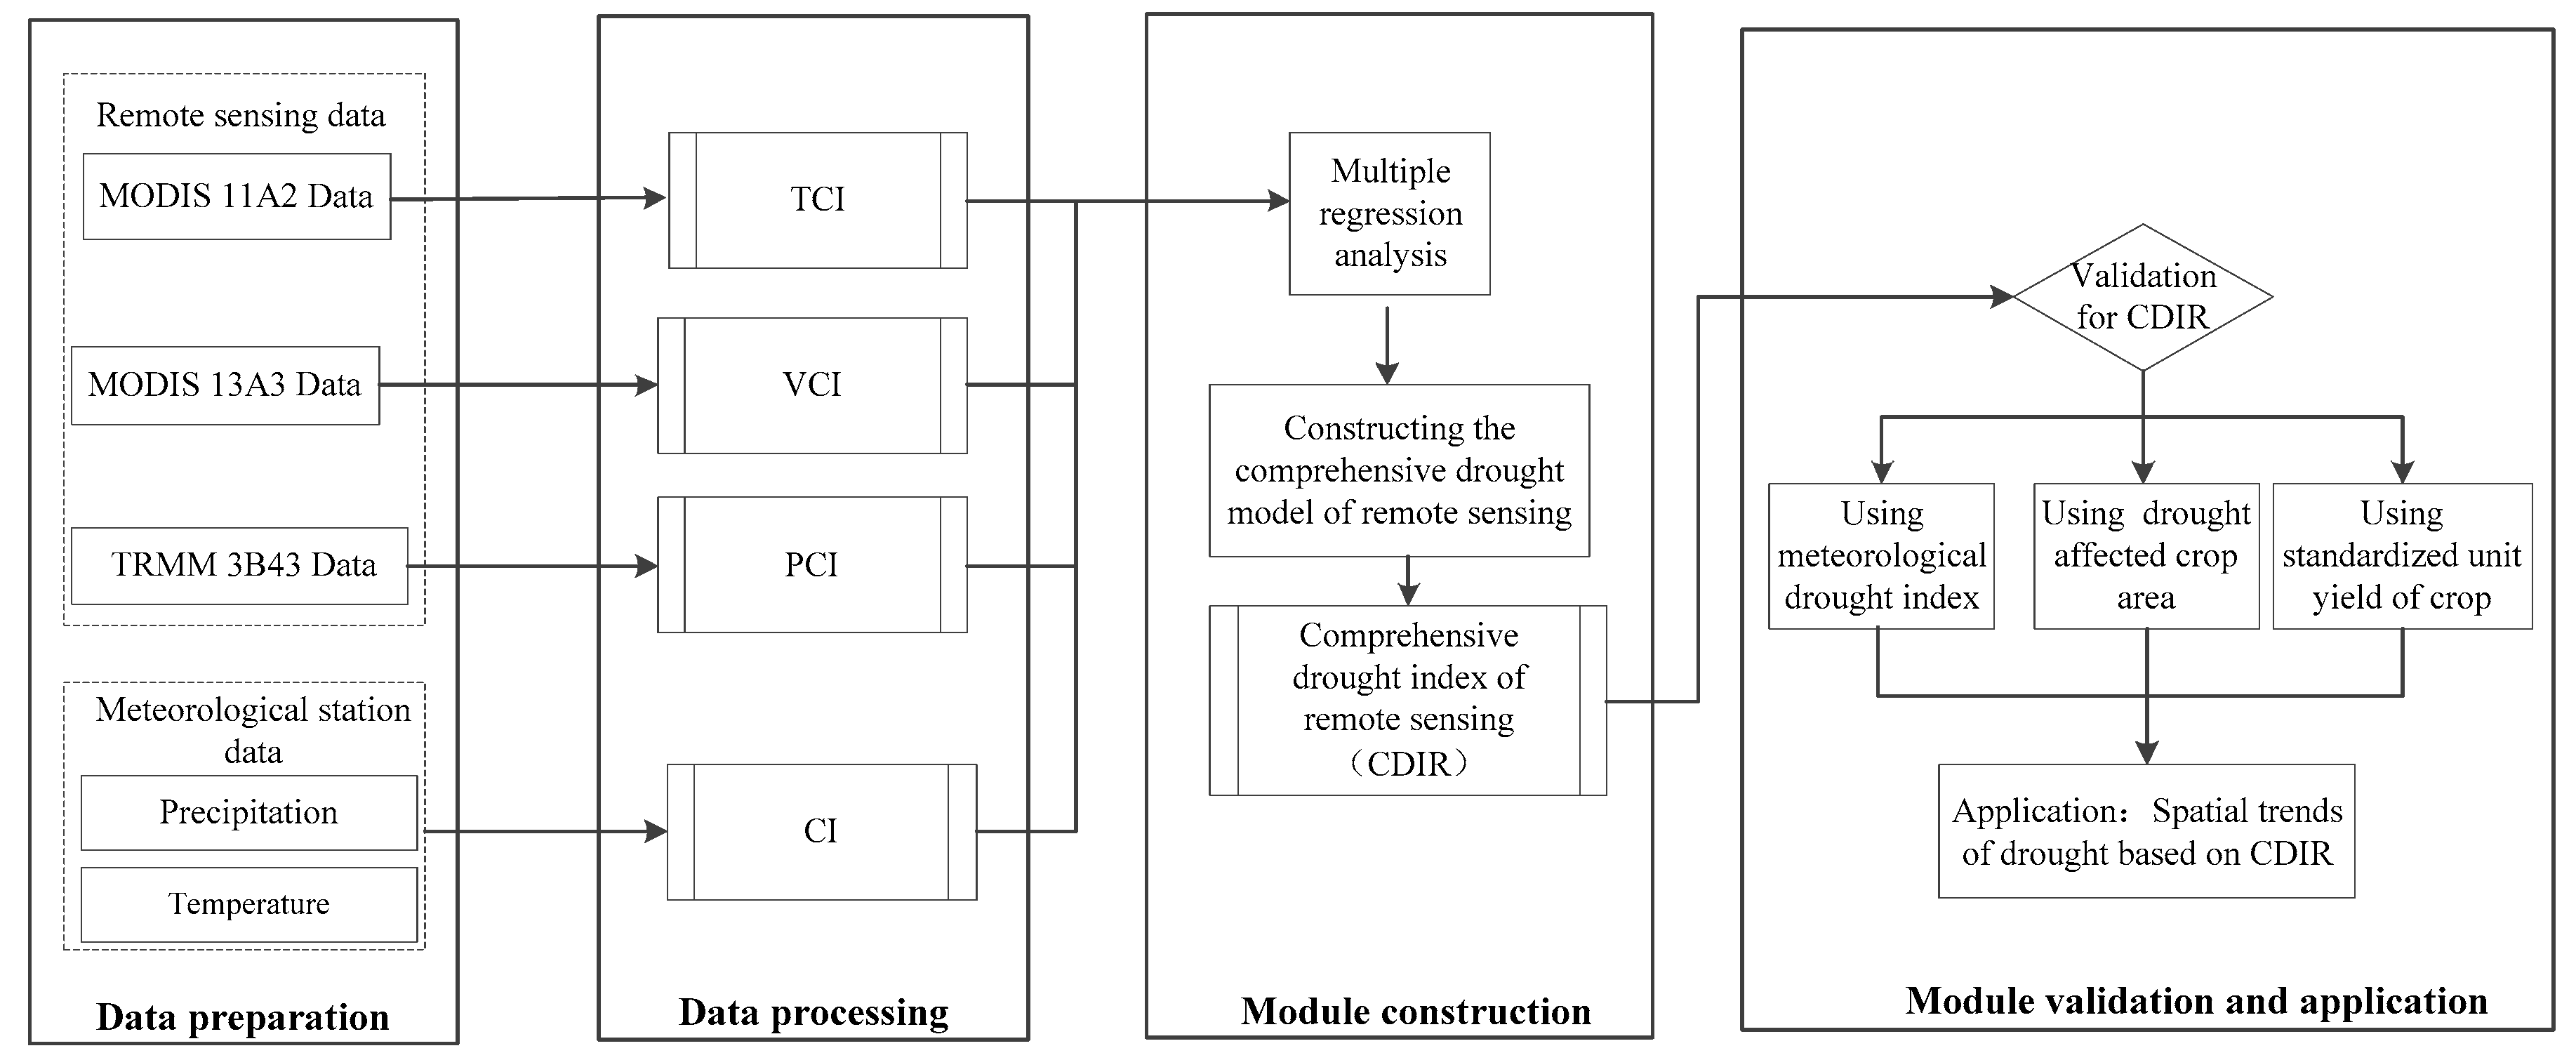
2.5.5. Comprehensive Drought Model Construction

On the basis of the above work, the CI was used as the dependent variable at each meteorological station and the VCI, TCI, and PCI were used as independent variables. The vector-point data from the meteorological stations were utilized to extract the pixel values of the PCI, TCI, and VCI. Then, according to the monthly multi-regression equation between the independent variable and the dependent variables, the CDIR was calculated from 2007 to 2016 in Jing-Jin-Ji region.
Considering the seasonal variation in the Jing-Jin-Ji region, there are obvious seasonal differences in the growth of different vegetation and water vapor. Therefore, in the process of constructing the drought monitoring model, the CDIR value was calculated month by month. Finally, the CDIR value set at a monthly time scale was reconstructed from 2007 to 2016 and considered the growth period of winter wheat (March–June) and maize (July–October) and the drought characteristics in the Jing-Jin-Ji region. This study mainly monitored drought during the 10-year period from March to October. The monthly regression equation is as follows:
March:
CDIR = 3.42 + 8.79 × ( PCI ) 11.75 × ( PCI ) 2 2.83 × ( VCI ) 13.42 × ( TCI ) + 7.52 × ( TCI ) 2   ( R 2 =   0.522 )
April:
CDIR = 1.61 + 7.15 × ( PCI ) 2.64 × ( PCI ) 2 0.73 × ( VCI ) 2.14 × ( TCI ) + 4.26 × ( TCI ) 2   ( R 2 =   0.738 )
May:
CDIR = 1.97 + 10.02 × ( PCI ) 4.24 × ( PCI ) 2 0.15 × ( VCI ) 0.05 × ( TCI ) + 0.21 × ( TCI ) 2   ( R 2 =   0.732 )
June:
CDIR = 2.37 + 9.92 × ( PCI ) 4.33 × ( PCI ) 2 0.19 × ( VCI ) 0.71 × ( TCI ) 0.13 × ( TCI ) 2   ( R 2 =   0.728 )
July:
CDIR = 1.75 + 9.26 × ( PCI ) + 1.11 × ( PCI ) 2 0.59 × ( VCI ) + 1.01 × ( TCI ) 0.27 × ( TCI ) 2   ( R 2 =   0.744 )
August:
CDIR = 1.69 + 9.27 × ( PCI ) + 1.14 × ( PCI ) 2 0.58 × ( VCI ) + 0.29 × ( TCI ) + 1.16 × ( TCI ) 2   ( R 2 =   0.762 )
September:
CDIR = 1.68 + 5.39 × ( PCI ) 0.561 × ( PCI ) 2 + 0.03 × ( VCI ) 0.13 × ( TCI ) + 0.41 × ( TCI ) 2   ( R 2 =   0.703 )
October:
CDIR = 1.02 + 8.43 × ( PCI ) 0.71 × ( PCI ) 2 0.23 VCI 3.38 × ( TCI ) + 3.70 × ( TCI ) 2   ( R 2 =   0.820 )
Referring to the criteria for classification of the SPI and the CI in the National Meteorological Drought Level of the People’s Republic of China and combined with the frequency of occurrence of drought grades, the CDIR is divided into 5 levels, as shown in the Table 2.

2.5.6. Linear Trend Analysis of Drought

In order to quantitatively analyze the trend of drought in the Jing-Jin-Ji region, the univariate linear regression model was used to fit the CDIR index over time [46,47]. Each grid was regarded as a site, so the monthly regression equation for each “grid site” in the period of 2007 to 2016 could be fitted, and then, the seasonal regression slope (K) was calculated.
In this study, the slope of the univariate linear regression was obtained by using the least square method. The least squares method is a mathematical optimization technology, which searches for the best function matching of data by minimizing the square of error. This method is often used in curve fitting. Thus, the least squares method was used to calculate the slope of the linear regression of the comprehensive drought index with time. The equation is as follows:
K = n × i = 1 n ( t i × CDIR i ) i = 1 n t i i = 1 n CDIR i n × i = 1 n t i 2 ( i = 1 n t i ) 2
where, K is regression slope; n is time length, t i is time variable, and CDIR is comprehensive drought index. When the CDIR value is lower, the drought is severer. Therefore, when the K value is negative, the drought will increase with time.

2.6. Validation

2.6.1. Validation Using SPI Index

The SPI index was proposed by McKee [14] et al., and it better reflects the drought intensity and duration and is sensitive to the response of drought change. The SPI values at different time scales have different physical meanings. The SPI values in a relatively short-time scale reflect the change of short-term soil water content to a certain extent, which are of great significance for agricultural production. The SPI values in a relatively long-time scale reflect long-term stream-flow variation and play an important role in the management of the reservoir [48]. The 3-month scale SPI (SPI-3) is more sensitive to the onset and persistence of droughts and floods during a year, meanwhile it reflects the characteristics of short-term meteorological droughts and floods, which are closely related to agricultural drought [49]. Thus, the correlation analysis between SPI-3 and CDIR index was used to verify the accuracy of the model.

2.6.2. Validation Using Drought Affected Crop Area and Standardized Unit Yield of Wheat

Drought is the most frequent and influential agricultural meteorological disaster in the Jing-Jin-Ji region. Winter wheat and summer maize are widely planted in the study area, which is greatly affected by drought. Especially, the water demand of wheat is very large, and the occurrence of drought will affect the normal growth of crops. There is a close relationship between the areas affected by crop drought and drought disasters [12,50]. Thus, the drought-affected area of crops was used to verify the model. Since the “Yearbook of Statistics” does not provide the drought-affected area of crops in prefecture cities, this study considered the study area as a whole and analyzed the annual drought-affected areas during 2007–2016 and CDIR, respectively. In addition, correlation analysis among VCI, TCI, and CDIR was also carried out in this study.
In addition to the factors such as soil fertility, disease and insect pests, and planting density, the water shortage caused by drought will have a direct impact on the yield of crops. Since the study region was a winter wheat and summer maize producing region in China, the yield of wheat and maize was used to test the CDIR in winter wheat and summer maize mainly in the growing period [12,50]. Because of the regional factors, climate characteristics, and soil fertility differences in the subregions, the data of the wheat unit yield were standardized to remove the suppression difference. The equation for calculation is as follows:
P = P i P ¯ σ
where, P is the standardized unit yield of crop, Pi is the crop yield in year i for one prefecture-level city, i is the index of the year, P ¯ is the average yield during the period between 2007 and 2016, and σ is the standard deviation.

3. Results and Discussion

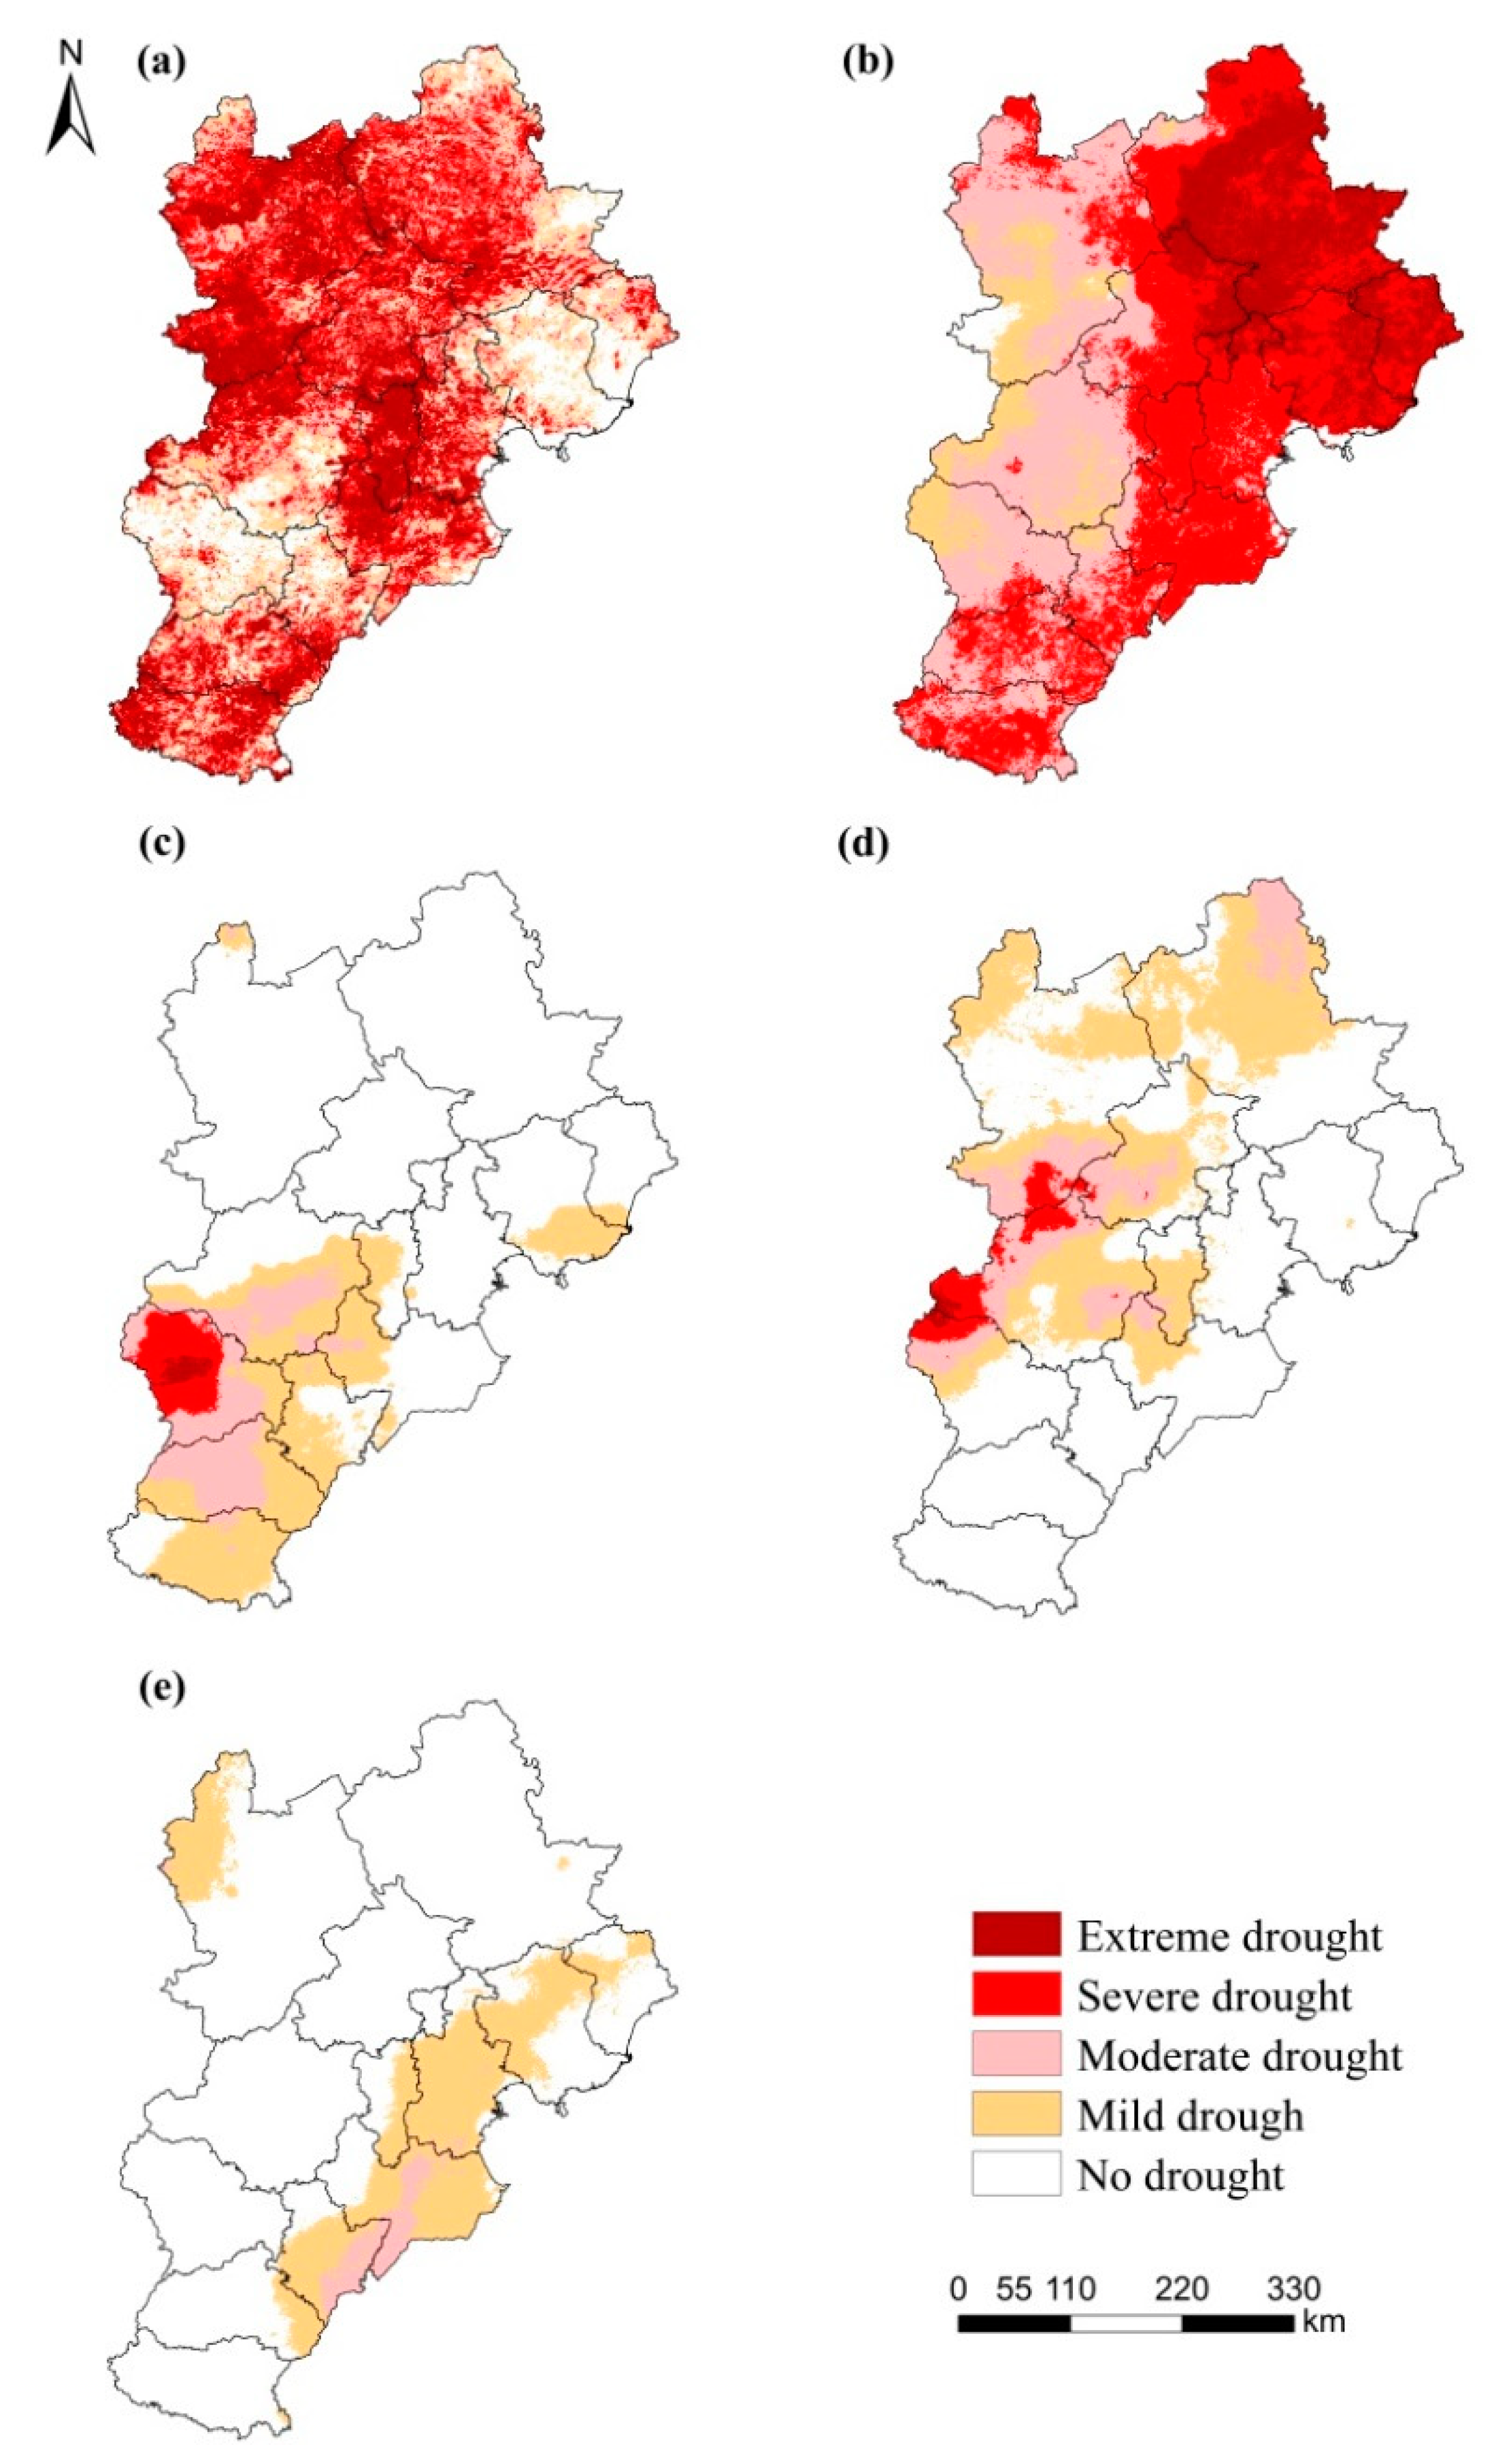
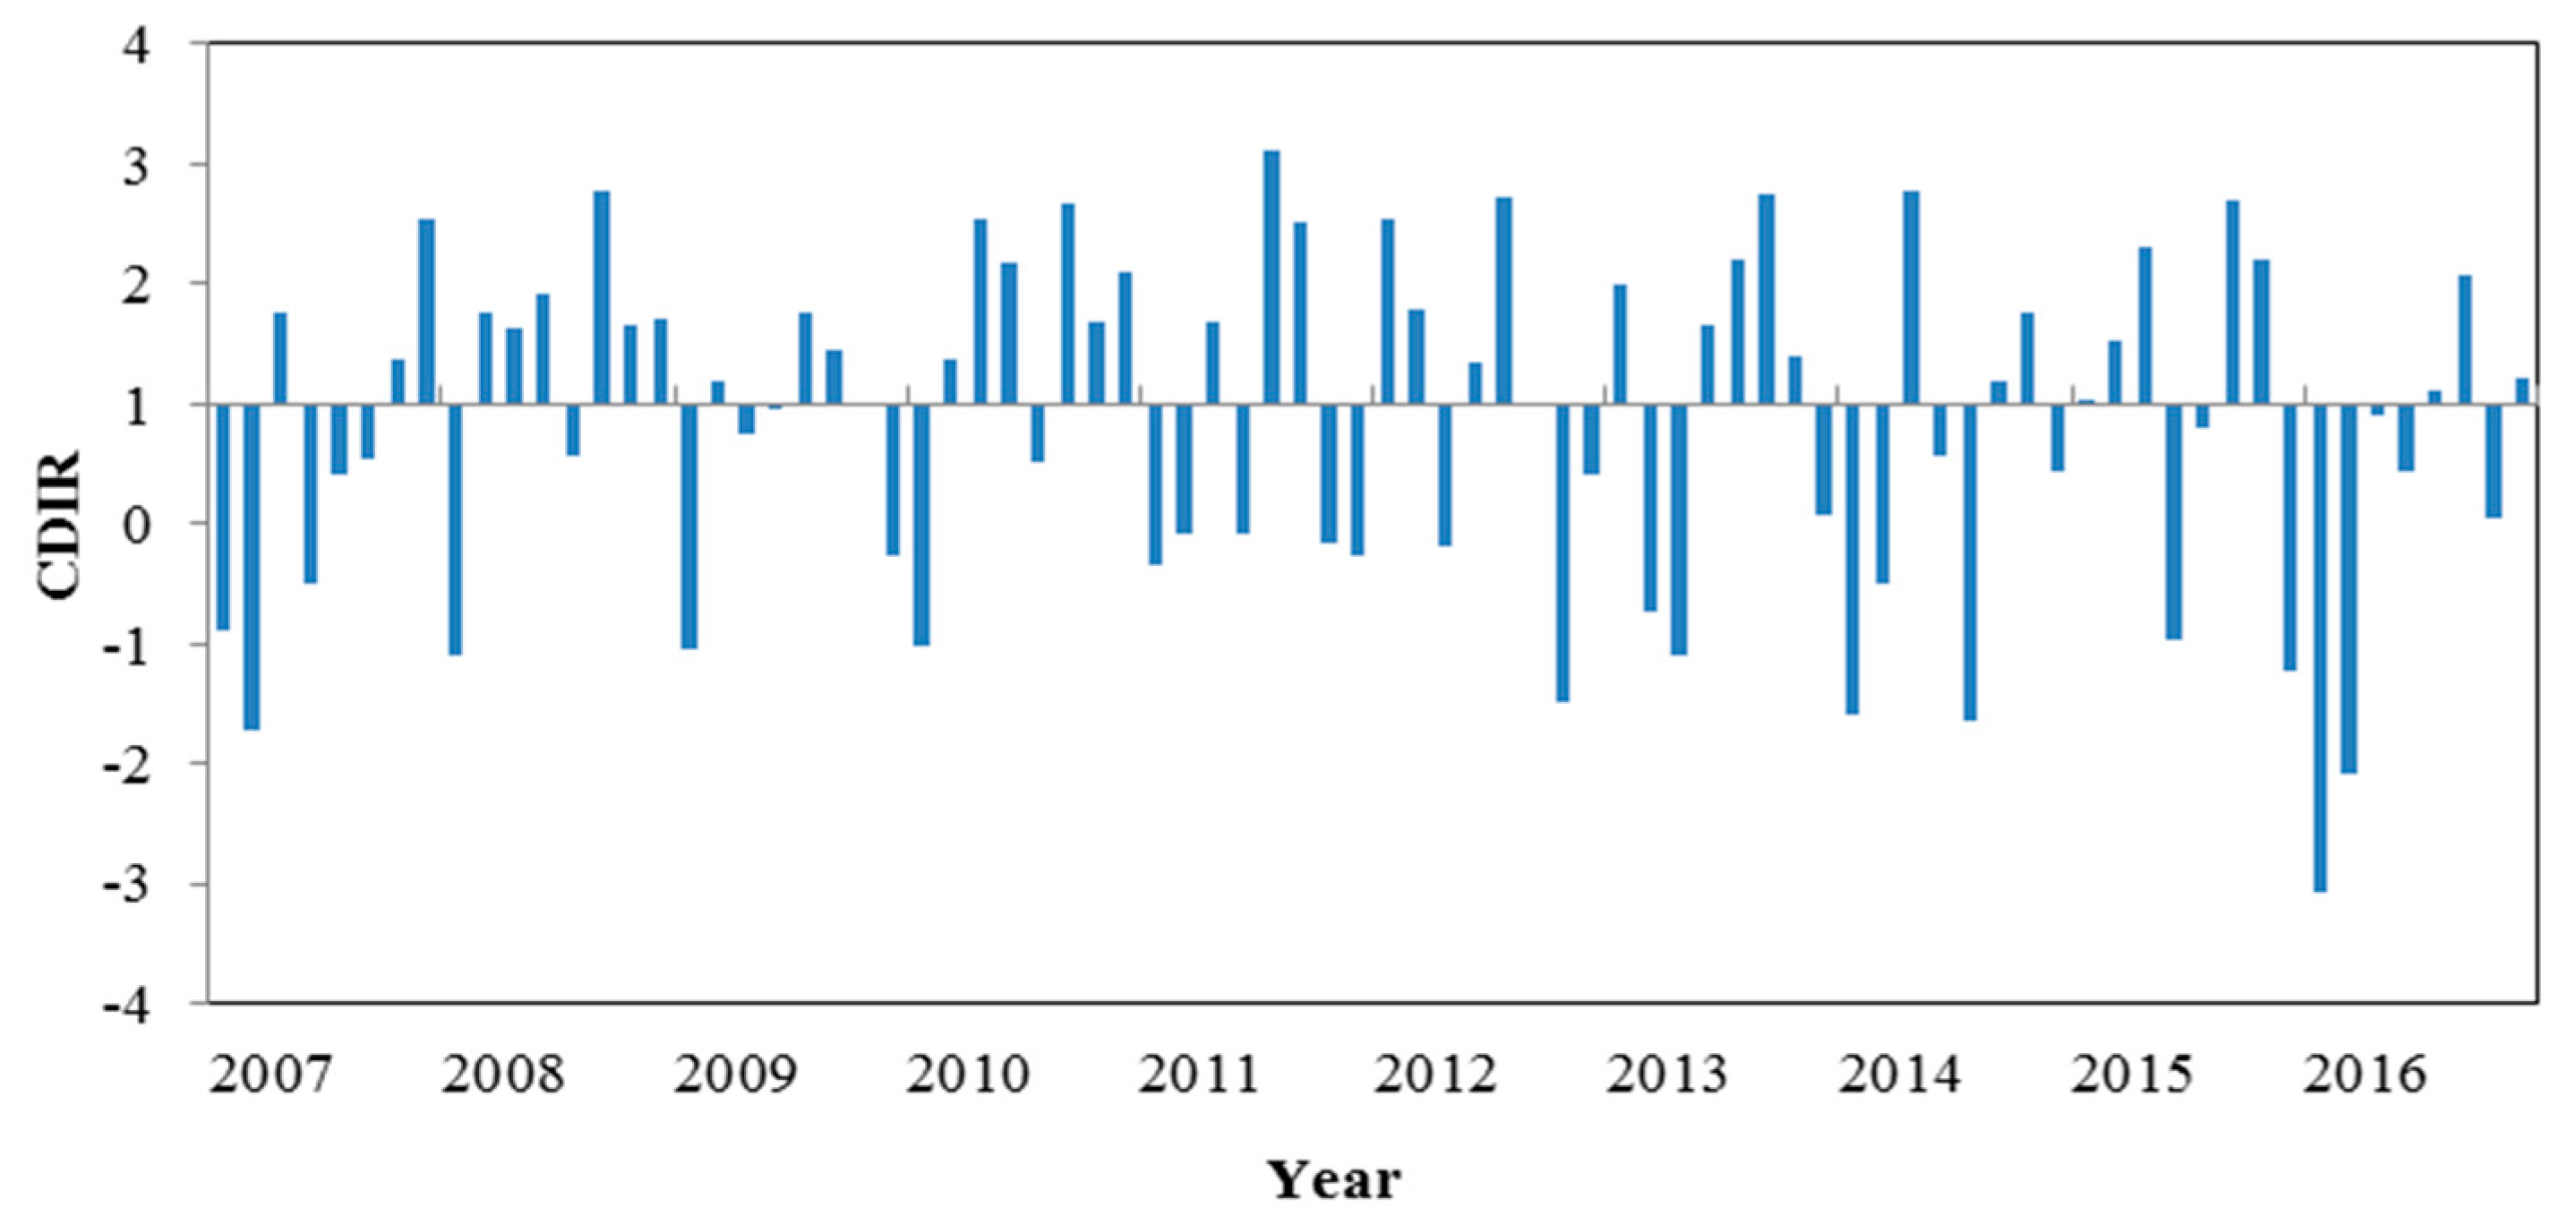
3.1. Drought Process Monitored by CDIR

The drought situation in the Jing-Jin-Ji region from 2007 to 2016 was monitored using the CDIR in this study (Figure 3). The results show that the CDIR can better reflect the occurrence and development of drought and it is in accordance with the historical observation of drought in the Jing-Jin-Ji region. In this study, the severe drought experienced in 2016 was accurately monitored, and the process was visualized on the maps of CDIR values (Figure 4). The results showed that there was a periodic drought in the Jing-Jin-Ji region, and the drought was more serious in spring, especially in 2016.
In March, the drought conditions were very serious and the drought area was as high as 18.3 × 10⁴ km2, as well, the area affected by extreme drought was 6.0 × 10⁴ km2. In April, the drought gradually intensified and moderate and above drought appeared in the eastern region. The area affected by drought also increased to 21.2 × 10⁴ km2. In May, the precipitation increased and was concentrated mainly in the north. Accordingly, the drought in the northern region was relieved, while the drought continued to develop in the central and southern regions located in Hebei province, especially Baoding and Xingtai suffered moderate droughts. The western part of Shijiazhuang suffered severe and above droughts. The main reasons for spring drought in 2016 may be low precipitation and high temperature. In the spring of 2016, the mean air temperature in Hebei Province (14.5 °C) was 1.5 °C higher than the normal year [51].
In June, meteorological drought occurred in the central and western regions of the Hebei Province, such as Zhangjiakou, Chengde, and Tangshan. Severe drought occurred at the junction of Zhangjiakou and Baoding, moreover severe and extreme drought occurred in the southwest of Baoding and the northwest of Shijiazhuang.
In July, the drought developed again. This time, it was mainly concentrated in the central and eastern parts of the study area. The CDIR results obtained from the comprehensive drought monitoring model were in accordance with the 2016th Climate Bulletin of Hebei Province, China [51], which showed the better effectiveness of the model.
In addition to the severe drought that occurred in 2016, there are other drought processes that have been monitored by the CDIR value set from 2007 to 2016. Severe and sustained droughts occurred during 2007, 2011–2014, and droughts mainly occurred during the spring (Figure 5).

3.2. Validation of Comprehensive Drought Monitoring Model

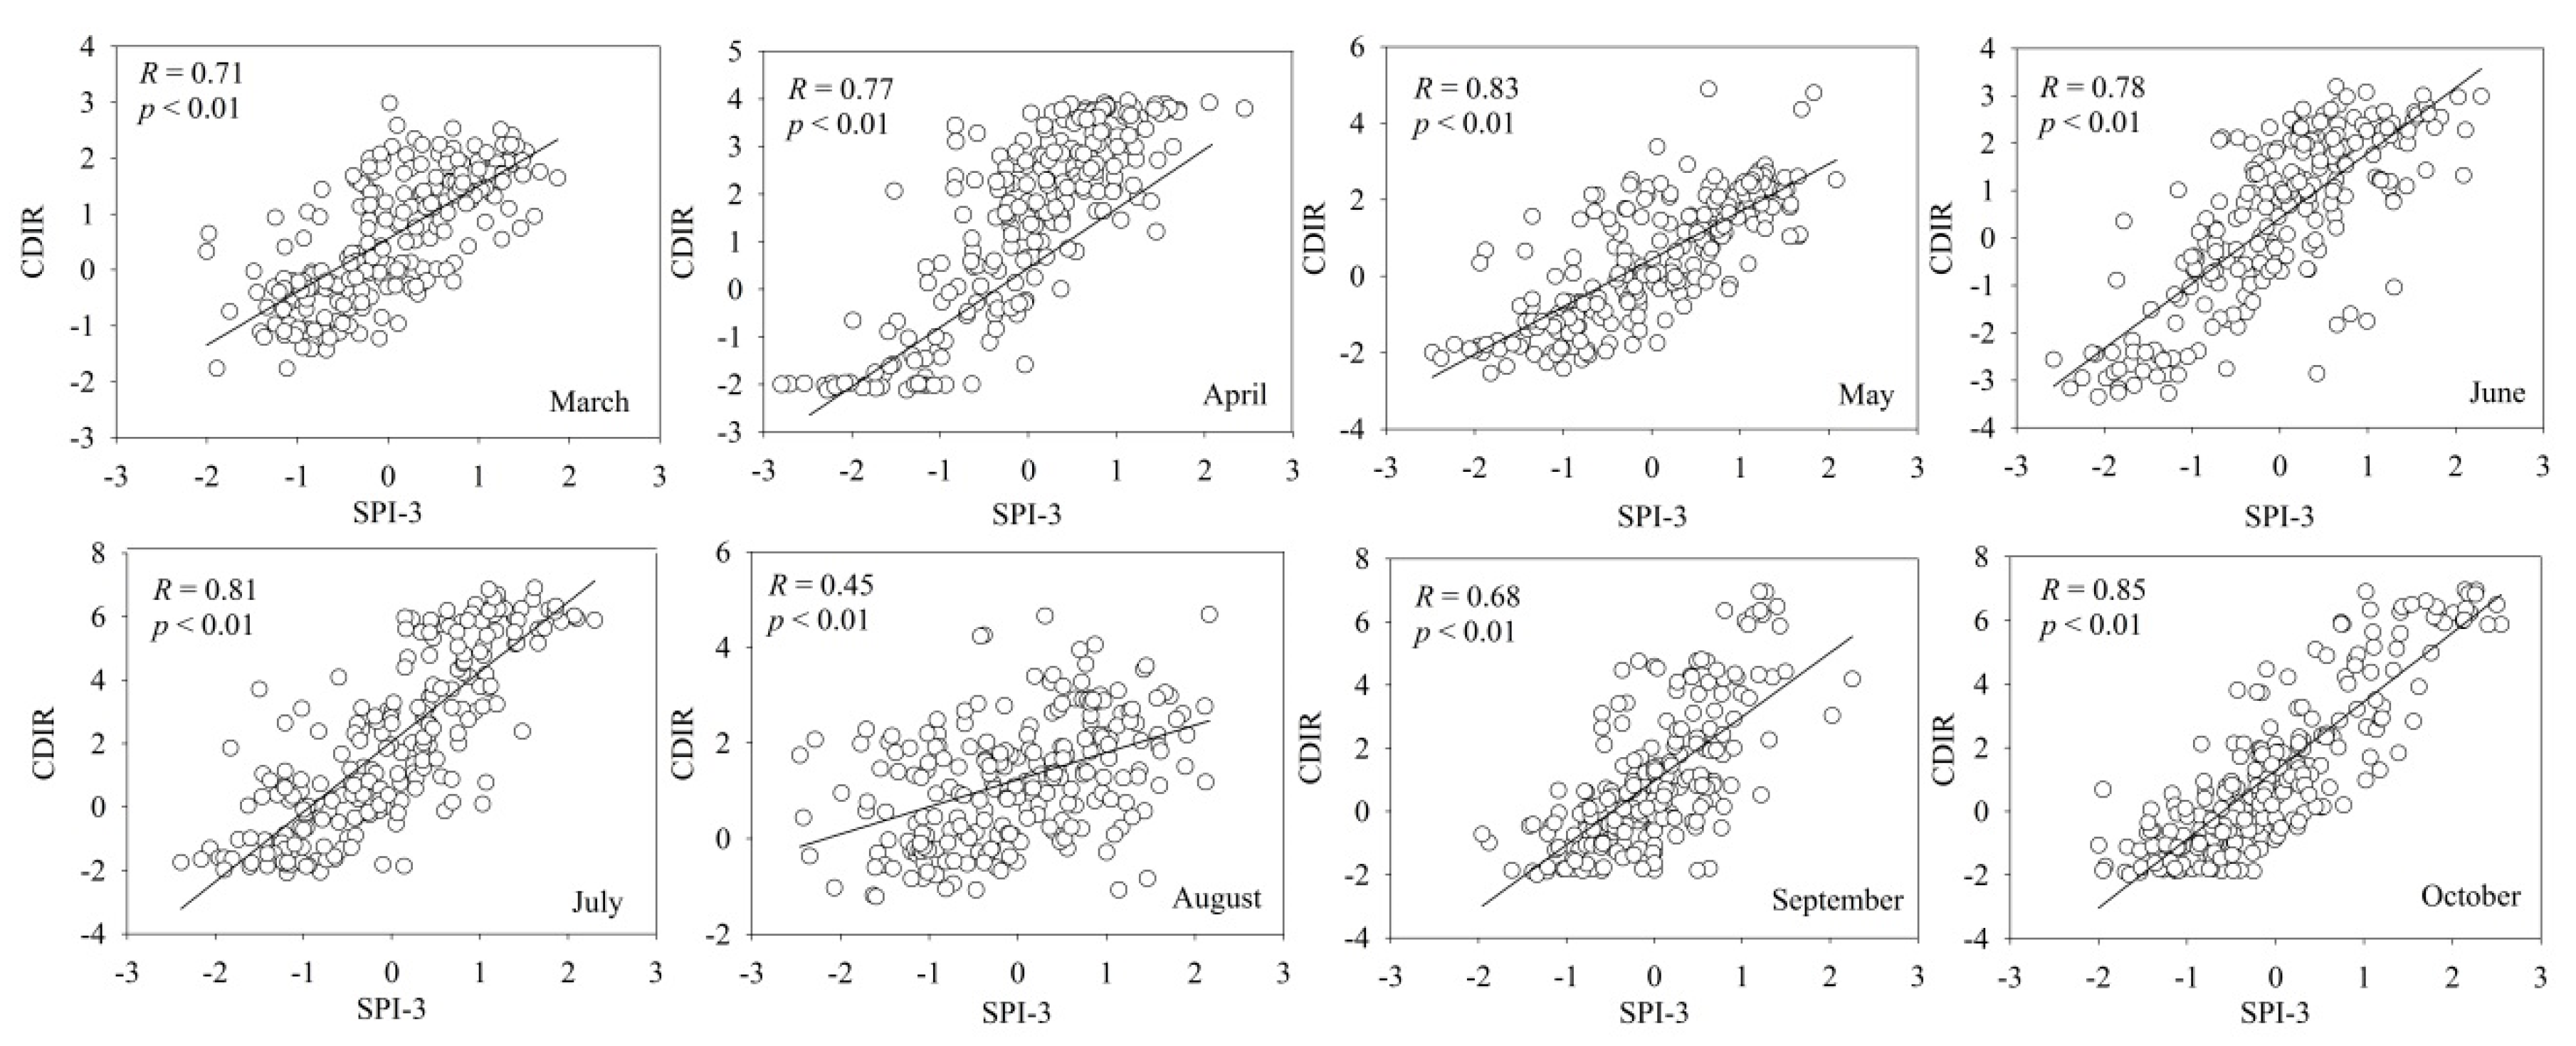
3.2.1. Validation Using SPI Index

Figure 6 shows that the correlation coefficients of all months were significant (p < 0.01). Except for the lower correlation coefficient in January and September, the correlation coefficients in all months were greater than 0.50, indicating that the reliability of the model was verified.

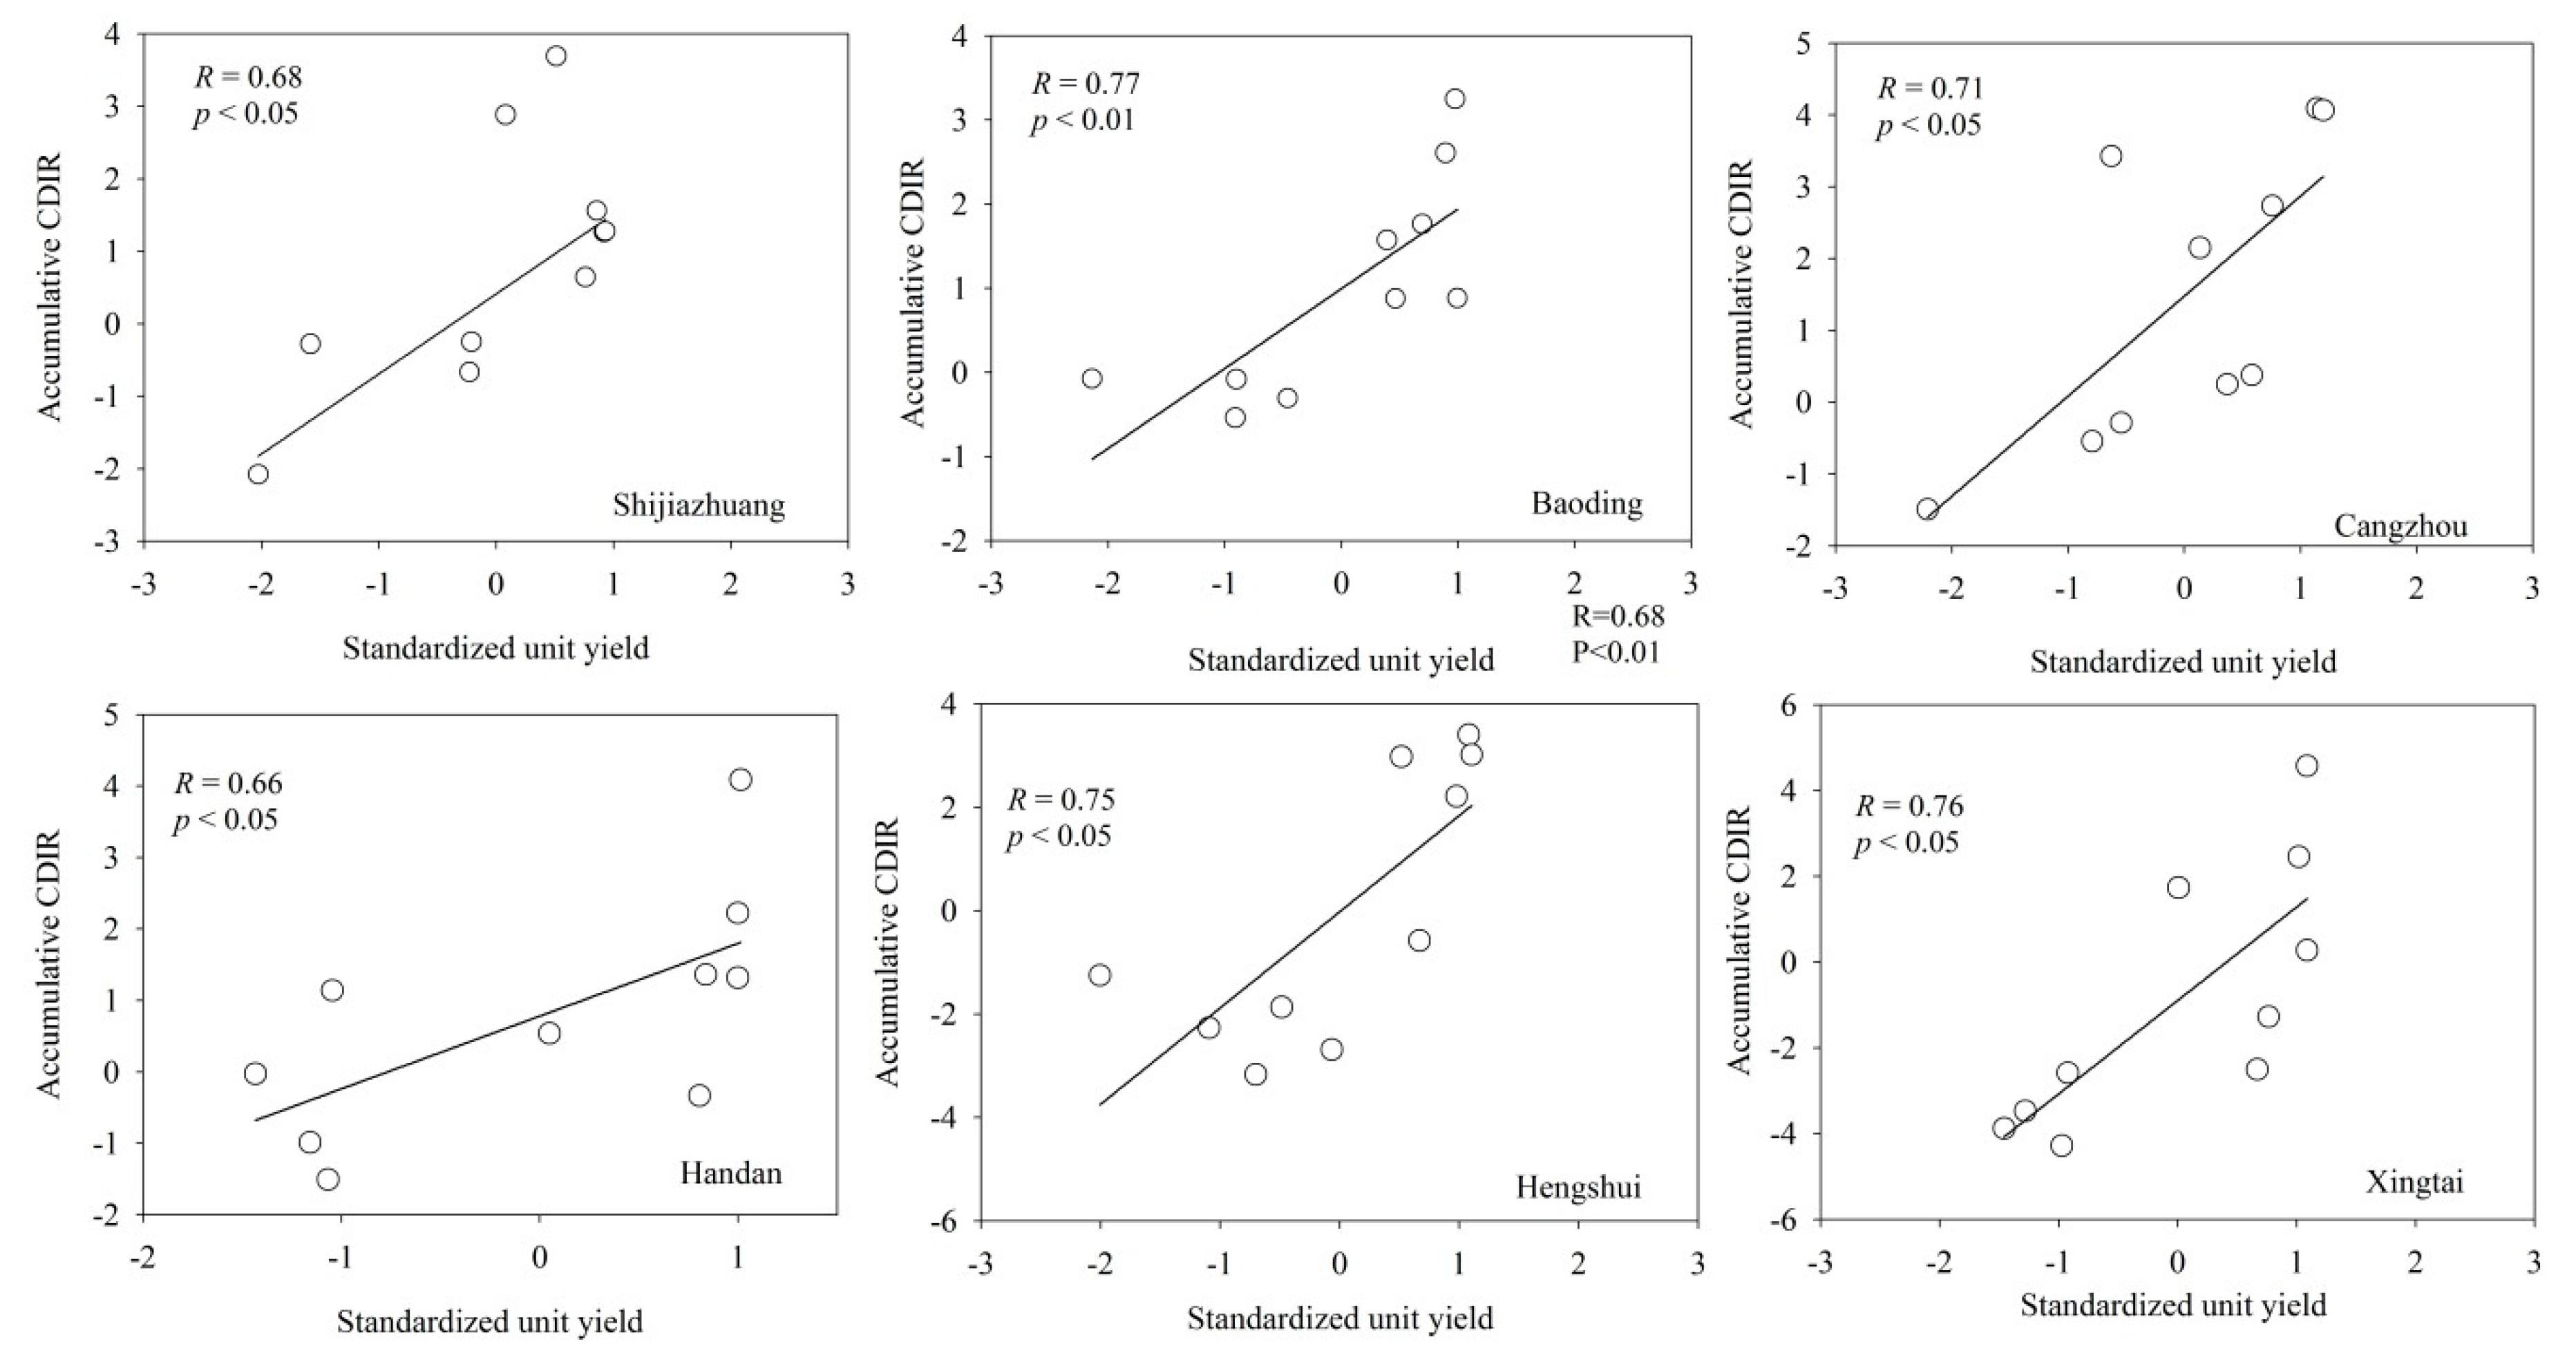
3.2.2. Validation Using Drought Affected Crop Area and Standardized Unit Yield of Wheat

Figure 7 shows that the R values between the drought-affected crop area and CDIR, VCI and TCI was relatively high and significant (p < 0.01), indicating that the CDIR with the highest R (0.86) is applicable and reliable to monitor drought. The R between the drought-affected crop area and CDIR was −0.86. The other R values were both above −0.80 and both passed the test of p < 0.01, indicating that the use of CDIR to monitor drought is applicable and reliable.
Moreover, as compared with the drought-affected crop area, the standardized unit yield of crop is closely related to drought disasters. In this study, the six prefecture cities are high yield areas, including Baoding, Cangzhou, Handan, Shijiazhuang, Hengshui, and Xingtai (Figure 1), and therefore they were selected as the typical area for verification. The results show that the accumulative CDIR of wheat growth period had a good correlation with the standardized unit yield of crop (Figure 8). The R was between 0.60 and 0.76 and significant (p < 0.05).

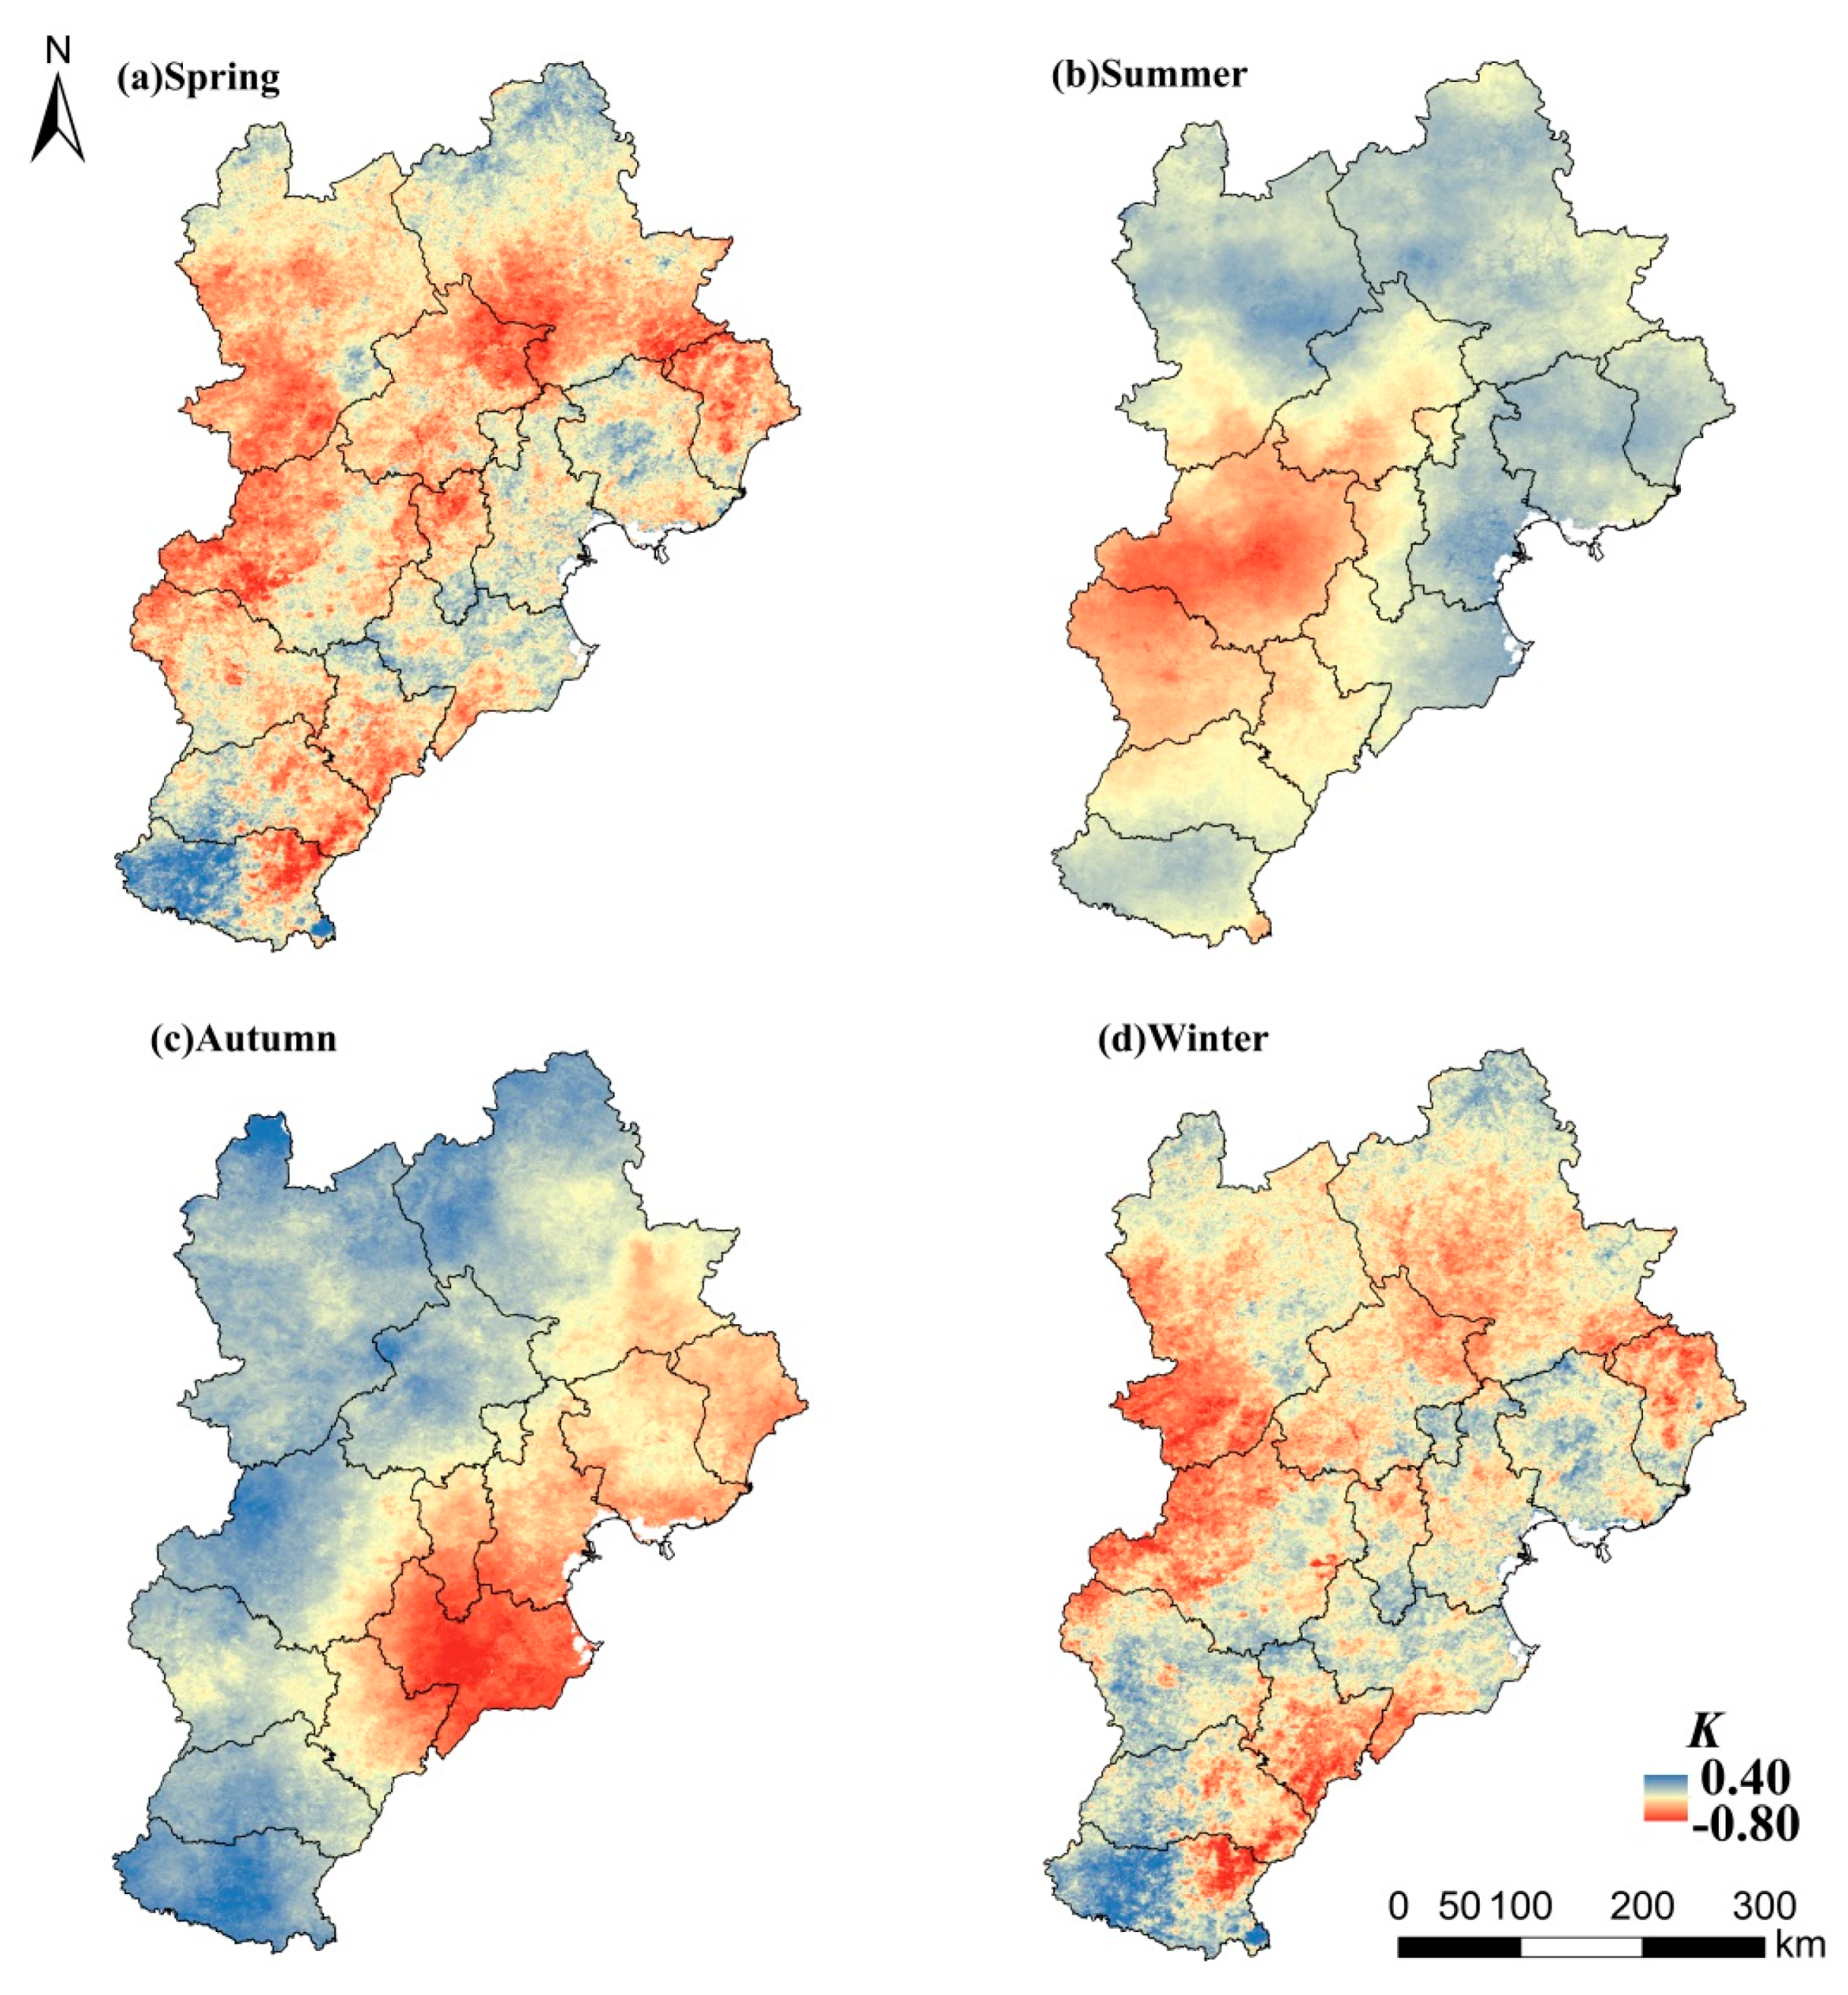
3.3. Application: Spatial Trends of Drought Based on CDIR

The trend of the CDIR index in the four seasons showed a great difference (Figure 9). According to Equation (18), when the K value is negative, the drought situation will strengthen over time. When the K value is positive, the drought situation will weaken over time. When the K value equals 0, the drought will remain unchanged with time. The arid area (K < 0) in spring was about 199 × 103 km2, accounting for about 93.12% of the study area, indicating that the spring drought was serious. The arid area (K < 0) in summer was about 33 × 103 km2, only accounting for about 15.45% of the study area. The arid (K < 0) and humid (K > 0) areas were basically equal in the autumn, and the humid regions were mainly concentrated in the northern and eastern study area and the arid regions were mainly concentrated in the eastern study area. The K value in winter was mostly negative, the trend of drought was increasing year by year, and the statistical data are shown in the Table 3.
Greve et al. [52]. found that over about three-quarters of the global land area, robust dryness changes could not be detected. Only 10.8% of the global land area showed a robust “dry gets drier, wet gets wetter” pattern, as compared with 9.5% of global land area with the opposite pattern, that is, “dry gets wetter, and wet gets drier”. Feng et al. [53]. examined the global moisture trends using satellite soil moisture for the past 35 years (1979–2013) and their results supported those of Greve et al.
In our study, however, the results may differ from those of Greve et al. and Feng et al. However, the results of this study are consistent with results that have been published in other journals [54,55,56]. It may be caused by the following reasons: First, the time series of our study is only 10 years as compared with the results of Greve et al. and Feng et al. The time scale is very short, so the results can only reflect the changes of the past 10 years. Secondly, Ding et al. [57,58] believe that the summer monsoon in East Asia will be strengthened in this century. In the future, the monsoon rainfall belt in this region will be pushed northward, which will change the current climate pattern of flood in the south and drought in the north. Therefore, the drought in summer would be reduced in the Jing-Jin-Ji region.
Through the above analysis, a longer time series and multivariate dataset are the indispensable research basis for accurately analyzing the drought trends in the Jing-Jin-Ji region, which is the next step of research focus and direction.

4. Conclusions

(i) On the basis of the regression method, the VCI, TCI, and PCI were utilized to calculate the CDIR index that better monitored the occurrence and development of drought. The CDIR comprehensively considered land surface temperature, vegetation growth status, and meteorological precipitation in the drought process, and it was found to be capable of monitoring the drought. In this study, historical drought that occurred from 2007 to 2016 in the Jing-Jin-Ji region was monitored by the module described above and its results were consistent with the actual occurrence of drought in the past decade.
(ii) In order to validate the accuracy of the CDIR, the SPI-3, drought-affected crop area and standardized unit yield of crop data were utilized to analyze correlation relationships with the CDIR. The relationships between CDIR and SPI-3, drought-affected crop area, and standardized unit yield of crop were significant, indicating that the comprehensive drought monitoring model was applicable for drought monitoring.
(iii) Although the model has taken into account the factors such as vegetation growth and atmospheric precipitation, drought is still a complex natural phenomenon. Therefore, in order to study drought events better and to monitor drought conditions more accurately, it would be better to involve other relative factors, such as the soil type, land use, change of vegetation phenology, geomorphology, and the human activities in the next research.

Author Contributions

H.Y. wrote the manuscript text and contributed to the graphics; L.L., Y.L., and J.L. provided important advice on the manuscript and contributed to the revision of the results analysis.

Funding

This research was supported by the National Key Research and Development Plan: Factors Identification of Water Resources Carrying Risk and its Mechanism [NO. 2016YFC0401307]; and the Demand Management of Water Resources and Development Layout in Beijing-Tianjin-Hebei Region [NO. 2016YFC0401402].

Conflicts of Interest

The authors declare that there is no conflict of interest regarding the publication of this paper.

References

  1. World Meteorological Organization. Report on Drought and Countries Affected by Drought During 1974–1985; WMO: Geneva, Switzerland, 1986. [Google Scholar]
  2. Paulo, A.A.; Pereira, L.S. Drought Concepts and Characterization. Water Int. 2006, 31, 37–49. [Google Scholar] [CrossRef]
  3. Liu, X.F.; Zhu, X.F.; Pan, Y.Z.; Bai, J.J.; Li, S.S. Performance of different drought indices for agriculture drought in the North China Plain. J. Arid Land 2018, 10, 507–516. [Google Scholar] [CrossRef] [Green Version]
  4. Wang, H. Several thoughts on comprehensively coping with drought in China. China Water Res. 2010, 8, 4–6. (In Chinese) [Google Scholar]
  5. Hao, Z.C.; AghaKouchak, A. Multivariate Standardized Drought Index: A parametric multi-index model. Adv. Water Resour. 2013, 57, 12–18. [Google Scholar] [CrossRef] [Green Version]
  6. Hao, Z.C.; AghaKouchak, A. A Nonparametric Multivariate Multi-Index Drought Monitoring Framework. J. Hydrometeorol. 2014, 15, 89–101. [Google Scholar] [CrossRef]
  7. Ganguli, P.; Kumar, D.; Ganguly, A.R. US Power Production at Risk from Water Stress in a Changing Climate. Sci. Rep. UK 2017, 7, 11983. [Google Scholar] [CrossRef] [Green Version]
  8. Heim, R.R., Jr. A review of twentieth-century drought indices used in the United States. Bull. Am. Meteorol. Soc. 2002, 83, 1149–1165. [Google Scholar] [CrossRef]
  9. Heim, R.R., Jr.; Brewer, M.J. The Global Drought Monitor Portal: The Foundation for a Global Drought Information System. Earth Interact. 2012, 16, 1–28. [Google Scholar] [CrossRef]
  10. Zhang, Y.; Peng, C.H.; Li, W.Z.; Fang, X.Q.; Zhang, T.L.; Zhu, Q.A.; Chen, H.; Zhao, P.X. Monitoring and estimating drought-induced impacts on forest structure, growth, function, and ecosystem services using remote-sensing data: Recent progress and future challenges. Environ. Rev. 2013, 21, 103–115. [Google Scholar] [CrossRef]
  11. Liu, X.F.; Zhu, X.F.; Pan, Y.Z.; Li, S.S.; Liu, Y.X.; Ma, Y.Q. Agricultural drought monitoring: Progress, challenges, and prospects. J. Geogr. Sci. 2016, 26, 750–767. [Google Scholar] [CrossRef] [Green Version]
  12. Du, L.T.; Tian, Q.J.; Yu, T.; Meng, Q.Y.; Jancso, T.; Udvardy, P.; Huang, Y. A comprehensive drought monitoring method integrating MODIS and TRMM data. Int. J. Appl. Earth Obs. 2013, 23, 245–253. [Google Scholar] [CrossRef]
  13. Palmer, W.C. Meteorological Drought; U.S. Department of Commerce: Washington, DC, USA, 1965.
  14. McKee, T.B.; Doesken, N.J.; Kleist, J. The relationship of drought frequency and duration to time scales. In Proceedings of the 8th Conference on Applied Climatology, Anaheim, CA, USA, 17–22 January 1993. [Google Scholar]
  15. The Standardization Administration of China. National Standard of People’s Republic of China GB/T 20481-2006. The Grade of Meteorological Drought; China Standard Press: Beijing, China, 2006. (In Chinese)
  16. Zhang, T.F.; Zhang, B.; Wang, Y.H.; Liu, X.L.; An, M.L.; Zhang, J.X. Drought characteristics in the Shit yang river basin during the recently 50 years based on composite index. Acta Ecol. Sin. 2013, 33, 975–984. (In Chinese) [Google Scholar] [CrossRef]
  17. Bannari, A.; Morin, D.; Bonn, F.; Huete, A.R. A review of vegetation indices. Remote Sens. Rev. 1995, 13, 95–120. [Google Scholar] [CrossRef]
  18. Kogan, F.N. Application of vegetation index and brightness temperature for drought detection. Adv. Space Res. 1995, 15, 91–100. [Google Scholar] [CrossRef]
  19. Kogan, F.N. Droughts of the late 1980s in the United States as derived from NOAA polar-orbiting satellite data. Bull. Am. Meteorol. Soc. 1995, 76, 655–668. [Google Scholar] [CrossRef]
  20. Karnieli, A.; Bayasgalan, M.; Bayarjargal, Y.; Agam, N.; Khudulmur, S.; Tucker, C.J. Comments on the use of the vegetation health index over mongolia. Int. J. Remote Sens. 2006, 27, 2017–2024. [Google Scholar] [CrossRef]
  21. Gao, M.F.; Qin, Z.H.; Zhang, H.O. Remote Sensing of Agro-droughts in Guangdong Province of China Using MODIS Satellite Data. Sensors 2008, 8, 4687–4708. [Google Scholar] [CrossRef] [PubMed]
  22. Sandholt, I.; Rasmussen, K.; Andersen, J. A simple interpretation of the surface temperature—Vegetation index space for assessment of surface moisture status. Remote Sens. Environ. 2002, 79, 213–224. [Google Scholar] [CrossRef]
  23. Patel, N.R.; Parida, B.R.; Venus, V.; Saha, S.K.; Dadhwal, V.K. Analysis of agricultural drought using vegetation temperature condition index (VTCI) from Terra/MODIS satellite data. Environ. Monit. Assess. 2012, 184, 7153–7163. [Google Scholar] [CrossRef]
  24. Theon, J.S. The Tropical Rainfall Measuring Mission (TRMM). Adv. Space Res. 1994, 14, 159–165. [Google Scholar] [CrossRef]
  25. Wu, Y.N.; Chen, J.S. Food safety monitoring and surveillance in China: Past, present and future. Food Control 2018, 90, 429–439. [Google Scholar] [CrossRef]
  26. Zhao, H.Y.; Gao, G.; An, W.; Zou, X.K.; Li, H.T.; Hou, M.T. Timescale differences between SC-PDSI and SPEI for drought monitoring in china. Phys. Chem. Earth 2015, 102, 48–58. [Google Scholar] [CrossRef]
  27. Liu, L.; Liao, J.; Chen, X.; Zhou, G.; Su, Y.; Xiang, Z.; Wang, Z.; Liu, X.; Li, Y.; Wu, J. The Microwave Temperature Vegetation Drought Index (MTVDI) based on AMSR-E brightness temperatures for long-term drought assessment across China (2003–2010). Remote Sens. Environ. 2017, 199, 302–320. [Google Scholar] [CrossRef]
  28. Wang, S.S.; Mo, X.G.; Hu, S.; Liu, S.X.; Liu, Z.J. Assessment of droughts and wheat yield loss on the North China Plain with an aggregate drought index (ADI) approach. Ecol. Indic. 2018, 87, 107–116. [Google Scholar] [CrossRef]
  29. Zhang, J.; Sun, F.B.; Liu, W.B.; Liu, J.H.; Wang, H. Spatio-temporal patterns of drought evolution over the Beijing-Tianjin-Hebei region, China. J. Geogr. Sci. 2019, 29, 863–876. [Google Scholar] [Green Version]
  30. Miao, Z.W.; Xu, L.G.; Han, H.L. Climate evolution characteristics of Beijing-Tianjin-Hebei Region for the last 55 years. South North Water Transf. Water Sci. Technol. 2018, 16, 125–134. (In Chinese) [Google Scholar]
  31. Gallo, K.; Ji, L.; Reed, B.; Eidenshink, J.; Dwyer, J. Multi-platform comparisons of MODIS and AVHRR normalized difference vegetation index data. Remote Sens. Environ. 2005, 99, 221–231. [Google Scholar] [CrossRef] [Green Version]
  32. Tucker, C.J. History of the Use of AVHRR Data for Land Applications. In Advances in the Use of NOAA AVHRR Data for Land Applications; Springer: Dordrecht, The Netherlands, 1996. [Google Scholar]
  33. Carlson, T.N.; Ripley, D.A. On the relation between NDVI, fractional vegetation cover, and leaf area index. Remote Sens. Environ. 1997, 62, 241–252. [Google Scholar] [CrossRef]
  34. Level 1 and Atmosphere Archive and Distribution System Distributed Active Archive Center (LAADS DAAC). Available online: https://ladsweb.modaps.eosdis.nasa.gov/ (accessed on 7 November 2017).
  35. Wan, Z.; Dozier, J. A generalized split-window algorithm for retrieving landsurface temperature from space. IEEE Trans. Geosci. Remote Sens. 1996, 34, 892–905. [Google Scholar]
  36. Zeng, H.W.; Li, L.J.; Li, J.Y. The evaluation of TRMM Multisatellite Precipitation Analysis (TMPA) in drought monitoring in the Lancang River Basin. J. Geogr. Sci. 2012, 22, 273–282. [Google Scholar] [CrossRef] [Green Version]
  37. Goddard Earth Sciences Data and Information Services Center (GES-DISC). Available online: https://earthdata.nasa.gov/about/daacs/gesdisc (accessed on 10 October 2017).
  38. China National Meteorological Information Center. Available online: https://data.cma.cn/ (accessed on 7 November 2017).
  39. National Bureau of Statistics of China. Available online: http://www.stats.gov.cn/ (accessed on 15 November 2017).
  40. Kogan, F.N. Global drought watch from space. Bull. Am. Meteorol. Soc. 1997, 78, 621–636. [Google Scholar] [CrossRef]
  41. Pereia, A.R.; Pruitt, W.O. A daptation of the Thornthwaite scheme for estimating daily reference evapotranspiration. Agric. Water Manag. 2004, 66, 251–257. [Google Scholar] [CrossRef]
  42. Trajkoric, S. Temperature-based approaches for estimating reference evapotranspiration. J. Irrig. Drain. Eng. 2005, 131, 316–325. [Google Scholar] [CrossRef]
  43. Chen, H.P.; Sun, J.Q. Changes in Drought Characteristics over China Using the Standardized Precipitation Evapotranspiration Index. J. Clim. 2015, 28, 5430–5447. [Google Scholar] [CrossRef]
  44. Ma, Z.G.; Fu, C.B. Interannual characteristics of the surface hydrological variables over the arid and semi-arid areas of northern China. Glob. Planet. Chang. 2003, 37, 189–200. [Google Scholar] [CrossRef]
  45. Zhao, D.S.; Zheng, D.; Wu, S.H.; Wu, Z.F. Climate Changes in Northeastern China During Last Four Decades. Chin. Geogr. Sci. 2007, 17, 317–324. [Google Scholar] [CrossRef]
  46. Ghebrezgabher, M.G.; Yang, T.B.; Yang, X.M. Long-Term Trend of Climate Change and Drought Assessment in the Horn of Africa. Adv. Meteorol. 2016, 2016, 8057641. [Google Scholar] [CrossRef]
  47. Ülker, G.B. Trend analysis of precipitation and drought in the aegean region, turkey. Meteorol. Appl. 2017, 24, 239–249. [Google Scholar]
  48. Wu, J.F.; Liu, Z.Y.; Yao, H.X.; Chen, X.H.; Chen, X.W.; Zheng, Y.H.; He, Y.H. Impacts of reservoir operations on multi-scale correlations between hydrological drought and meteorological drought. J. Hydrol. 2018, 563, 726–736. [Google Scholar] [CrossRef]
  49. Yao, J.Q.; Zhao, Y.; Chen, Y.N.; Yu, X.J.; Zhang, R.B. Multi-scale assessments of droughts: A case study in Xinjiang, China. Sci. Total Environ. 2018, 630, 444–452. [Google Scholar] [CrossRef]
  50. Ji, T.; Li, G.; Yang, H.; Liu, R.; He, T. Comprehensive drought index as an indicator for use in drought monitoring integrating multi-source remote sensing data: A case study covering the sichuan-chongqing region. Int. J. Remote Sens. 2018, 39, 786–809. [Google Scholar] [CrossRef]
  51. 2016th Climate Bulletin of Hebei Province, China. Available online: http://he.cma.gov.cn/ (accessed on 15 November 2017).
  52. Greve, P.; Orlowsky, B.; Mueller, B.; Sheffield, J.; Reichstein, M.; Seneviratne, S.I. Global assessment of trends in wetting and drying over land. Nat. Geosci. 2014, 7, 716–721. [Google Scholar] [CrossRef]
  53. Feng, H.H.; Zhang, M.Y. Global land moisture trends: Drier in dry and wetter in wet over land. Sci. Rep. UK 2015, 5, 18018. [Google Scholar] [CrossRef] [PubMed]
  54. Qin, Y.; Yang, D.W.; Lei, H.M.; Xu, K.; Xu, X.Y. Comparative analysis of drought based on precipitation and soil moisture indices in Haihe basin of North China during the period of 1960–2010. J. Hydrol. 2015, 526, 55–67. [Google Scholar] [CrossRef]
  55. He, J.; Yang, X.H.; Li, J.Q.; Jin, J.L.; Wei, Y.M.; Chen, X.J. Spatiotemporal variation of meteorological droughts based on the daily comprehensive drought index in the Haihe River basin, China. Nat. Hazards 2015, 75, 199–217. [Google Scholar] [CrossRef]
  56. Miao, Z.W.; Xu, L.G.; Lu, M. Analysis of Drought Characters Based on SPEI Index in Beijing-Tianjin-Hebei Region. Yellow River 2018, 40, 51–57. (In Chinese) [Google Scholar]
  57. Ding, Y.H.; Wang, Z.Y.; Sun, Y. Inter-decadal variation of the summer precipitation in East China and its association with decreasing Asian summer monsoon. Part I: Observed evidences. Int. J. Climatol. 2008, 28, 1139–1161. [Google Scholar] [CrossRef]
  58. Ding, Y.H.; Sun, Y.; Wang, Z.Y.; Zhu, Y.X.; Song, Y.F. Inter-decadal variation of the summer precipitation in China and its association with decreasing Asian summer monsoon Part II: Possible causes. Int. J. Climatol. 2009, 29, 1926–1944. [Google Scholar] [CrossRef]
Figure 1. Location of the study area and of the meteorological stations.
Water 11 01077 g001
Figure 2. A framework for building a comprehensive drought model.
Water 11 01077 g002
Figure 3. Scatter plots and goodness-of-fit between CDIR and CI in main crops growing period (March–October) from 2007 to 2016.
Water 11 01077 g003
Figure 4. Drought distribution of the Jing-Jin-Ji region in 2016 monitored by the CDIR index. (a) March, (b) April, (c) May, (d) June, and (e) July.
Water 11 01077 g004
Figure 5. Histogram plot of CDIR of the Jing-Jin-Ji region in crop (winter wheat and maize) growing period (April–October) from 2007 to 2016.
Water 11 01077 g005
Figure 6. Scatter plots and correlation coefficient of R values between CDIR and SPI-3 index in each month from 2007 to 2016.
Water 11 01077 g006
Figure 7. Scatter plots and correlation coefficient of R between VCI, TCI, and CDIR and the drought-affected crop area from 2007 to 2016.
Water 11 01077 g007
Figure 8. Scatter plots and correlation coefficient of R between accumulative CDIR and standardized unit yield of crop in the growing period (March–October) from 2007 to 2016.
Water 11 01077 g008
Figure 9. Linear trends of CDIR in four seasons.
Water 11 01077 g009
Table 1. Interannual variation of climatic factors in the Jing-Jin-Ji region from 1961 to 2015.
ItemTemperaturePrecipitationSunshine HoursRelative HumidityWind Speed
Average value10.43508.712635.6958.472.29
Maximum value11.73789.363068.868.502.94
The year in which the maximum occurred19981964196519641969
minimum value8.75346.252262.754.081.80
The year in which the minimum occurred19691999200320052003
Variation coefficient0.070.180.070.040.12
Annotation: The units of temperature, precipitation, sunshine hours, relative humidity, and wind speed are Celsius (°C), millimeters (mm), hours (h), percentages (%) and meters per second (m/s), respectively.
Table 2. Drought classification for CDIR.
Drought ClassExtreme DroughtSevere DroughtModerate DroughtMild DroughtNo Drought
CDIR<−2−2 ≤ CDIR < −1−1 ≤ CDIR < 00 ≤ CDIR < 1≥1
Table 3. Statistical characteristics of linear regression slope in four seasons.
SeasonK ValueTrends of CDIRTrends of DroughtArea (103 km2)Proportion (%)
Spring<0199.2793.12
0--4.582.14
>010.144.74
Summer<033.0615.45
0--4.392.05
>0176.5482.5
Autumn<0102.1647.74
0--4.522.11
>0107.3150.15
Winter<0175.8182.16
0--4.542.12
>033.6415.72
Annotation: the symbol “↑” indicates that the index is increasing, the symbol “↓” indicates that the index is decreasing, the symbol “-” indicates that the index remains unchanged.

