Hydrological Modelling and Water Resources Assessment of Chongwe River Catchment using WEAP Model


Abstract
1. Introduction
1.1. Background
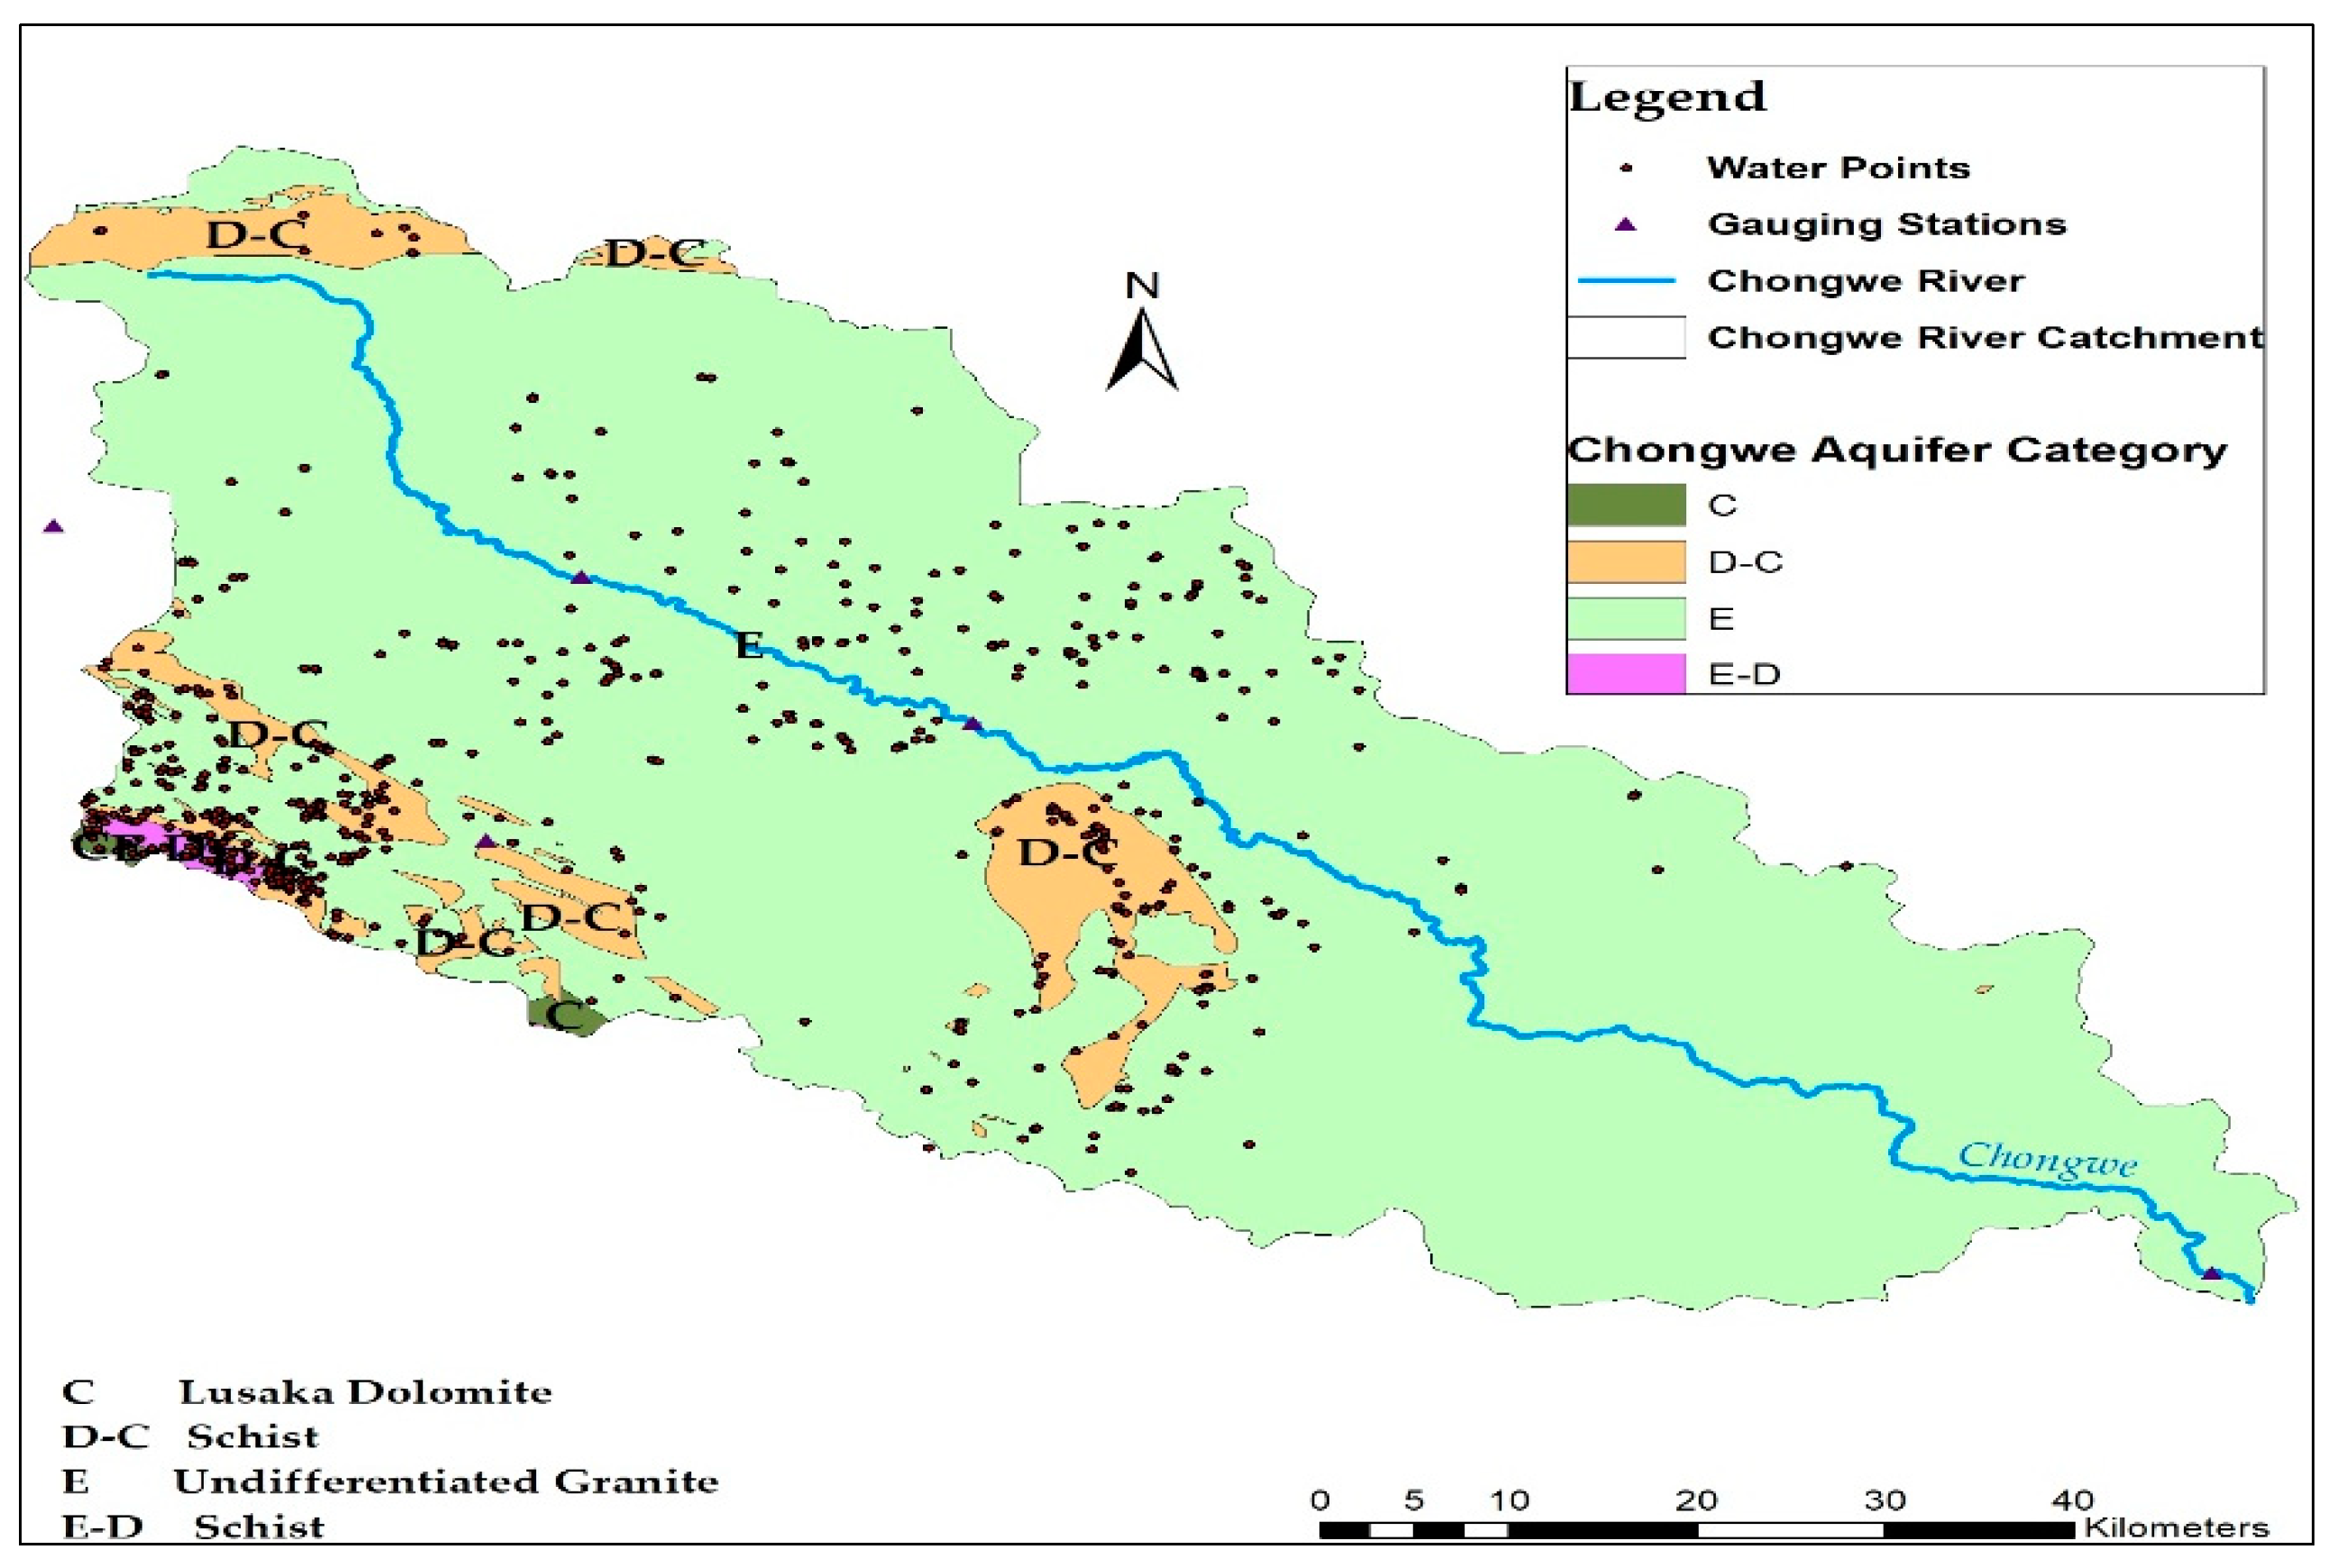
1.2. Study Area
2. Data and Methods
2.1. WEAP Modelling
2.2. Water Balance Computation
2.3. WEAP Model Data Inputs
2.3.1. Climate and Physical Data
2.3.2. Hydrologic Data
2.4. Schematization of Chongwe River Catchment in the WEAP Model
2.5. WEAP Model Performance
2.6. Field Survey and Observations
3. Results and Discussion
3.1. Results
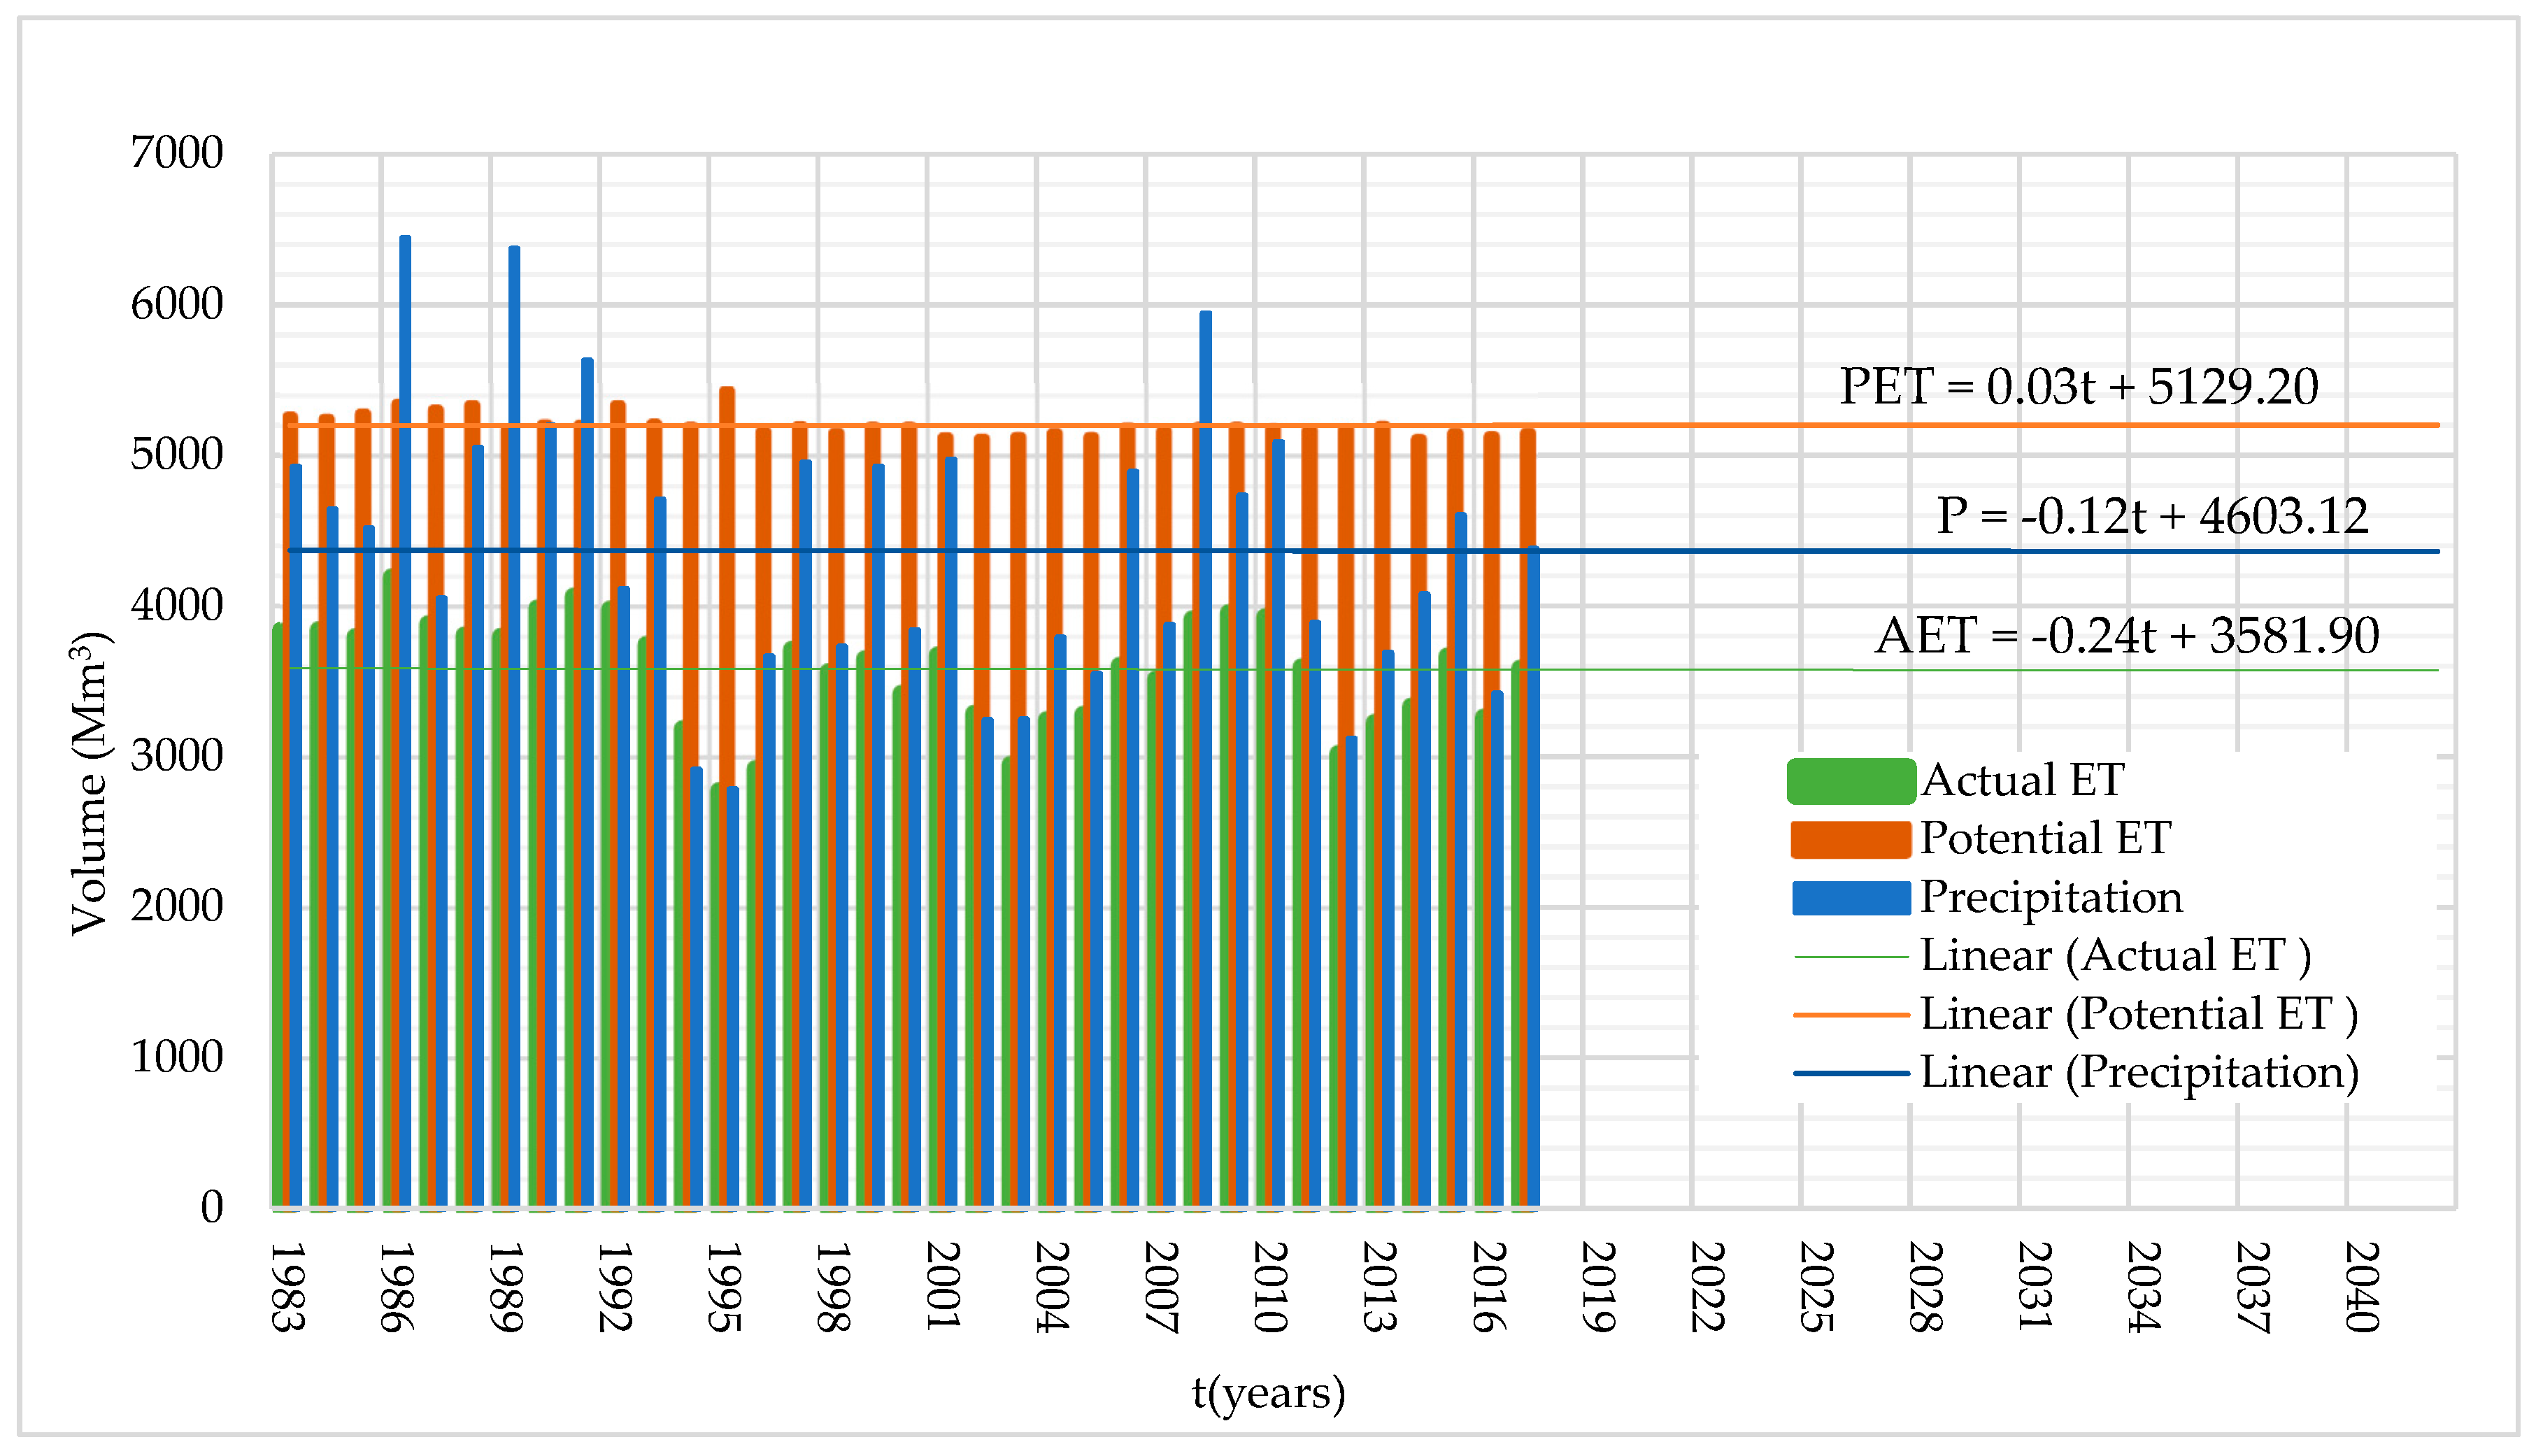
3.1.1. Evapotranspiration
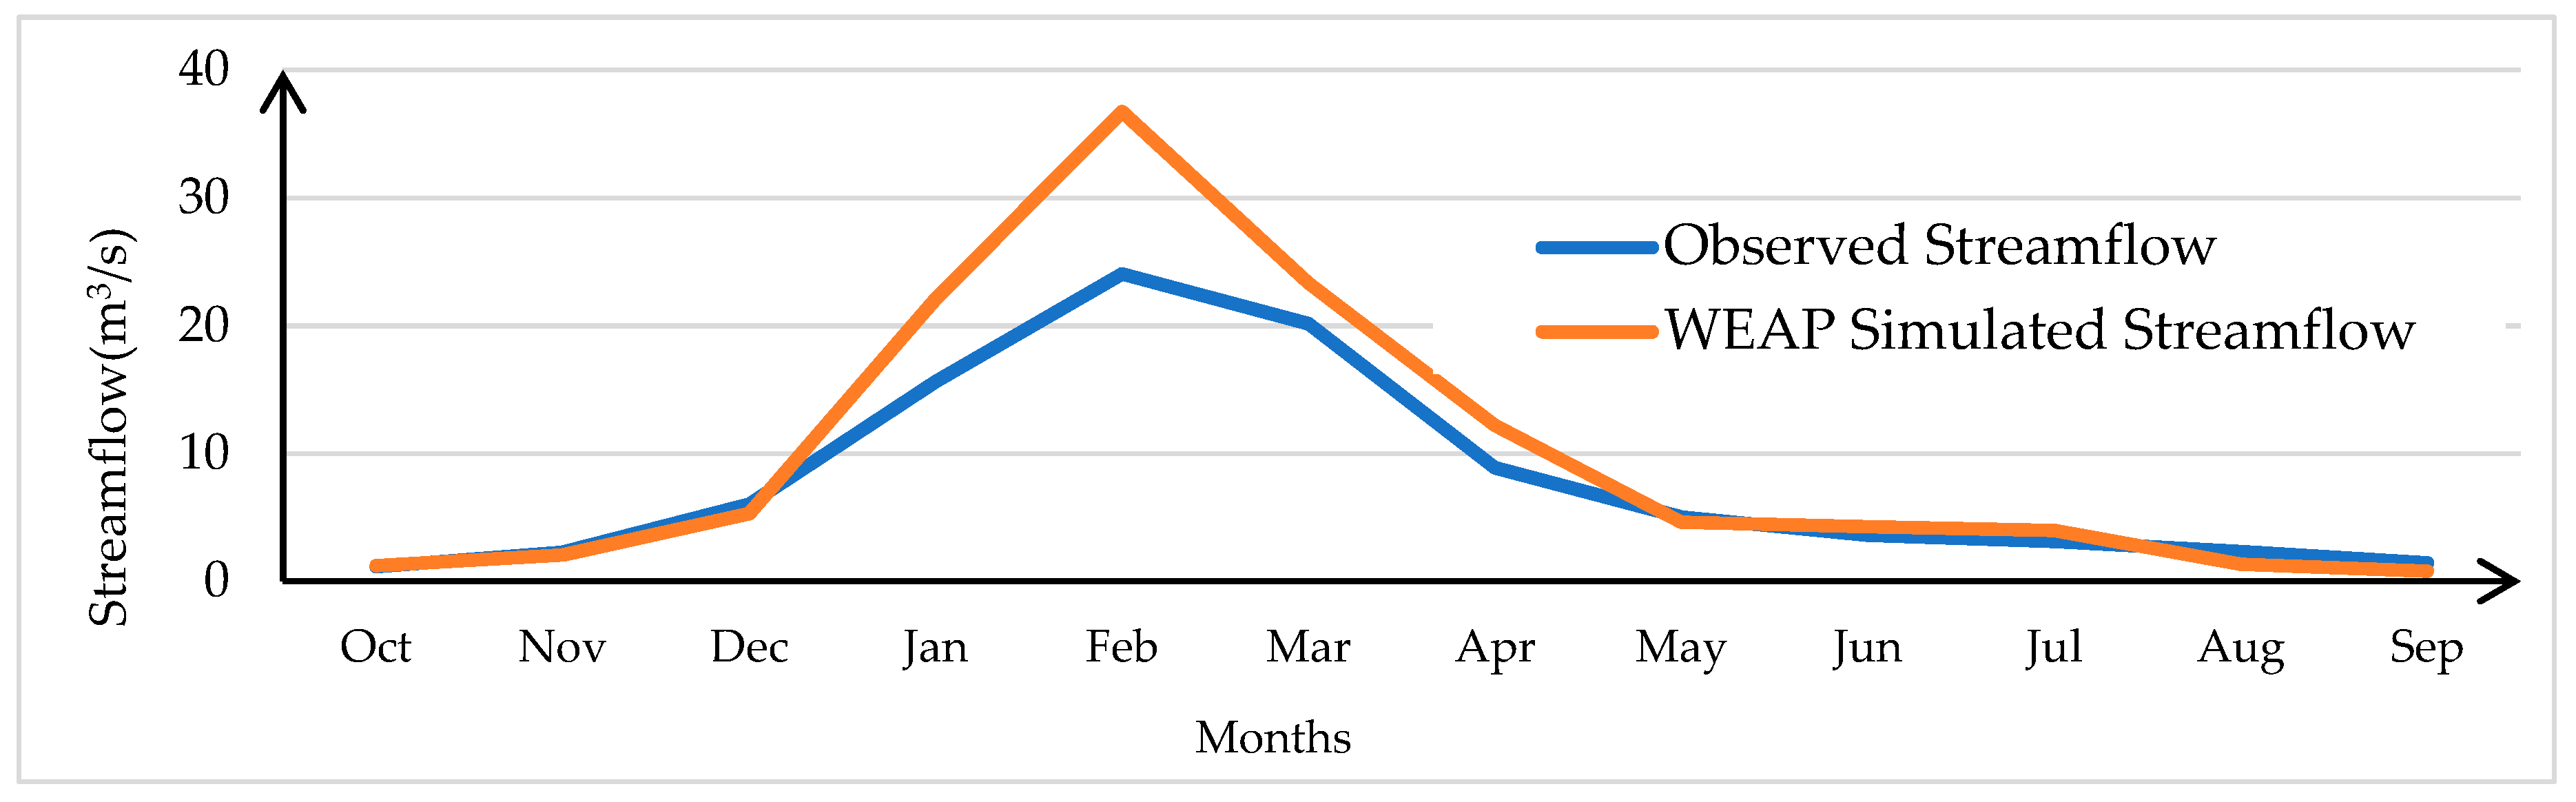
3.1.2. Streamflow and Baseflow at the Outlet
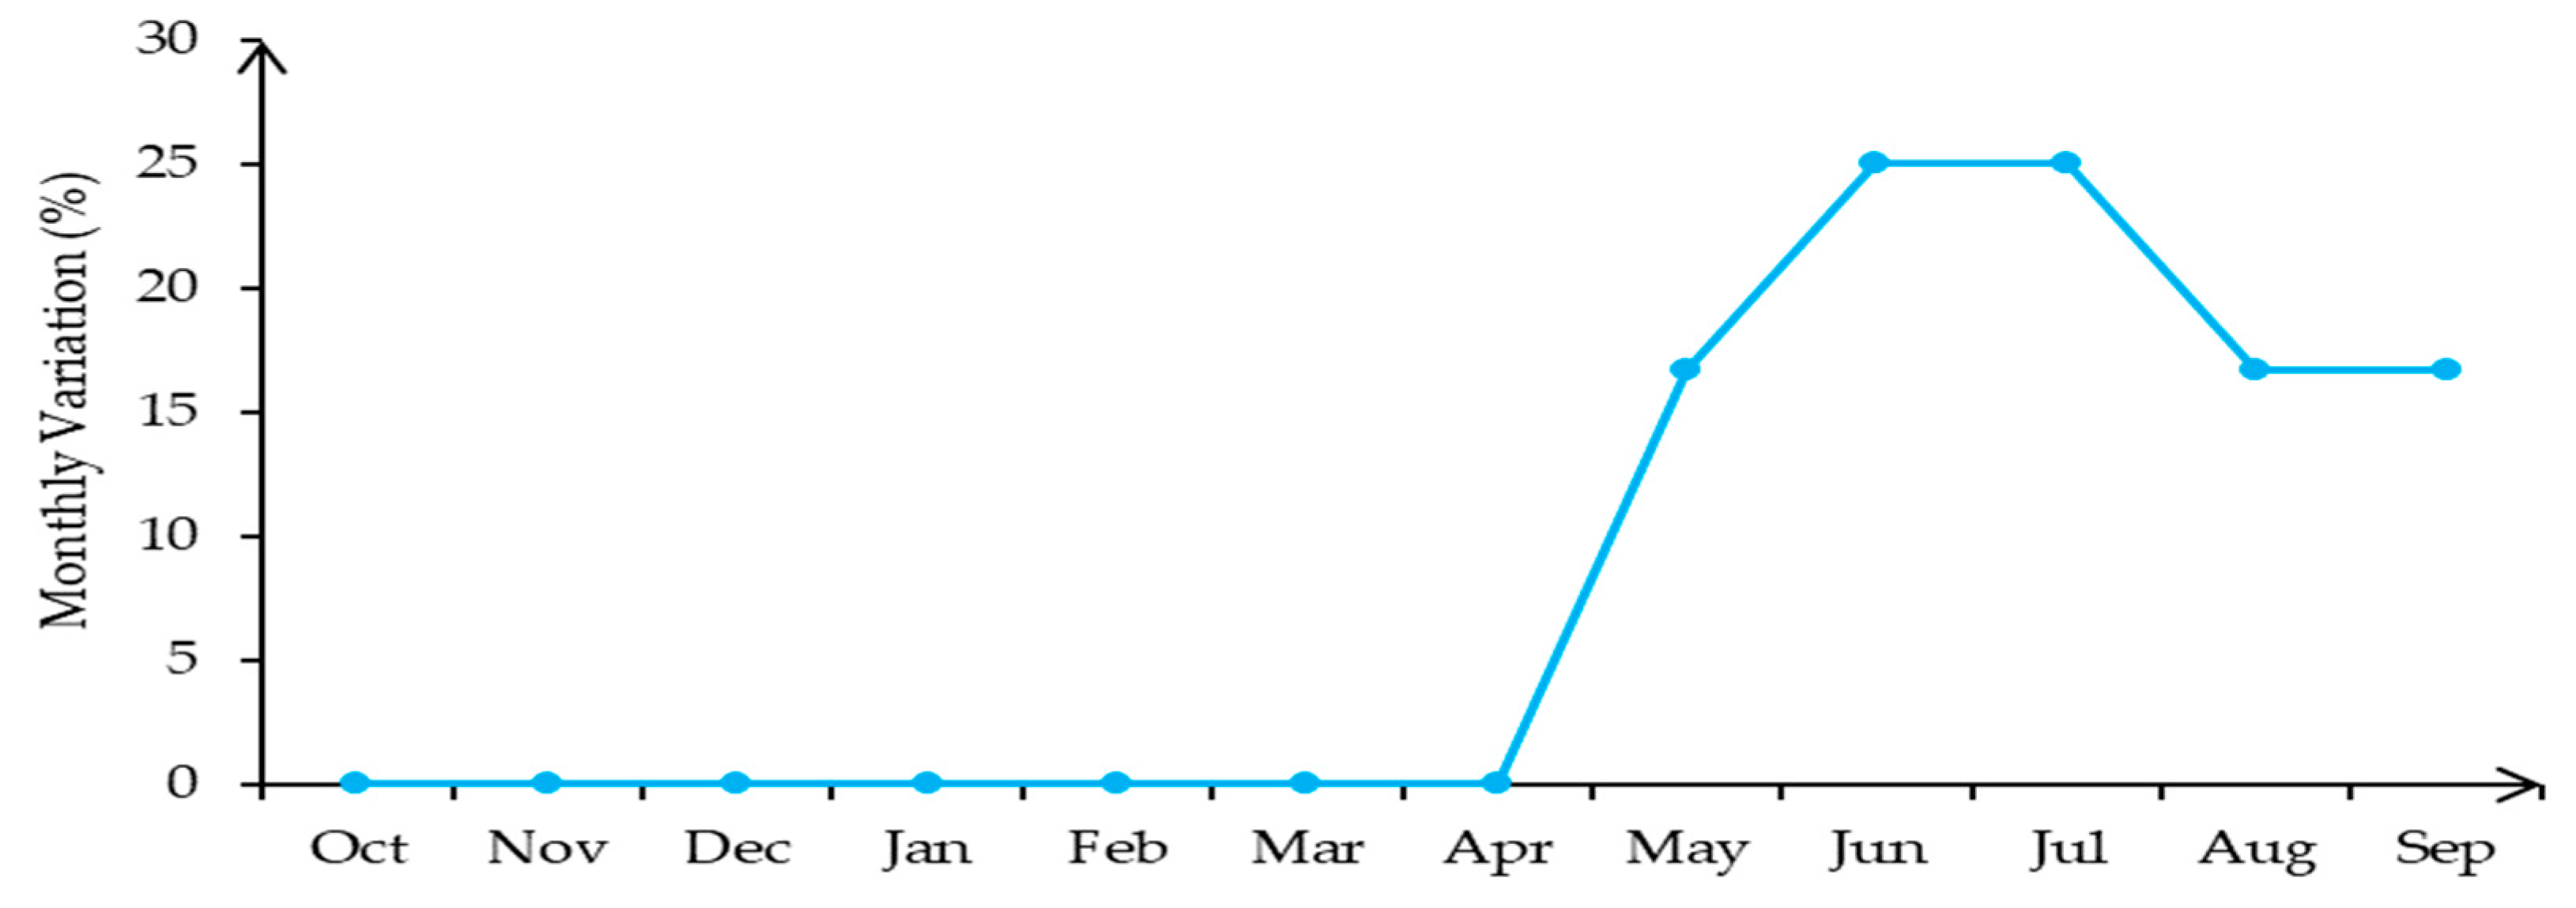
3.1.3. Water Abstractions
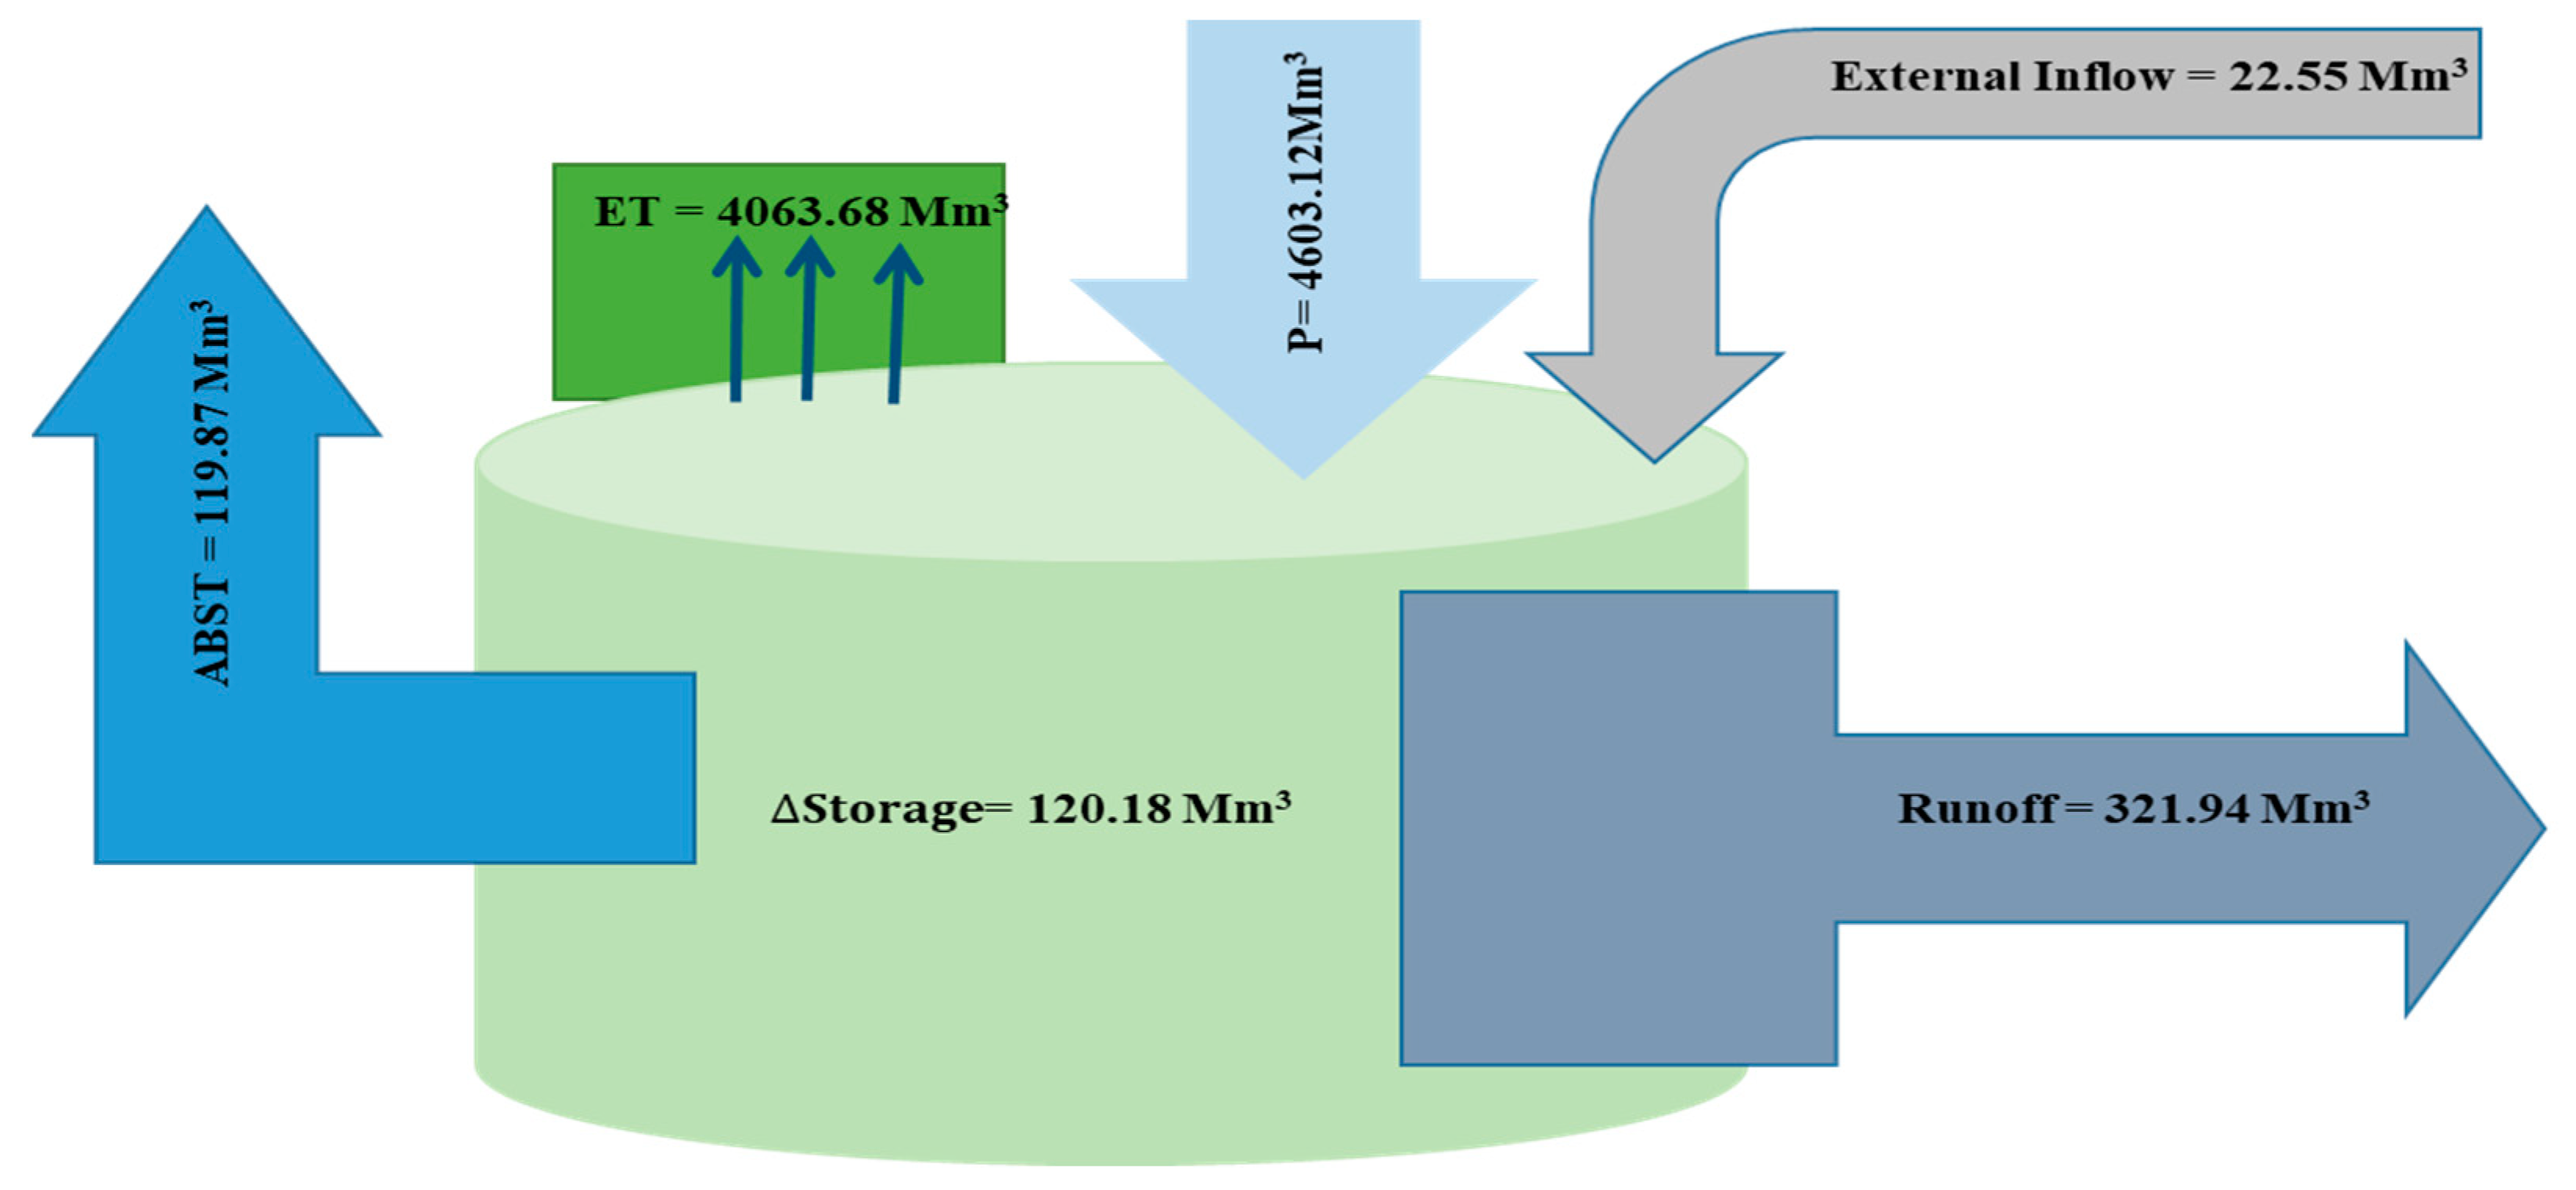
3.1.4. Summary of the Hydrological Water Balance
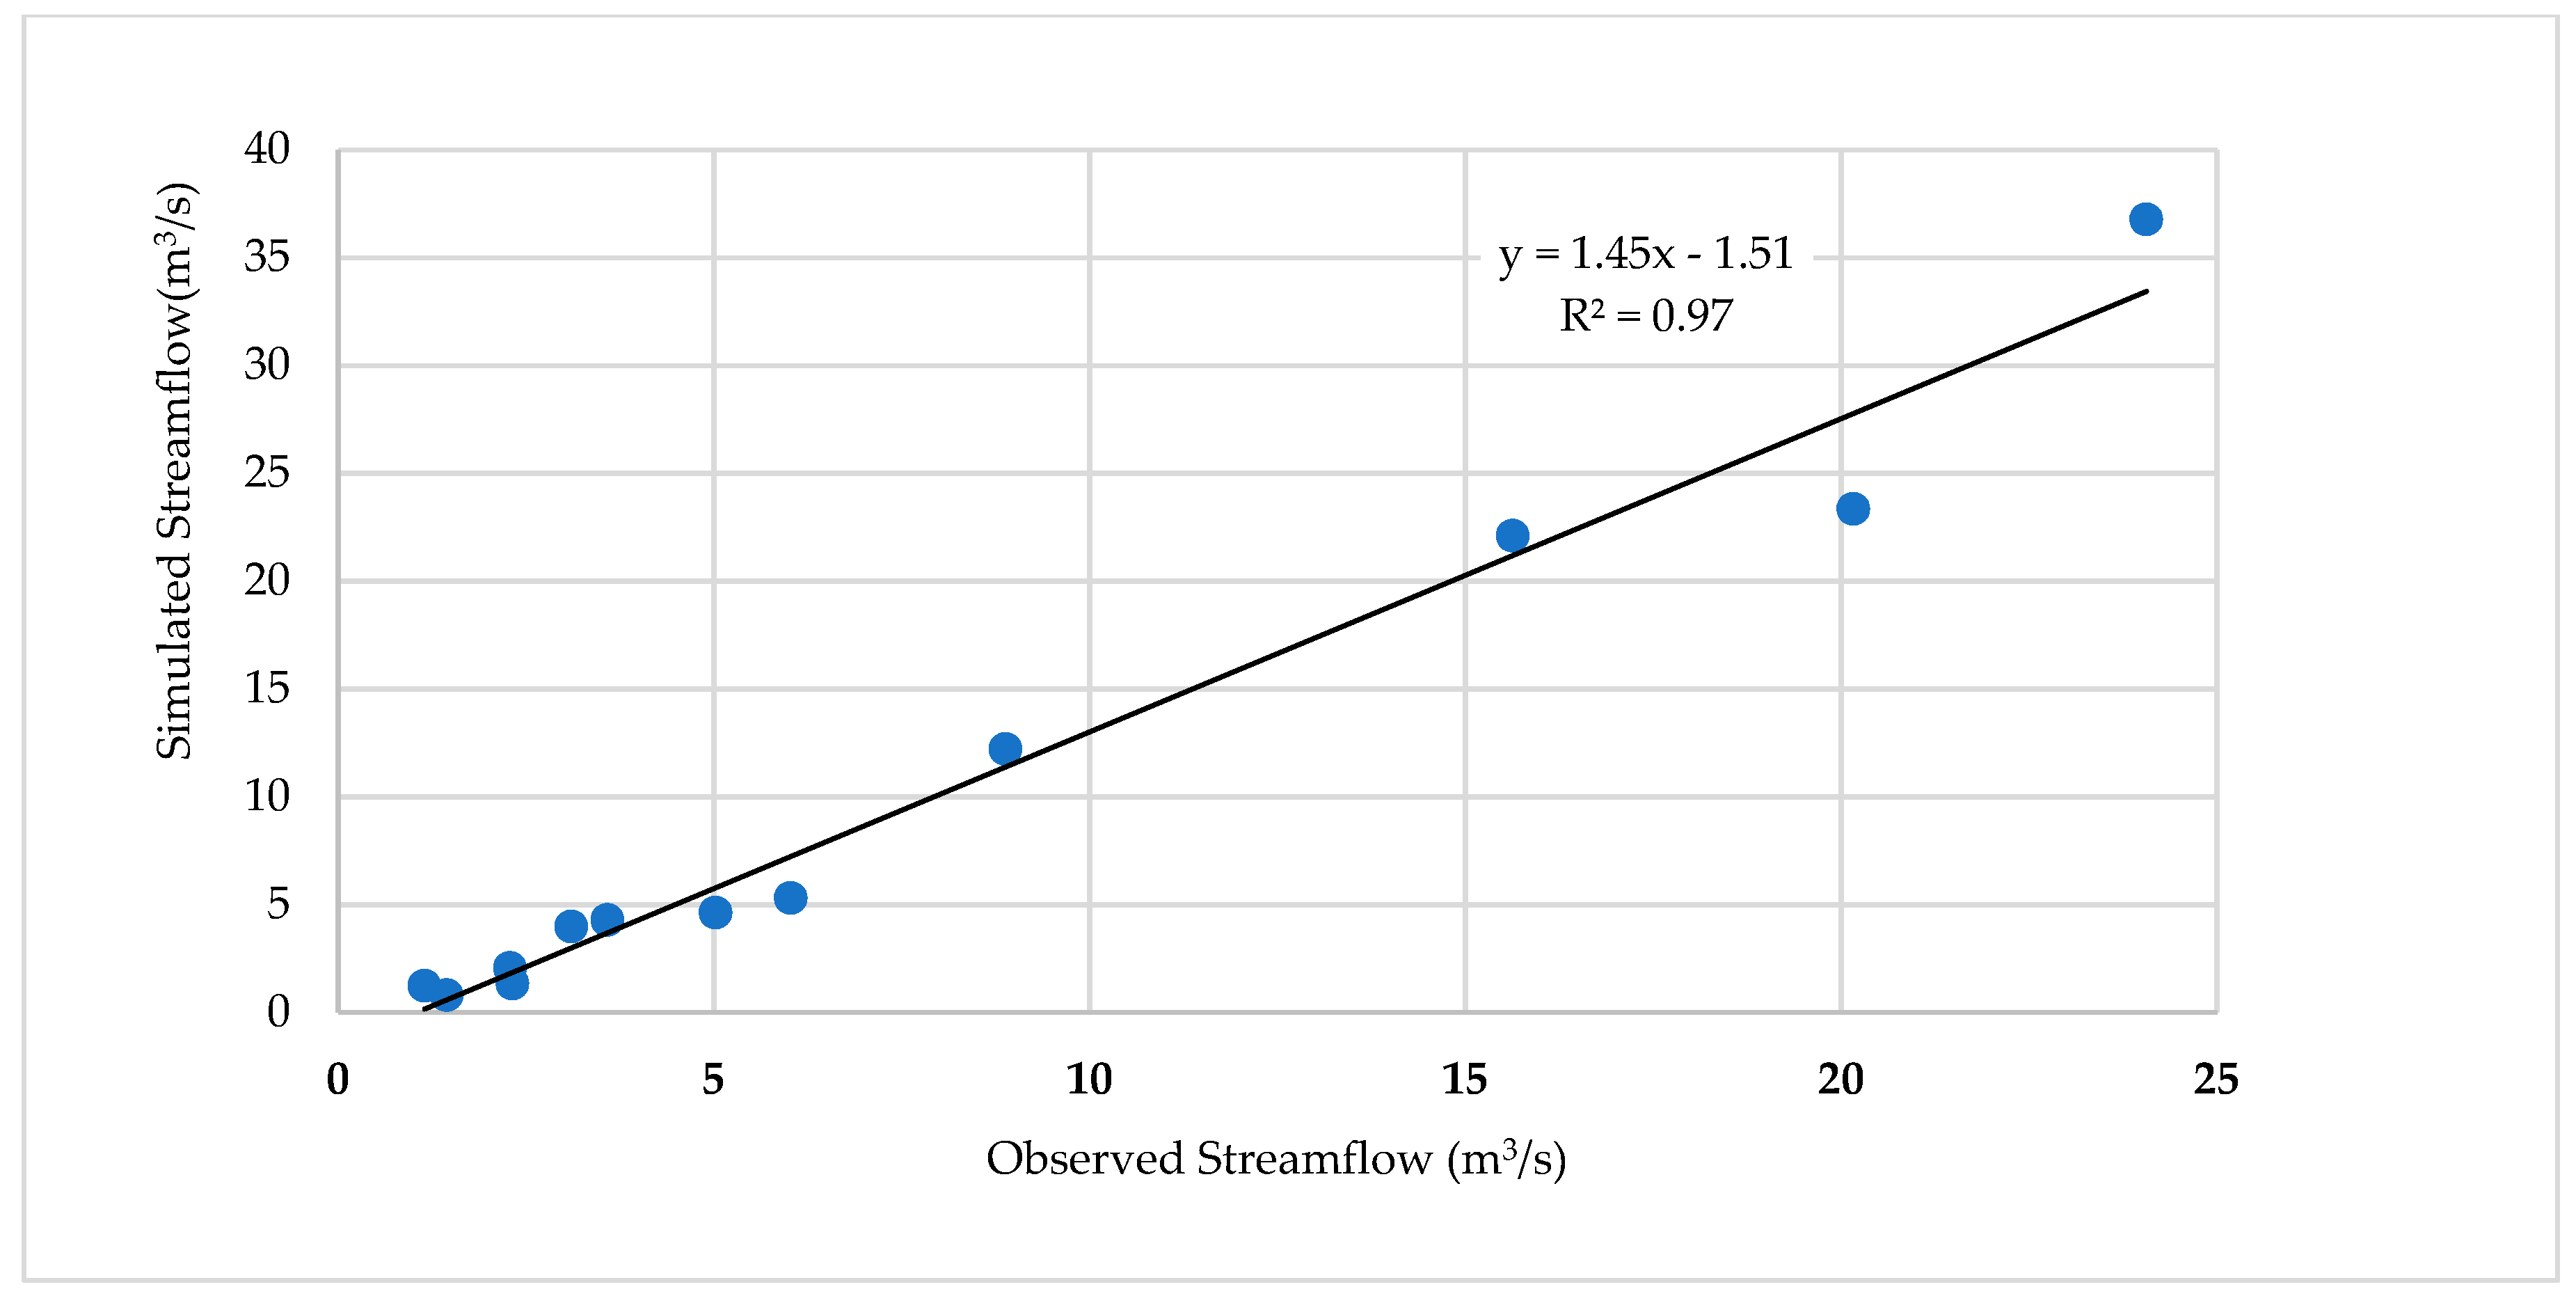
3.1.5. Model Performance
3.2. Discussion
Hydrological Water Balance for Chongwe River Catchment and Its Components
4. Conclusion and Recommendations
4.1. Conclusions
4.2. Recommendations
Supplementary Materials
Author Contributions
Funding
Conflicts of Interest
Abbreviations
| BGR | Bundesanstalt für Geowissenschaften und Rohstoffe/Federal Institute for Geosciences and Natural Resources/Germany |
| CSO | Central Statistics Office |
| CRC | Chongwe River Catchment |
| DEM | Digital Elevation Model |
| ET | Evapotranspiration |
| GIS | Geographical Information System |
| GReSP | Groundwater Resources Management Support Programme |
| GW | Groundwater |
| LWSC | Lusaka Water and Sewerage Company |
| m3/s | Cubic meters per second |
| MEWD | Ministry of Energy and Water Development |
| Mm3 | Million Cubic Meters |
| RC | River Catchment |
| RH | Relative Humidity |
| SASSCAL | Southern African Science Service Centre for Climate Change and Adaptive Land Management |
| SEI | Stockholm Environment Institute |
| UNZA | University of Zambia |
| USGS | United State Department of Geological Survey |
| WARMA | Water Resources Management Authority |
| WEAP | “Water Evaluation And Planning” system |
| WS | Water Supply |
| WMO | World Meteorological Organization |
| WW | Wastewater |
| ZMD | Zambia Meteorological Department |
References
- WARMA. Water Resources Management Report; Water Resources Management Authority (WARMA): Lusaka, Zambia, 2015. [Google Scholar]
- MEWD. National Water Resources Report for WWDR3; Ministry of Energy and Water Development: Lusaka, Zambia, 2003.
- VeldKamp, J.W.; Muchinda, M.; Dolmotte, A.P. Agro-Climatic Zone of Zambia; Soil Survey Unit, Department of Agriculture: Lusaka, Zambia, 1984.
- MEWD. National Water Policy of Zambia; Ministry of Energy and Water Development: Lusaka, Zambia, 2010.
- YEC. Study Report on National Water Resources Master Plan in the Republic of Zambia; Japan International Cooperation Agency and Ministry of Energy and Water Development Final Report: Lusaka, Zambia, 1995; Volume 1. [Google Scholar]
- Lesolle, D. SADC Policy Paper on Climate Change: Assessing the Policy Options for SADC Member States; SADC Secretariat, Policy, Planning, Resource Mobilisation Directorate: Gaborone, Botswana, 2012. [Google Scholar]
- McSweeney, C.; New, M.; Lizcano, G. UNDP Climate Change Country Profiles: Zambia. Digital Library. Available online: https://digital.library.unt.edu/ark:/67531/metadc226759 (accessed on 26 February 2018).
- McGregor, G.R.; Ebi, K. El Niño Southern Oscillation (ENSO) & Health: An. Overview for Climate and Health Researchers. Available online: https://www.mdpi.com/2073-4433/9/7/282/htm (accessed on 15 October 2018).
- WFP. El Niño Implications and Scenarios for 2015. Available online: https://www.wfp.org/content/el-nino-implications-and-scenarios-2015-july-2015 (accessed on 7 December 2017).
- WMO. Provisional WMO Statement on the Status of the Global Climate in 2016; WMO: Geneva, Switzerland, 2017. [Google Scholar]
- Siderius, C.; Gannon, K.E.; Ndiyoi, M.; Opere, A.; Batisani, N.; Olago, D.; Pardoe, J.; Conway, D. Hydrological response and complex impact pathways of the 2015/2016 El Niño in Eastern and Southern Africa. Earth’s Future 2018, 6, 22. [Google Scholar] [CrossRef]
- CSO. 2010 Census of Population and Housing. Lusaka Province Analytical Report; Central Statistics Office (CSO): Lusaka, Zambia, 2014.
- Nick. A. The Chongwe Catchment: A Hydrological, Hydrogeological and Hydrochemical Characterisation for the Establishment of a Catchment Management Plan; Ministry of Energy and Water Development: Lusaka, Zambia, 2015.
- Lorenz, D.; Ziegeweid, J. Methods to Estimate Historical Daily Streamflow for Ungaged Stream Locations in Minnesota; U.S. Geological Survey-USGS: Reston, VA, USA, 2016.
- Struckmeyer, W.F.; Margat, J. Hydrogeological Maps—A Guide and a Standard Legend; International Association of Hydrogeologists: Hannover, Germany, 1995. [Google Scholar]
- SEI. WEAP Tutorial; Stockholm Environment Institute: Stockholm, Sweden, 2016. [Google Scholar]
- Metobwa, O.G.M.; Mourad, K.A.; Ribbe, L. Water Demand Simulation Using WEAP21: A case of the Mara River Basin, Kenya. Int. J. Nat. Res. Ecol. Manag. 2018, 3, 9–18. [Google Scholar]
- Psomasa, A.; Panagopoulosa, Y.; Konstaa, D.; Mimikoua, M. Designing water efficiency measures in a catchment in Greece using WEAP and SWAT models. Procedia Eng. 2016, 162, 269–276. [Google Scholar] [CrossRef][Green Version]
- Marcinek, J. Hydrological cycle and water balance. In Global Change: Enough Water for All?: Scientific Facts. Water in view of Natural Resources; Lozán, J.L., Ed.; Wissenschaftliche Auswertungen: Hamburg, Germany, 2007. [Google Scholar]
- Han, D. Concise Hydrology, 1st ed.; Dawi Han and Ventus Publishig Aps: Brestol, Germany, 2010. [Google Scholar]
- Bäumle, R.; Mbale, B.; Chisanga SKrekler, T. Water Balance Estimates for Chongwe and Mwembeshi Rivers in the Lusaka Region; Technical Report; Ministry of Mines, Energy and Water Development and Federal Institute for Geo Sciences and Natural Resources (BGR): Lusaka, Zambia, 2012. [Google Scholar]
- Hexagon Geospatial, Madison, United States of America. Available online: www.erdas.com (accessed on 19 November 2016).
- Esri, Redlands, California. Available online: www.esri.com (accessed on 8 February 2017).
- MOA. Exploratory Soil Map of Zambia, Scale 1:1.000.000; Ministry of Agriculture: Lusaka, Zambia, 1991.
- Lü, H.; Hou, T.; Horton, R.; Zhu, Y.; Chen, X.; Jia, Y.; Wang, W.; Fu, X. The streamflow estimation using the Xinanjiang rainfall runoff model and dual state-parameter estimation method. J. Hydrol. 2013, 480, 102–114. [Google Scholar] [CrossRef]
- Fugro Consult GmbH, Berlin, German. Available online: www.geodin.com (accessed on 15 October 2017).
- Arranz, R.; McCartney, M. Application of the Water Evaluation and Planning (WEAP) Model to Assess Future Water Demands and Resources in the Olifants Catchment, South Africa; IWMI Working Paper 116; International Water Management Institute: Colombo, Sri Lanka, 2007. [Google Scholar]
- Chisola, M.N.; Kuráž, M. Patterns and Implications of Hydrologic Regime Change in Chongwe River, zambia. J. Geogr. 2016, 8, 1–2. [Google Scholar] [CrossRef]
- LWSC. Annual Report; LWSC: Lusaka, Zambia, 2017. [Google Scholar]
- LWSC. Water Supply Investment Plan Lusaka; LWSC: Lusaka, Zambia, 2014.
- Jenkins, M.; Nick, A.; Mwelwa, D.; Simwana, T. Groundwater Resources for Lusaka and Selected Catchment Areas—Technical Report No. 1—Impact of Small Scale Farming on the Chongwe River on Land Use and Water Abstractions from Chongwe River; Water Resources Management Authority and German Federal Institute for Geoscience and Natural Resources: Lusaka, Zambia, 2015. [Google Scholar]
- Wen-Cheng, H.; Yang, F.-T. Stream Flow Estimation Using Kriging. Water Resour. Res. 1998, 34, 1599–1608. [Google Scholar]
- Mayerhofer, C.; Shamboko, B.; Mweene, R. Development of Groundwater Information and Management Program for Lusaka Groundwater Systems, Report No. 4—Survey on Commercial Farmers and Major Industries; Department of Water Affairs (Zambia) & Federal Institute of Geosciences and Natural Resources (Germany): Lusaka, Zambia, 2010. [Google Scholar]


| Name of Sub-Catchment | Area (km2) |
|---|---|
| Upper Chongwe | 1236 |
| Ngwerere | 300 |
| Kanakantapa | 485 |
| Chalimbana | 674 |
| Middle Chongwe—Luimba | 1342 |
| Lower Chongwe | 1131 |
| Climate Variable | Month | |||||||||||
|---|---|---|---|---|---|---|---|---|---|---|---|---|
| Oct | Nov | Dec | Jan | Feb | Mar | Apr | May | Jun | Jul | Aug | Sep | |
| Average Precipitation (mm) | 18 | 98 | 212 | 232 | 201 | 93 | 28 | 5 | 0 | 0 | 0 | 2 |
| Average Air Temperature (°C) | 17.8 | 17.7 | 16.6 | 14.6 | 11.4 | 8.7 | 8.2 | 10.3 | 14.1 | 17.4 | 18.2 | 18 |
| Average RH (%) | 39.34 | 52.4 | 73.4 | 83.71 | 85.7 | 82.45 | 80.14 | 69.17 | 63.91 | 58.05 | 48.1 | 39.77 |
| Average Wind Speed (m/s) | 39.34 | 52.4 | 73.4 | 83.71 | 85.7 | 82.45 | 80.14 | 69.17 | 63.91 | 58.05 | 48.1 | 39.77 |
| Cloudiness Fraction | 0.5 | 0.3 | 0.1 | 0.1 | 0.1 | 0.3 | 0.4 | 0.7 | 0.9 | 1 | 1 | 0.7 |
| 1984 | 2017 | |||
|---|---|---|---|---|
| Land Use/Land Cover Class | Area (km2) | % | Area (km2) | % |
| Irrigated agriculture | 7.54 | 0.15 | 63.76 | 1.23 |
| Rainfed farm/ranch/grass/bare land | 3269.86 | 63.26 | 3749.41 | 72.55 |
| Built-up area | 60.11 | 1.16 | 289.95 | 5.60 |
| Forest land | 1792.15 | 34.67 | 1055.44 | 20.42 |
| Water body | 39.04 | 0.76 | 10.10 | 0.19 |
| Total | 5168.66 | 5168.66 | ||
| Month | Mean Discharge Flow (m3/s) at Each Treatment Plant | ||||
|---|---|---|---|---|---|
| Machinchi | Ngwerere Ponds | Chelstone Ponds | Kaunda Square Ponds | Total | |
| Jan | 0.9469 | 0.1576 | 0.0185 | 0.0247 | 1.1477 |
| Feb | 0.8777 | 0.2075 | 0.0191 | 0.0255 | 1.1298 |
| Mar | 0.8625 | 0.1296 | 0.0133 | 0.0177 | 1.0231 |
| Apr | 0.8106 | 0.1545 | 0.0123 | 0.0164 | 0.9938 |
| May | 0.8130 | 0.0957 | 0.0093 | 0.0125 | 0.9305 |
| Jun | 0.7416 | 0.0809 | 0.0123 | 0.0164 | 0.8512 |
| Jul | 0.6783 | 0.2411 | 0.0078 | 0.0103 | 0.9375 |
| Aug | 0.7082 | 0.0984 | 0.0088 | 0.0117 | 0.8271 |
| Sep | 0.7191 | 0.1035 | 0.0082 | 0.0110 | 0.8418 |
| Oct | 0.6299 | 0.0816 | 0.0065 | 0.0086 | 0.7266 |
| Nov | 0.7699 | 0.0835 | 0.0071 | 0.0095 | 0.8700 |
| Dec | 0.7987 | 0.3045 | 0.0240 | 0.0320 | 1.1592 |
| Mean flow (m3/s) | 0.7797 | 0.1449 | 0.0123 | 0.0164 | 0.9533 |
| Months | Potential ET | Actual ET | ||
|---|---|---|---|---|
| Mm3 | mm | Mm3 | mm | |
| Oct | 697.00 | 134.85 | 270.90 | 52.41 |
| Nov | 622.03 | 120.35 | 254.53 | 49.25 |
| Dec | 509.60 | 98.59 | 302.45 | 58.52 |
| Jan | 445.08 | 86.11 | 358.70 | 69.40 |
| Feb | 401.08 | 77.60 | 372.77 | 72.12 |
| Mar | 532.49 | 103.02 | 512.48 | 99.15 |
| Apr | 481.52 | 93.16 | 445.99 | 86.29 |
| May | 483.55 | 93.55 | 411.60 | 79.63 |
| Jun | 365.56 | 70.73 | 277.95 | 53.78 |
| Jul | 419.12 | 81.09 | 281.46 | 54.46 |
| Aug | 525.70 | 101.71 | 301.40 | 58.31 |
| Sep | 579.14 | 112.05 | 273.45 | 52.91 |
| SUM | 6061.88 | 1172.81 | 4063.68 | 786.22 |
| Months | Water Supply (Mm3) | Downstream Irrigation (Mm3) | Livestock Water Use (Mm3) | Upper and Middle Catchment Areas Irrigation (Mm3) | Eco System Maintenance (Mm3) | Total Surface Water Abstraction Volume (Mm3) |
|---|---|---|---|---|---|---|
| Oct | 0.10 | 0.00 | 1.71 | 0.00 | 7.51 | 7.78 |
| Nov | 0.10 | 0.00 | 0.17 | 0.00 | 2.40 | 2.67 |
| Dec | 0.10 | 0.00 | 0.17 | 0.00 | 0.00 | 0.27 |
| Jan | 0.01 | 0.00 | 0.17 | 0.00 | 0.00 | 0.27 |
| Feb | 0.10 | 0.79 | 0.15 | 0.00 | 0.00 | 1.04 |
| Mar | 0.10 | 0.79 | 0.17 | 0.00 | 0.00 | 1.05 |
| Apr | 0.10 | 0.79 | 0.17 | 0.00 | 0.00 | 1.05 |
| May | 0.09 | 3.14 | 0.17 | 8.26 | 2.70 | 14.37 |
| Jun | 0.09 | 3.14 | 0.17 | 8.26 | 3.30 | 14.96 |
| Jul | 0.09 | 3.14 | 0.17 | 8.26 | 3.60 | 15.27 |
| Aug | 0.09 | 2.36 | 0.17 | 8.26 | 4.50 | 15.38 |
| Sep | 0.09 | 1.57 | 0.17 | 8.26 | 6.00 | 16.10 |
| Total abstraction volume (Mm3) | 1.14 | 15.71 | 2.01 | 41.31 | 30.02 | 90.21 |
| Months | Groundwater Abstraction Irrigation (Mm3) | Groundwater Abstraction Domestic and Rural Water Supply (Mm3) | Total Groundwater Abstraction Volume (Mm3) |
|---|---|---|---|
| Oct | 0.58 | 1.53 | 2.11 |
| Nov | 0.23 | 1.48 | 1.72 |
| Dec | 0.23 | 1.53 | 1.76 |
| Jan | 0.00 | 1.53 | 1.53 |
| Feb | 0.00 | 1.38 | 1.38 |
| Mar | 0.23 | 1.53 | 1.76 |
| Apr | 0.14 | 1.48 | 2.88 |
| May | 0.17 | 1.53 | 3.28 |
| Jun | 0.17 | 1.48 | 3.23 |
| Jul | 0.20 | 1.53 | 3.51 |
| Aug | 0.17 | 1.53 | 3.28 |
| Sep | 0.17 | 1.48 | 3.23 |
| Total abstraction volume (Mm3) | 11.63 | 18.04 | 29.67 |
| Year | 1983/84 | 1993/94 | 2003/04 | 2014/15 | 2016/17 |
|---|---|---|---|---|---|
| Precipitation (Mm3) | 4638.38 | 2982.02 | 4594.85 | 4611.22 | 4603.13 |
| External inflow (Mm3) | * | * | * | 22.55 | 22.55 |
| Evapotranspiration (Mm3) | 4344.83 | 3090.98 | 4098.16 | 4068.17 | 4063.68 |
| Streamflow (Mm3) | 236.59 | 216.59 | 290.01 | 459.70 | 321.94 |
| Abstractions (Mm3) | 46.09 | 56.61 | 79.32 | 112.36 | 119.87 |
| Change in storage (Mm3) | 10.87 | −382.16 | 127.36 | −6.46 | 120.18 |
© 2019 by the authors. Licensee MDPI, Basel, Switzerland. This article is an open access article distributed under the terms and conditions of the Creative Commons Attribution (CC BY) license (http://creativecommons.org/licenses/by/4.0/).
Share and Cite
Tena, T.M.; Mwaanga, P.; Nguvulu, A. Hydrological Modelling and Water Resources Assessment of Chongwe River Catchment using WEAP Model. Water 2019, 11, 839. https://doi.org/10.3390/w11040839
Tena TM, Mwaanga P, Nguvulu A. Hydrological Modelling and Water Resources Assessment of Chongwe River Catchment using WEAP Model. Water. 2019; 11(4):839. https://doi.org/10.3390/w11040839
Chicago/Turabian StyleTena, Tewodros M., Phenny Mwaanga, and Alick Nguvulu. 2019. "Hydrological Modelling and Water Resources Assessment of Chongwe River Catchment using WEAP Model" Water 11, no. 4: 839. https://doi.org/10.3390/w11040839
APA StyleTena, T. M., Mwaanga, P., & Nguvulu, A. (2019). Hydrological Modelling and Water Resources Assessment of Chongwe River Catchment using WEAP Model. Water, 11(4), 839. https://doi.org/10.3390/w11040839