Article

Evaluation of Green Roof Performance in Mitigating the Impact of Extreme Storms

Department of Civil Engineering, The University of Hong Kong, Room 6-18A, Haking Wong Building, Pokfulam, Hong Kong
*
Author to whom correspondence should be addressed.
Water 2019, 11(4), 815; https://doi.org/10.3390/w11040815
Submission received: 20 March 2019 / Revised: 14 April 2019 / Accepted: 16 April 2019 / Published: 18 April 2019
(This article belongs to the Section Urban Water Management)

Abstract

:
Green roofs are used in urban areas to mitigate the adverse effects of stormwater. Through numerical modeling, this study evaluates the impacts of design parameters on green roof hydrological performance under different rainfall characteristics. A calibrated model is run with long-term precipitation data series for three locations (Hong Kong, China; Beltsville, MD, USA; and Sidney, NY, USA). The results show that the amount of peak runoff reduction increases with the duration of the storm return period in Beltsville and Sidney; while the trend is opposite in Hong Kong. Percentage peak reduction generally shows a decreasing trend with the storm return period in three locations. For average runoff reduction, the amount of reduction increases with the storm return period, whereas the percentage reduction presents an opposite trend in all three locations. The actual values vary between the three locations due to differences in rainfall characteristics. Both peak and average runoff reduction increase with green roof thickness, but in practice, it is not cost effective or feasible to increase the thickness beyond a certain threshold. The hydraulic conductivity can then be optimized for peak runoff reduction and it is found to increase with the return period. However, hydraulic conductivity has a minimal effect on average runoff reduction. Overall, this paper studies green roof hydrological performance in response to different rainfall characteristics and provides recommendations on green roof designs related to soil thickness and hydraulic conductivity.

1. Introduction

Urbanization renders surfaces less permeable and reduces vegetation. It often has undesirable hydrological consequences, such as increased surface runoff (i.e., flood risk), reduced infiltration and changes in base flow (i.e., environmental flow) [1,2]. Recently, interest has increased worldwide in implementing small-scale hydrological controls within a catchment area to replicate pre-development hydrological regimes. Examples of such controls include green roofs, bioretention swales, rain gardens and porous pavements.
The main components of a green roof are a vegetation layer, a substrate layer, a storage layer and a drainage system. The vegetation layer may host various types of vegetation, and the substrate layer is designed to provide the plants with nutrients, water and air [3,4,5]. The storage layer acts as a water reservoir, retaining a certain amount of water; excess water can be removed through the drainage system [3,4,5]. Based on the thickness of the substrate layer, green roofs can generally be categorized as either extensive green roofs (≤150 mm) or intensive green roofs (˃150 mm) [3,4,5]. Green roofs retain and slowly release water over prolonged periods and can therefore minimize peak flow during storm events and restore environmental flow during dry periods [6,7,8]. Mentens et al. [9] concluded that extensive roof greening on just 10% of Brussels’ buildings would reduce runoff by 54% at the building level and 2.7% at the city level. Green roofs also have other benefits, such as mitigating the urban heat island effect, providing thermal insulation for buildings, enhancing buildings’ aesthetic value and providing new wildlife habitats [10,11].
However, the hydrological performance of green roofs in stormwater mitigation is affected by a number of factors, such as rainfall duration and intensity, percentage of green roof coverage, type and depth of soil medium, duration of preceding dry period and slope of structure installed [8,9,12,13]. Scholz-Barth [14] examined the influence of soil thickness on water retention, and found that 25 cm, 62.5 cm and 100 cm of soil substrate over 50 cm of gravel bed retained around 58%, 67% and 71% of the water, respectively. Villarreal and Bengtsson [15] studied the effects of rainfall intensity and slope on green roof performance and concluded that a steeper slope and higher rainfall intensity decrease retention rate. Rainfall is one of the most influential factors. Carter and Rasmussen [16] investigated the influence of rainfall intensity on retention, which they found to be highly dependent on total rainfall depth. The smaller the rainfall event, the greater the retention: 88% for a small storm (<25.4 mm); more than 54% for a medium storm (25.4–76.2 mm); and 48% for a large storm (>76.2 mm).
Although numerous research studies have evaluated the hydrological performance of green roofs, many have been based on field experiments. The results of field experiments cover only the periods monitored, and thus may not capture large and extreme storm events. For example, Gregoire and Clausen [17] examined the effects of green roofs on runoff and water quality using weekly individual samples of runoff and precipitation collected at the University of Connecticut, Storrs, US. Teemusk and Mander [18] focused on the effects of short-term events on the runoff quantity and quality of green roofs in Estonia. In addition, the results of field studies tend to depend on aspects of their experimental settings, particularly rainfall conditions, and most green roof studies have been performed in temperate regions, with 66% conducted in the US and the EU [19]. Although some studies have assessed green roof performance in the long term, and have thus covered some rare events, it is vital to gain a comprehensive understanding of more extreme events and to compare the effects of certain design parameters during these events [20]. Also, despite the suggestion made by Simmons et al. [21] that green roofing might prove beneficial in locations with subtropical climates, few studies have been performed on the stormwater management performance of green roofs in subtropical and tropical regions [13,21]. Finally, studies have tended to focus on only one or two aspects of the impact of green roof designs, making it difficult to aggregate their findings. Berndtsson [8] pointed out that the exact values of runoff reduction cannot be compared across studies due to differences in study conditions (e.g., weather, number of events, green roof design and study duration). These differences may even result in contradictory findings.
The objective of this study is to assess the general hydrological performance of a green roof under various rainfall conditions and using different green roof design parameters. The findings are obtained using numerical modeling, an emerging approach to the study of green roofs. For example, Yang and Wang [22] quantified the sensitivity of green roof models to parameter uncertainty and demonstrated the different thermal and hydrological behaviors of green roofs. Sun et al. [23] used a heat and water transport model to simulate the hygrothermal dynamics of green roofs and found that incoming solar radiation and medium layer moisture influenced green roof performance. Numerical modeling allows for the consistent comparison of green roof hydrological performance across scenarios, because only the parameters of interest are varied and this variation is systematic. In addition, numerical models are not restricted to particular study locations (e.g., references [24,25,26]). This study also examines the peak and average runoff reduction during large and extreme storm events, and the results offer important insights into the design of green roofs for stormwater quantity control.

2. Materials and Methods

First, a green roof numerical model is developed and the data for model calibration and verification are shown in Table 1. To examine hydrological performance under different rainfall conditions, the calibrated model is run first with long-term precipitation data series from three cities (Hong Kong, China; Beltsville, MD, USA; and Sidney, NY, USA). Hong Kong is selected for its high rainfall, while Beltsville and Sidney are characterized by relatively moderate precipitation. Then, the design parameters of soil hydraulic conductivity and thickness are varied in all three locations to study their influence on green roof hydrological performance. Finally, the precipitation data and simulated green roof runoff data are statistically analyzed to compare green roof performance during storms with different return periods and under different design scenarios. Green roof hydrological performance during a particular event varies with antecedent conditions (e.g., the initial moisture content of the soil layer). Therefore, although large storms are the focus of the study, simulations are performed over long periods rather than simply during design storms to avoid misleading assumptions about antecedent conditions.

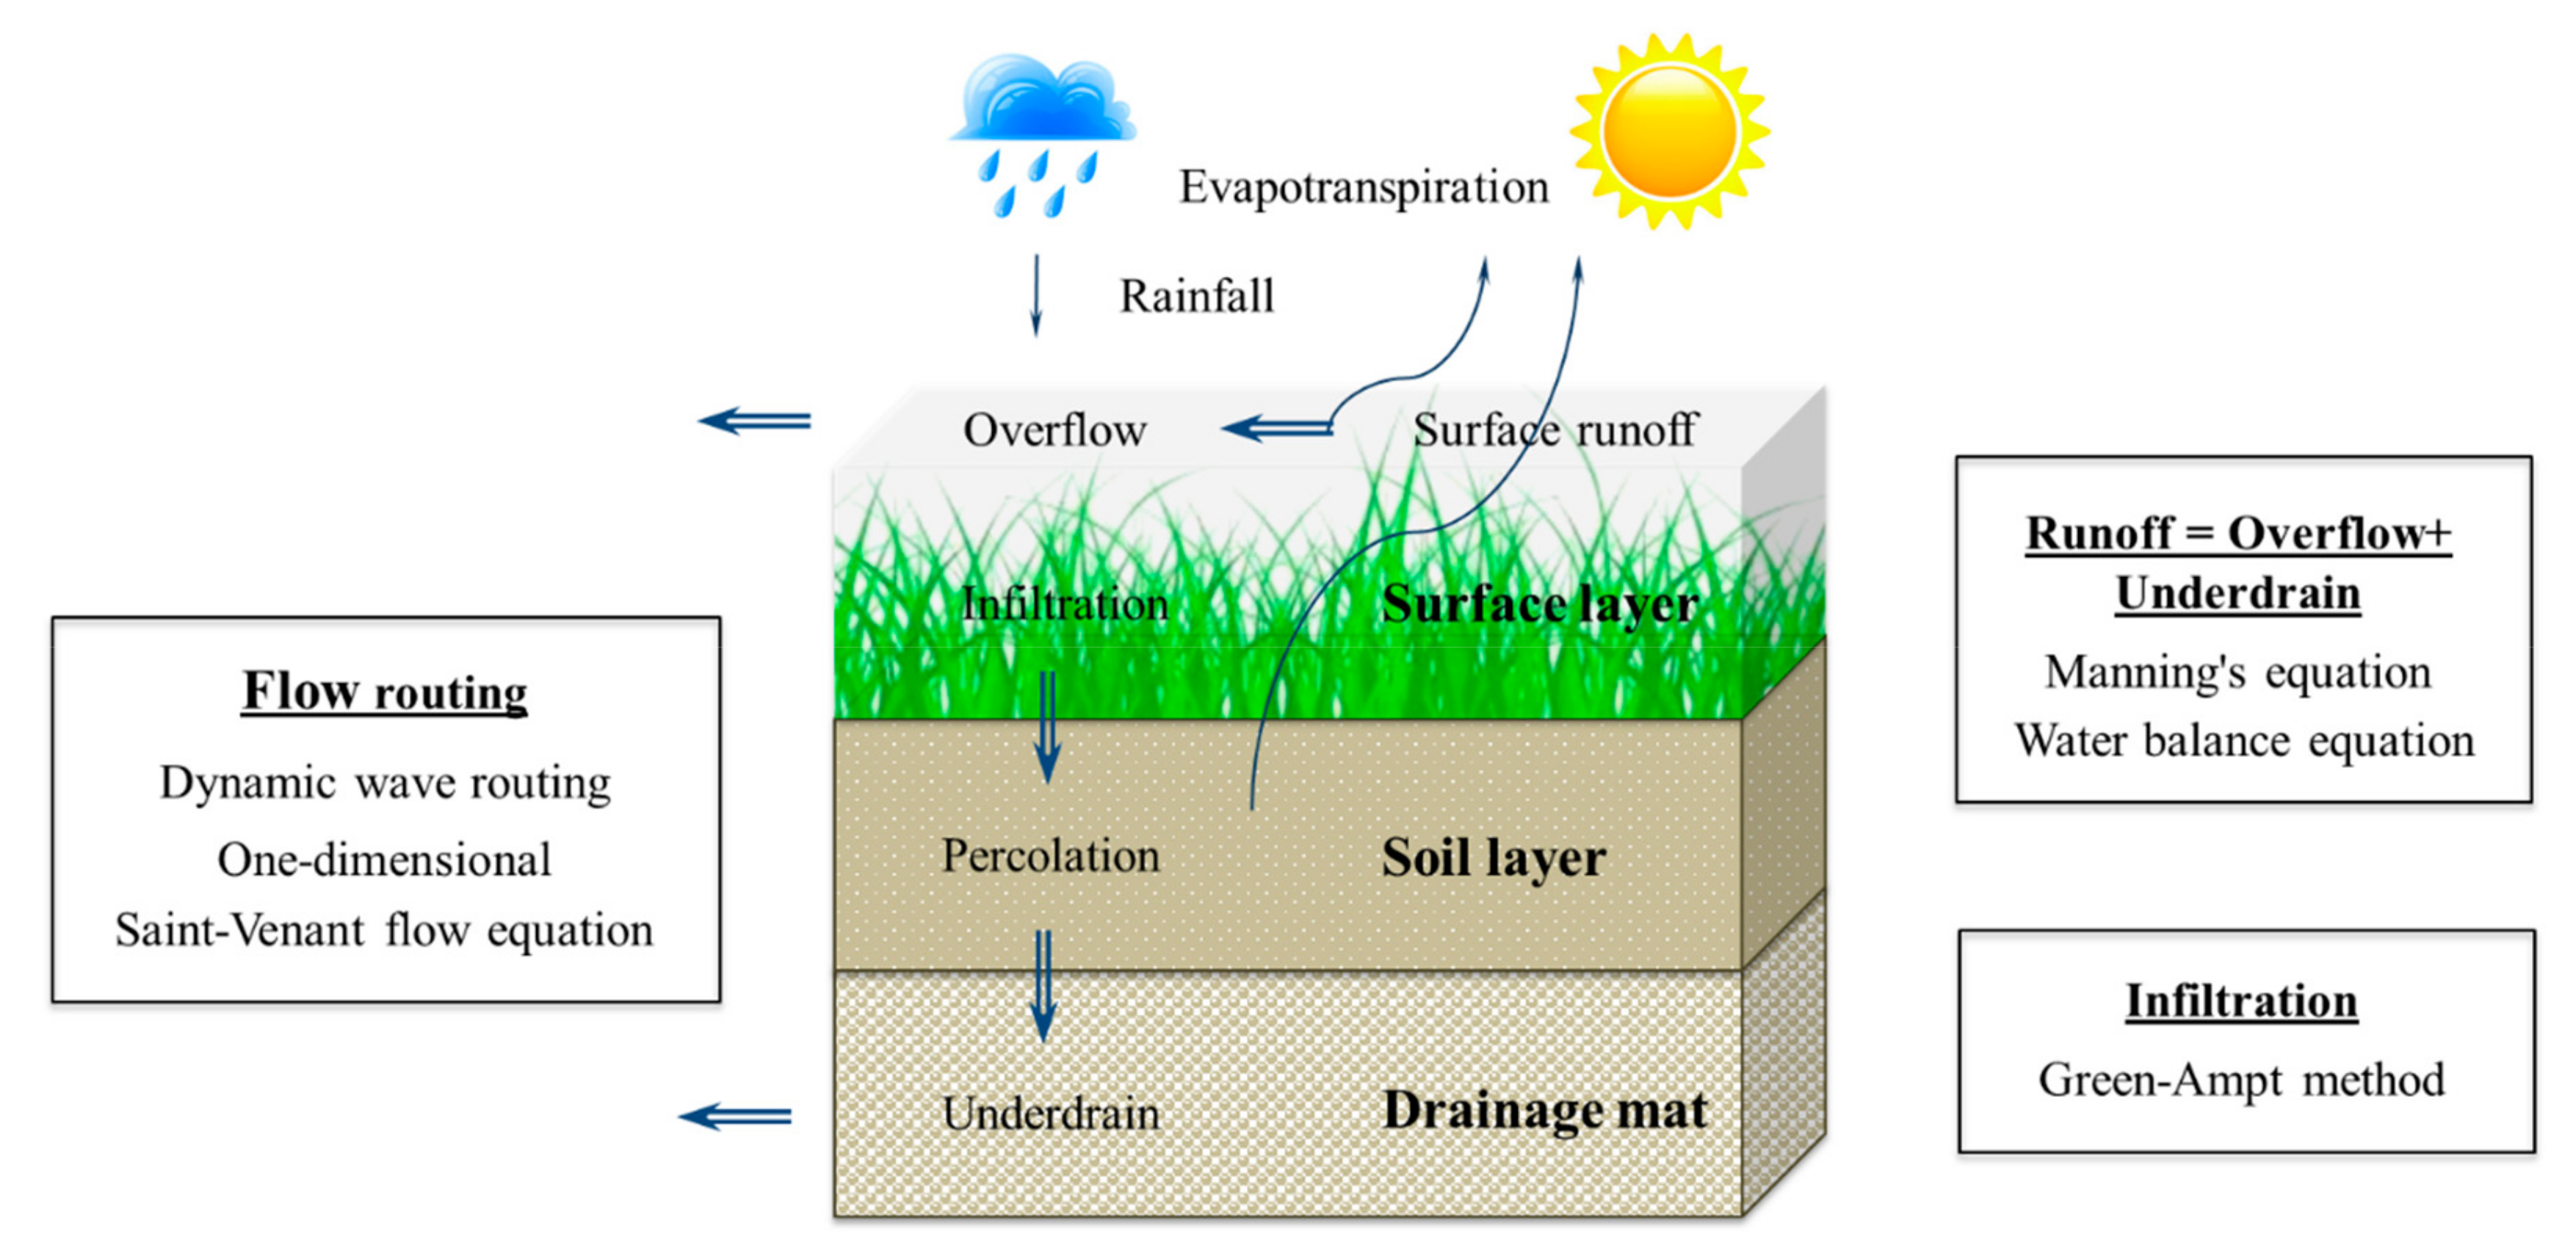
2.1. Hydrological Model

The green roof numerical model is developed using Storm Water Management Model (SWMM 5.1.010) provided by the United States Environmental Protection Agency. SWMM has been widely used in stormwater-related planning, design and analysis, and can simulate the hydrological performance of various types of low impact development (LID) practices, including green roofs [27]. It accounts for various hydrological processes such as precipitation, interception, infiltration, evapotranspiration, overland flow, capture and retention of rainfall and runoff via various LID practices. The green roof model developed in this study consists of three layers (surface layer, soil layer and drainage mat), and the conceptual model of a green roof in SWMM is shown in Figure 1. Dynamic wave routing is used to solve the one-dimensional Saint-Venant equation for flow routing within conduits; the Green-Ampt method is used to simulate infiltration; and Manning’s formula and a water balance equation are used to simulate surface runoff. The water balance within each layer and the exchange of water between layers are also computed during the simulation [27].

2.2. Data Calibration

The numerical green roof model is calibrated and verified using experimental data from Wong and Jim [29]. The experimental green roof is located on the roof of the New Wing of The University of Hong Kong’s Main Library. Its area is 1.1 m2, with a slope of 2° towards a drainage pipe. It consists of a 40 mm sandy loam soil layer and a 40 mm rockwool storage layer with a water capacity of 16 and 32 L/m2, respectively. The runoff from the green roof during a rainfall event on 28th March 2013 is used to calibrate the numerical model, while the data from rainfall event on 17th April 2013 is used to verify the model. Based on Wong and Jim [29], rainfall intensity data is measured in 10-min and 5-min intervals respectively for the events for data calibration and verification. The green roof parameters are shown in Table 1. For realism and to ensure numerical stability, the simulated rooftop is 11 m long and 10 m wide, with a catchment area of 110 m2, 100 times larger than that of the experimental green roof. As the entire rooftop is assumed to be green roofed, coverage is 100%. The simulated rooftop is assumed not to receive runoff from the surrounding area. To compare the simulated green roof runoff with the measured runoff, the linear regression coefficient ( R 2 ) and the Nash–Sutcliffe simulation efficiency coefficient ( E n s ) are computed. It should be noted that the objective of this study is not to reproduce the exact hydrological response of a particular green roof in a particular location. The calibration simply facilitates the selection of a consistent set of parameters for the long-term simulations and an initial set of parameters for use in the sensitivity analysis.

2.3. Simulation Scenarios

The first set of simulations are conducted using precipitation data series from three locations with different rainfall conditions (Hong Kong, China; Beltsville, MD, USA; and Sidney, NY, USA). The precipitation data for Hong Kong (1985–2013) are obtained from the Hong Kong Observatory’s [30], and the data for Beltsville (1972–2012) and Sidney (1972–2013) are obtained from NOAA’s National Centres for Environmental Information [31]. Precipitation is measured at 15 minute intervals. The evapotranspiration data for Hong Kong are monthly average data drawn from Jayawardena [32], and those for Beltsville and Sidney are annual average data extracted from Sanford and Selnick [33]. Evapotranspiration in Hong Kong is assumed to be constant within each month, and that in Beltsville and Sidney is assumed to be constant over each year. These simplifications are expected to have minimal effects on the calculation of runoff reduction during the extreme events of interest in this study. The general climatic characteristics of the three cities are shown as Table 2.
First, the precipitation and evapotranspiration data for the three locations are used as model inputs to simulate the green roof runoff response using the green roof parameters listed in Table 1. Next, the green roof parameters, namely soil hydraulic conductivity and thickness, are varied. Soil hydraulic conductivity affects the water infiltration, as well as the percolation through and drainage from the green roof. Whilst low hydraulic conductivity tends to limit infiltration, a green roof with low hydraulic conductivity retains water for longer. High hydraulic conductivity increases not only infiltration but water drainage. Soil thickness affects both the capacity and the duration of water retention in a green roof. Each parameter is varied as follows:
  • Soil hydraulic conductivity increases from 15 mm/h to 50, 100 and 150 mm/h.
  • Soil thickness increases from 40 mm to 150, 300 and 450 mm.
The above values of soil hydraulic conductivity and thickness are based on green roof guidelines (e.g., references [3,4]). Most researchers have recommended using relatively large conductivity values, but the calibrated value obtained here is only 15 mm/h. Therefore, the values examined (50, 100 and 150 mm/h) are larger than but still fairly close to 15 mm/h. Thickness is selected to optimize stormwater quantity control. Given the large volume of rainfall in subtropical Hong Kong, green roofs installed to mitigate stormwater here are likely to be thicker than green roofs installed for other purposes and/or in temperate regions. The overall goal of this study is to examine the generic effects of precipitation, soil hydraulic conductivity and thickness on the general hydrological performance of a green roof. The findings can be compared consistently across scenarios because only one factor is varied each time.

2.4. Frequency Analysis

To compare green roof performance across scenarios, both the precipitation data and the green roof simulated runoff data are analyzed in relation to their return periods. The peak and total precipitation for each event are obtained from the original precipitation data, and the peak and total runoff for each event are extracted from the modeling results. Then, the annual peak and average precipitation/runoff can be calculated based on the values for all of the storm events. Finally, the annual peak and average precipitation/runoff are log transformed and analyzed to relate their magnitude to their frequency of occurrence using a Pearson type III distribution. As this analytical technique allows for extrapolation to return periods beyond the data series duration, it is used extensively in flood analysis. The general equation for the log-Pearson type III distribution is as follows:
log x T r = log x i ¯ + σ K f T r , C s
where x T r is the annual peak or average precipitation/runoff at different occurrence frequencies; x i is the annual peak or average precipitation/runoff from the time series data; log x i ¯ is the average value of log x i ; σ is the standard deviation of log x i ; and K f ( T r , C s ) is the frequency factor that relates to the occurrence frequency ( T r ) and skew coefficient ( C s ) . The average and standard deviation values of log x i can be calculated as follows:
log x i ¯ = i = 1 n log x i n
σ = i = 1 n log x i log x i ¯ 2 n 1
where n is the number of entries.
Then, the skew coefficient can be calculated as follows:
C s = n i = 1 n log x i log x i ¯ 3 n 1 n 2 σ 3
After that, K f ( T r , C s ) can be obtained for different return periods from the frequency factor table according to C s , and the peak or average precipitation/runoff response to occurrence frequency (i.e., return period) can be finally determined via the log-Pearson type III distribution (Equation (1)).

3. Results

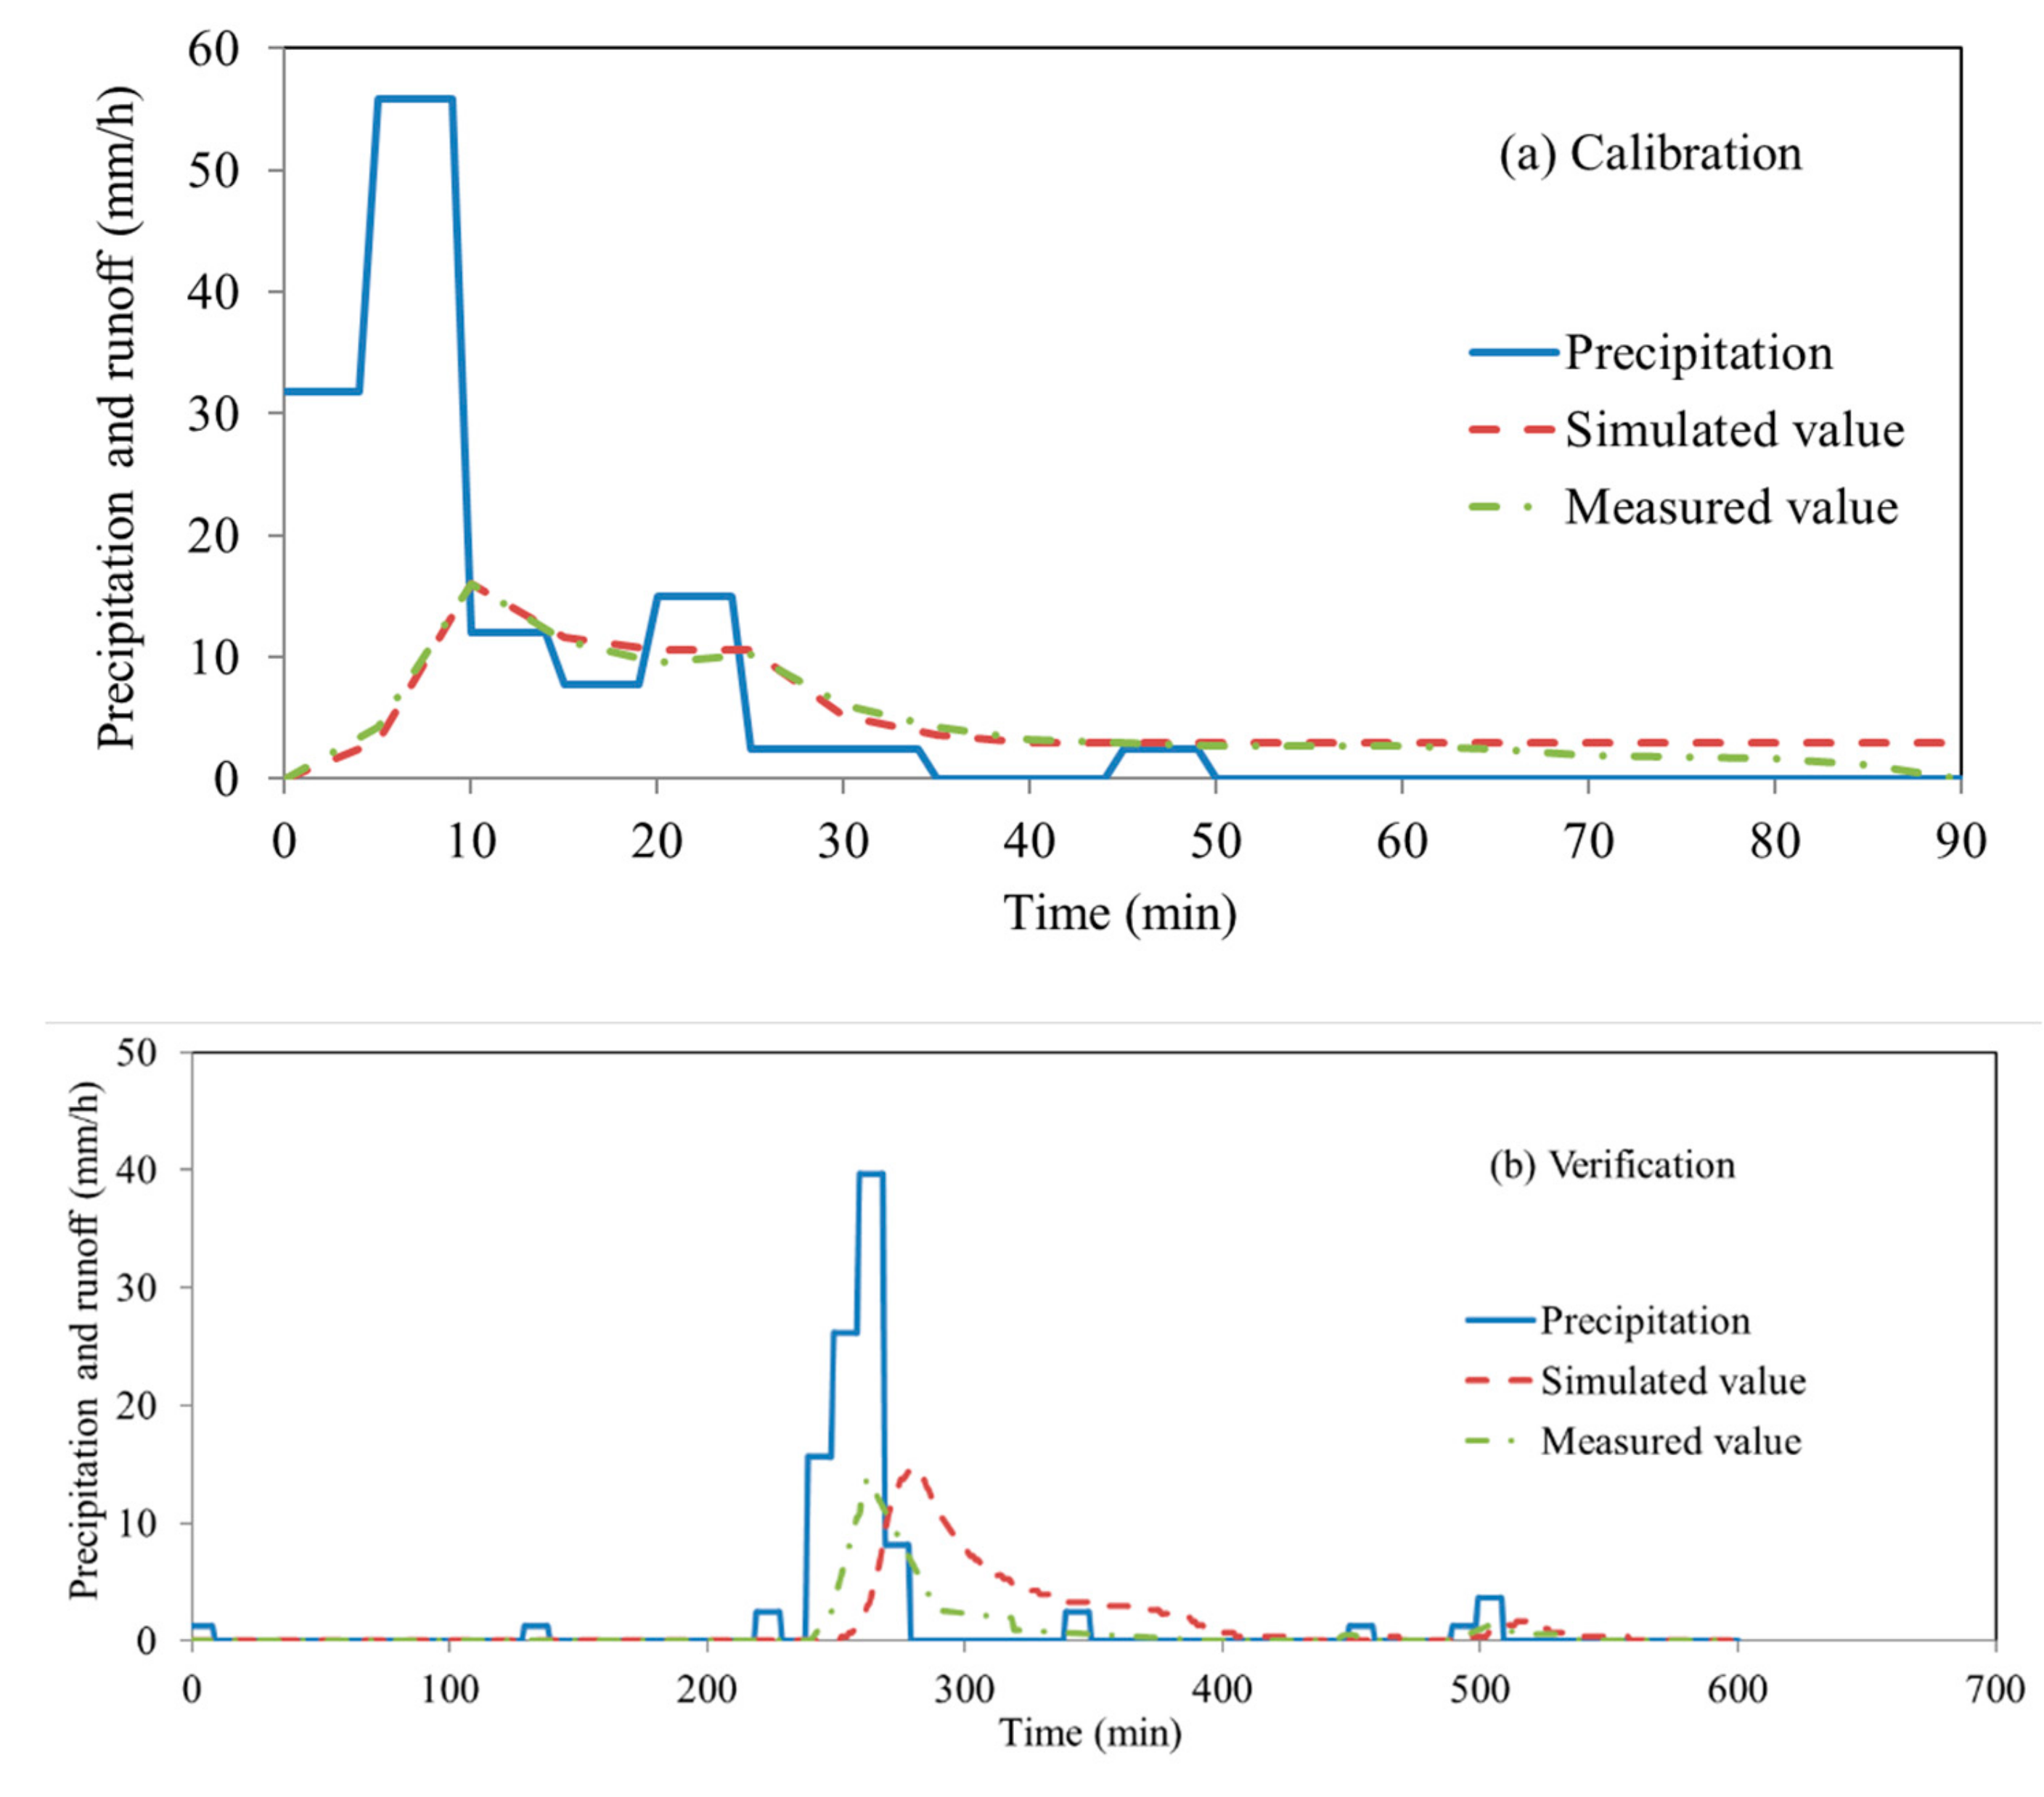
3.1. Model Calibration and Verification

Overall, the simulated runoff in the calibrated model matches the observed runoff (Figure 2a), with R 2 and E n s values of 0.95 and 0.94, respectively. The model accurately simulates peak runoff, which is important for this study. However, it does not accurately capture the end of the recession limb, perhaps because the simulated catchment area is 100 times larger than the experimental one, delaying the final small drainage to the outlet.
The verification of green roof runoff is presented as Figure 2b. The model can also accurately capture the whole trend and the peak runoff, but with a time delay. Again, the much larger simulated area (i.e., 100 times larger than the experimental one) could cause the delay of drainage to the outlet during the simulation, which however in fact is more realistic. The measured runoff data for verification is extracted manually from a figure of Wong and Jim [29]. Due to the limited number of points and the extracted values could differ from the actual values, R 2 and E n s values are not computed.

3.2. Green Roof Runoff Reductions in Different Locations

This section presents the hydrological responses, particularly runoff reduction, of the green roof for the three locations and storms with different return periods. Green roof runoff is defined here as a combination of the surface runoff of the green roof and the discharge from the bottom of the green roof (i.e., water that has drained through the green roof).

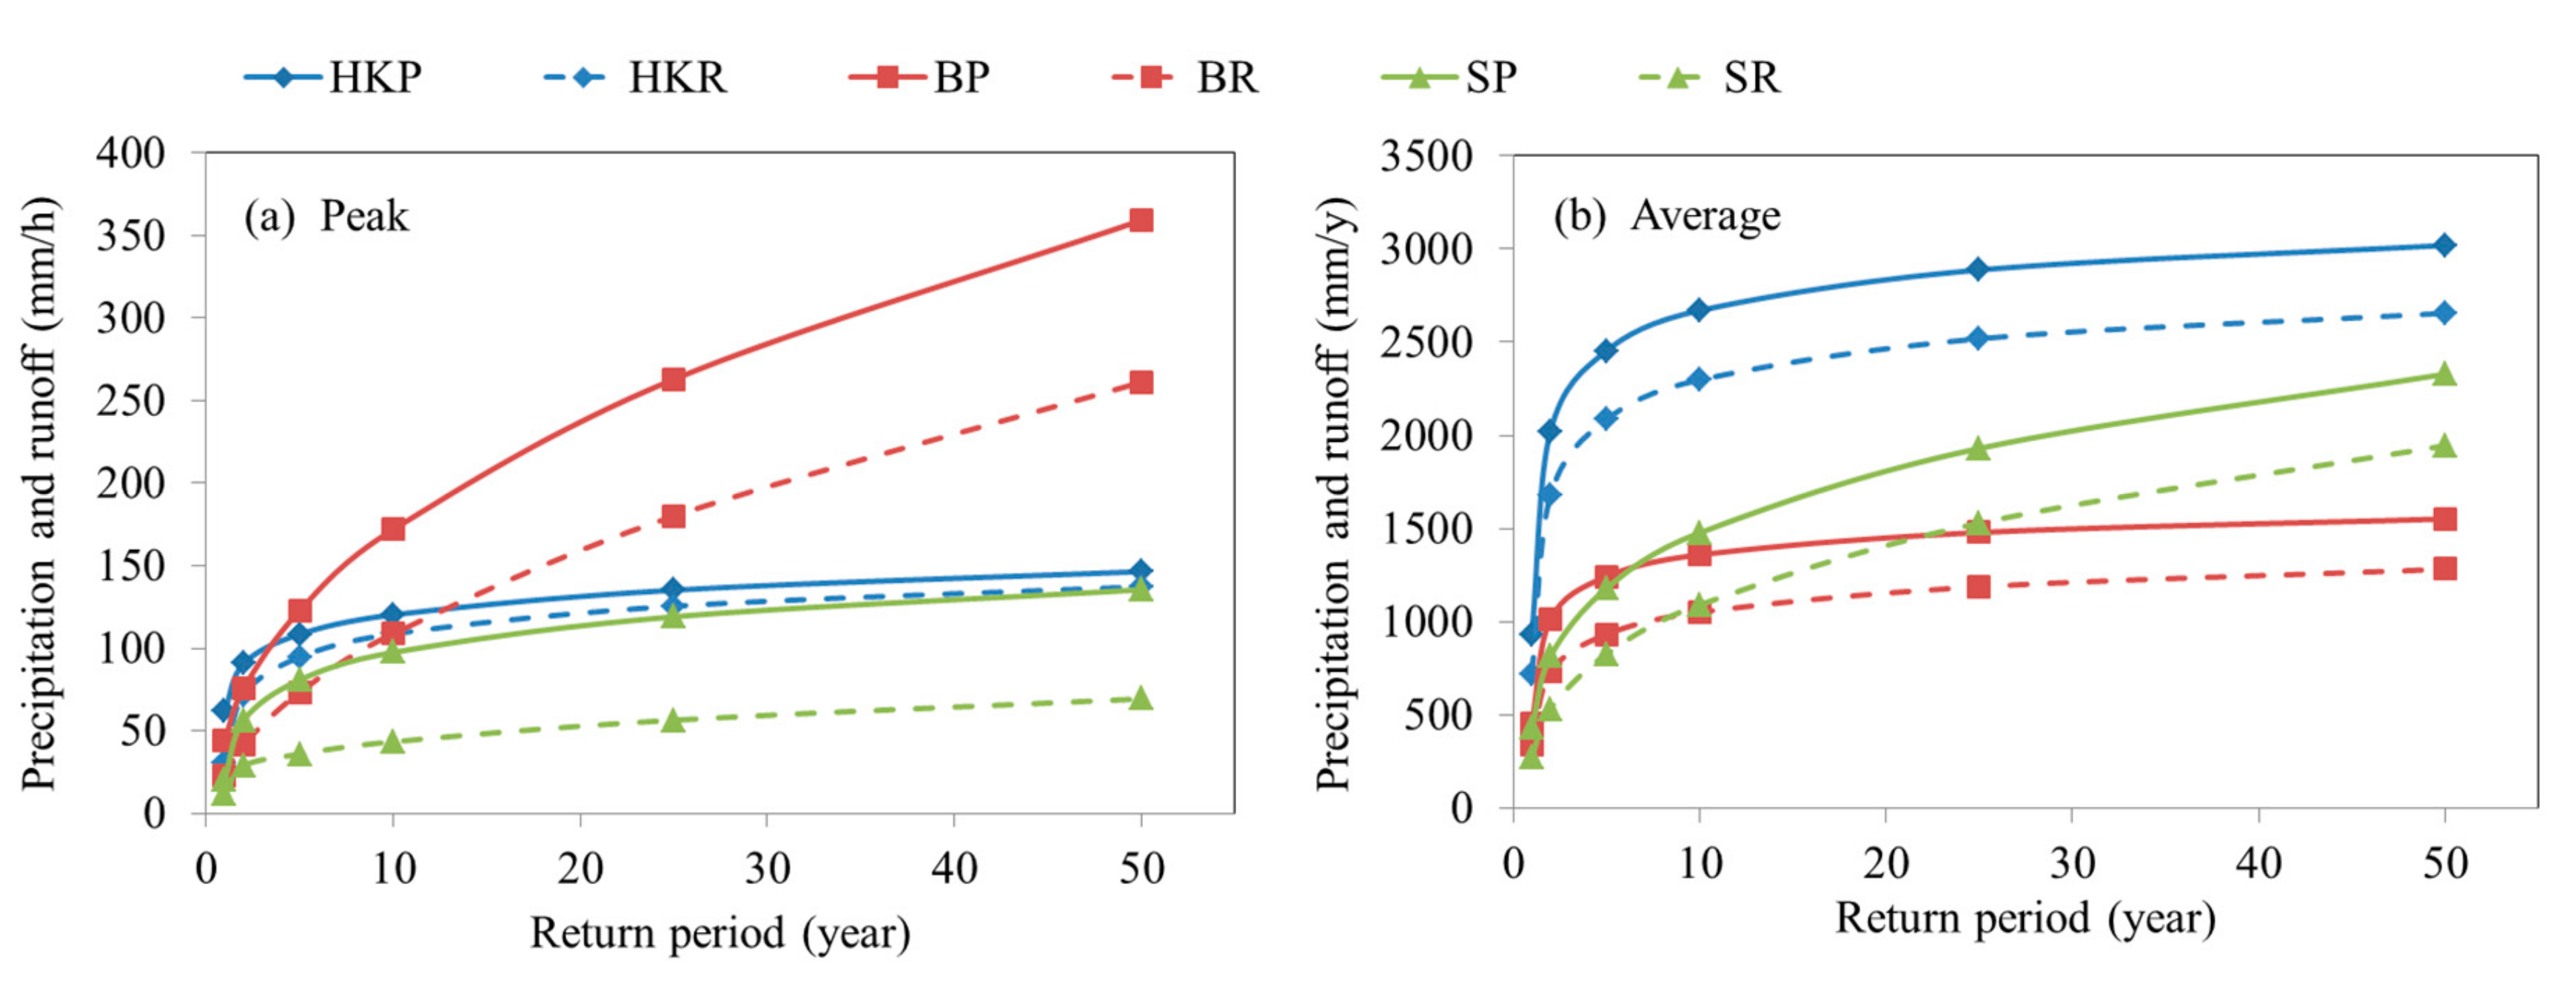
3.2.1. Precipitation and Runoff Characteristics

Peak precipitation in Hong Kong is greater than that in Beltsville and Sidney for return periods smaller than 5 years (Figure 3a). However, beyond the return period of 5 years, peak precipitation in Beltsville increases dramatically, exceeding that in the other two locations. However, the annual average precipitation in Beltsville is consistently much lower than that in Hong Kong, and even falls below that in Sidney for return periods exceeding 10 years (Figure 3b). Hong Kong’s smaller peak precipitation but larger annual average precipitation suggest that its rainfall events are longer-lasting and of larger volumes; the opposite is true in Beltsville.
The trends of peak and average runoff closely follow those of precipitation. The difference between precipitation and runoff for both peak and average values increases with the return period, with the exception of Hong Kong’s peak values, which are small across all return periods. There is some simulated surface runoff during very large storms, but green roofs should be designed not to generate surface runoff in practice. This, therefore, supports the choice of higher soil hydraulic conductivity for the simulations that examine the generic effect of conductivity.

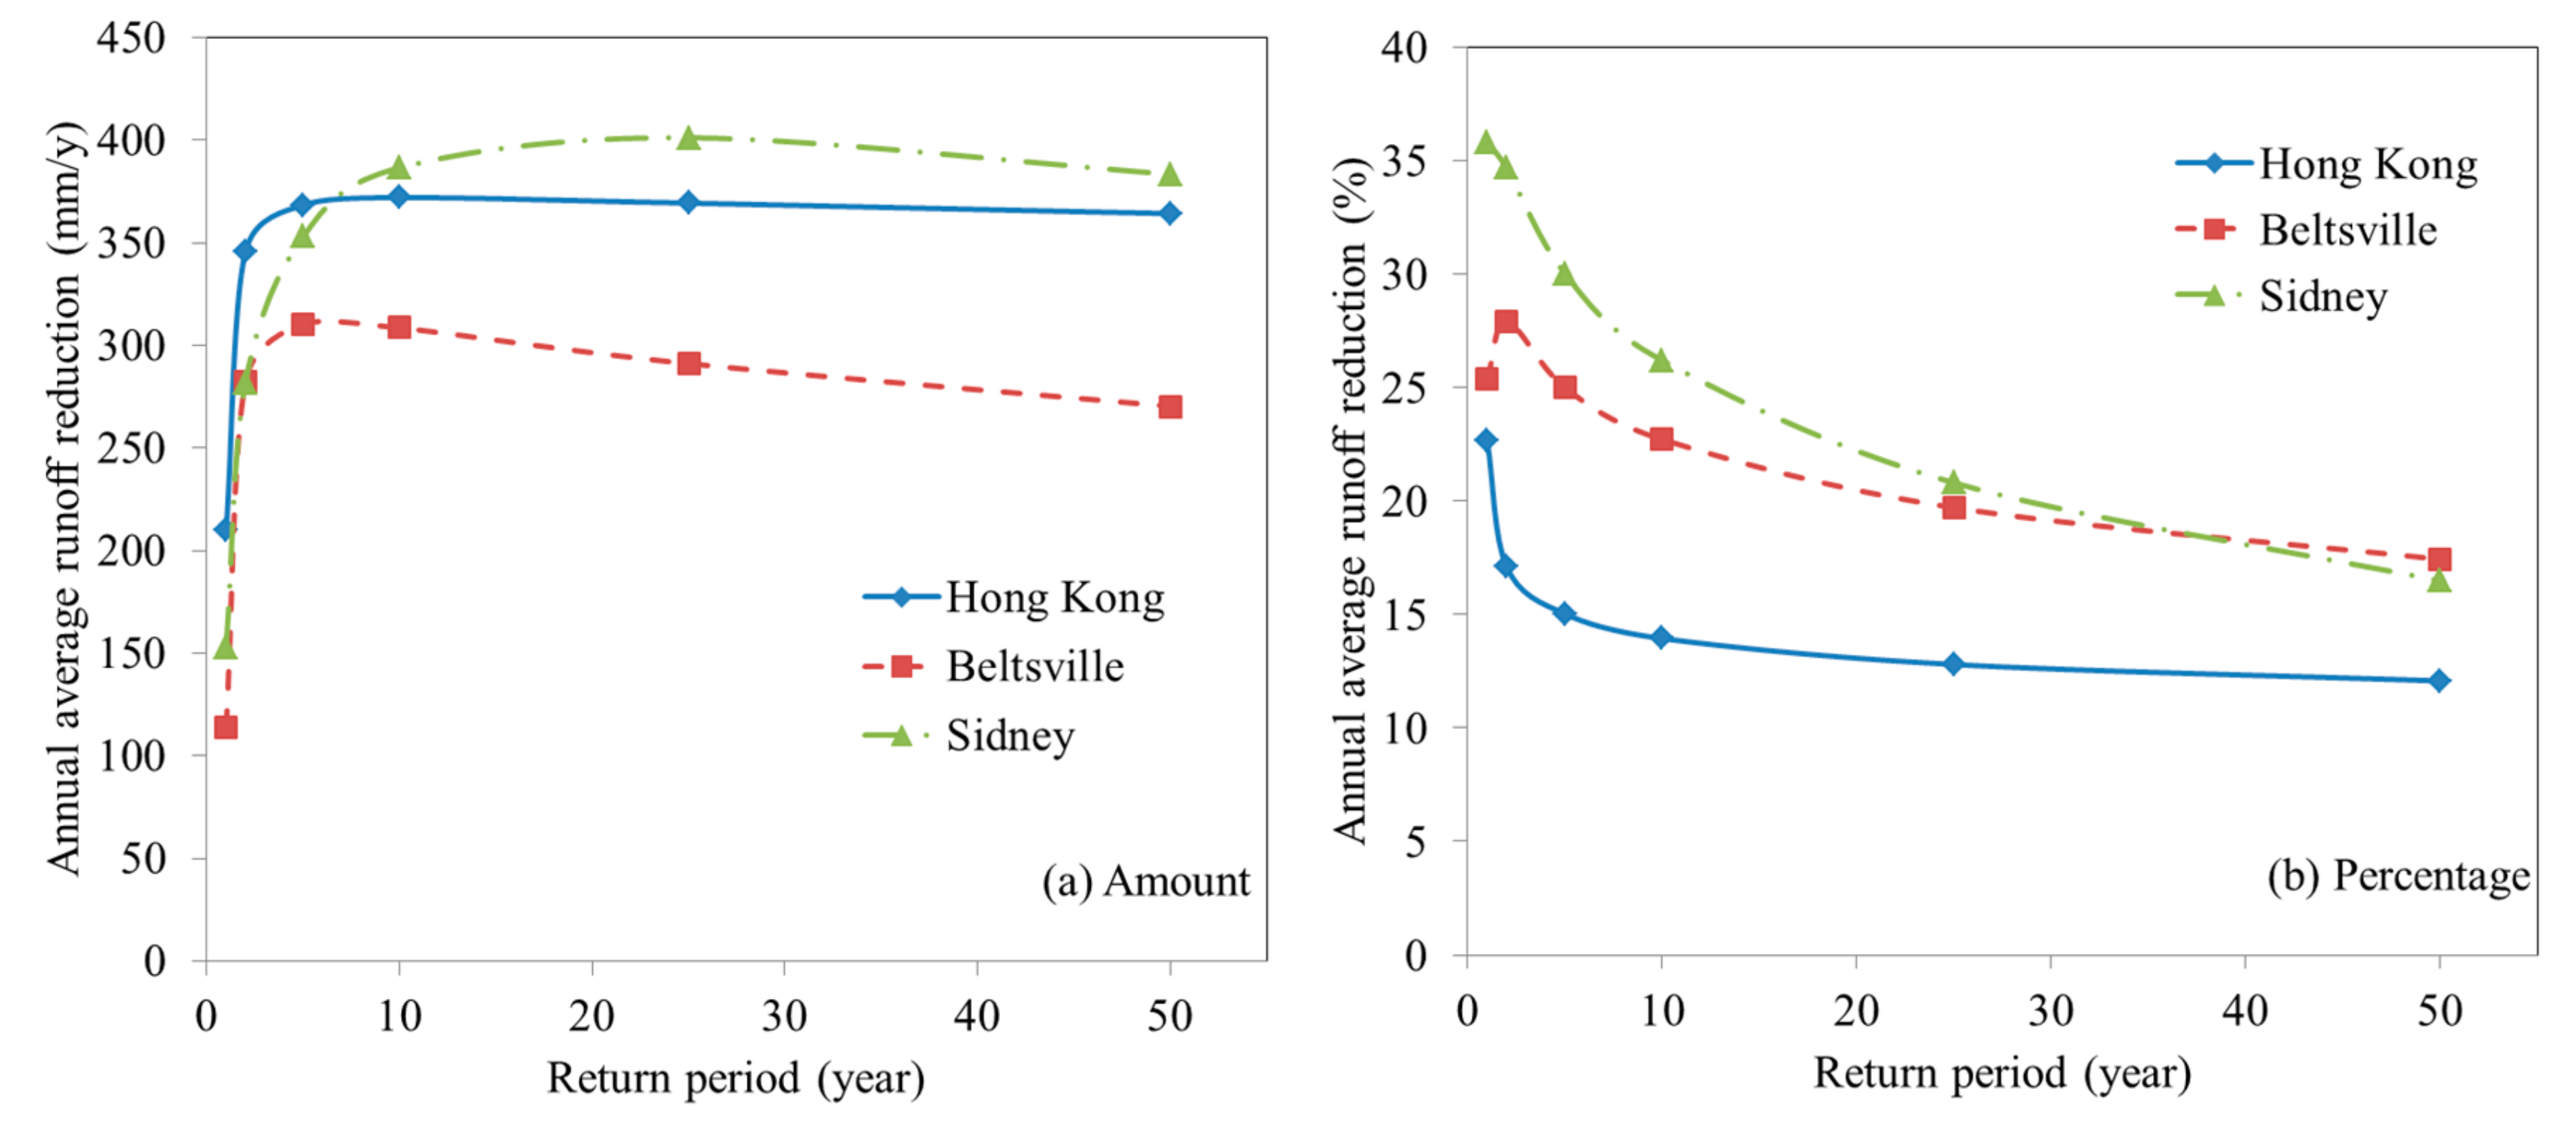
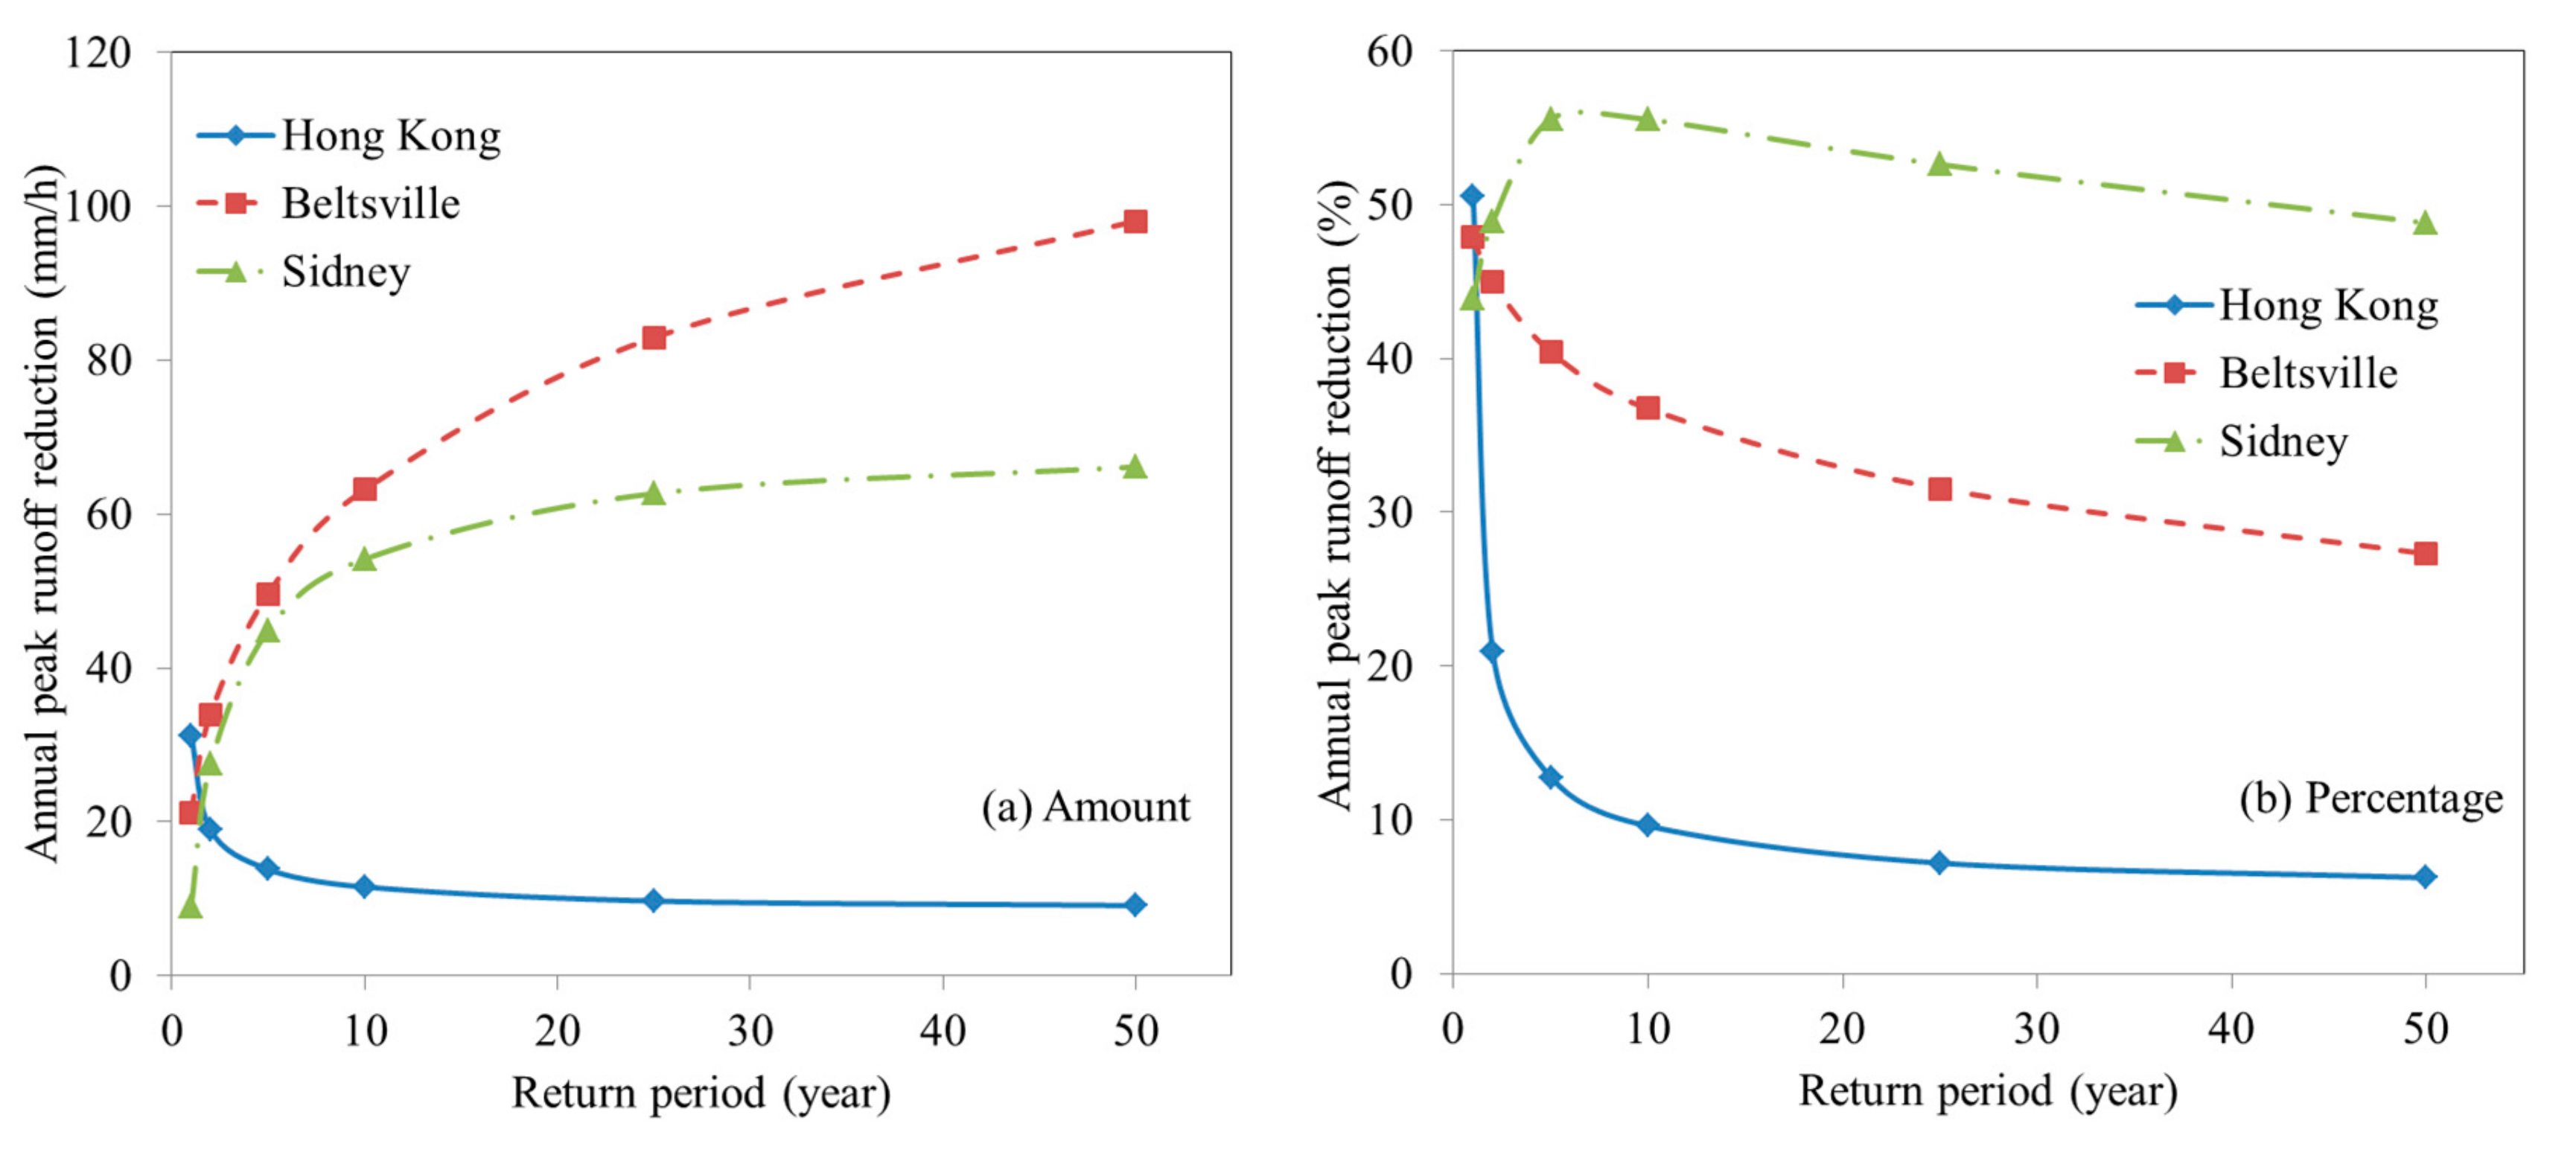
3.2.2. Amount and Percentage of Runoff Reduction

1. Peak Runoff
The amount of peak runoff reduction in different locations is shown in Figure 4a. The reduction in Beltsville and Sidney shows an upward trend, whereas that in Hong Kong shows a downward trend.
Due to the differences in storm characteristics in different studies, peak runoff reduction is often reported in the form of percentage. Accordingly, numerous previous studies have concluded that green roofs better mitigate peak runoff during smaller storms (e.g., references [16,34]). Similar observations have been presented for Beltsville and Hong Kong, where the percentage of peak runoff reduction has been shown to decrease with the return period (Figure 4b). In Sidney, the relatively modest peak and average rainfall intensity result in higher and more stable percentages of peak runoff reduction for different return periods (around 45–55%).
2. Average Runoff
The amount and percentage of average runoff reduction in different locations are shown in Figure 5. The amount of annual average runoff reduction in all three locations increases dramatically with a return period of only a few years. However, for return periods exceeding a few years, the values are relatively stable. This trend is similar to that for annual average precipitation, shown in Figure 3b.
The percentage of annual average runoff reduction generally decreases with an increase in the return period, and this decrease is relatively steep as the return period increases to a few years. With longer return periods, both the annual precipitation and the amount treated by the green roof become more stable, giving relatively stable percentages of annual average runoff reduction.
Generally, the annual average reduction amount is lowest in Beltsville, but the annual average reduction percentage is lowest in Hong Kong. The results for the three locations differ clearly, due to their distinct rainfall characteristics. However, the differences in the average values (Figure 5) are smaller than those in the peak values (Figure 4).

3.3. Runoff Reduction in Different Green Roof Designs
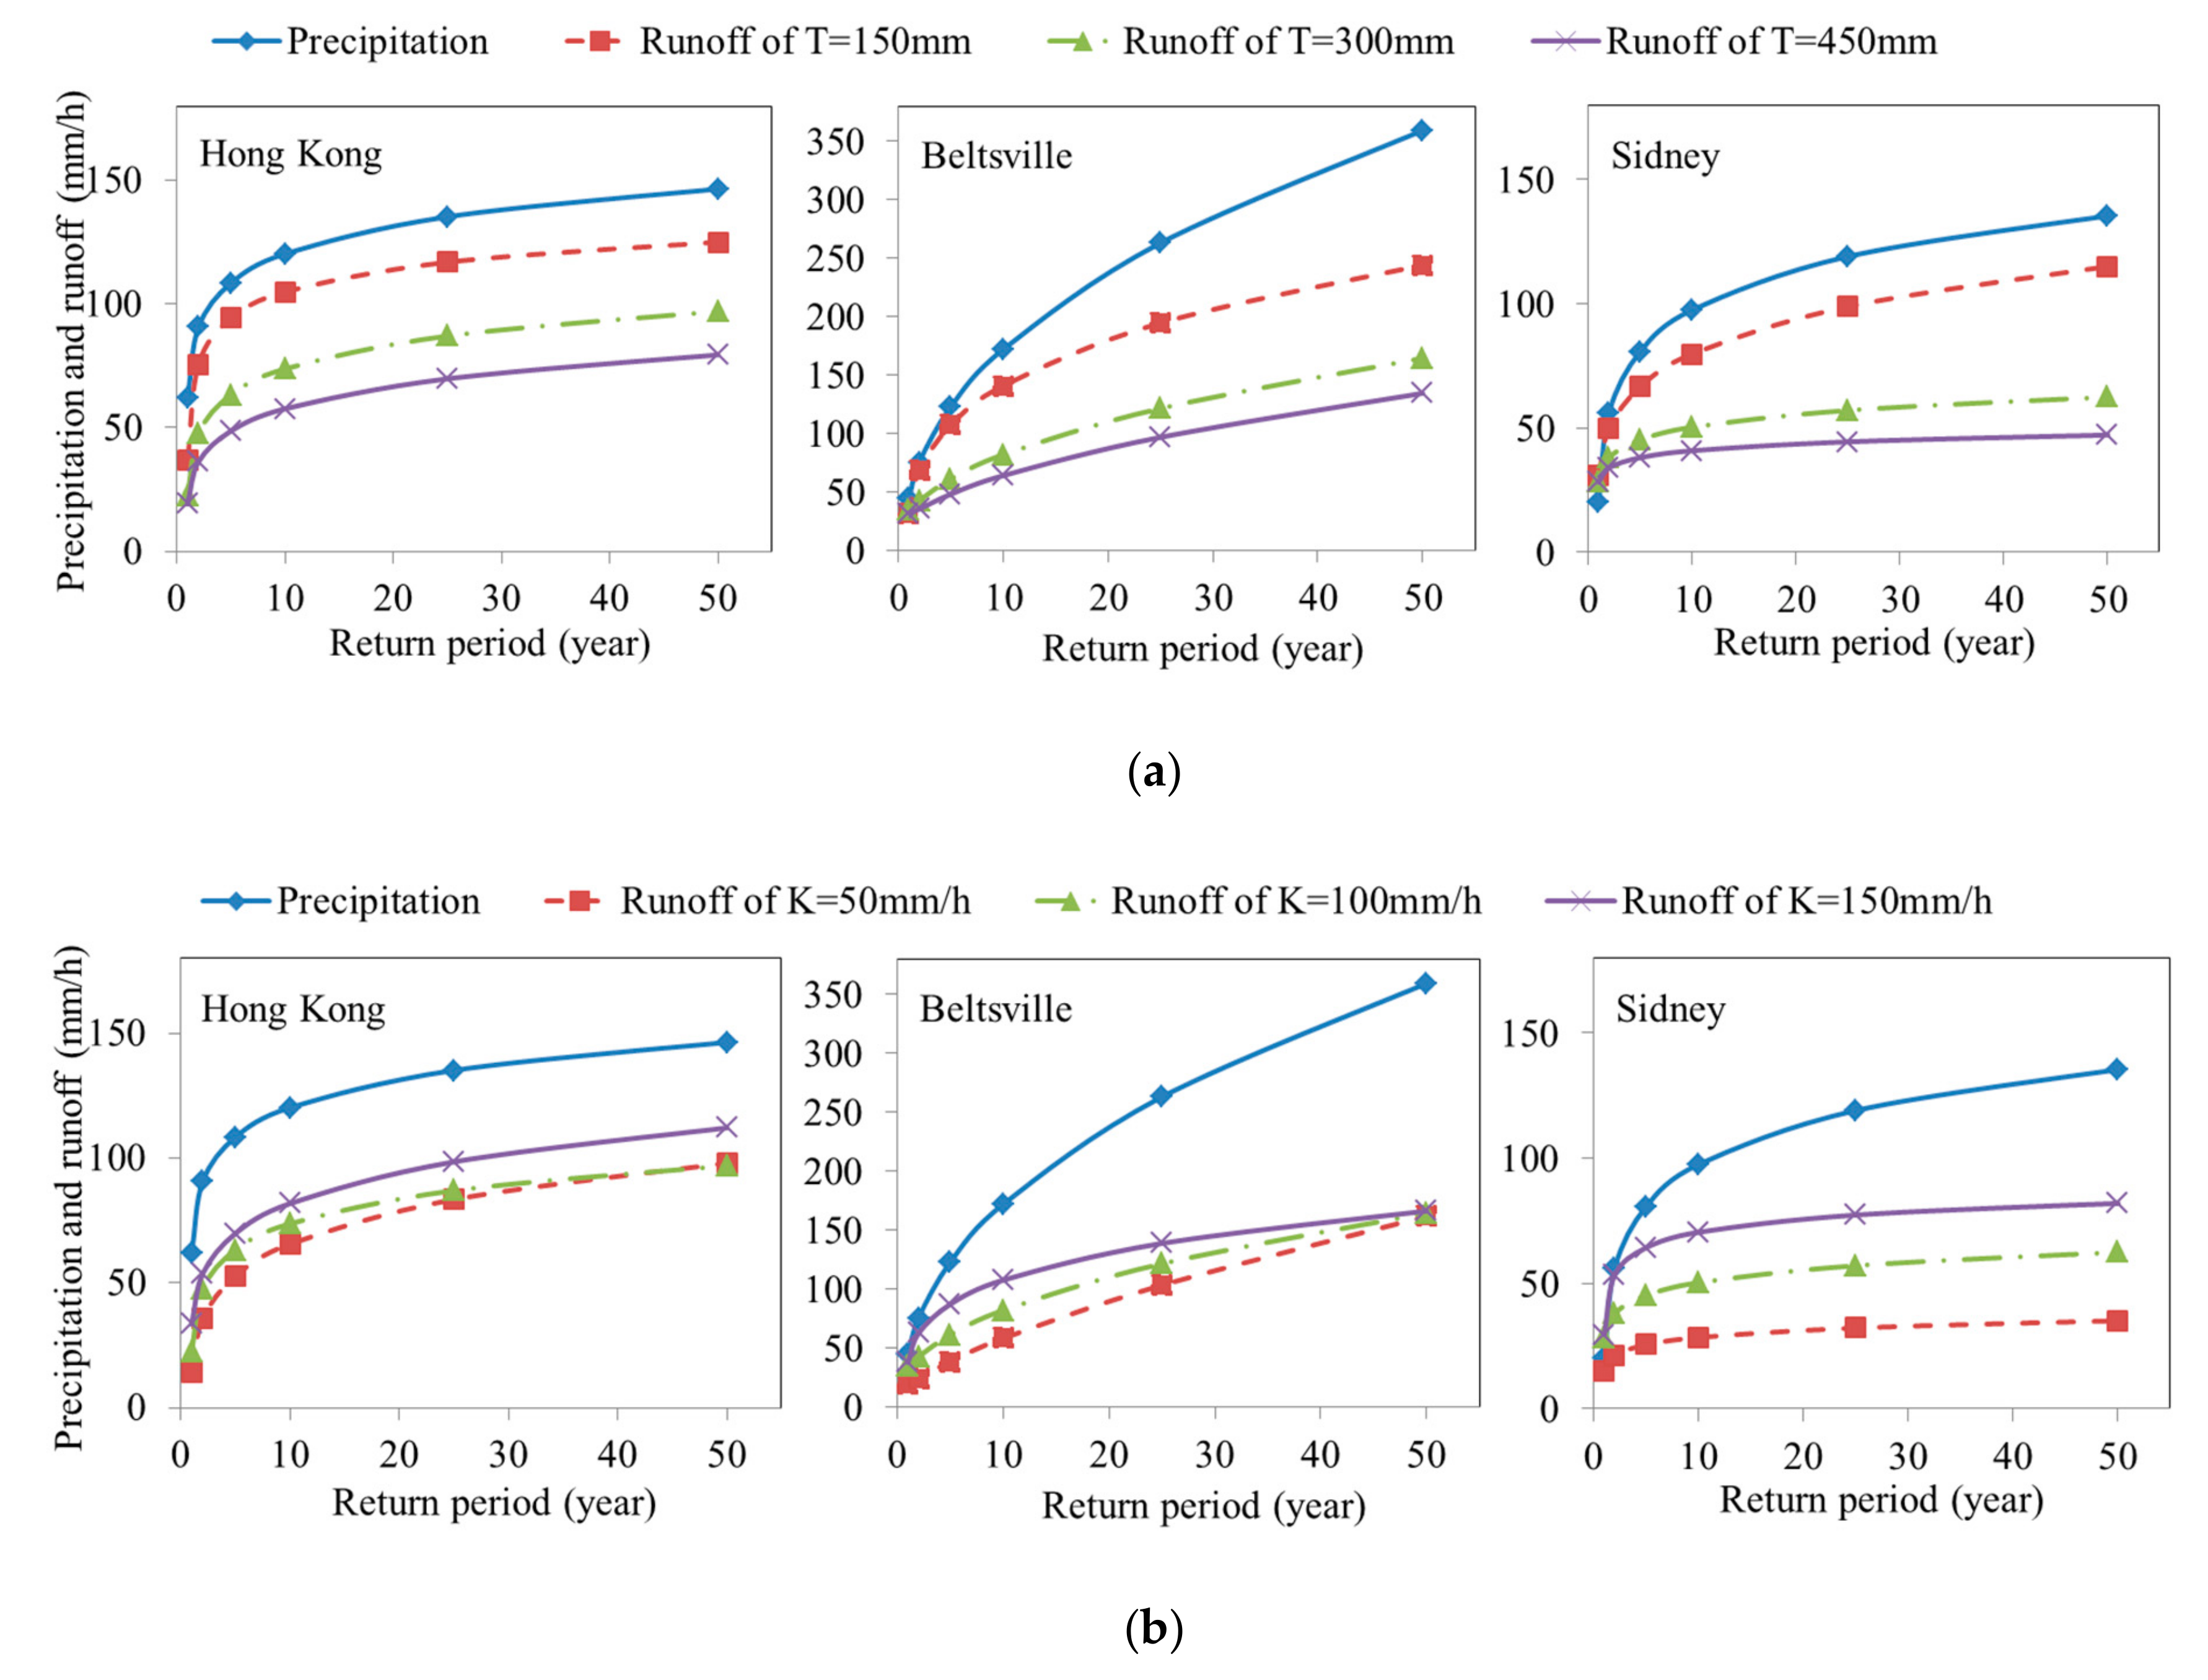
3.3.1. Peak Runoff

The effects of green roof soil thickness and hydraulic conductivity on peak runoff in different locations are illustrated in Figure 6. As expected, peak runoff decreases with an increase in thickness (Figure 6a). However, the difference in performance between the thicknesses of 150 mm and 300 mm is much larger than that between 300 mm and 450 mm, especially in Beltsville and Sidney.
As shown in Figure 6b, peak runoff increases as conductivity increases, as the conductivity values examined are relatively high compared with the values for rainfall intensity. When conductivity is relatively low, the opposite trend is likely to arise, because water cannot effectively infiltrate the system and immediately becomes surface runoff [28]. The results of additional simulations performed with lower conductivity values (i.e., 25, 50 and 75 mm/h) confirm that peak runoff decreases as conductivity increases. However, if conductivity is too high, water drains through the system without being retained, again becoming runoff straight away.

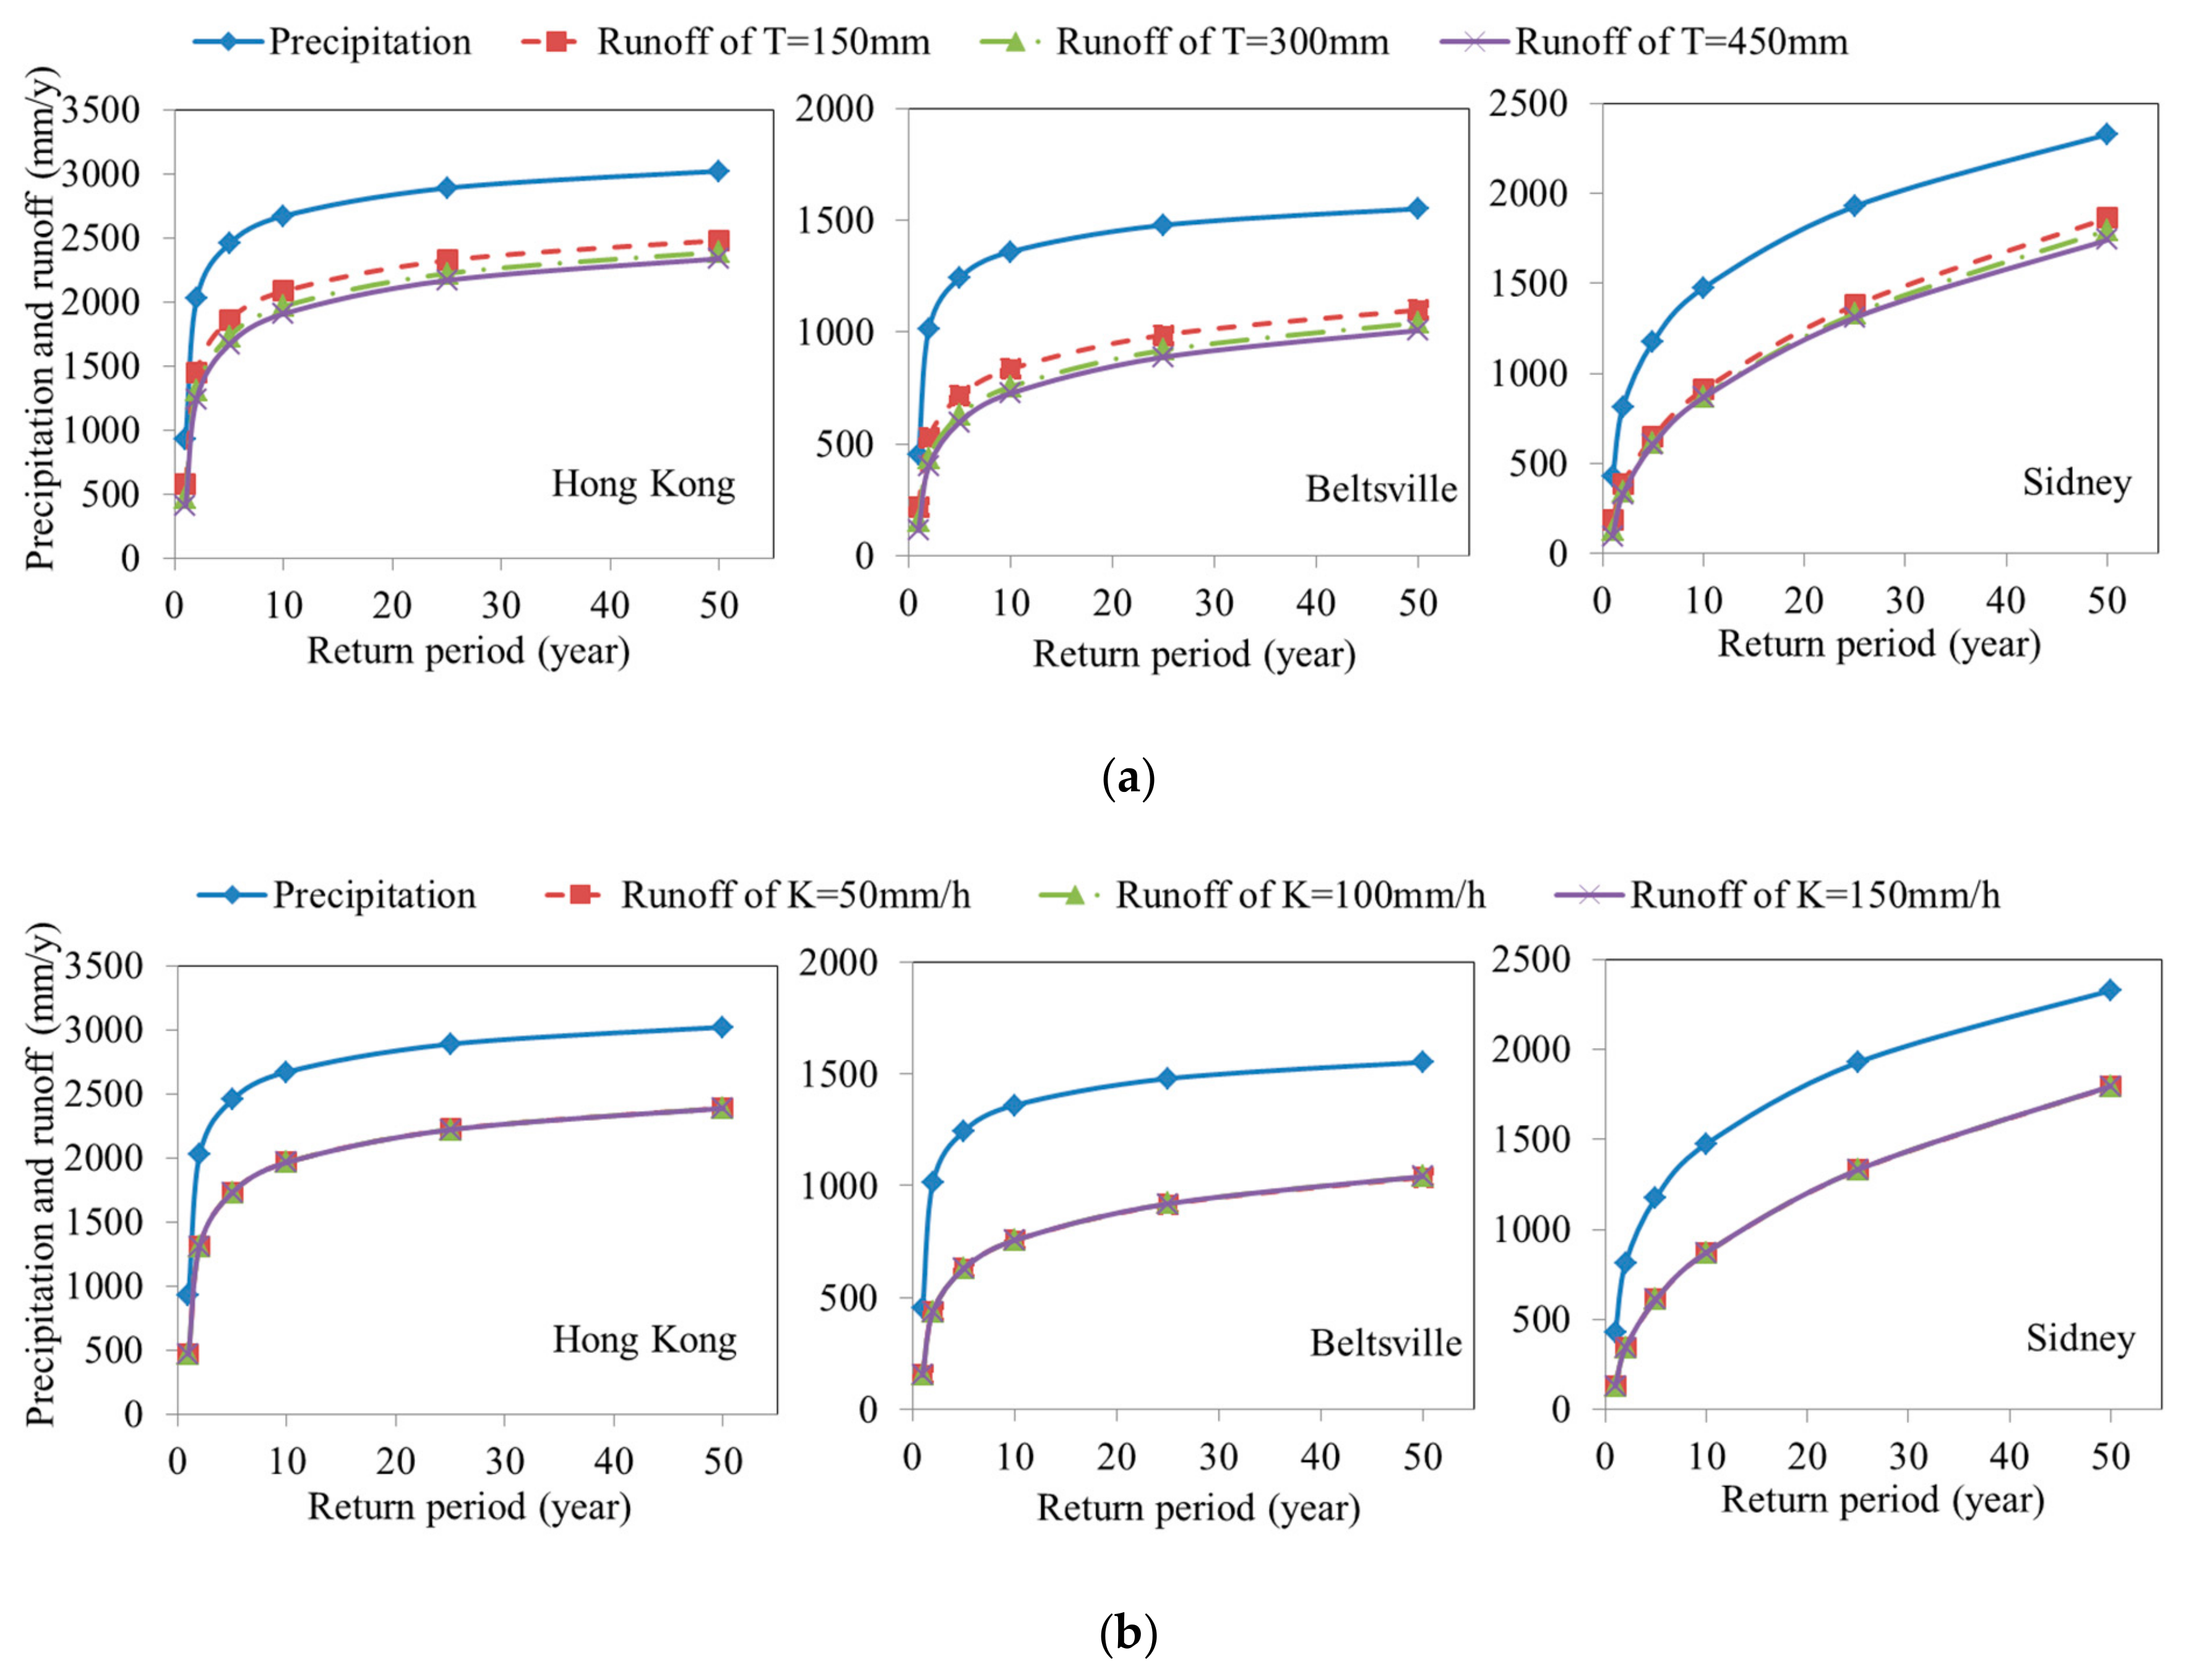
3.3.2. Average Runoff

Increasing thickness results in a higher annual average runoff reduction, as expected (Figure 7a). However, this effect is significantly smaller than the effect of thickness on annual peak runoff reduction (Figure 6a). Changes in conductivity only minimally affect annual average runoff (Figure 7b).

4. Discussion

4.1. Green Roof Runoff Reductions in Different Locations

4.1.1. Peak Runoff

For amount reduction, the reason behind the increasing trend in Beltsville and Sidney, but the decreasing trend in Hong Kong is the different rainfall characteristics. Rainfall events in Hong Kong last for longer and have larger volumes, and the increase in peak precipitation with the return period is less significant. For example, a 1-year storm event in Hong Kong can last for approximately 36 h and generate a total rainfall depth of 204 mm, whereas equivalent storm events last for only 0.5 h and 12 h in Beltsville and Sidney, with depths of 10 mm and 37.5 mm, respectively. At a green roof thickness of 40 mm, which is fairly thin, little water capacity remains when precipitation reaches its peak. In Hong Kong, therefore, the amount of peak runoff reduction is relatively low, and decreases with an increase in return period. As rainfall events in Beltsville and Sidney occur on a smaller scale and last for less time, the simulated green roof has sufficient capacity to hold rainwater even at peak precipitation. Especially when return periods are small, the green roof is not fully utilized and the amount of peak runoff reduction increases significantly with the return period.
For percentage reduction, the downward trend in Hong Kong and Beltsville is because green roof lacks the capacity to handle peak precipitation at high return periods. In Hong Kong, although peak precipitation is lower than that in Beltsville at high return periods, the total volume and duration of each rainfall event are greater, as previously discussed before. During peak precipitation, the green roof may fill up. Thus, the percentage of peak runoff reduction is almost always lowest in Hong Kong in the three locations, and decreases further with the return period. Compared with the results of previous monitoring studies, the percentage reduction reported here is generally lower, primarily because this study covers more extreme rainfall events and simulates a thinner green roof. Stovin et al. [35] observed peak reductions ranging from 20% to 100%, with both a mean and a median of 59%, over a 2.5 year monitoring period in Sheffield, UK, because peak rainfall intensity in this area is only 7–50 mm/h. In contrast, Wong and Jim [29] investigated four green roof systems in Hong Kong from July 2012 to April 2013, and found the average peak runoff reduction to range between 40% and 60%, similar to the percentage reduction values observed during the 1 year design storm in this study. In Sidney, the higher and more stable percentages of peak runoff reduction for different return periods is due to the relatively modest peak and average rainfall intensity. The runoff reduction around 45–55% from 2 to 50 return year is consistent with the values reported by Carter and Rasmussen [16] in Athens, Georgia: 48% and 54% for medium-sized (25.4–76.2 mm) and large (>76.2 mm) rainfall events, respectively.

4.1.2. Average Runoff

The trend for amount of average runoff reduction can again be explained by the limited capacity of the green roof. As a small amount of precipitation does not exhaust green roof capacity, the annual average reduction amount increases significantly as precipitation increases. However, when precipitation increases such that it exceeds green roof capacity, the annual average reduction amount remains relatively stable. Due to differences in the cities’ rainfall characteristics, the annual average precipitation beyond which the reduction amount remains stable varies (2022 mm/y for a 2 year return period in Hong Kong, 1012 mm/y for a 2 year return period in Beltsville and 1178 mm/y for a 5 year return period in Sidney). However, the reduction amount is similar at the critical values (346 mm/y, 282 mm/y and 353 mm/y in Hong Kong, Beltsville and Sidney, respectively).

4.2. Runoff Reduction Effected by Different Green Roof Designs

4.2.1. Peak Runoff

The changes of green roof runoff in different thickness and conductivity indicate that thickness highly influences runoff reduction. However, it is not cost-effective to increase the thickness beyond a certain threshold, and other parameters such as conductivity should be optimized instead. Runoff reduction is optimized at a critical conductivity value, which is positively correlated with rainfall intensity. This phenomenon is partly illustrated by the peak runoffs in Hong Kong and Beltsville (shown in Figure 6b). When the rainfall intensity is relatively low (i.e. return period below 25 years), runoff reductions increase as conductivity decreases. However, When the return period is very long (e.g., 50 years) and rainfall intensity is high, decreasing conductivity from 100 to 50 mm/h in Hong Kong or from 150 to 50 mm/h in Beltsville produces almost the same amount of runoff reduction. In fact, if the return period is even longer (i.e., over 50 years), lower conductivity may cause less runoff reduction.

4.2.2. Average Runoff

The minimal effect of conductivity on annual average runoff is because conductivity primarily affects infiltration and water retention during peak runoff. Most of the water retained by the green roof during the event gradually drains through the system until the soil water content reaches the field water capacity. Therefore, conductivity influences primarily the duration of drainage, not the ultimate water retention amount or the average runoff.

5. Conclusions

This study assesses the hydrological performance of green roofs under various rainfall conditions and for diverse green roof designs. It provides the peak and average runoff reduction in terms of both amount and percentage for a wide range of storm return periods in three locations. In general, the amount of peak and average runoff reduction increases and the percentage of peak and average runoff reduction decreases with the increased duration of the return period, as expected. The abnormal downward trend observed in the amount of peak runoff reduction in Hong Kong suggests that green roofs with thicker soil layers are advisable in locations with relatively high and long-lasting precipitation. The actual values of peak and average reduction vary across the three locations. They also differ between storms with similar peak values/return periods due to diversity in rainfall characteristics (e.g., temporal patterns and total rainfall volume). However, the differences between the three locations are smaller for average runoff reduction than for peak runoff reduction.
Overall, this study demonstrates the general differences in green roof stormwater mitigation performance between three locations and different green roof designs. Both peak and average runoff reduction increases with green roof soil thickness. However, even though thickness highly influences the runoff reduction, it is not cost-effective or feasible to increase the thickness beyond a certain threshold. Other parameters such as conductivity should be optimized instead. An optimal hydraulic conductivity for peak runoff reduction is found to increase with the return period. However, conductivity has a minimal effect on average runoff reduction. There are some limitations of this study (e.g., the assumption of constant evapotranspiration data within each month for Hong Kong and yearly constant for Sydney and Beltsville) which future studies could improve on.

Author Contributions

Conceptualization, T.F.M.C. and X.L.; methodology, X.L.; validation, X.L.; formal analysis, X.L.; investigation, X.L.; writing—original draft preparation, X.L.; writing—review and editing, T.F.M.C.; supervision, T.F.M.C.; funding acquisition, T.F.M.C.

Funding

Public Policy Research Funding Scheme 2014/15 (Project code 2014.A8.016.14C) of Central Policy Unit, Hong Kong.

Conflicts of Interest

The authors declare no conflict of interest.

References

  1. Meshgi, A.; Schmitter, P.; Chui, T.F.M.; Babovic, V. Development of a modular streamflow model to quantify runoff contributions from different land uses in tropical urban environments using Genetic Programming. J. Hydrol. 2015, 525, 711–723. [Google Scholar] [CrossRef]
  2. Bhaskar, A.S.; Beesley, L.; Burns, M.J.; Fletcher, T.D.; Hamel, P.; Oldham, C.E.; Roy, A.H. Will it rise or will it fall? Managing the complex effects of urbanization on base flow. Freshw. Sci. 2016, 35, 293–310. [Google Scholar] [CrossRef]
  3. Townshend, D. Study on Green Roof Application in Hong Kong; Architectural Services Department: Hong Kong, China, 2007. [Google Scholar]
  4. Paterson, D.A.; Grannis, P. New York State Stormwater Management Design Manual; Center for Watershed Protection: Ellicott City, MD, USA, 2010. [Google Scholar]
  5. Hui, S.C. Technical Guidelines for Green Roofs Systems in Hong Kong; Department of Mechanical Engineering, The University of Hong Kong: Hong Kong, China, 2011. [Google Scholar]
  6. Hathaway, A.M.; Hunt, W.F.; Jennings, G.D. A field study of green roof hydrologic and water quality performance. Trans. ASABE 2008, 51, 37–44. [Google Scholar] [CrossRef]
  7. Hilten, R.N.; Lawrence, T.M.; Tollner, E.W. Modeling stormwater runoff from green roofs with HYDRUS-1D. J. Hydrol. 2008, 358, 288–293. [Google Scholar] [CrossRef]
  8. Berndtsson, J.C. Green roof performance towards management of runoff water quantity and quality: A review. Ecol. Eng. 2010, 36, 351–360. [Google Scholar] [CrossRef]
  9. Mentens, J.; Raes, D.; Hermy, M. Green roofs as a tool for solving the rainwater runoff problem in the urbanized 21st century? Landsc. Urban Plan. 2006, 77, 217–226. [Google Scholar] [CrossRef]
  10. Sharma, A.; Conry, P.; Fernando, H.J.S.; Hamlet, A.F.; Hellman, J.J.; Chen, F. Green and cool roofs to mitigate urban heat island effects in the Chicago metropolitan area: Evaluation with a regional climate model. Environ. Res. Lett. 2016, 11, 064004. [Google Scholar] [CrossRef]
  11. Song, J.; Wang, Z.H.; Wang, C. The regional impact of urban heat mitigation strategies on planetary boundary layer dynamics over a semiarid city. J. Geophys. Res. Atmos. 2018, 123, 6410–6422. [Google Scholar] [CrossRef]
  12. Stovin, V.R.; Moore, S.L.; Wall, M.; Ashley, R.M. The potential to retrofit sustainable drainage systems to address combined sewer overflow discharges in the Thames Tideway catchment. Water Environ. J. 2013, 27, 216–228. [Google Scholar] [CrossRef]
  13. Trinh, D.H.; Chui, T.F.M. Assessing the hydrologic restoration of an urbanized area via an integrated distributed hydrological model. Hydrol. Earth Syst. Sci. 2013, 17, 4789–4801. [Google Scholar] [CrossRef]
  14. Scholz-Barth, K. Green roofs: Stormwater management from the top down. Environ. Des. Constr. 2001, 4, 63–69. [Google Scholar]
  15. Villarreal, E.L.; Bengtsson, L. Response of a Sedum green-roof to individual rain events. Ecol. Eng. 2005, 25, 1–7. [Google Scholar] [CrossRef]
  16. Carter, T.L.; Rasmussen, T.C. Hydrologic behavior of vegetated roofs. JAWRA J. Am. Water Resour. Assoc. 2006, 42, 1261–1274. [Google Scholar] [CrossRef]
  17. Gregoire, B.G.; Clausen, J.C. Effect of a modular extensive green roof on stormwater runoff and water quality. Ecol. Eng. 2011, 37, 963–969. [Google Scholar] [CrossRef]
  18. Teemusk, A.; Mander, Ü. Rainwater runoff quantity and quality performance from a greenroof: The effects of short-term events. Ecol. Eng. 2007, 30, 271–277. [Google Scholar] [CrossRef]
  19. Blank, L.; Vasl, A.; Levy, S.; Grant, G.; Kadas, G.; Dafni, A.; Blaustein, L. Directions in green roof research: A bibliometric study. Build. Environ. 2013, 66, 23–28. [Google Scholar] [CrossRef]
  20. Versini, P.A.; Ramier, D.; Berthier, E.; Gouvello, B.D. Assessment of the hydrological impacts of green roof: From building scale to basin scale. J. Hydrol. 2015, 524, 562–575. [Google Scholar] [CrossRef]
  21. Simmons, M.T.; Gardiner, B.; Windhager, S.; Tinsley, J. Green roofs are not created equal: The hydrologic and thermal performance of six different extensive green roofs and reflective and non-reflective roofs in a sub-tropical climate. Urban Ecosyst. 2008, 11, 339–348. [Google Scholar] [CrossRef]
  22. Yang, J.; Wang, Z.H. Physical parameterization and sensitivity of urban hydrological models: Application to green roof systems. Build. Environ. 2014, 75, 250–263. [Google Scholar] [CrossRef]
  23. Sun, T.; Bou-Zeid, E.; Wang, Z.H.; Zerba, E.; Ni, G.H. Hydrometeorological determinants of green roof performance via a vertically-resolved model for heat and water transport. Build. Environ. 2013, 60, 211–224. [Google Scholar] [CrossRef]
  24. She, N.; Pang, J. Physically based green roof model. J. Hydrol. Eng. 2009, 15, 458–464. [Google Scholar] [CrossRef]
  25. Palla, A.; Gnecco, I.; Lanza, L.G. Compared performance of a conceptual and a mechanistic hydrologic models of a green roof. Hydrol. Process. 2012, 26, 73–84. [Google Scholar] [CrossRef]
  26. Vesuviano, G.; Sonnenwald, F.; Stovin, V. A two-stage storage routing model for green roof runoff detention. Water Sci. Technol. 2014, 69, 1191–1197. [Google Scholar] [CrossRef] [PubMed]
  27. Rossman, L.A. Storm Water Management Model User’s Manual, version 5.1; National Risk Management Research Laboratory, Office of Research and Development: Cincinnati, OH, USA, 2015. [Google Scholar]
  28. Chui, T.F.M.; Liu, X.; Zhan, W. Assessing cost-effectiveness of specific LID practice designs in response to large storm events. J. Hydrol. 2016, 533, 353–364. [Google Scholar] [CrossRef]
  29. Wong, G.K.L.; Jim, C.Y. Quantitative hydrologic performance of extensive green roof under humid-tropical rainfall regime. Ecol. Eng. 2014, 70, 366–378. [Google Scholar] [CrossRef]
  30. Hong Kong Observatory, the Government of the Hong Kong Special Administrative Region. 2015. Available online: http://www.hko.gov.hk/contente.htm (accessed on 10 October 2015).
  31. NOAA’s National Centers for Environmental Information. 2015. Available online: http://www.ncdc.noaa.gov/ (accessed on 10 October 2015).
  32. Jayawardena, A.W. Calibration of some empirical equations for evaporation and evapotranspiration in Hong Kong. Agric. For. Meteorol. 1989, 47, 75–81. [Google Scholar] [CrossRef]
  33. Sanford, W.E.; Selnick, D.L. Estimation of evapotranspiration across the conterminous United States using a regression with climate and land-cover data. JAWRA J. Am. Water Resour. Assoc. 2013, 49, 217–230. [Google Scholar] [CrossRef]
  34. Hakimdavar, R.; Culligan, P.J.; Finazzi, M.; Barontini, S.; Ranzi, R. Scale dynamics of extensive green roofs: Quantifying the effect of drainage area and rainfall characteristics on observed and modeled green roof hydrologic performance. Ecol. Eng. 2014, 73, 494–508. [Google Scholar] [CrossRef]
  35. Stovin, V.; Vesuviano, G.; Kasmin, H. The hydrological performance of a green roof test bed under UK climatic conditions. J. Hydrol. 2012, 414, 148–161. [Google Scholar] [CrossRef]
Figure 1. Conceptual model of green roof in SWMM. Modified from Chui et al. [28].
Water 11 00815 g001
Figure 2. Simulated and measured values of green roof runoff during model (a) calibration and (b) verification.
Water 11 00815 g002
Figure 3. Precipitation (P) and green roof runoff (R) in storms with different return periods. Figure 3(a) and (b) show the peak and average values, respectively. HK, B and S stand for Hong Kong, Beltsville and Sidney, respectively.
Water 11 00815 g003
Figure 4. Annual peak runoff reduction during storms with different return periods, given in terms of (a) amount and (b) percentage.
Water 11 00815 g004
Figure 5. Annual average runoff reduction during storms with different return periods, given in terms of (a) amount and (b) percentage.
Water 11 00815 g005
Figure 6. Peak runoff of various green roofs differing in (a) soil thickness (T) and (b) soil hydraulic conductivity (K). The conductivity in (a) is 100 mm/h, and the thickness in (b) is 300 mm.
Water 11 00815 g006
Figure 7. Average runoff of various green roofs differing in (a) soil thickness (T) and (b) soil hydraulic conductivity (K). The conductivity in (a) is 100 mm/h, and the thickness in (b) is 300 mm.
Water 11 00815 g007
Table 1. Parameters of the calibrated green roof model.
LayerParameterValue
SurfaceBerm height (mm)14
Vegetation (volume fraction)0 2
Surface roughness (Manning’s n)0.1
Surface slope (%)2 1
SoilThickness (mm)40 1
Porosity (volume fraction)0.4 1
Field capacity (volume fraction)0.2
Wilting point (volume fraction)0.1
Conductivity (mm/h)15
Conductivity slope10
Suction head (mm)87.5
Drainage matThickness (mm)40 1
Void fraction0.8 1
Roughness (Manning’s n)0.1
1 Values directly extracted from Wong and Jim [29]. Other parameter values obtained through model calibration. 2 This is the fraction of storage volume above the surface that is filled with vegetation. Normally, it can be ignored, but may be as high as 0.1 to 0.2 for very dense vegetative growth [27]. It is ignored in this research as thickness and conductivity are the main factors to be studied.
Table 2. General climatic characteristics of Hong Kong, Beltsville and Sidney.
CityClimateAnnual Average Precipitation (mm)Annual Average Evapotranspiration (mm)
Hong KongHumid subtropical23501123
BeltsvilleHumid subtropical1020655
SidneyHumid subtropical940555

