Article

Understanding the Costs of Inaction–An Assessment of Pluvial Flood Damages in Two European Cities

1
Copernicus Institute for Sustainable Development and Innovation, Utrecht University, Heidelberglaan 2, 3584 CS Utrecht, The Netherlands
2
Nelen & Schuurmans, Zakkendragershof 34-44, 3511 AE Utrecht, The Netherlands
3
KWR Watercycle Research Institute, Groningenhaven 7, 3433 PE Nieuwegein, The Netherlands
*
Author to whom correspondence should be addressed.
Water 2019, 11(4), 801; https://doi.org/10.3390/w11040801
Submission received: 2 April 2019 / Revised: 15 April 2019 / Accepted: 15 April 2019 / Published: 17 April 2019
(This article belongs to the Special Issue The Challenges of Water Management and Governance in Cities)

Abstract

:
Today, over 50% of the global population lives near water. Due to population growth, ongoing economic development, and extreme weather events, urban areas are growing more susceptible to flood risks, and the costs of inaction of failing to manage flood risks are high. Research into the benefits of pluvial flood-risk management is needed to spread awareness and motivate investments in pluvial flood-risk reduction. So far, such research is lacking. This research therefore assesses pluvial flood damage from a single 60 mm/1-h rainfall event in the cities of Rotterdam and Leicester using 3Di flood modelling and the flood damage estimation tool (waterschadeschatter; WSS). The results demonstrate that potential pluvial flood damages exceed €10 million in each city. From this research, inhabitants and authorities of Leicester and Rotterdam can learn that preparing for upcoming pluvial floods can save millions of euros resulting from future damages. The application of these tools also makes clear that data availability is a highly relevant bottleneck to the pluvial flood damage assessment process. By addressing data shortages, flood damage estimates can be strengthened, which improves decision support and enhances the chance actions are taken in reducing pluvial flood risks.

1. Introduction

Throughout history, cities have sprouted in proximity to freshwater sources, as water is vital for drinking, agriculture, transportation and domestic use [1]. However, due to urban expansion and climate change, cities are growing increasingly prone to floods with serious socio-economic and environmental consequences. Flooding is the number one most frequently occurring natural disaster, causing over $20 billion in economic damage and claiming over 3300 lives worldwide in 2017 [2]. In Europe, annual flood losses are expected to increase five-fold by 2050 and as much as seventeen-fold by 2080, highlighting the need for cities to build flood resilience [3,4].
There are various types of floods, for example, river, coastal, groundwater, and pluvial floods, each requiring different techniques to prepare for. Coastal and river floods receive the most attention as they are generally the largest and longest-lasting flood types, while pluvial floods-caused by heavy rainfall that urban drainage systems are unable to cope with-are relatively underrepresented in research [5]. Recent research has suggested that due to the frequent nature of pluvial floods, cumulative direct damage to property from pluvial floods equals or may even exceed damage from river and coastal floods [6]. Continued urbanization accompanied by the intensification of rainfall patterns due to climate change will likely exacerbate pluvial flood risks, so research is needed into how to manage pluvial floods to minimize damage to our economy, environment, and society [6,7].
Financial resources for managing pluvial flood risks are limited, so decision-makers need convincing that investments in flood-risk reduction are worthwhile. The occurrence of a flood disaster is often used as motivation, for example, the city of Copenhagen initiated the Cloudburst Management Plan in response to a July 2011 pluvial flood disaster that cost upwards of €800 million [8]. Such a reactive mindset does little to reduce the cost of the initial flood disaster. The concept of the cost of inaction (COI), defined as the total cost due to climate change in the absence of adaptation and mitigation measures, can be used to present the consequences of disasters that have not yet occurred [9]. By estimating and considering the COI, decision-makers may see that it is costlier to wait than act now to reduce flood risks.
To understand the COI, it is necessary to assess the amount of flood damage that occurs in the absence of any further investments in flood-risk management. Since flooding can cause a wide array of economic, environmental, and societal impacts, a distinction is often made between tangible/intangible and direct/indirect flood damage. Direct damage occurs in the flooded area due to immediate physical contact with floodwater, while indirect damages arise with a time lag or outside the flooded area [9]. For example, if a flooded business halts production, the physical damage to the building and contents within is direct damage, while induced losses to supply and demand suffered later in time outside of the flooded area are indirect. Tangible flood damage is damage to assets that can be easily monetized with a market price, whereas non-market priced damage (e.g., health loss, environmental damage) that cannot be immediately given a monetary value is intangible [10,11]. Some examples are shown below in Figure 1 [10,11,12,13].

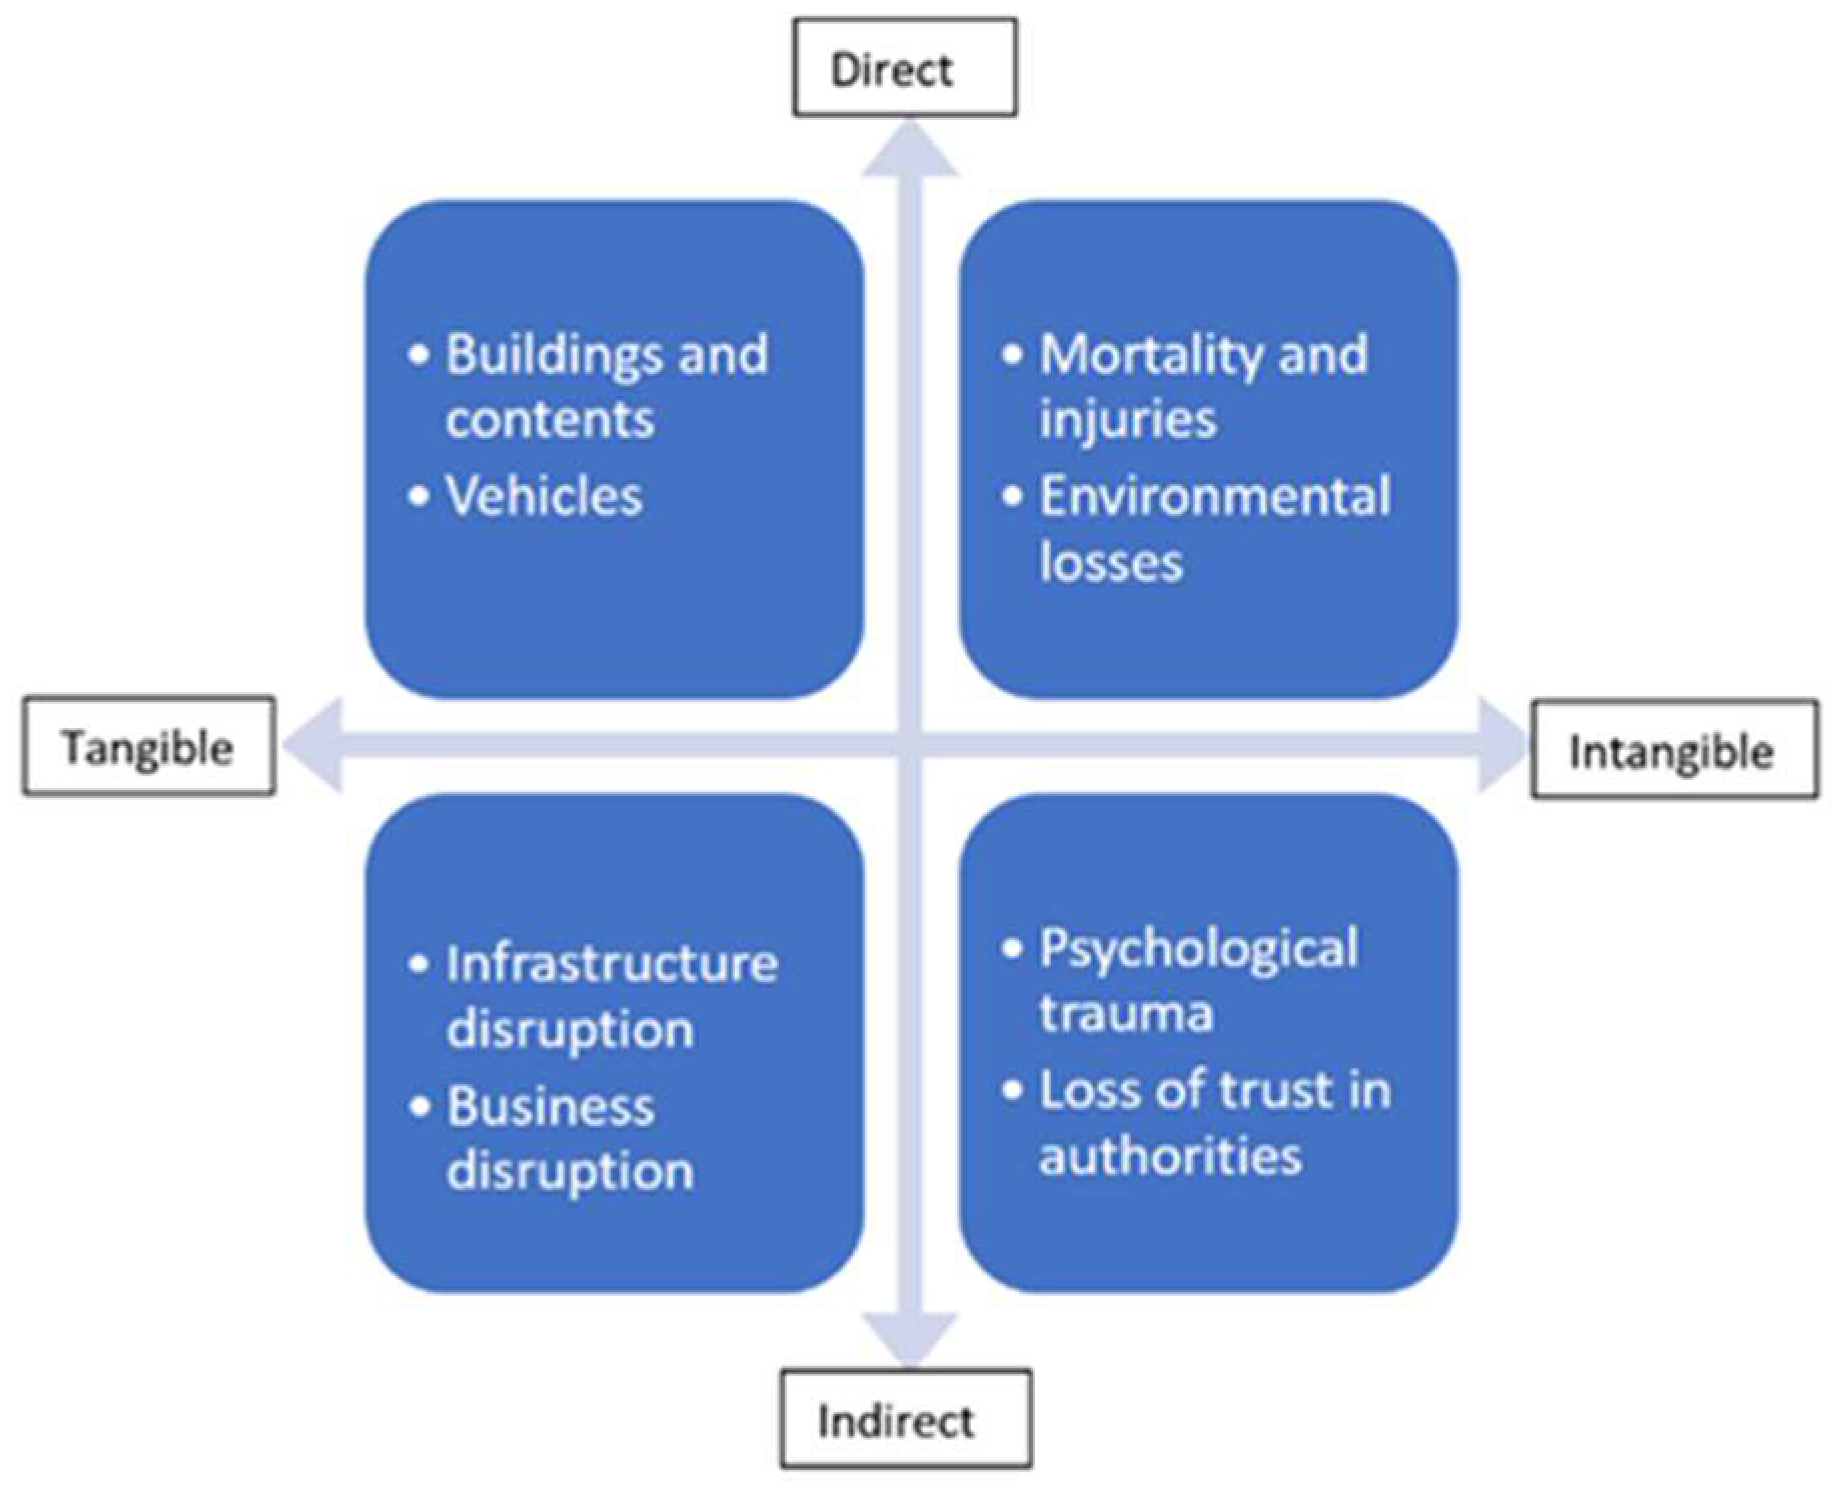
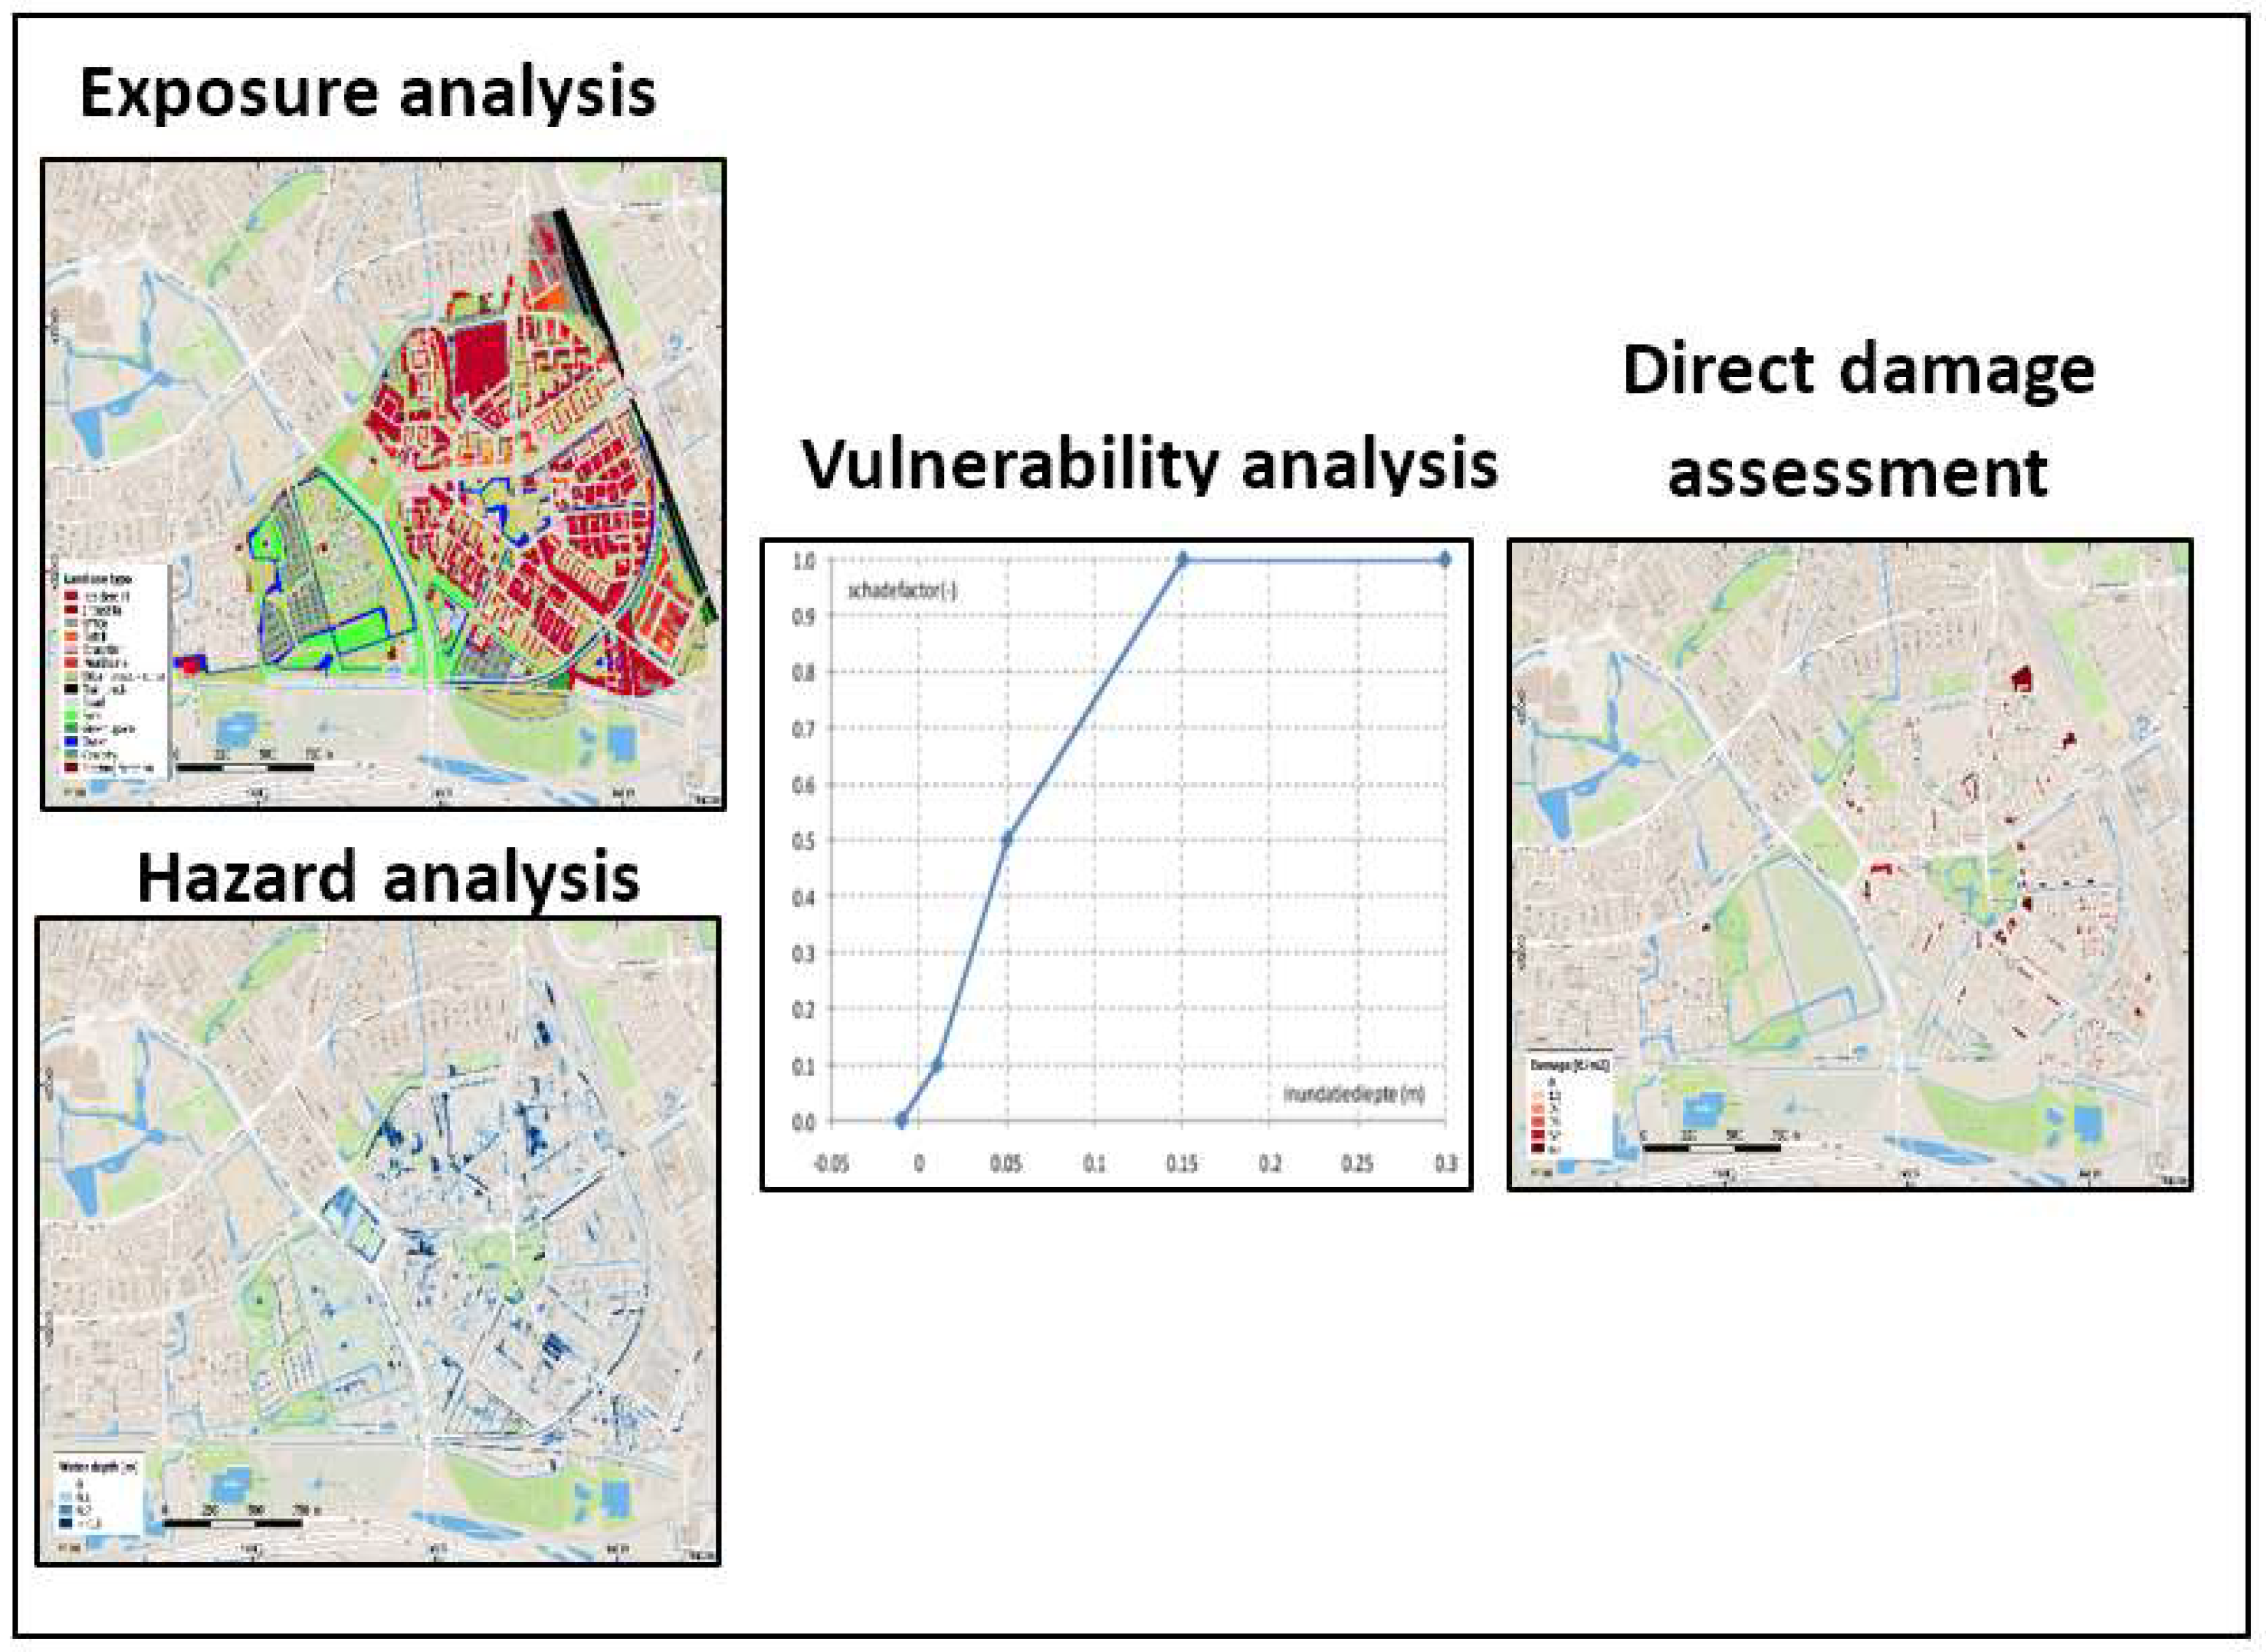
1.1. Direct Damage Assessments

Direct damage to property is considered the dominant type of pluvial flood damage and is the subject of most pluvial flood damage research [7]. This research also focuses on direct pluvial flood damage as such physical damage to structures is the most relevant damage type for densely built urban areas, and there are established assessment methods to draw upon. Potential indirect and intangible pluvial flood impacts are touched upon later in the discussion section.
The common framework for assessing direct flood damage consists of three steps: simulation of the flood hazard (hazard analysis), identification of the types of assets exposed to flooding (exposure analysis), and the translation into monetary flood damage based on the characteristics of the exposed objects (vulnerability analysis). This framework (illustrated below in Figure 2) has mainly been applied to assessments of river and coastal flood damages [14,15,16], but recent studies have used the same methods to assess pluvial flood damage.

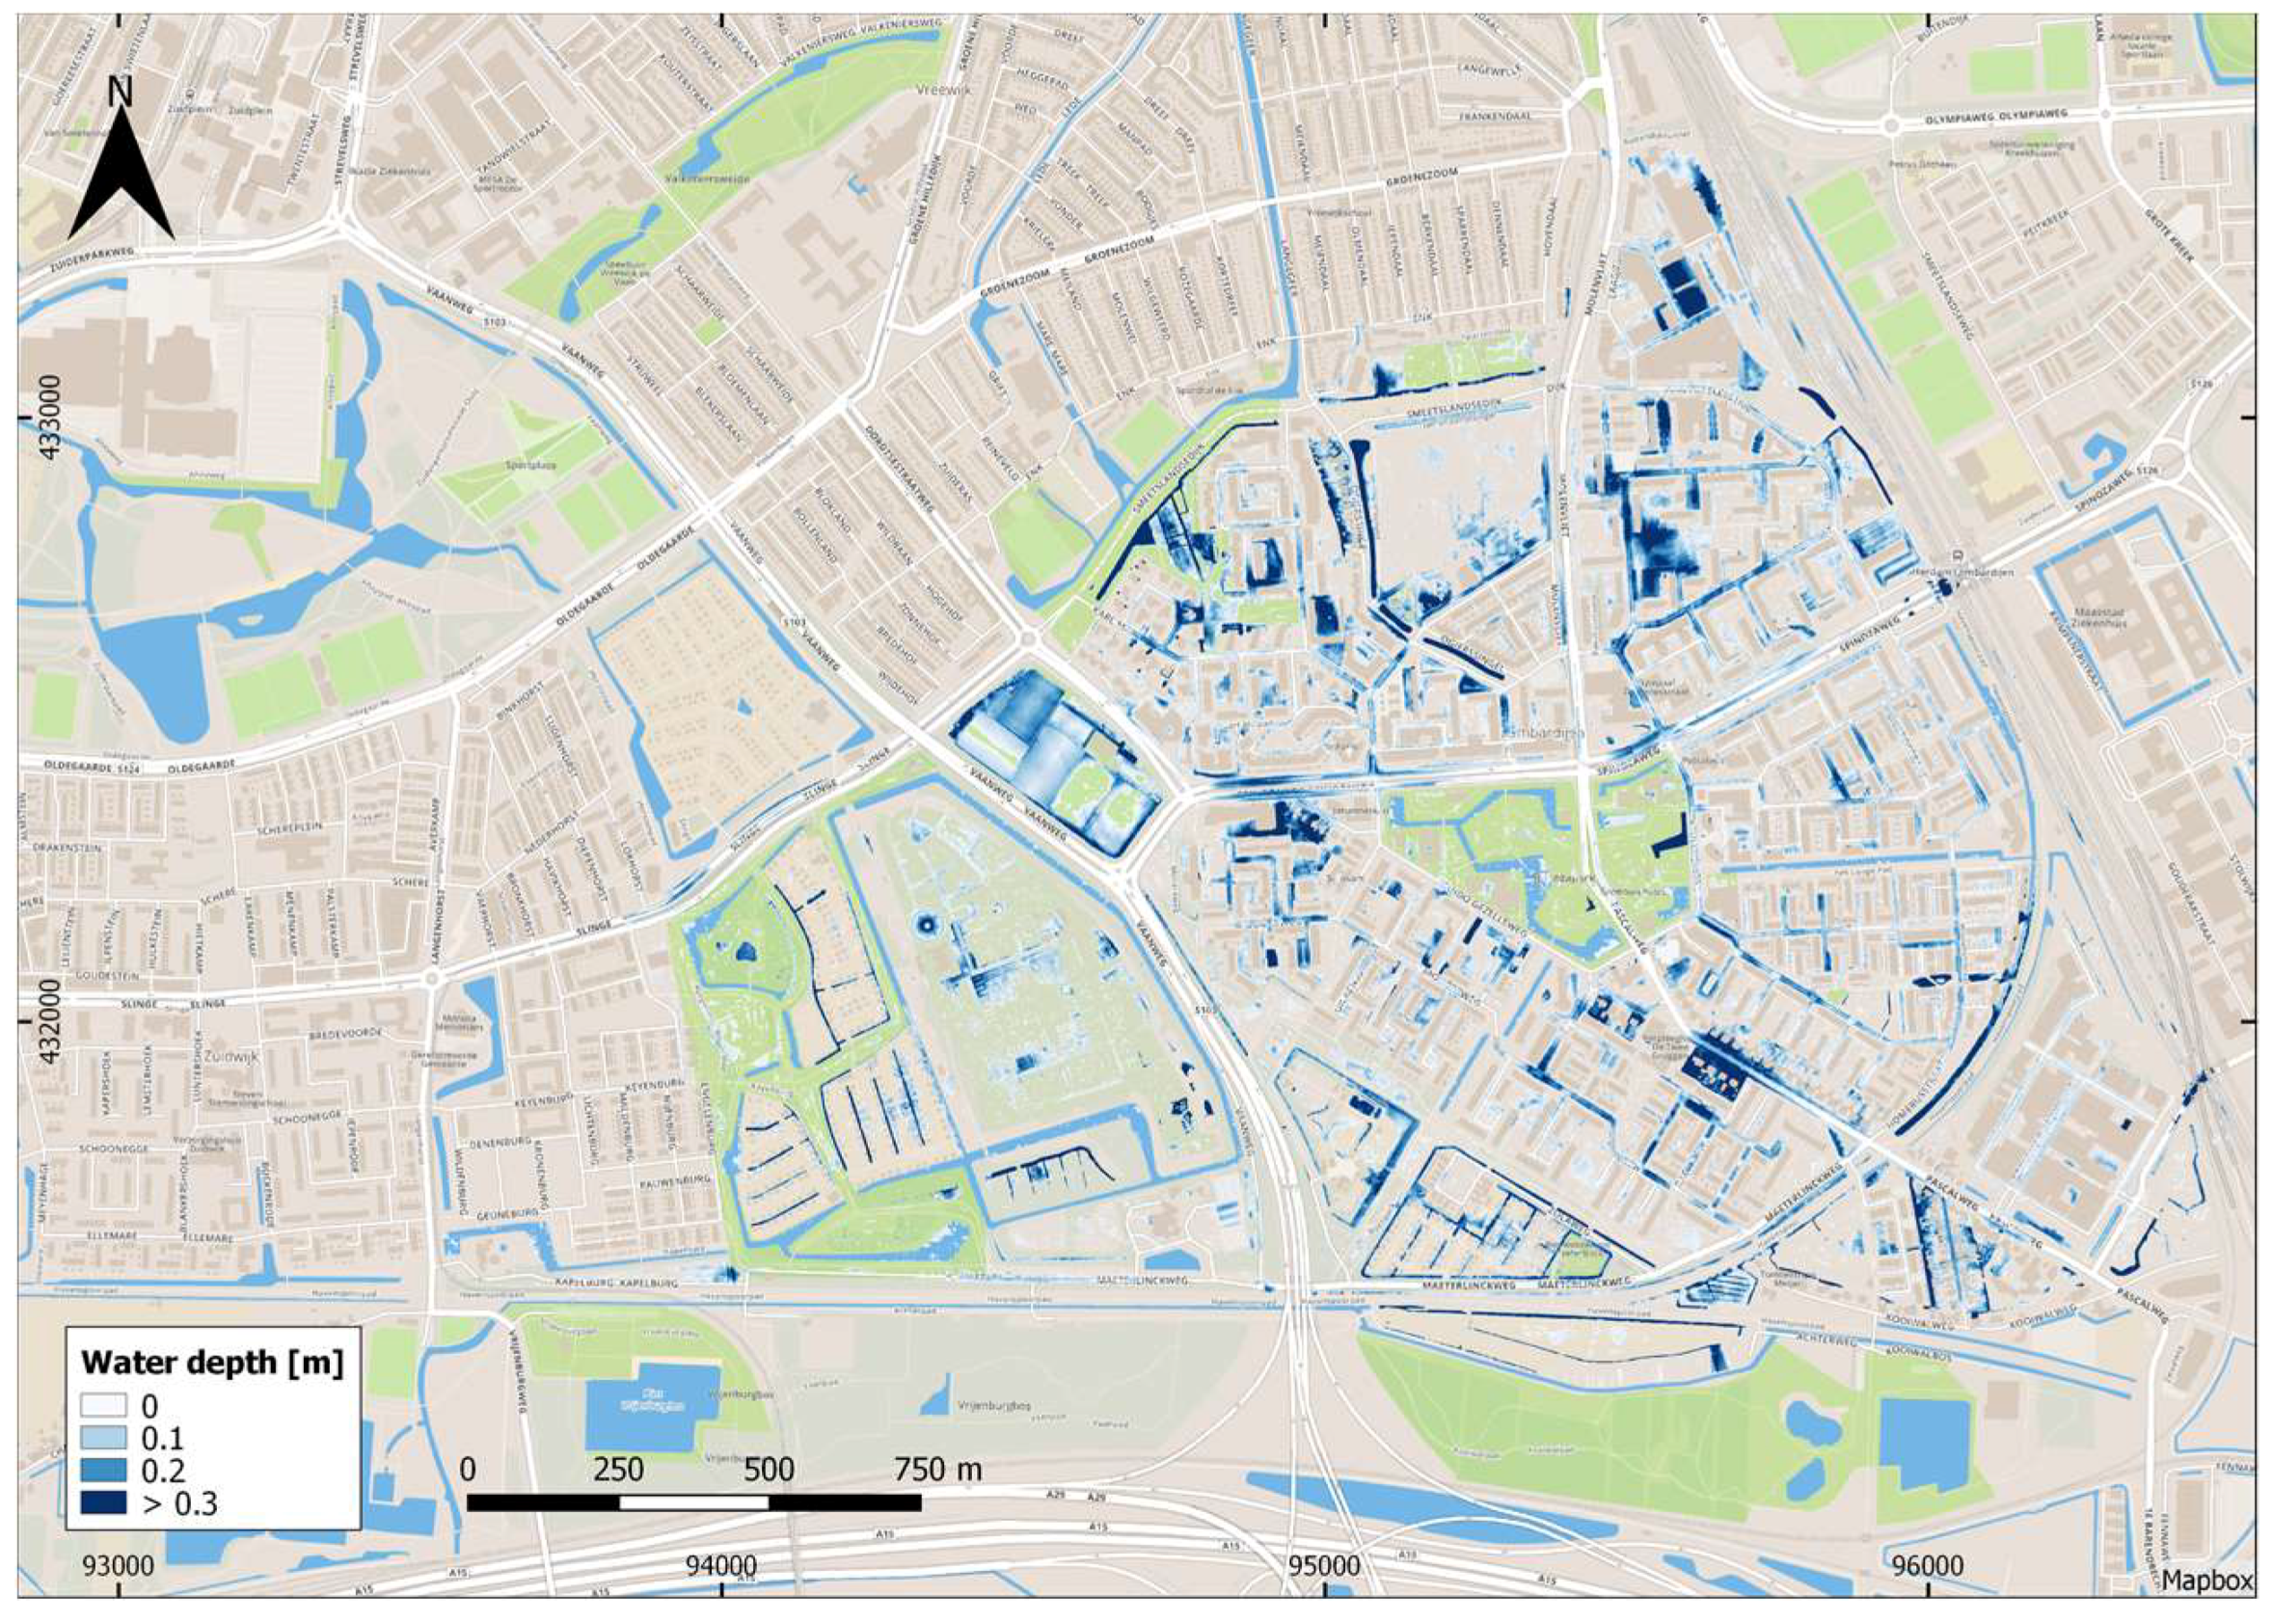
1.1.1. Hazard Analysis

The magnitude of direct flood damage is partly determined by the characteristics of the flood, known as impact parameters. Impact parameters such as flood depth, flood duration, flow velocity, contamination, and rise rate may determine damage to building structure and contents, but such detailed information is often not available about the flood hazard. In practice, the flood depth is the dominant and often only parameter used to represent the flood hazard. This is especially the case for pluvial floods, which usually do not occur over long durations or at high enough flow velocities to incorporate these parameters in the hazard analysis. To simulate pluvial floods, coupled 1D/2D hydrological models, which integrate both 1D sewer flow and 2D surface water flow to solve the shallow water equations, are used [17,18,19]. Despite representing the best option for accounting for realistic drainage processes, these models suffer from data limitations as they require hourly precipitation data and localized information on flow paths, as well as impediments to flow and interactions with drainage components [17,20]. Uncertainties in this process include extreme value statistics used, stationary and homogeneity of data series, consideration of physical properties (e.g., dikes and drainage systems) of a location, and calibration and validation of model output etc. [20,21]. As complete data are not always available, GIS-based digital elevation models (DEM) can be used to approximate pluvial flood flow [17].

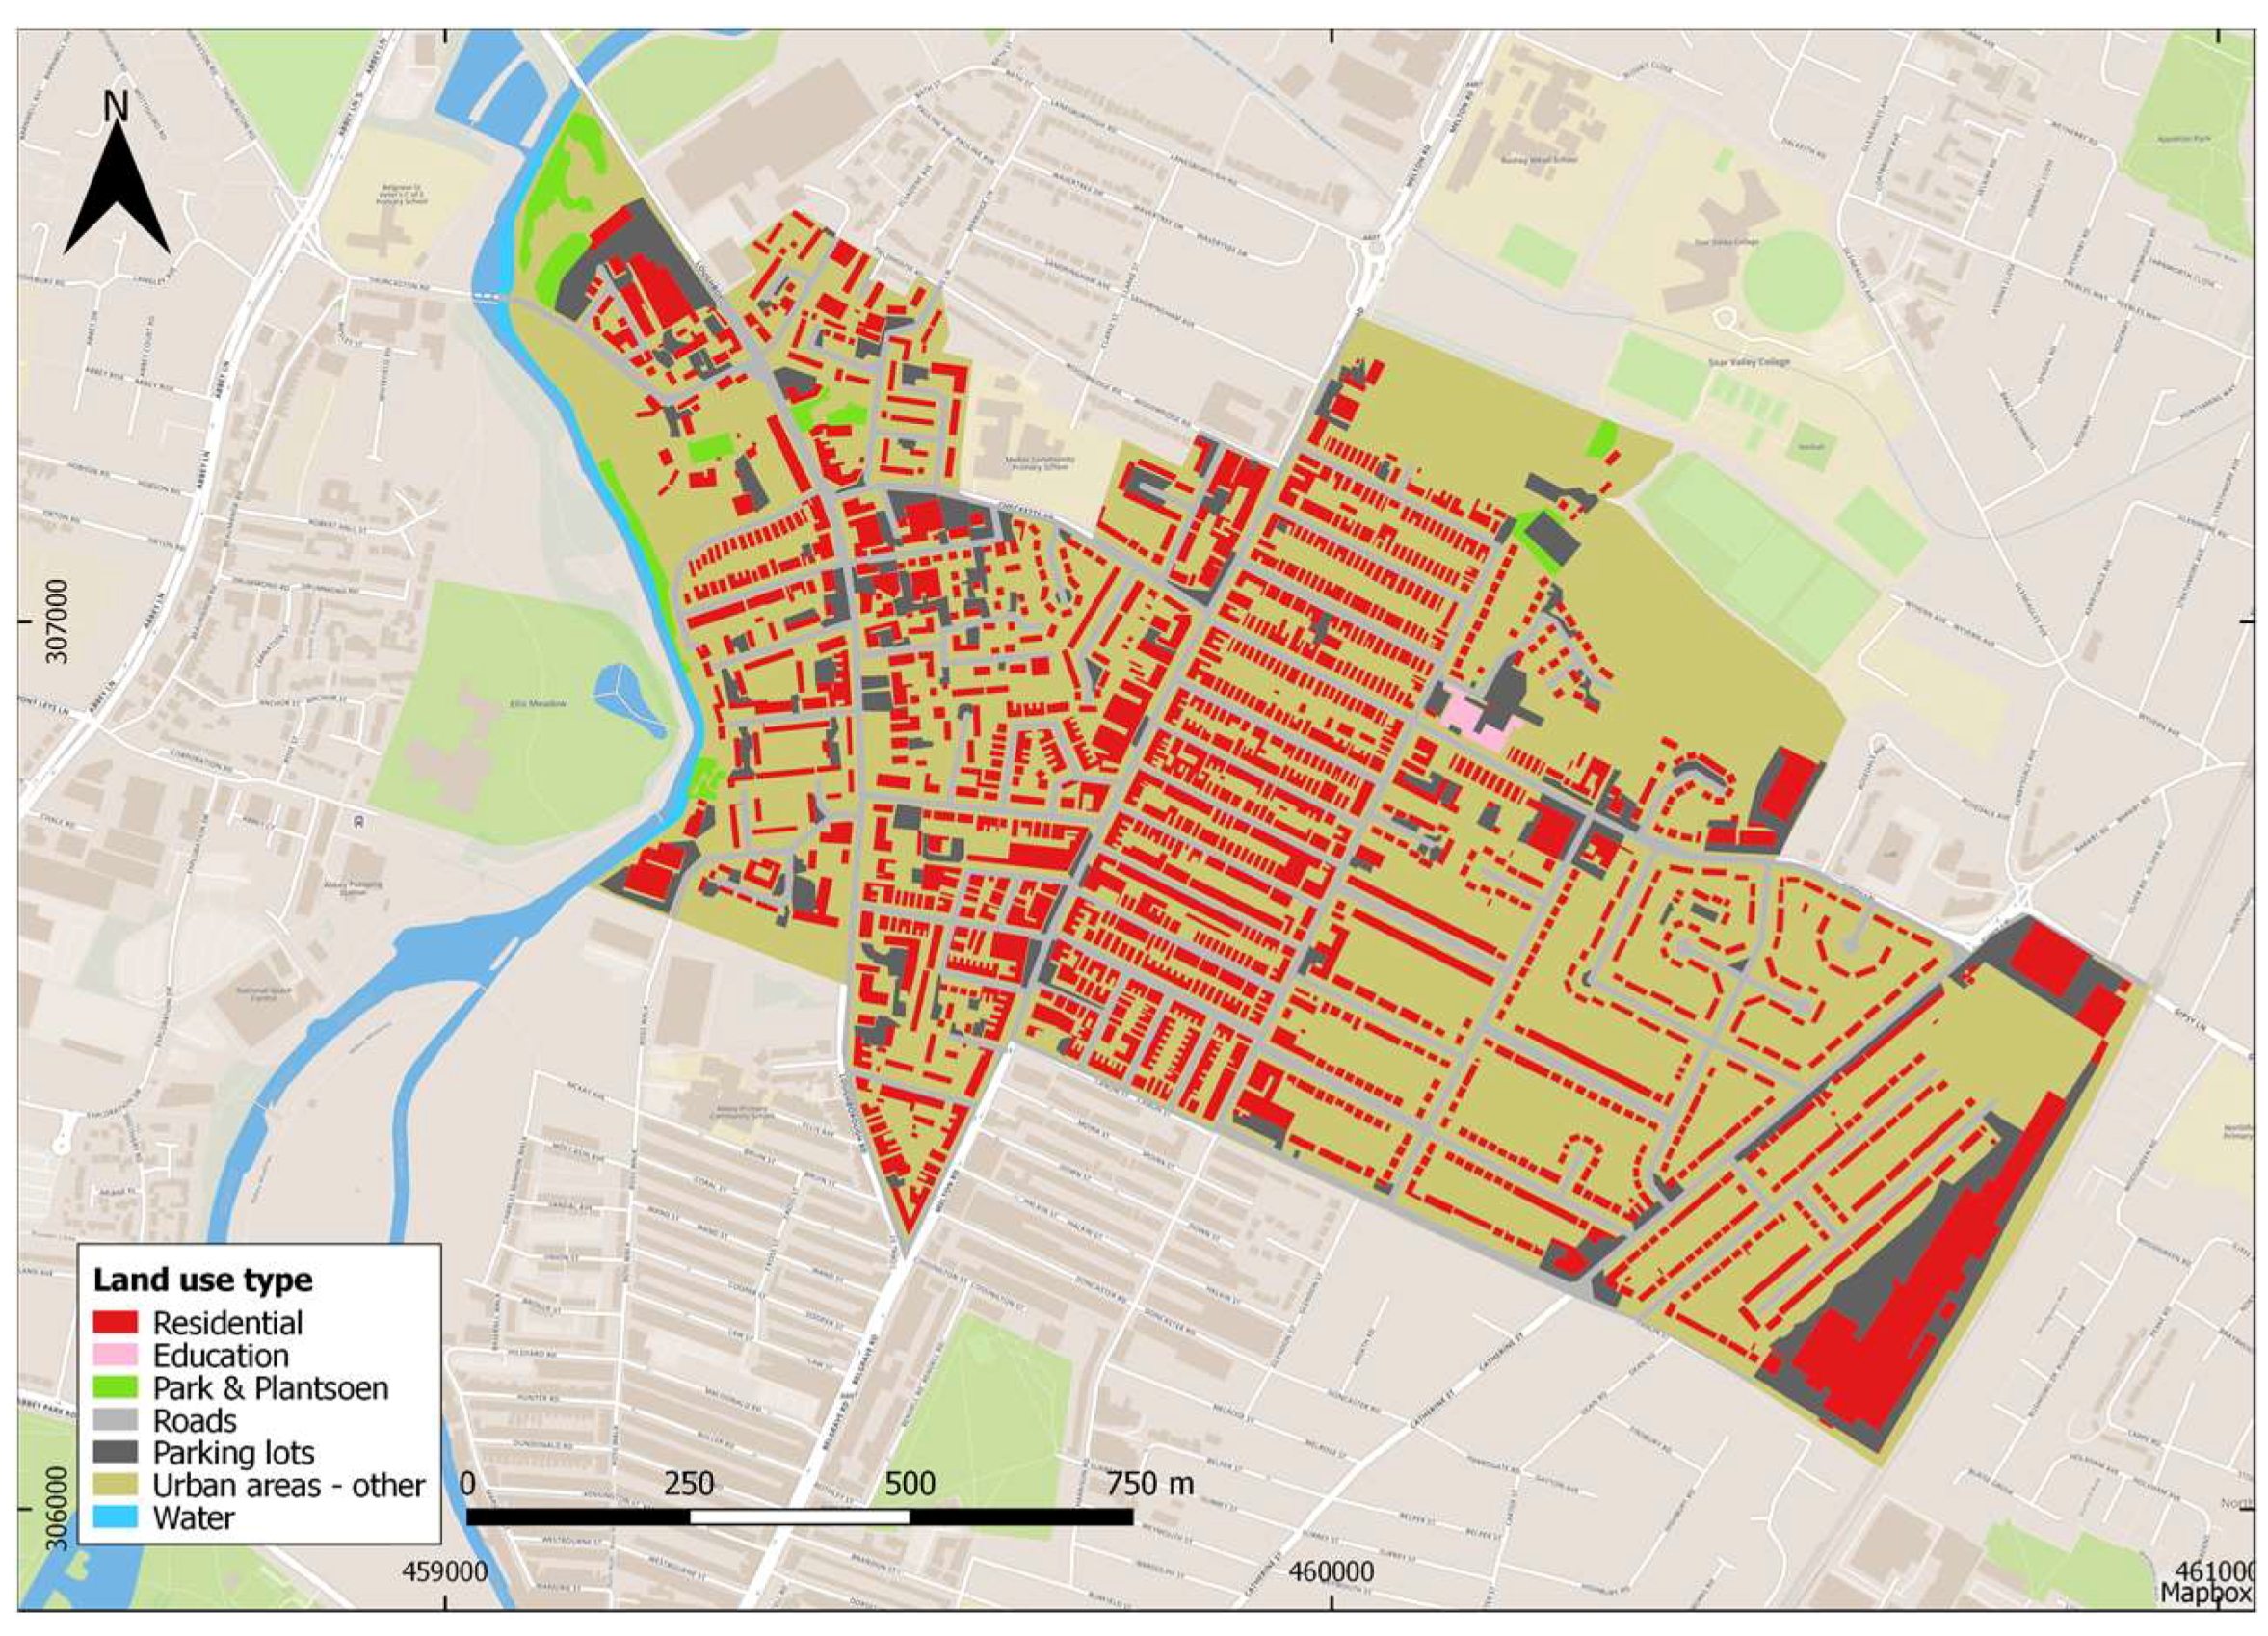
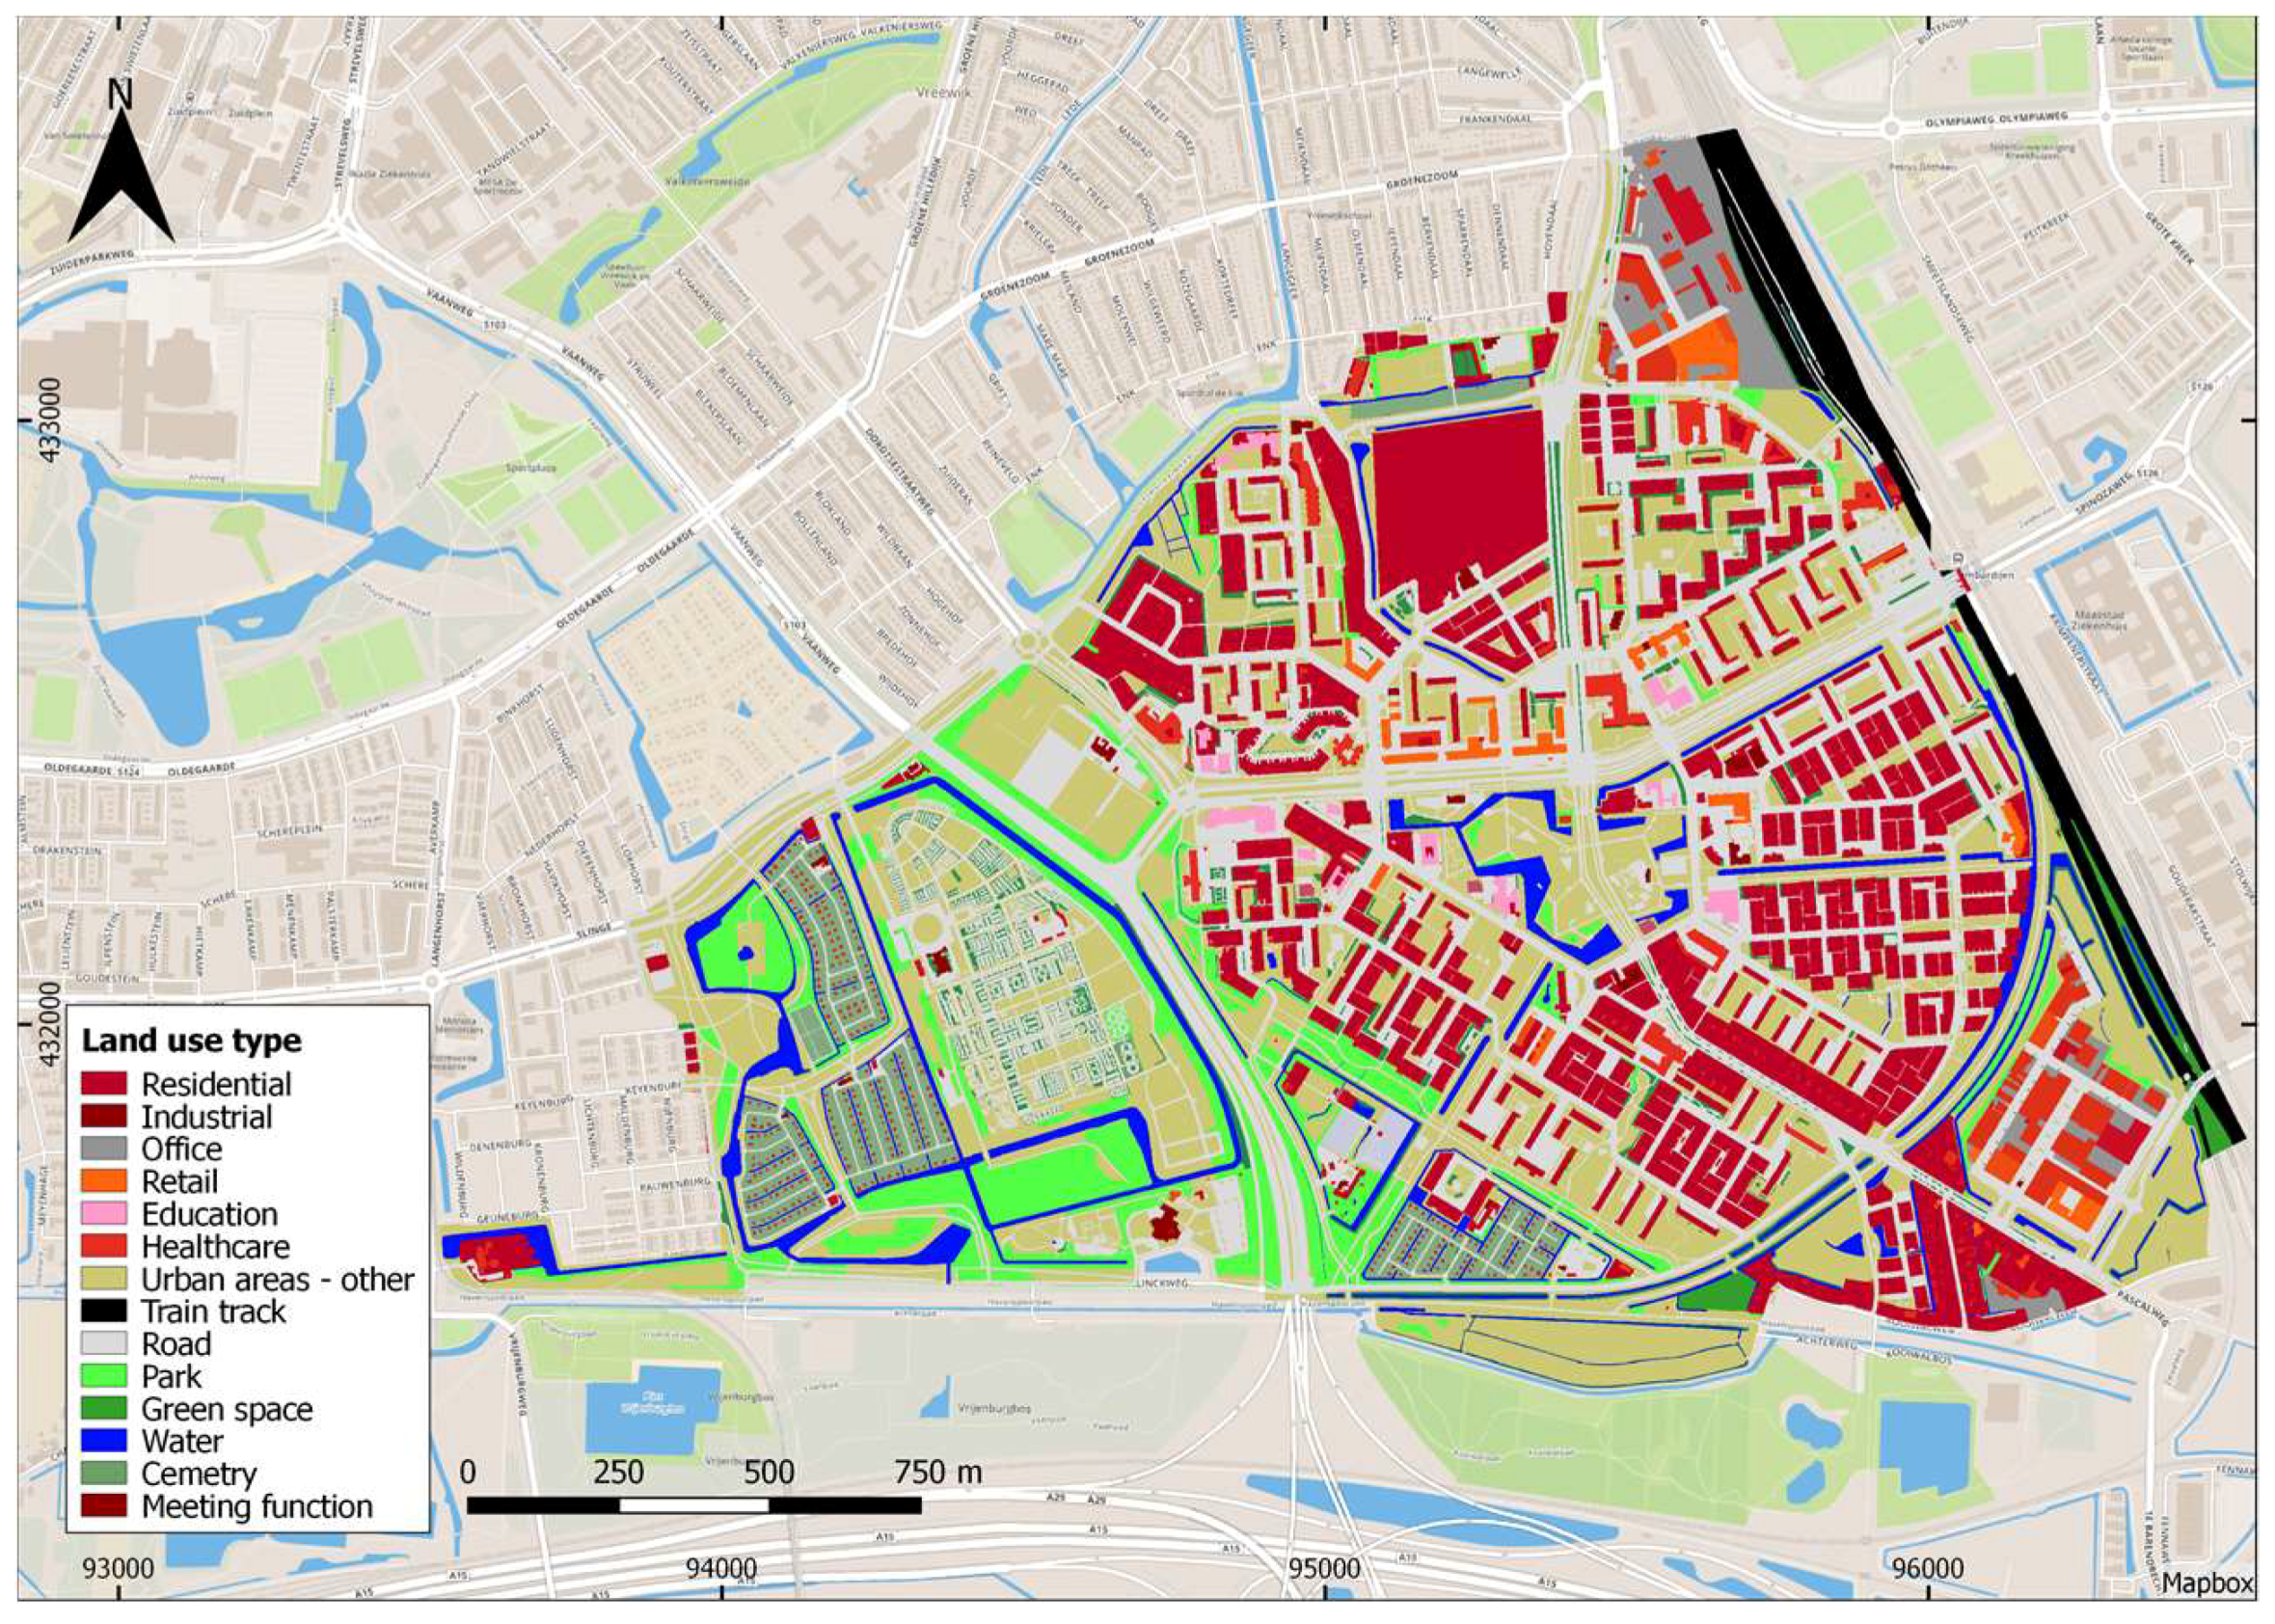
1.1.2. Exposure Analysis

Flood exposure could be gauged at the object-level, but there are so many types of assets and buildings that can be exposed to flooding that assets are usually aggregated into groups based on land use classification. For city-wide flood damage assessments, land use maps displaying residential, commercial/industrial, environmental, infrastructural, and other land use/building types are used to group exposed assets. Average asset and content values for each land use type can be surmised using aggregated national or regional statistics, real estate data, or expert consultation to analyze the total value of objects exposed to flooding. However, uncertainty regarding asset types and approximate values can be critical in many cases, especially when models developed for a specific location at a specific time are not validated and transferred across spatial or temporal boundaries [14]. The exposure analysis for pluvial floods can be carried out in the same way as has been established for river and coastal floods, as described in Merz et al. [14].

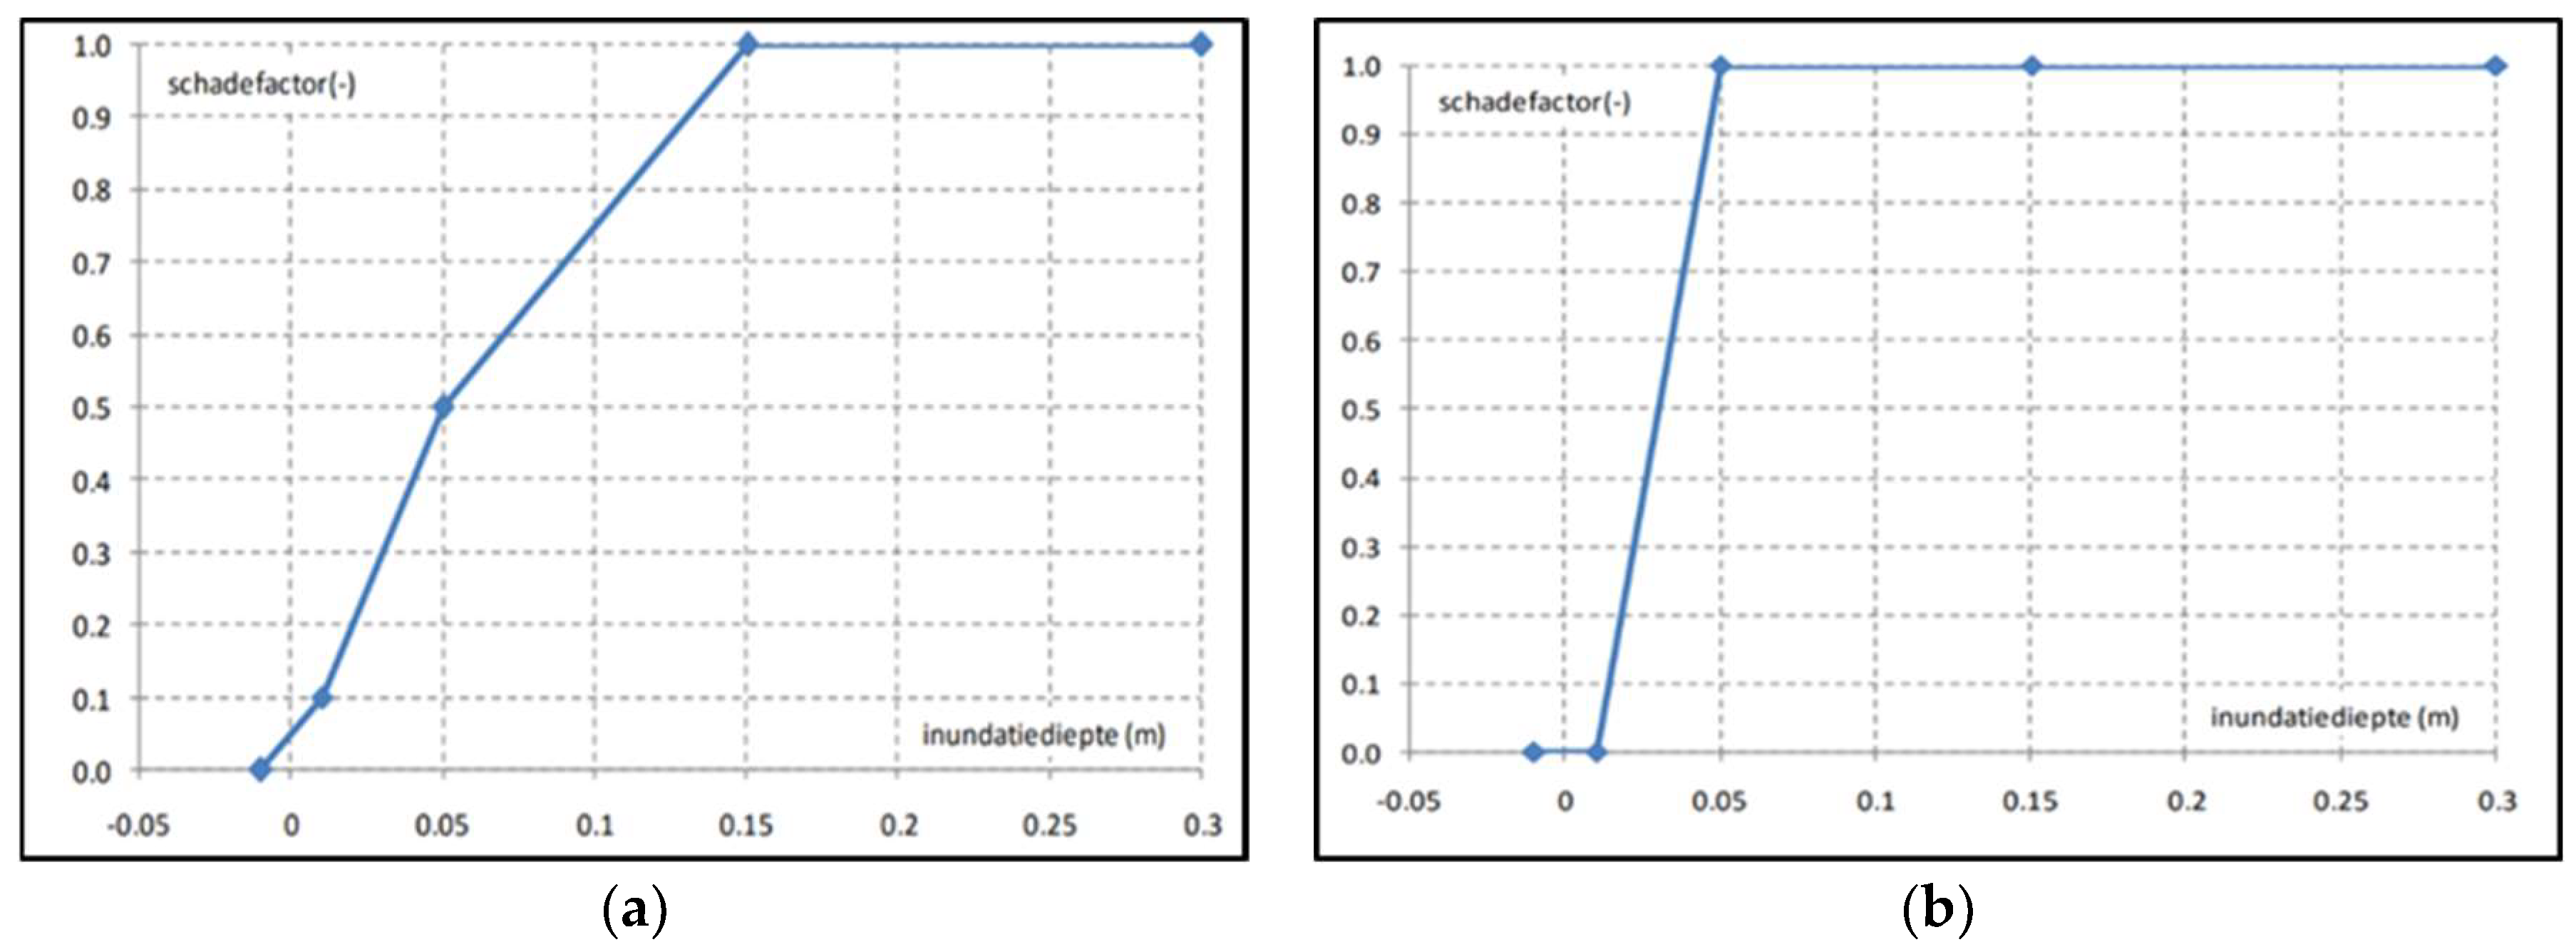
1.1.3. Vulnerability Analysis

A loss model is a central element of flood damage estimation and the most common way of estimating direct damage amount is the use of depth–damage functions, often called susceptibility or vulnerability functions [14,15]. Some loss models are multi-parameter models based on several impact parameters and resistance parameters including building function, type, age, size, presence of mitigation measures, profiles of inhabitants, etc. Prominent examples of multi-parameter flood damage assessment techniques within Europe include the UK multi-colored manual, and German FLEMOps and FLEMOcs models [16,22,23,24,25]. These models were developed specifically for fluvial (river) flood damage assessments, concentrating mainly on damage to residential and commercial buildings. The same damage functions relating fluvial flood depth to monetary damage should not be used for pluvial floods, as flooding from rainfall is dictated by different flow properties and the magnitude of flood damage to building structure and contents is likely different [26]. However, the central idea of a loss model is also applicable to pluvial flood damage assessments, for example, Zhou et al. [7] described a framework for economic pluvial flood risk assessment considering future climate change which quantifies flood risk in monetary terms as expected annual damage in different return periods of rainfall. Susnik et al. [27] used a threshold method in which pluvial flood depths above 30cm are attributed to a fixed damage amount to assess pluvial flood damages from a heavy rainfall event in Eindhoven. Efforts have also been made to relate pluvial flood damage to various parameters based on insurance data or surveys distributed to pluvial flood victims [28,29,30,31,32,33]. Such research is important for distinguishing how parameters other than flood depth, such as preparation, prior flood experience, and presence of mitigation measures, can determine pluvial flood losses. Outcomes of these studies illustrate how non-structural measures, for example, increasing the flood warning times or spreading awareness on how to adequately respond to a flood event, can significantly reduce pluvial flood risks [30,31,32,33]. However, the flood damage assessment models to date contain a number of uncertainties in both the hazard and damage models. The largest sources of uncertainties in damage modelling are associated with prescribed depth–damage functions [11,13,14]. A reason for uncertainty in many loss models is the crude assumption of the relationship between damage and flood depth only. Optimally, other parameters that impact flood damage like building age, presence of basements, and preparedness to respond to flooding would be included in the damage assessment, yet data on these factors are often incomplete [28,34]. There is still a need to develop a stronger understanding of different parameters impacting pluvial flood damage to develop stronger and more rigorous flood damage assessment methods [9,10,30]. Equally important is for decision-makers to recognize the simplifications and uncertainties present in flood damage assessment models, so the results of imperfect damage assessments do not misguide pivotal policy choices in flood-risk management.

1.2. Objective of This Research

In this paper, the process of estimating the COI of urban pluvial flooding is illustrated through pluvial flood damage assessments in two selected European cities. Using a combination of a state-of-the-art flood simulation model and a flood damage estimation tool developed by a consortium of Dutch water companies, flood damages are estimated for a single rainfall event in the cities of Rotterdam (NL) and Leicester (UK). The purpose of this research is two-fold: to illustrate potential flood costs that could arise if these cities fail to prepare for a pluvial flood event, and to shine a light on the key limitations of the flood damage assessment process so decision makers are better prepared to translate results into tangible policy action towards reducing pluvial flood risks. If estimates of the COI are transparent and trustworthy enough, they can be used to convince urban flood-risk managers to reduce flood risks proactively rather than responsively, thus saving the cost of the initial flood disaster [13].
In the next section, the flood damage assessments carried out for neighborhoods in the cities of Leicester (United Kingdom) and Rotterdam (the Netherlands) are described. In Section 3, the results of the flood damage assessments for both study areas are presented, followed by a discussion of the values and limitations of the research in Section 4. This paper finishes with a short summary of the research and concluding remarks in Section 5.

2. Materials and Methods
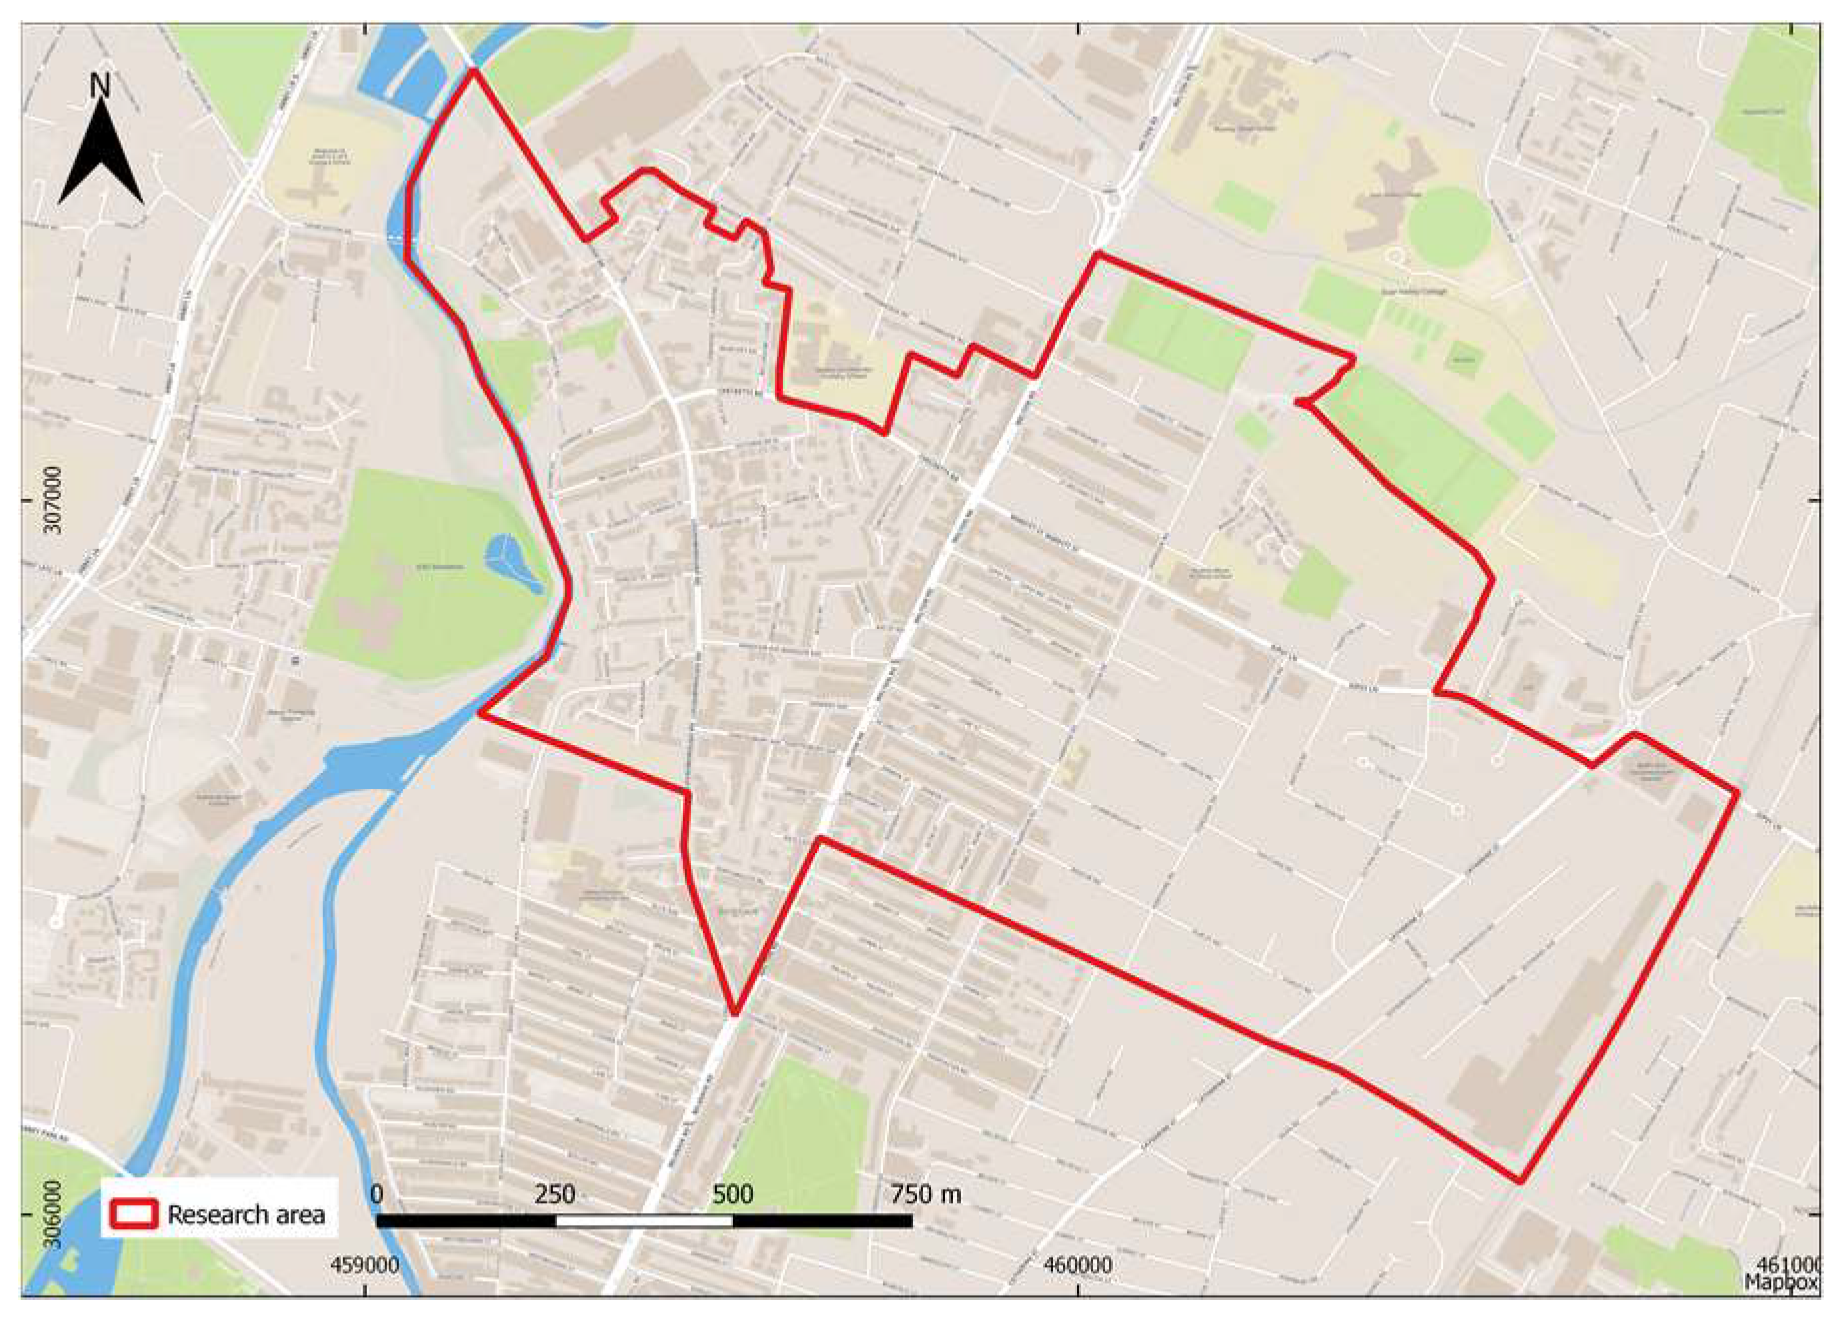
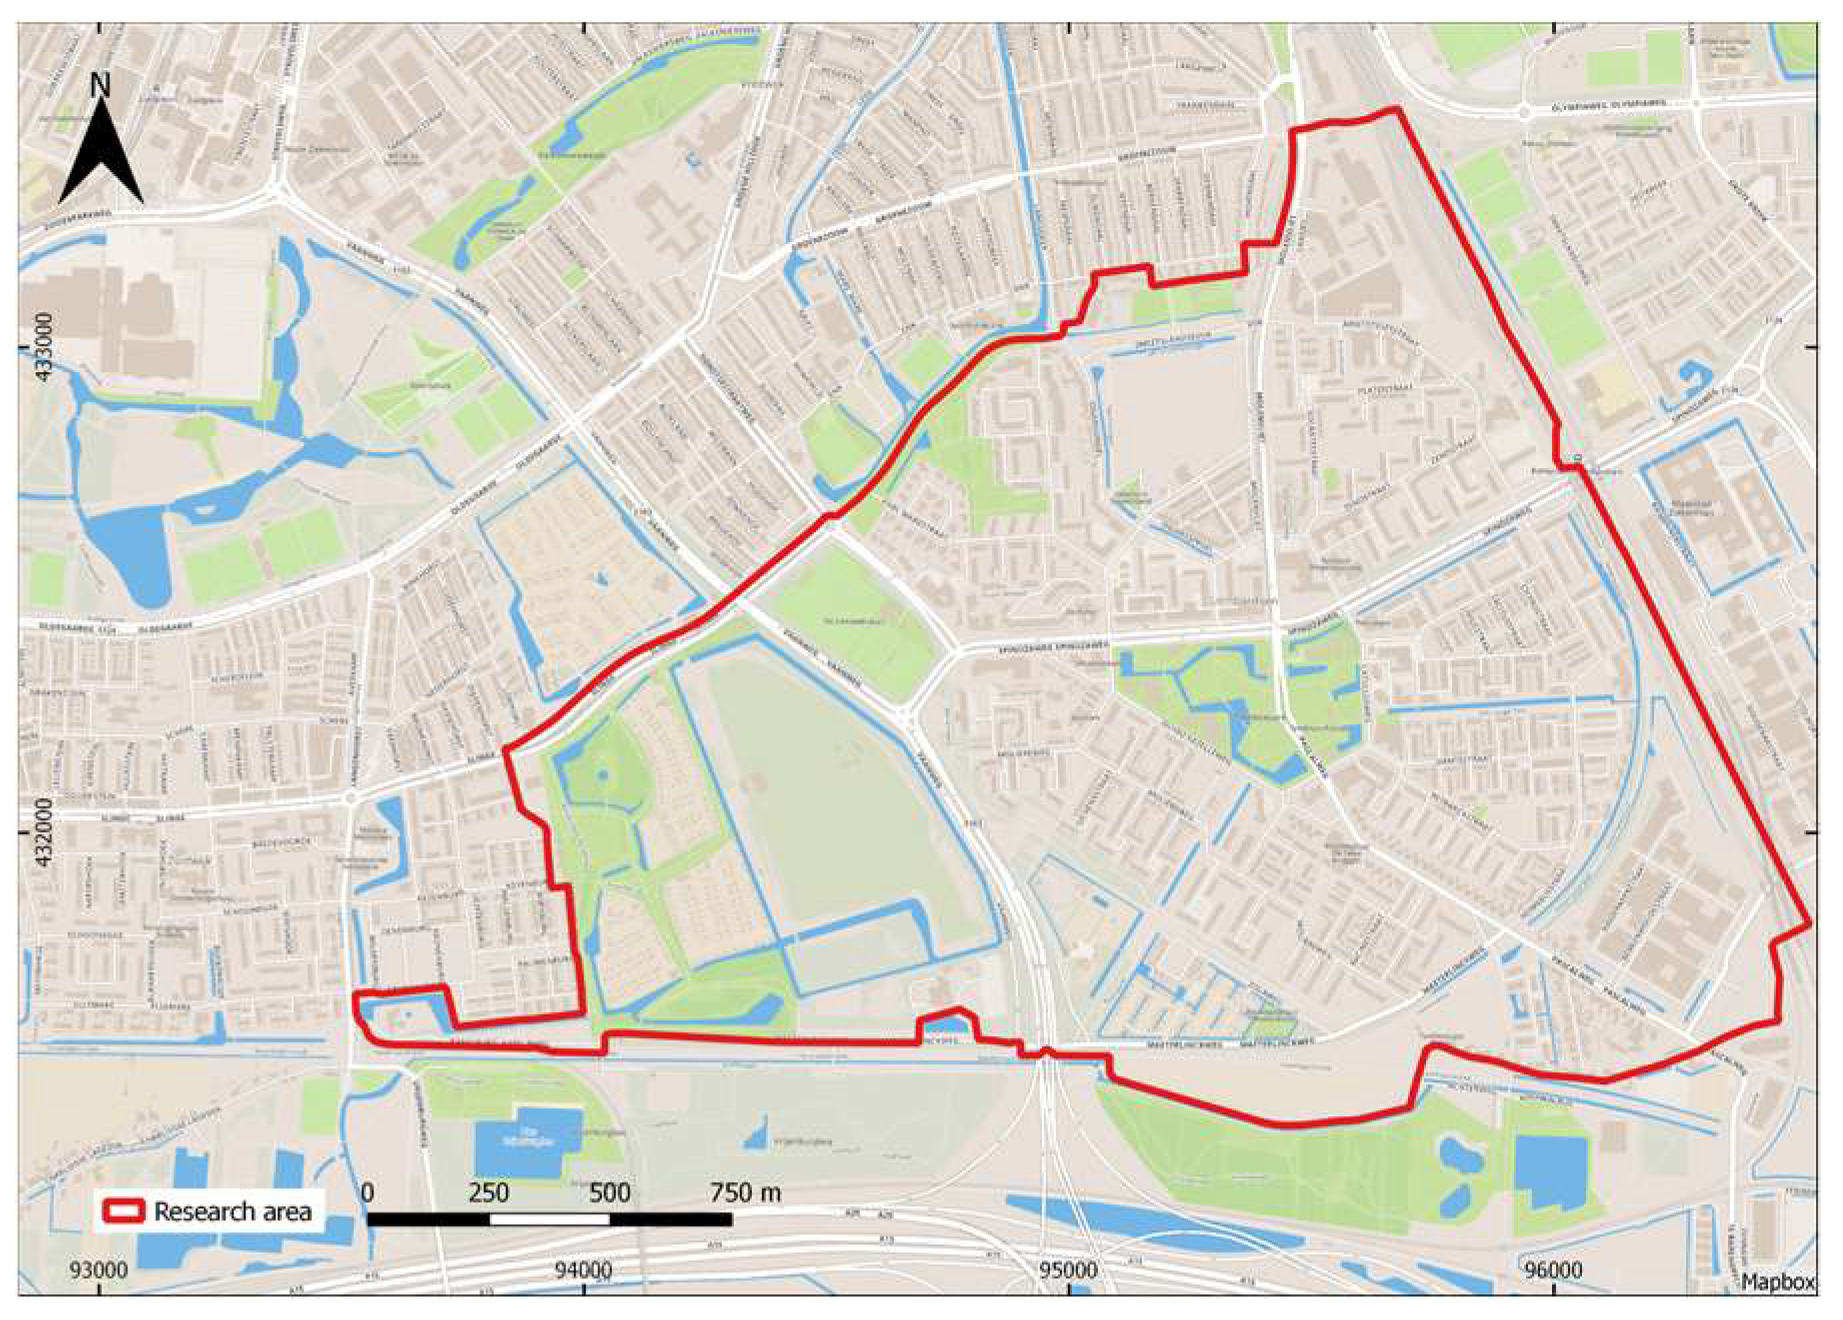
A flood damage assessment is conducted for a 60 mm/h rainfall event (constant rainfall) in Belgrave (Figure 3), a part of Leicester (UK) and Lombardijen (Figure 4), a part of Rotterdam (NL) using 3Di flood modelling software and the Dutch ‘Waterschadeschatter’ (WSS) flood damage assessment tool.

2.1. Study Areas

These areas were both selected for analysis, firstly because they are both low-lying areas that are identified as flood prone [35,36,37,38]. Through consultation with members of the Leicester City Council, Belgrave was identified as a neighborhood especially at risk to pluvial flooding. Belgrave is also of a comparable size, population and climate to Lombardijen, so it is included as a point of comparison for Lombardijen. The Netherlands contains many low-lying, flood-prone areas, but Lombardijen was chosen in particular because of the availability of a pre-calibrated and validated high-quality 3Di model for the area. The use of a high-quality 3Di increases the trust in the results of the 3Di modelling conducted in this research.

2.2. Flood Modelling with 3Di

The 3Di flood modelling software was developed by a combination of Stelling Hydraulics, Deltares, TU Delft, and Nelen & Schuurmans. It is a physically-based model designed to simulate the passage of water through urban areas during flood events. According to Van Dijk [17], the sewer and surface water systems should be coupled in dual drainage models for realistic flood simulations. The governing equations of 3Di can be accessed on the 3Di Water Management website (https://3diwatermanagement.com/3di-start). 3Di flood modeling is used because it represents state-of-the art hydrodynamic modelling. It uses a sub-grid method for 2D surface water flow, 3Di provides fast and accurate results [39]. This is one of the best currently available ways to link 2D surface flow to 1D drainage flow to simulate the process of flooding in urban areas. In the UK, 3Di software is also regarded as one of the best currently available methods for dual drainage modeling based on a benchmark developed last year.
For the Lombardijen study area, data accessed were from AHN2 digital elevation map (DEM) (2008, 25 m2), BAG (building register), TOP10 (topography), OSM (open streetmap), and CBS land use datasets. A map of the urban drainage network was provided by the municipality of Rotterdam. For Belgrave, a soil type map was accessed on the Cranfield Soil and Agriculture Institute website [40], a DEM (2015, 25 m2) was obtained from the UK governmental environmental data online portal [41], and a land use map was created in a GIS environment based on CDRC Open Map Survey data (https://data.cdrc.ac.uk/dataset/cdrc-2015-os-geodata-pack-leicester-e06000016). The parking lots were manually added based on Open Street Map data. In the figures below, the water depth maps developed for Belgrave (Figure 5) and Lombardijen (Figure 6) are displayed. It is important to note that a digital map of the urban drainage system was unavailable for Belgrave because of the privatization of the water supply industry in the UK and concerns regarding confidentiality. Therefore, the interactions between surface water flow and the sewer systems are left out of the Belgrave flood model.
From the figures above, it is visible that the rainfall event causes pooling of water in the fields to the North of Belgrave and in residential areas in the Center/South (Figure 5). In Lombardijen (Figure 6) the water pooling appears more spread out, but there are still significant flood depths over 0.5 m in the Northwest, and just Southeast of the center. To assess flood damage, the water level map (maps above show water depth, water level = water depth + elevation) for each study area is combined with land use information and damage functions in the online WSS damage estimation tool. Below, the land use maps developed for Belgrave (Figure 7) and Lombardijen (Figure 8) are displayed. It should be mentioned that due to difficulties accessing land use and building register information in the UK, the land use classification is less detailed (7 land use classes) in Belgrave than Lombardijen (14 classes).

2.3. Damage Assessment with WSS

The WSS is a freely accessible cloud-based flood damage estimation tool. It is owned by the STOWA consortium of Dutch water companies and was designed to estimate damages from flood depths up to 2.5 m. The flood damage estimation tool can be accessed at the website: https://www.waterschadeschatter.nl/damage/. WSS software was used for this damage estimation because it is a free, entirely web-based tool that does not require heavy computing power which has been developed to estimate pluvial flood damage in the Netherlands. It is simple enough that the functions used to estimate damage can be understood and used to calculate flood damage for areas outside the Netherlands.
Within the Netherlands, the only required input for the WSS is a water level map because land use and DEM data are already included in the WSS tool. With the water level map, the WSS subtracts the DEM to calculate water depth in each grid cell. Land use information is then used to identify the flooded land use classes, and damage functions are applied to relate the flood depth to monetary direct flood damage values for each land use class. Since the WSS is a tool developed for Dutch flood damage assessments, the water level and land use raster with a UK projection cannot be processed by the WSS cloud. Therefore, the damage estimation for Belgrave was conducted using a raster calculator in Python with the default damage functions used in the WSS tool and Lombardijen case study.
After uploading a water level map to the WSS website, the user is asked to select the flood duration (h), recovery time for buildings and roads (h), month of flood event, and whether to use minimum, average, or maximum damage values. In this research of direct damage from a one- hour rainfall event of 60 millimeters, the flood duration was set to one hour, recovery times for buildings and roads were set to zero (direct damage only), the month was set to September, and average damage values were selected. Below, Table 1 and Table 2 display the average damage values for all land use classes considered in the Belgrave and Lombardijen case studies. Figure 9a,b shows the damage functions that were applied for the different land use classes.
Table 1 and Table 2 display the average maximum value that is susceptible to flood damage per m2 of each land use type. Figure 9a,b shows the relative damage curves used to translate water depth to a share of the average maximum value that can be damaged in each land use class. This results in a monetary estimate of direct flood damage for each land use type, as presented in the next section.

3. Results

Below, the results of the flood damage assessments for a one-hour 60 mm rainfall event in Belgrave and Lombardijen are shown.

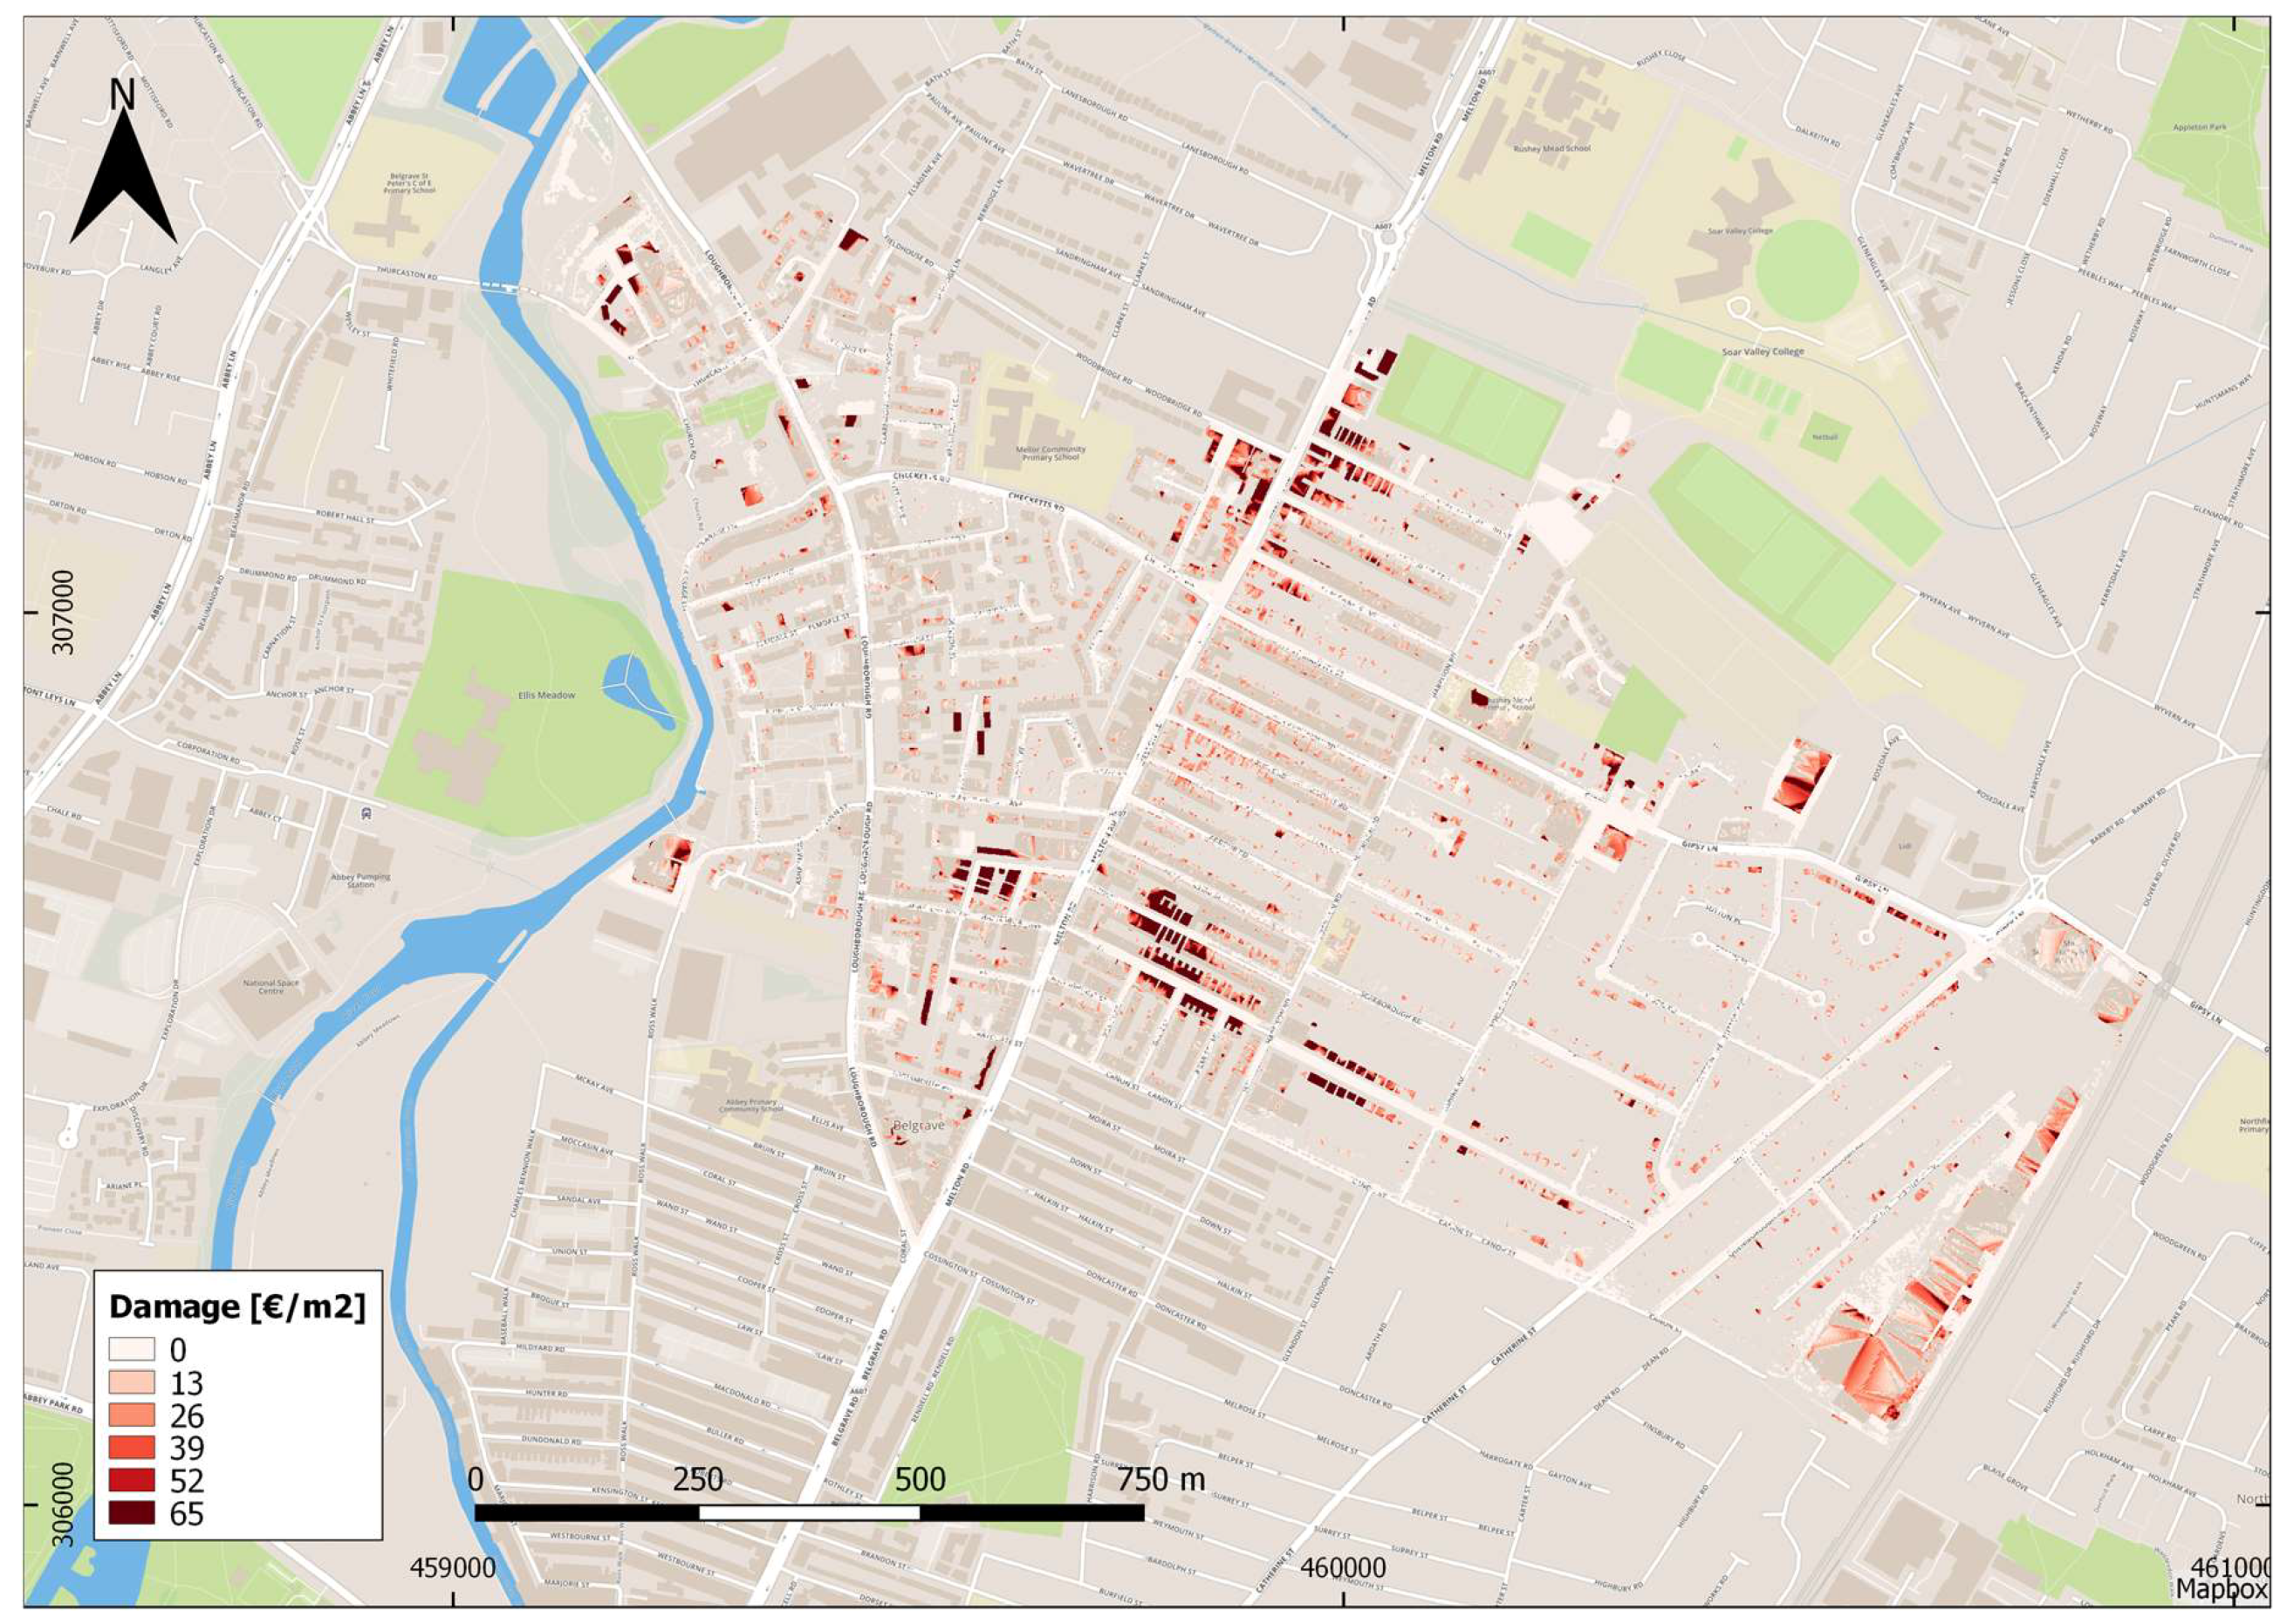
3.1. Direct Flood Damage in Belgrave

Figure 10 shows that flood damage in Belgrave is concentrated in a couple of hotspots in the North and South. Comparing this with the water depth map of Belgrave (Figure 5), it is noticeable that flood damage is not always highest in areas with the greatest flood depths and is highly dependent on land use. For example, the field to the North of Belgrave that experiences heavy pooling in Figure 5 does not show flood damage in Figure 10. On the other hand, the less-flooded residential area surrounding the field in Figure 5 does show heavy flood damage. Direct flood damage can only be as high as the value of the asset that is damaged, so it is important that areas identified as flood-prone on flood hazard maps do not become overdeveloped. As more areas in the Netherlands and UK are expected to become flood-prone in the future, it is crucial that anticipated future rainfall patterns be incorporated in present-day decisions regarding development and urban spatial planning. Below, Table 3 breaks down the flood damage in Belgrave per land use type.
As shown in Table 3, the total direct damage from the one-hour pluvial flood event is nearly €11 million. Over 98% of total damage comes from the residential sector, which is likely because all buildings were considered residential except for one school. Other studies show building damage of 60–95% of total direct damage [42], whereas in this research the total share of building damage is over 99%. This could be because other damage types (e.g., infrastructure damage) were neglected and the average damage values for water and urban areas–other were set to zero. Thus, the >99% of total damage associated with property damage yielded in this study is likely an overestimation. However, the total damage estimate of €10.99 million could be an underestimation as flooding of urban areas–other and water land use classes would realistically cause some monetary damage.

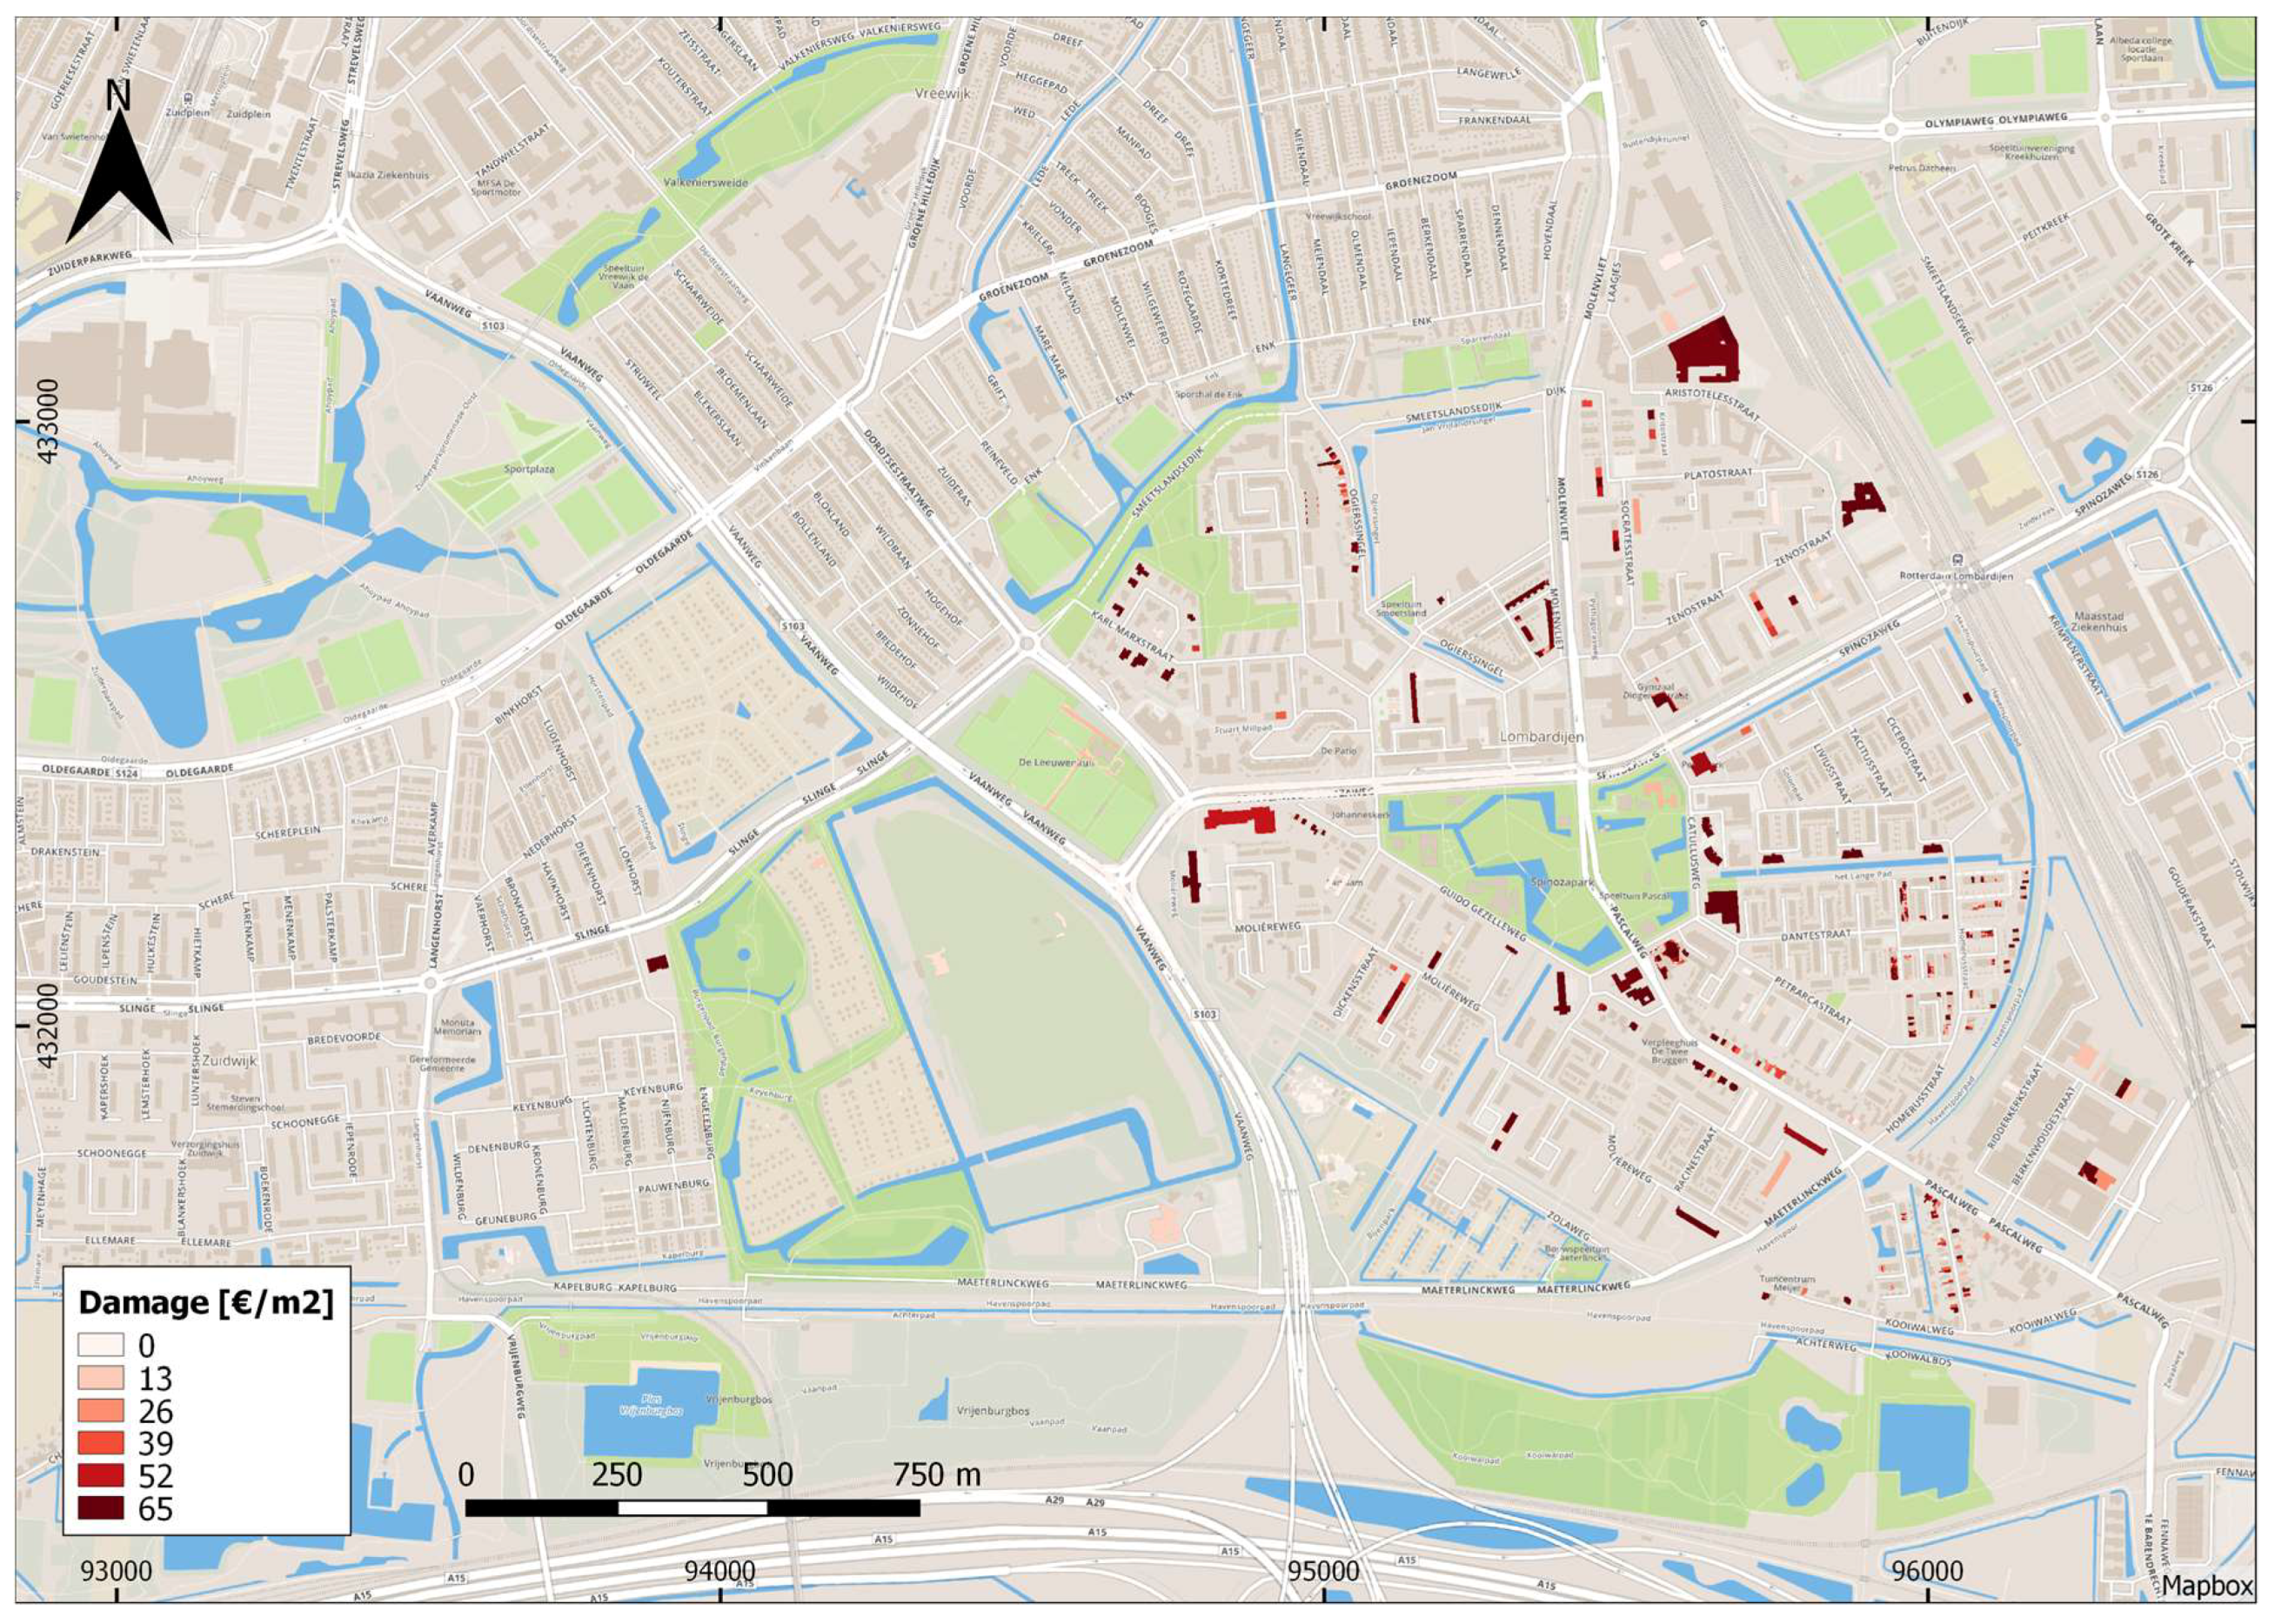
3.2. Direct Flood Damage in Lombardijen

Figure 11 displays the distribution of flood damage throughout the Lombardijen neighborhood. There are several areas of concentrated high damage to the east and southeast of Spinozapark (note the dark red blotches). Comparing this with the water depth map (Figure 6), it is clear that water pooling does not always correlate with high flood damage. More important is the land use class of the area that is flooded. In the case of Lombardijen, the damage hotspots exist in the densely packed residential/industrial areas where there are more buildings exposed to flooding.
As shown in Table 4, residential damage makes up most of the pluvial flood damage, followed by damage to industrial and meeting function buildings. The total share of building damage (99%) is on the high end of what is reported in literature [12,42,43]. This is likely because damage to water utilities, power stations, and other infrastructural components was not part of this assessment, resulting in an overstatement of the total share of building damage. It is important to also mention that although direct damages to roads and train tracks were minimal in this simulation, traffic delays and diversions would be expected to cause high indirect and intangible damages like inconvenience and lost time. Although the urban drainage system was accounted for in the Lombardijen damage estimation, the results still show greater flood damages in Lombardijen than Belgrave. This could be due to the inclusion of a more detailed land use map for Lombardijen (Figure 8). Much of the Belgrave area was classified as urban area – other, which had a maximum damage value of zero, whereas the more detailed land use classification for Lombardijen considered comparatively much less area as urban area - other. Damage estimates are sensitive to the level of detail in the land use classification, so it is difficult to compare the damage estimates between the two areas due to the difference in the land use maps used.

4. Discussion

4.1. Data Limitations

The two case studies are contrasting since all Lombardijen information was readily accessible, while the Belgrave damage estimation was hampered by data availability issues. Consequently, critical elements for the flood damage assessment like a sewer network map displaying locations of drains, sewers, pipes, and manholes, and average asset values specific for buildings in Belgrave were not available. Because of this, the damage assessment for Belgrave was conducted with the best available data to the knowledge of the authors and the damage estimate of €10.9 million should only be considered a ballpark estimate. It has been noted that even with state-of-the-art 1D/2D hydrodynamic flood models, there is still a poor understanding of the mechanisms of urban flooding and high uncertainties in flood depth simulations [13,17,18,19,20]. Data on real flood events are needed, not just to validate the results of flood level maps, but also to better our understanding of the relationship between flood depth and flood damage among different land use classes and to develop damage functions tailored to each class.
Due to input data shortages for model validation and damage function development, the damage estimates presented here have not been tested, thus caution should be taken if the outcomes are used to inform decisions in urban flood-risk management. It is also important to note that this damage estimate focuses only on direct damages to physical property, neglecting indirect and intangible damage to health and the environment that is also likely to occur. By omitting these damage types, the full spectrum of flood damage is not included in the damage assessment, resulting in an estimate of direct damage only. It is pivotal to include all damage types in flood damage assessments to build a complete understanding of flood risks and ensure the benefits of flood-risk reduction are not underestimated [44]. In fact, some studies comparing the benefits of coastal flood-risk reduction measures to implementation costs have shown that investments in flood-risk reduction are only net-beneficial if intangible damages like loss of life are included in the damage assessment [45,46]. Without the inclusion of the diverse types of potential flood damage, the estimated benefits of flood-risk reduction are understated, thus the case for implementation is weakened. Even though pluvial floods are likely to be smaller and cause less significant intangible and indirect damage than coastal floods, all damage types should still be considered to ensure nothing is left out and the assessment of flood risk is complete. It could also be unethical to base decisions in flood risk reduction only on direct damage estimates as it may lead to the prioritization of reducing flood risks in areas with the most economically valuable building assets, in other words, the richest areas. Although the WSS attributes constant average damage values to all buildings regardless of building quality, the use of these damage estimates could result in the prioritization of flood damage mitigation for the largest buildings, not necessarily the most vulnerable. Recent research has highlighted that the less fortunate and socially vulnerable encounter greater flood damage due to information and resource shortages, yet this is ignored by damage assessments based only on asset damage [47,48]. Although there may be less chance of heavy intangible or indirect damage compared to river or coastal floods, pluvial floods can result in casualties, injuries, long-term trauma, and significant environmental damage [9,49]. As climate change is expected to bring about more frequent and intense pluvial flood hazards, it is prudent to continue to dedicate research to the assessment of not only direct, but all types of pluvial flood risks.

4.2. Looking Towards the Future

Despite the simplicity and imperfections of the damage assessments conducted here, the results are still valuable for raising awareness of the absolute minimum potential flood damage that communities can expect to face, as well as pinpointing where future research is urgently required. This can be helpful for inspiring people to start a (very necessary) conversation about what flood risks we are willing to face, and how to be prepared to reduce flood risks in the future. Many cities are either sitting atop outdated drainage systems that do not have the capacity for future rainfall patterns or are developing rapidly without a centralized drainage system in place [50,51]. In any case, decisions need to be made on how to decrease pluvial flood risks to avoid future disasters. Options for reducing pluvial flood risks exist, from conventional ‘grey’ options like increasing the capacity of existing sewer systems to ‘green’ and ‘blue’ innovations such as green roofs, sustainable urban drainage systems, and designated floodwater reservoirs in cities, which serve to delay or divert rainfall from over-stressed sewers [8,50,51]. Since each approach comes at a cost, it is necessary to estimate pluvial flood damage in cities to determine whether investments in flood risk reduction are economically justifiable. Flood damage estimates also provide valuable information for insurance firms, local businesses, spatial planning authorities, emergency planners, and households.
Data collection and accessibility need to be improved for water depth and damage model validation, so results of flood damage assessments can be trusted to better represent reality. Flood depth and flood damage data are collected for a variety of purposes, but methods and standards for data collection are rarely aligned. This is problematic since consistent and accurate data are needed to validate the outcomes of both water level and flood damage estimates. Without a consistent and reliable source of flood data, it becomes more difficult to reinforce and improve flood damage estimates. It is understandable that drainage network and infrastructure maps are difficult to attain due to safety, security, and strategic concerns, but there are tangible benefits to increasing accessibility of this information for dedicated research purposes. Not only would this allow for more accurate simulation of the flood routing and urban drainage process, but maps of other infrastructural components like utility stations and power networks can identify further components at risk to flood exposure. Severe pluvial floods can incapacitate infrastructure networks, and the interdependencies and knock-on effects should be further investigated [52,53,54]. Without drainage and infrastructural network maps in the hands of researchers, it is difficult to trust that the simulated flood depths or estimated value of assets exposed to flooding match with reality.
The assumption of this research that all building types have the same damage characteristics and average values can be called into question, for example, industrial buildings often include heavy machinery and equipment that is more valuable, thus susceptible to greater flood damage than residential buildings. By associating the same damage functions and average asset values to all buildings in Lombardijen and Belgrave, the damage estimates of €10.9–12.2 million to buildings in the two cities merely reflect the fact that they are comparably sized with similar building densities. It is imperative to dedicate continued research to addressing data deficiencies so the role of flood damage assessments as decision-support mechanisms is strengthened. Flood damage assessments are also key for raising awareness of flood risks and closing the gap between perceived and actual risks [55]. Flood damage assessment therefore plays the important role of increasing awareness of flood risks prior to disasters so societies can be better prepared to reduce future flood risks. Flood defense via structural or technical means is regarded as the cornerstone of European flood risk management, but risks can also be addressed with other paradigms in flood risk management such as flood prevention via spatial planning, risk mitigation, preparation, and recovery [55,56]. Research has shown that non-structural means like installation of early warning systems or adaptation of water sensitive cities master plans can repay setup costs within a matter of years, especially when cleverly combined with structural options [46,57]. Key to raising awareness and hastening action flood risk reduction is for people to understand, as well as believe, the results of flood damage assessments [44,58]. Thus, it is important to continue to research and dissect existing flood damage assessment methods to increase our understanding of the methods used as well as the limitations. By studying urban pluvial flooding, the risks appear more real and awareness can be raised on potential flood impacts. Raising awareness is a crucial pre-cursor for inspiring action to reduce flood risks and cope with the challenges of climate change in cities.

5. Conclusions

The significance of expanding knowledge about pluvial flood risks and the costs of inaction cannot be understated. Climate change is steering society into unchartered territory, and urban conglomerations only serve to aggregate flood risks. People are becoming increasingly aware of flood risks after catastrophic events that have plagued society in recent decades. This backward-looking attitude is not well-suited for a future where we face uncertain conditions yet near-certain intensifications of flood risk. Instead, it is urgent to act now to reduce risks before disasters occur. Awareness precludes action, and to raise awareness, flood risks need to be assessed.
This research used a combination of 3Di flood modelling and the WSS flood damage estimation tool to assess direct flood damage from a 60 mm/1-h pluvial flood event in two urban areas: Belgrave (Leicester, United Kingdom) and Lombardijen (Rotterdam, the Netherlands). For Belgrave, direct damage was estimated at roughly €11 million, while for Lombardijen direct damage was €12.4 million. Due to a lack of pluvial flood damage data, identical average asset values and damage functions were applied for both neighborhoods. Thus, the comparable damage estimates yielded in this research merely reflect the fact that the areas are of similar size and building densities. This research could be improved by using locally-tailored asset values, land use maps, and damage functions to account for differences between building types as well as study areas. Furthermore, the Belgrave damage assessment was hampered by the failure to include a map of the urban drainage infrastructure, resulting in an overly-simplified portrayal of the flood propagation. Urgent research is needed to address data bottlenecks, especially for validating flood depth simulations and developing damage values and functions for the wide variety of land use classes that exist in modern cities [59]. With more complete data of past flood events, work can be put into improving pluvial flood damage assessments that can play a stronger role supporting decisions in flood-risk reduction. This can be vital for reducing future flood risks, as most studies demonstrate investments in flood-risk reduction at least break even with implementation costs [46,60].
Pluvial flood damage assessments are essential for supporting arguments for building flood resilience, raising awareness of flood risks, and determining how flood-risk management could best be implemented. Ideally, such damage assessments are based on sound data. Decisions should not be based on damage assessments alone without recognizing input data limitations, which result in some significant uncertainties underpinning the damage assessment process. A way forward is to keep studying flood damages and developing solid databases to validate and improve models for assessing potential future flood damages. Stronger flood damage assessments will be essential for building the case that the costs of inaction are too great to ignore flood risks any longer. To borrow a quote from John F. Kennedy, “There are risks and costs to action. But they are far less than the long-range risks of comfortable inaction”.

Author Contributions

Conceptualisation: H.N., K.V.L. and A.M.L.; Methodology: H.N., A.M.L., C.D. and K.V.L.; Validation: H.N., A.M.L., C.D. and K.V.L.; Formal analysis: H.N., A.M.L., C.D. and K.V.L.; Investigation: H.N., A.M.L., C.D. and K.V.L.; Writing—original draft preparation: H.N. and K.V.L.; Writing—review and editing: H.N., A.M.L., C.D. and K.V.L.; Visualization: M.L. and H.N. Supervision: C.D. and K.V.L. Funding acquisition: K.V.L. and C.D.

Funding

Part of this research took place in the context of Watershare®, a worldwide network of water research organisations and utilities dedicated to applying global expertise to master local water challenges, funded by KWR Watercycle Research Institute. Part of this research was funded by POWER (Political and social awareness on water environmental challenges). The European Commission is acknowledged for funding POWER in H2020-Water under Grant Agreement No. 687809.

Acknowledgments

The authors would like to acknowledge the researchers that were involved in this research project for their contributions to the mapping and digitalization efforts, as well as for the in-depth discussions that have helped to interpret the empirical material and translate these damage estimates. The support of the city of Leicester is greatly acknowledged, and especially Janet Riley, for her practical support as well as the comments on the manuscript. Last but not least, for allowing Lombardijen as a case study, the support of the city of Rotterdam is gratefully acknowledged.

Conflicts of Interest

The authors declare no conflict of interest.

References

  1. Kummu, M.; De Moel, H.; Ward, P.J.; Varis, O. How close do we live to water? A global analysis of population distance to freshwater bodies. PLoS ONE 2011, 6, e20578. [Google Scholar] [CrossRef] [PubMed]
  2. CRED. Cred Crunch 50: Natural Disasters in 2017—Lower mortality, Higher Cost. Available online: http://www.emdat.be/publications (accessed on 20 October 2018).
  3. European Environment Agency. Flood Risks and Environmental Vulnerability: Exploring the Synergies between Floodplain Restoration, Water Policies and Thematic Policies; European Environment Agency, Publications Office of the European Union: Luxembourg, Luxembourg, 2016; ISBN 978-92-9213-716-8. [Google Scholar]
  4. World Economic Forum. The Global Risks Report 2018, 13th ed.; World Economic Forum: Geneva, Switzerland, 2018; ISBN 978-1-944835-15-6. [Google Scholar]
  5. Olesen, L.; Lowe, R.; Arnbjerg-Nielsen, K. Flood Damage Assessment: Literature Review and Recommended Procedure; Cooperative Research Centre for Water Sensitive Cities: Melbourne, Australia, 2017; ISBN 978-1-921912-39-9. [Google Scholar]
  6. Szewranski, S.; Chruscinski, J.; Kazak, J.; Swiader, M.; Tokarczyk-Dorociak, K.; Zmuda, R. Pluvial Flood Risk Assessment Tool (PFRA) for Rainwater Management and Adaptation to Climate Change in Newly Urbanised Areas. Water 2018, 10, 386. [Google Scholar] [CrossRef]
  7. Zhou, Q.; Mikkelsen, P.S.; Halsnæs, K.; Arnbjerg-Nielsen, K. Framework for economic pluvial flood risk assessment considering climate change effects and adaptation benefits. J. Hydrol. 2012, 414, 539–549. [Google Scholar] [CrossRef]
  8. City of Copenhagen. Cloudburst Management Plan 2012; The City of Copenhagen Technical and Environmental Administration: Copenhagen, Denmark, 2012. [Google Scholar]
  9. European Environment Agency. Climate Change: The Cost of Inaction and the Cost of Adaptation; European Environment Agency, Publications Office of the European Union: Luxembourg, Luxembourg, 2007; ISBN 978-92-9167-974-4. [Google Scholar]
  10. Hammond, M.J.; Chen, A.S.; Djordjević, S.; Butler, D.; Mark, O. Urban flood impact assessment: A state-of-the-art review. Urban Water J. 2015, 12, 14–29. [Google Scholar] [CrossRef]
  11. De Moel, H.; Jongman, B.; Kreibich, H.; Merz, B.; Penning-Rowsell, E.; Ward, P.J. Flood risk assessments at different spatial scales. Mitig. Adapt. Strat. Glob. Chang. 2015, 20, 865–890. [Google Scholar] [CrossRef] [PubMed]
  12. Green, C.; Viavattene, C.; Thompson, P. Guidance for Assessing Flood Losses; CONHAZ Report WP06, D6.1; Middlesex University: London, UK, 2011. [Google Scholar]
  13. Apel, H.; Thieken, A.H.; Merz, B.; Blöschl, G. Flood risk assessment and associated uncertainty. Nat. Hazards Earth Syst. Sci. 2004, 4, 295–308. [Google Scholar] [CrossRef]
  14. Merz, B.; Kreibich, H.; Schwarze, R.; Thieken, A. Review article “Assessment of economic flood damage”. Nat. Hazards Earth Syst. Sci. 2010, 10, 1697–1724. [Google Scholar] [CrossRef]
  15. Smith, D.I. Flood damage estimation—A review of urban stage-damage curves and loss functions. Water 1994, 20, 231–238. [Google Scholar]
  16. Penning-Rowsell, E.C.; Priest, S.; Parker, D.; Morris, J.; Tunstall, S.; Viavattene, C.; Chatterton, J.; Owen, D. Flood and Coastal Erosion Risk Management: A Manual for Economic Appraisal; Routledge: London, UK, 2013; ISBN 978-0415815154. [Google Scholar]
  17. Van Dijk, E.; van der Meulen, J.; Kluck, J.; Straatman, J.H.M. Comparing modelling techniques for analysing urban pluvial flooding. Water Sci. Technol. 2014, 69, 305. [Google Scholar] [CrossRef] [PubMed]
  18. Maksimović, Č.; Prodanović, D.; Boonya-Aroonnet, S.; Leitão, J.P.; Djordjević, S.; Allitt, R. Overland flow and pathway analysis for modelling of urban pluvial flooding. J. Hydraul. Res. 2009, 47, 512–523. [Google Scholar] [CrossRef]
  19. Leandro, J.; Chen, A.S.; Djordjević, S.; Savić, D.A. Comparison of 1D/1D and 1D/2D coupled (sewer/surface) hydraulic models for urban flood simulation. J. Hydraul. Eng. 2009, 135, 495–504. [Google Scholar] [CrossRef]
  20. Freni, G.; La Loggia, G.; Notaro, V. Uncertainty in urban flood damage assessment due to urban drainage modelling and depth-damage curve estimation. Water Sci. Technol. 2010, 61, 2979–2993. [Google Scholar] [CrossRef]
  21. Apel, H.; Aronica, G.T.; Kreibich, H.; Thieken, A.H. Flood risk analyses—How detailed do we need to be? Nat. Hazards 2009, 49, 79–98. [Google Scholar] [CrossRef]
  22. Thieken, A.H.; Müller, M.; Kreibich, H.; Merz, B. Flood damage and influencing factors: New insights from the August 2002 flood in Germany. Water Resour. Res. 2005, 41. [Google Scholar] [CrossRef]
  23. Thieken, A.H.; Olschewski, A.; Kreibich, H.; Kobsch, S.; Merz, B. Development and evaluation of FLEMOps—A new Flood Loss Estimation Model for the private sector. Wit Trans. Ecol. Environ. 2008, 118, 315–324. [Google Scholar]
  24. Elmer, F.; Thieken, A.H.; Pech, I.; Kreibich, H. Influence of flood frequency on residential building losses. Nat. Hazards Earth Syst. Sci. 2010, 10, 2145–2159. [Google Scholar] [CrossRef]
  25. Kreibich, H.; Seifert, I.; Merz, B.; Thieken, A.H. Development of FLEMOcs—A new model for the estimation of flood losses in the commercial sector. Hydrol. Sci. J. 2010, 55, 1302–1314. [Google Scholar] [CrossRef]
  26. Kellens, W.; Vanneuville, W.; Verfaillie, E.; Meire, E.; Deckers, P.; De Maeyer, P. Flood risk management in Flanders: Past developments and future challenges. Water Resour. Manag. 2013, 27, 3585–3606. [Google Scholar] [CrossRef]
  27. Sušnik, J.; Strehl, C.; Postmes, L.A.; Vamvakeridou-Lyroudia, L.S.; Savić, D.A.; Kapelan, Z.; Mälzer, H.J. Assessment of the effectiveness of a risk-reduction measure on pluvial flooding and economic loss in Eindhoven, The Netherlands. Procedia Eng. 2014, 70, 1619–1628. [Google Scholar] [CrossRef]
  28. Spekkers, M.H.; Rozer, V.; Thieken, A.; ten Veldhuis, M.C.; Kreibich, H. A comparative survey of the impacts of extreme rainfall on two international case studies. Nat. Hazards Earth Syst. Sci. 2017, 17, 1337–1355. [Google Scholar] [CrossRef]
  29. Spekkers, M.H.; Kok, M.; Clemens, F.H.L.R.; ten Veldhuis, J.A.E. Decision-tree analysis of factors influencing rainfall-related building structure and content damage. Nat. Hazards Earth Syst. Sci. 2014, 14, 2531–2547. [Google Scholar] [CrossRef]
  30. Van Ootegem, L.; Verhofstadt, E.; Van Herck, K.; Creten, T. Multivariate pluvial flood damage models. Environ. Impact Assess. Rev. 2015, 54, 91–100. [Google Scholar] [CrossRef]
  31. Rözer, V.; Müller, M.; Bubeck, P.; Kienzler, S.; Thieken, A.; Pech, I.; Schröter, K.; Buchholz, O.; Kreibich, H. Coping with pluvial floods by private households. Water 2016, 8, 304. [Google Scholar] [CrossRef]
  32. Grahn, T.; Nyberg, L. Assessment of pluvial flood exposure and vulnerability of residential areas. Int. J. Disaster Risk Reduct. 2017, 21, 367–375. [Google Scholar] [CrossRef]
  33. Spekkers, M.H.; Ten Veldhuis, J.A.E.; Clemens, F.H.L.R. Collecting data for quantitative research on pluvial flooding. In Proceedings of the 12th International Conference on Urban Drainage, Porto Alegre, Brazil, 11–15 September 2011; IWA—International Water Association: London, UK, 2011. [Google Scholar]
  34. Merz, B.; Kreibich, H.; Lall, U. Multi-variate flood damage assessment: A tree-based data-mining approach. Nat. Hazards Earth Syst. Sci. 2013, 13, 53–64. [Google Scholar] [CrossRef]
  35. Leicester City Council. Surface Water Management Plan—Part 1 Report; Leicester City Council: Leicester, UK, 2012.
  36. Dai, L.; Wörner, R.; van Rijswick, H.F. Rainproof cities in the Netherlands: Approaches in Dutch water governance to climate-adaptive urban planning. Int. J. Water Resour. Dev. 2018, 34, 652–674. [Google Scholar] [CrossRef]
  37. Hooimeijer, F.; van der Toorn Vrijthoff, W. More Urban Water: Design and Management of Dutch Water Cities; CRC Press: London, UK, 2014; ISBN 9781482288551. [Google Scholar]
  38. Knowledge for Climate. Exploring Opportunities for Green Adaptation in Rotterdam; Knowledge for Climate: Utrecht, The Netherlands, 2012; ISBN 978-94-90070-62-5. [Google Scholar]
  39. Nelen & Schuurmans. 3Di Docs: Introduction. Available online: https://docs.3di.lizard.net/en/stable/a_introduction.html (accessed on 1 February 2018).
  40. Cranfield Soil and Agriculture Institute. Soilscapes. Available online: http://www.landis.org.uk/soilscapes/ (accessed on 8 May 2018).
  41. UK Government Online Environmental Data Portal. Available online: https://data.gov.uk/ (accessed on 8 May 2018).
  42. Schröter, K.; Kreibich, H.; Vogel, K.; Riggelsen, C.; Scherbaum, F.; Merz, B. How useful are complex flood damage models? Water Resour. Res. 2014, 50, 3378–3395. [Google Scholar] [CrossRef]
  43. Fenn, T.; Clarke, C.; Burgess-Gamble, L.; Harding, E.; Ogunyoye, F.; Hick, E.; Dawks, S.; Morris, J.; Chatterton, J. The costs and impacts of the winter 2013/14 floods in England and Wales. In E3S Web of Conferences; EDP Sciences: Les Ulis, France, 2016; Volume 7, p. 05004. [Google Scholar]
  44. Bradford, R.A.; O’Sullivan, J.J.; Van der Craats, I.M.; Krywkow, J.; Rotko, P.; Aaltonen, J.; Bonaiuto, M.; De Dominicis, S.; Waylen, K.; Schelfaut, K. Risk perception–issues for flood management in Europe. Nat. Hazards Earth Syst. Sci. 2012, 12, 2299–2309. [Google Scholar] [CrossRef]
  45. Brouwer, R.; Van Ek, R. Integrated ecological, economic and social impact assessment of alternative flood control policies in the Netherlands. Ecol. Econ. 2004, 50, 1–21. [Google Scholar] [CrossRef]
  46. Shreve, C.M.; Kelman, I. Does mitigation save? Reviewing cost-benefit analyses of disaster risk reduction. Int. J. Disaster Risk Reduct. 2014, 10, 213–235. [Google Scholar] [CrossRef]
  47. Koks, E.E.; Bočkarjova, M.; de Moel, H.; Aerts, J.C. Integrated direct and indirect flood risk modeling: Development and sensitivity analysis. Risk Anal. 2015, 35, 882–900. [Google Scholar] [CrossRef]
  48. Rufat, S.; Tate, E.; Burton, C.G.; Maroof, A.S. Social vulnerability to floods: Review of case studies and implications for measurement. Int. J. Disaster Risk Reduct. 2015, 14, 470–486. [Google Scholar] [CrossRef]
  49. Van Ootegem, L.; Verhofstadt, E. Well-being, life satisfaction, and capabilities of flood disaster victims. Environ. Impact Assess. Rev. 2016, 54, 134–138. [Google Scholar] [CrossRef]
  50. OECD. Water and Cities: Ensuring Sustainable Futures; OECD Studies on Water; OECD Publishing: Paris, France, 2015. [Google Scholar]
  51. OECD. Implementing the OECD Principles on Water Governance: Indicator Framework and Evolving Practices; OECD Studies on Water; OECD Publishing: Paris, France, 2018. [Google Scholar]
  52. Emanuelsson, M.A.E.; Mcintyre, N.; Hunt, C.F.; Mawle, R.; Kitson, J.; Voulvoulis, N. Flood risk assessment for infrastructure networks. J. Flood Risk Manag. 2014, 7, 31–41. [Google Scholar] [CrossRef]
  53. Koks, E.E.; Thissen, M. The economic-wide consequences of natural hazards: An application of a European interregional inputoutput model. In Proceedings of the 22nd Input Output Conference, Lisboa, Portugal, 14–18 July 2014. [Google Scholar]
  54. Koks, E.E.; Thissen, M. A multiregional impact assessment model for disaster analysis. Econ. Syst. Res. 2016, 28, 429–449. [Google Scholar] [CrossRef]
  55. Driessen, P.; Hegger, D.; Kundzewicz, Z.; van Rijswick, H.; Crabbé, A.; Larrue, C.; Matczak, P.; Pettersson, M.; Priest, S.; Suykens, C.; Raadgever, G.; Wiering, M. Governance strategies for improving flood resilience in the face of climate change. Water 2018, 10, 1595. [Google Scholar] [CrossRef]
  56. Driessen, P.P.; Hegger, D.L.; Bakker, M.H.; van Rijswick, H.F.; Kundzewicz, Z.W. Toward more resilient flood risk governance. Ecol. Soc. 2016, 21. [Google Scholar] [CrossRef]
  57. Löwe, R.; Urich, C.; Domingo, N.S.; Mark, O.; Deletic, A.; Arnbjerg-Nielsen, K. Assessment of urban pluvial flood risk and efficiency of adaptation options through simulations–A new generation of urban planning tools. J. Hydrol. 2017, 550, 355–367. [Google Scholar] [CrossRef]
  58. Ten Veldhuis, J.A.E. How the choice of flood damage metrics influences urban flood risk assessment. J. Flood Risk Manag. 2011, 4, 281–287. [Google Scholar] [CrossRef]
  59. Gerl, T.; Kreibich, H.; Franco, G.; Marechal, D.; Schröter, K. A review of flood loss models as basis for harmonization and benchmarking. PLoS ONE 2016, 11, e0159791. [Google Scholar] [CrossRef]
  60. Poussin, J.K.; Botzen, W.W.; Aerts, J.C. Effectiveness of flood damage mitigation measures: Empirical evidence from French flood disasters. Glob. Environ. Chang. 2015, 31, 74–84. [Google Scholar] [CrossRef]
Figure 1. Distinction between tangible, intangible, direct, and indirect flood damages.
Water 11 00801 g001
Figure 2. Standard direct flood damage assessment framework.
Water 11 00801 g002
Figure 3. Belgrave location.
Water 11 00801 g003
Figure 4. Lombardijen location.
Water 11 00801 g004
Figure 5. Belgrave water depth map.
Water 11 00801 g005
Figure 6. Lombardijen water depth map.
Water 11 00801 g006
Figure 7. Belgrave land use map.
Water 11 00801 g007
Figure 8. Lombardijen land use map.
Water 11 00801 g008
Figure 9. Damage function for residential, educational, industrial, retail, office, healthcare, meeting, urban area – other, and sport land use classes (a); Damage function for train tracks, roads, parks and greens, parking lots, water, and cemetery land use classes (b). On the X-axis, the flood (inundation) depth is displayed (up to 30 cm) and on the Y-axis, the damage factor, total share of the asset value that is damaged, (0–1) is shown.
Water 11 00801 g009
Figure 10. Belgrave flood damage map (dark red signifies high flood damage).
Water 11 00801 g010
Figure 11. Lombardijen flood damage map (dark red signifies high flood damage).
Water 11 00801 g011
Table 1. Average damage values for each land use class, Belgrave.
Land Use TypeAverage Damage (€/m2)
Residential271
Educational271
Parks & greens0.1086
Roads0.076
Parking lots0.076
Urban areas-other0
Water0
Table 2. Average damage values for each land use class, Lombardijen.
Land Use TypeAverage Damage (€/m2)
Residential271
Industrial271
Office271
Retail271
Educational271
Healthcare271
Meeting271
Sport54
Parks & greens0.1086
Train track0.076
Roads0.076
Urban areas–other0
Cemetery0
Water0
Table 3. Belgrave damage estimate per land use type.
Damage TypeDamage (€)
Residential10,895,788
Educational87,912
Roads2833
Parking lot2717
Parks & greens473
Water0
Urban areas-other0
Total10,989,723
Table 4. Lombardijen damage estimate per land use type.
Damage TypeDamage (€)
Residential7,558,742
Industrial2,283,720
Meeting1,224,713
Educational672,239
Office487,369
Sport137,291
Retail13,025
Roads645
Train track220
Parks & greens135
Healthcare0
Urban areas-other0
Total12,378,099

