Dew Point Temperature Estimation: Application of Artificial Intelligence Model Integrated with Nature-Inspired Optimization Algorithms

 , ,
, ,  ,
,  and
and 
Abstract
:1. Introduction
2. Theoretical Overview
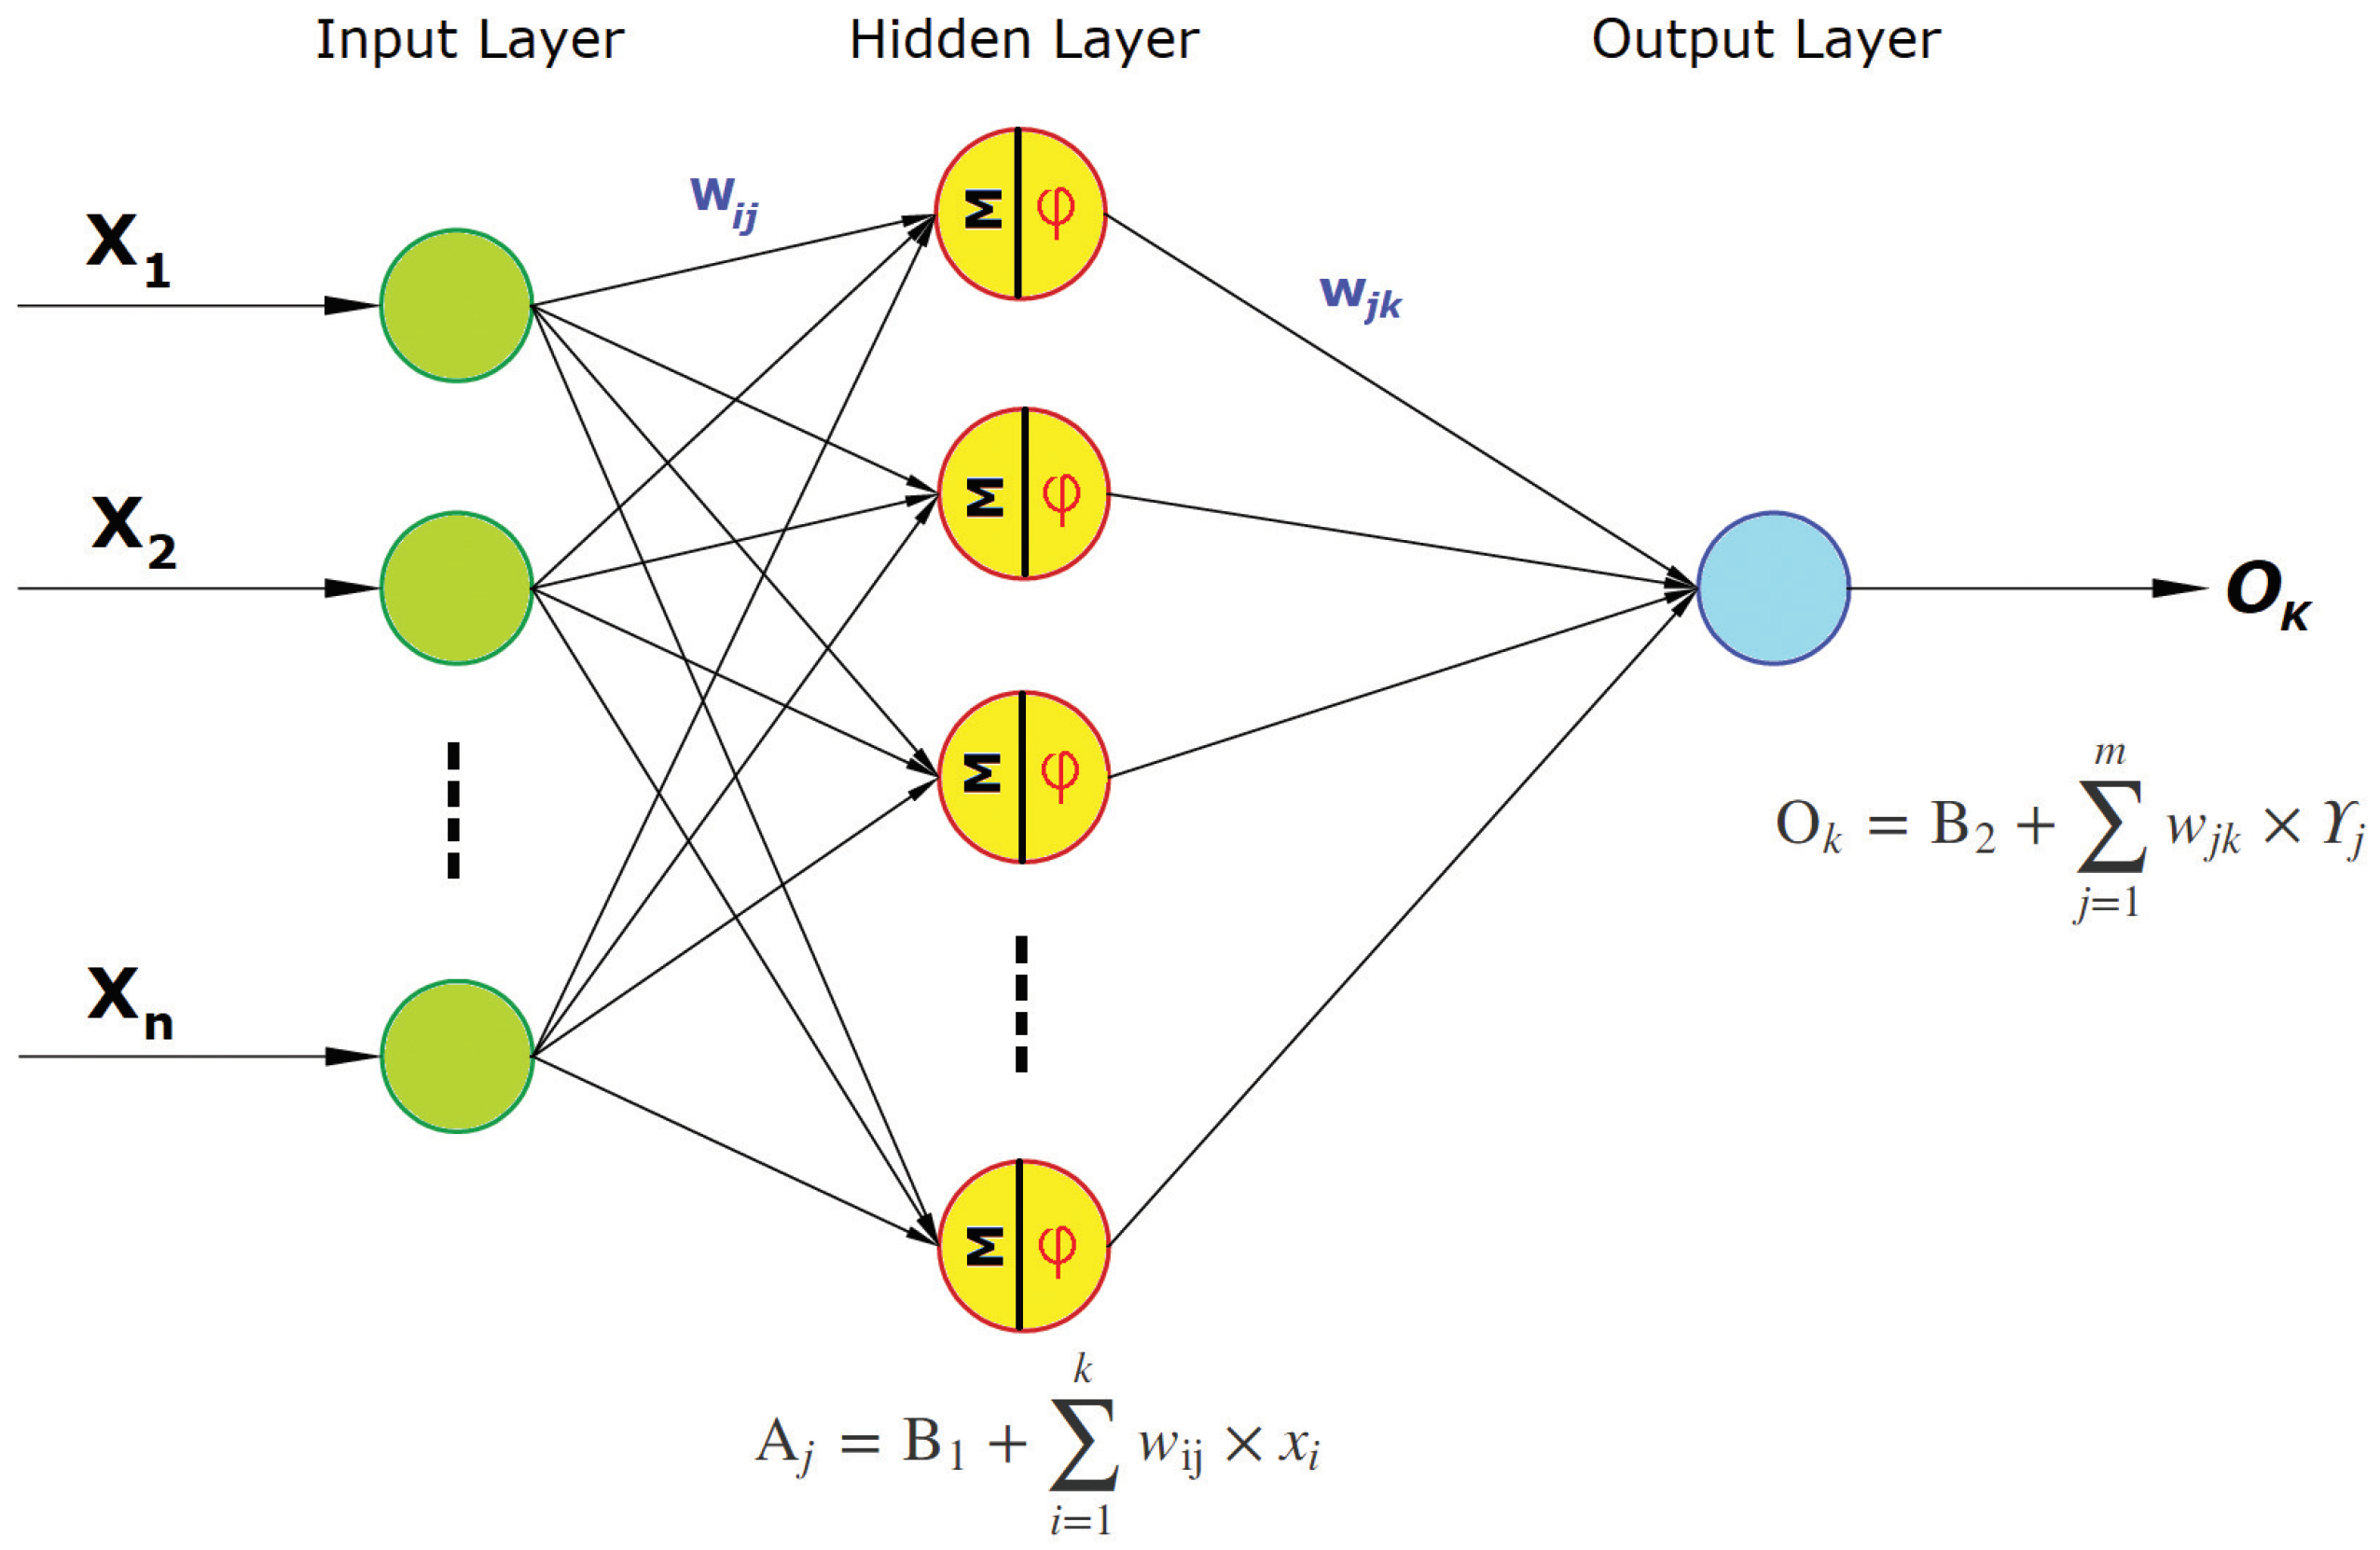
2.1. Multilayer Perceptron Neural Network
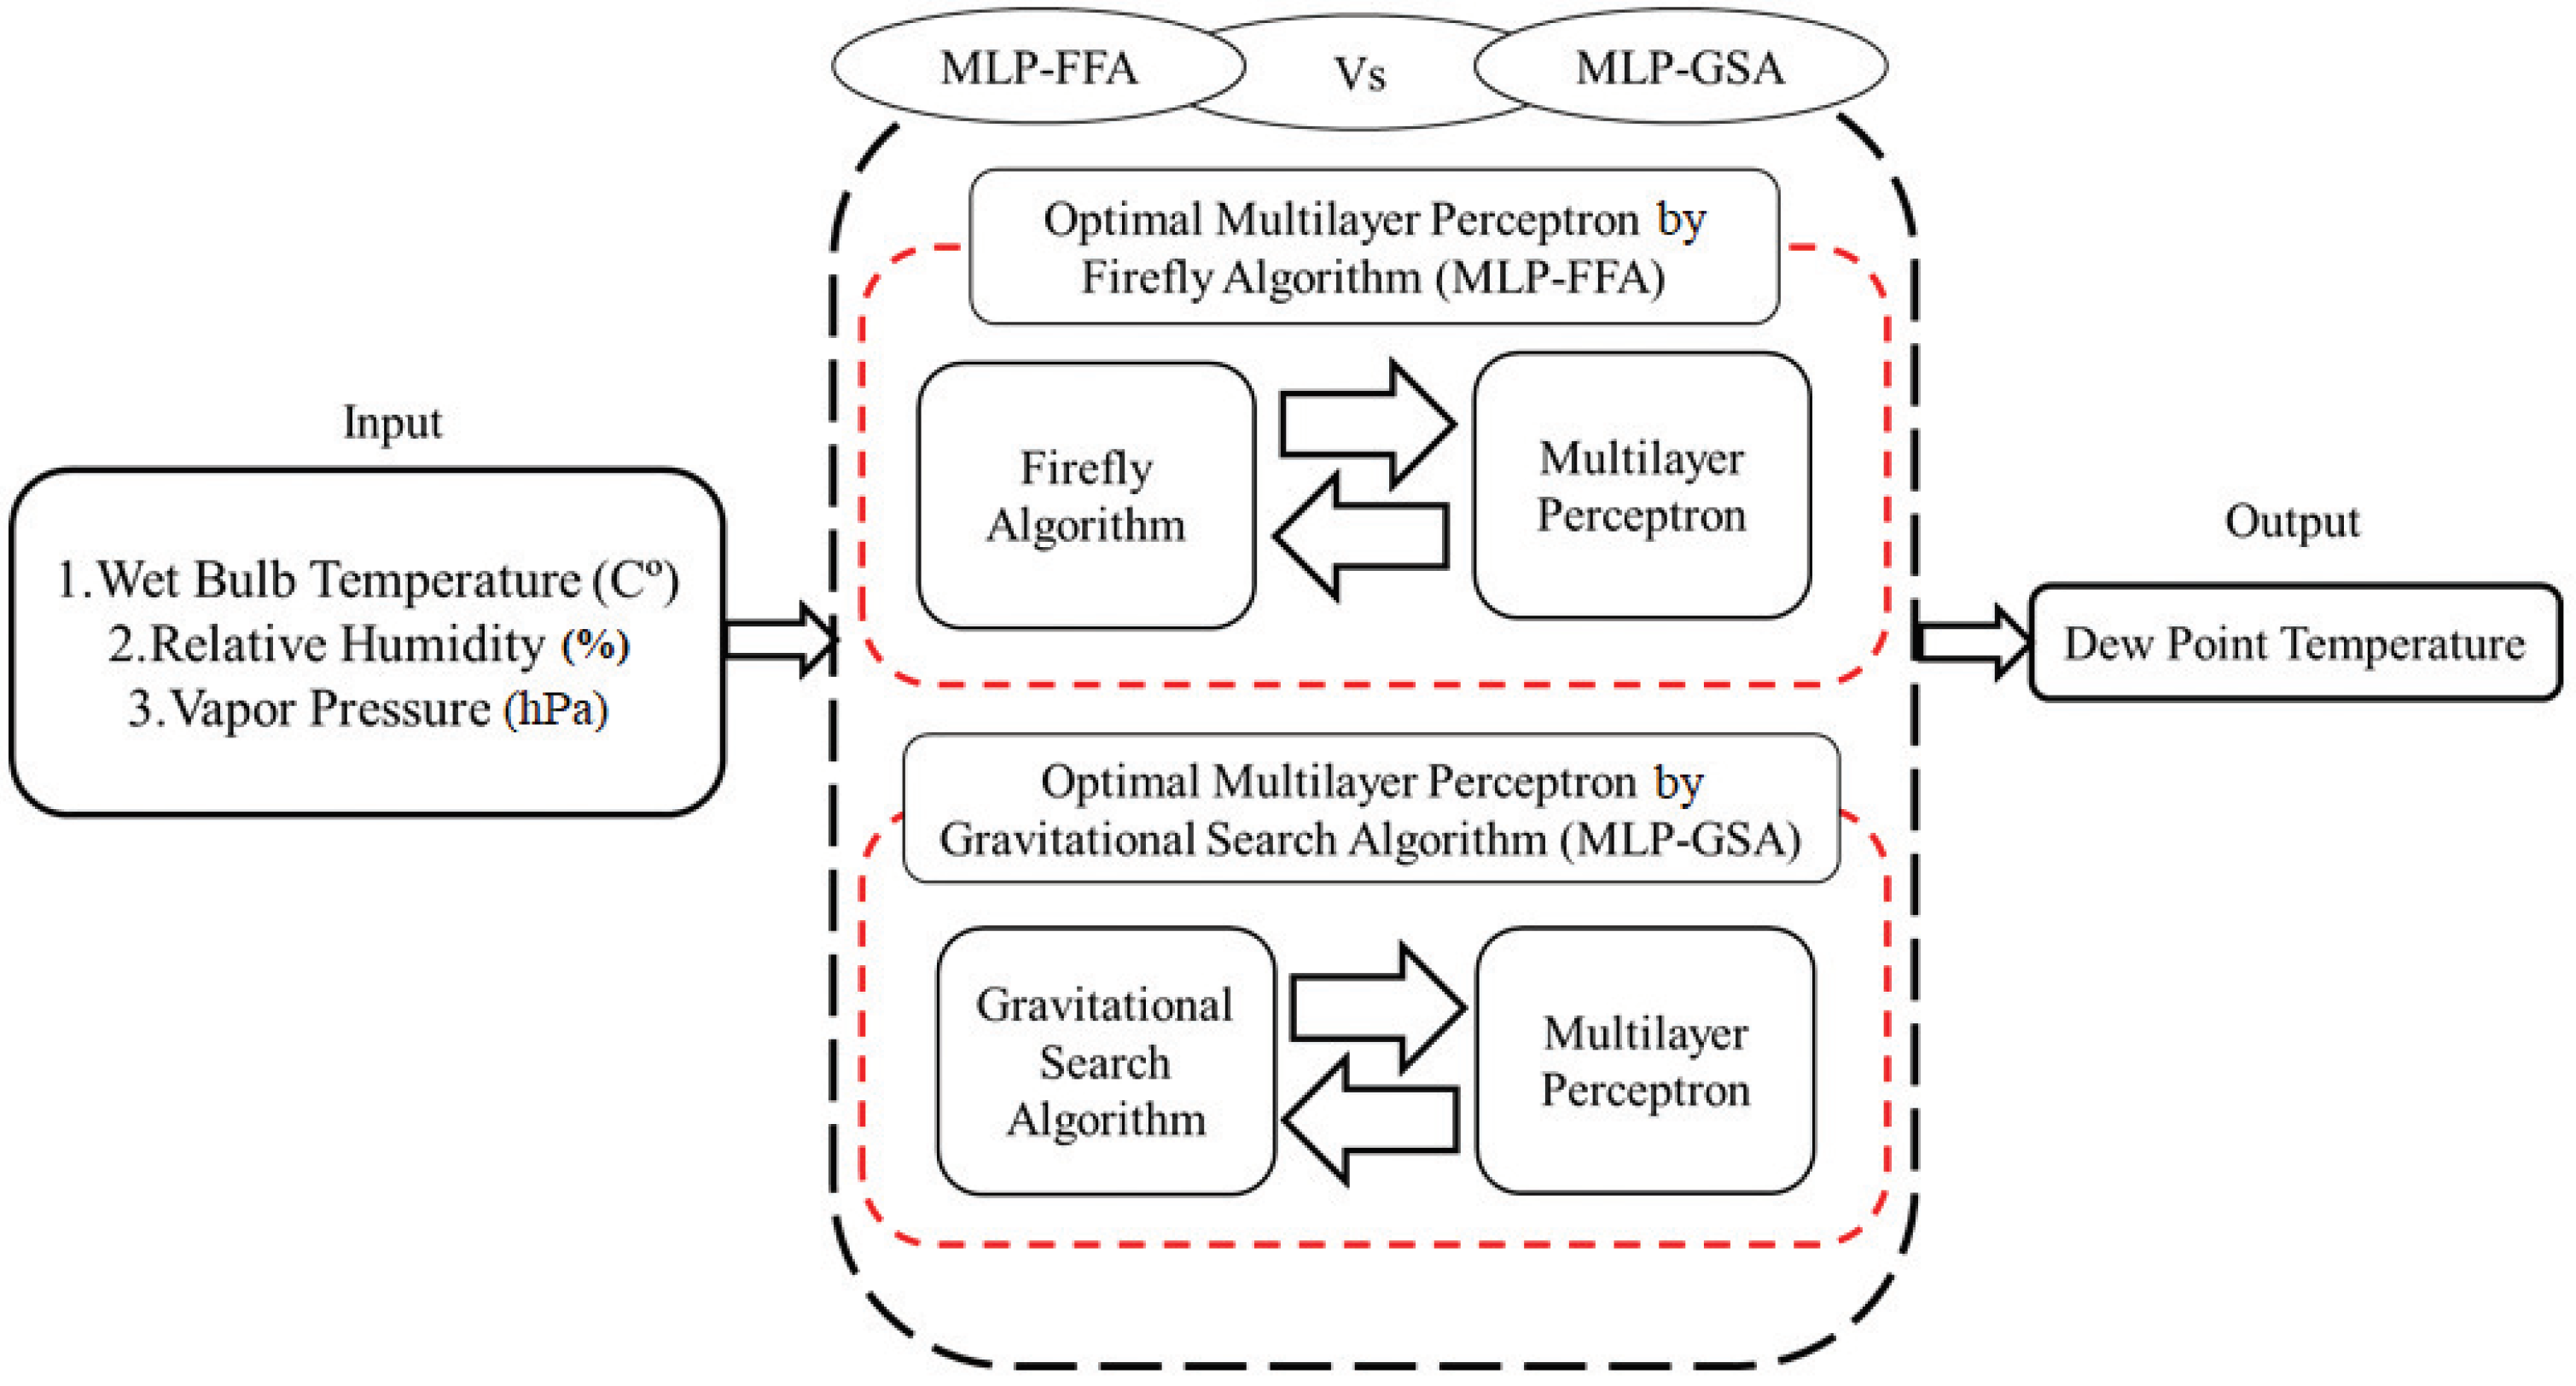
2.2. Hybridized MLP–FFA Models
2.3. Hybridized MLP–GSA Model
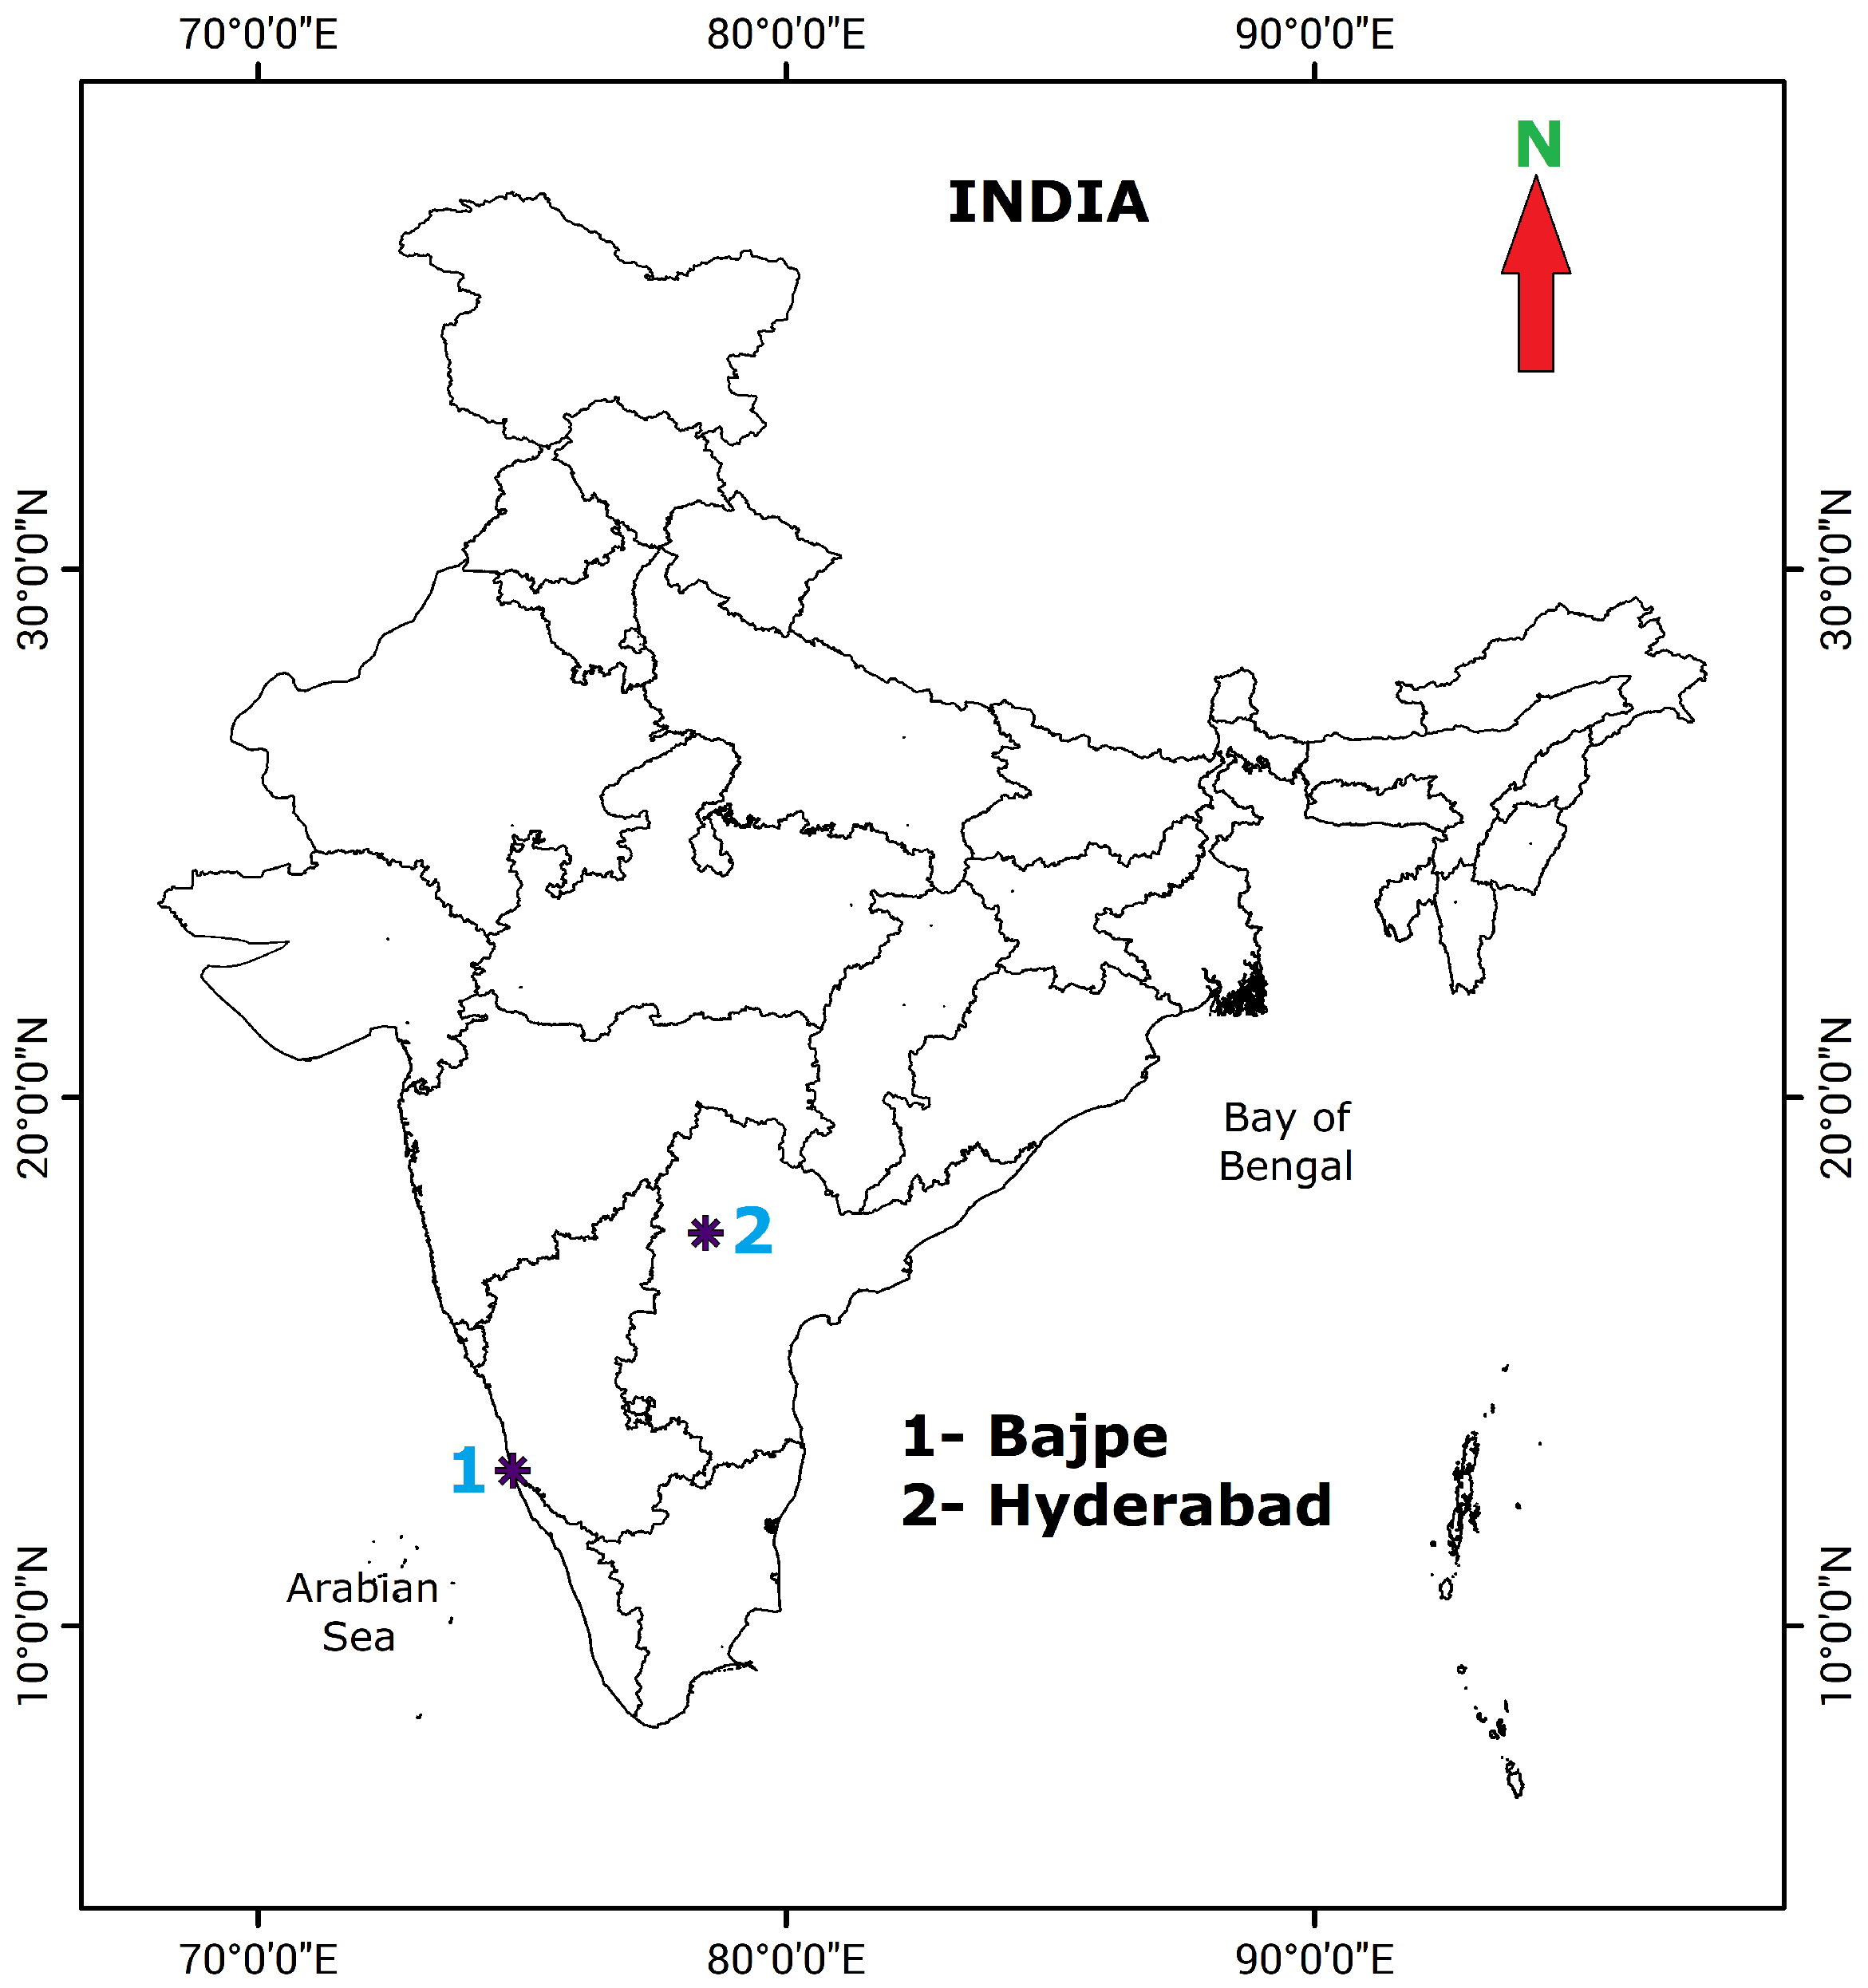
3. Study Area and Data Description
4. Model Development and Performance Analysis
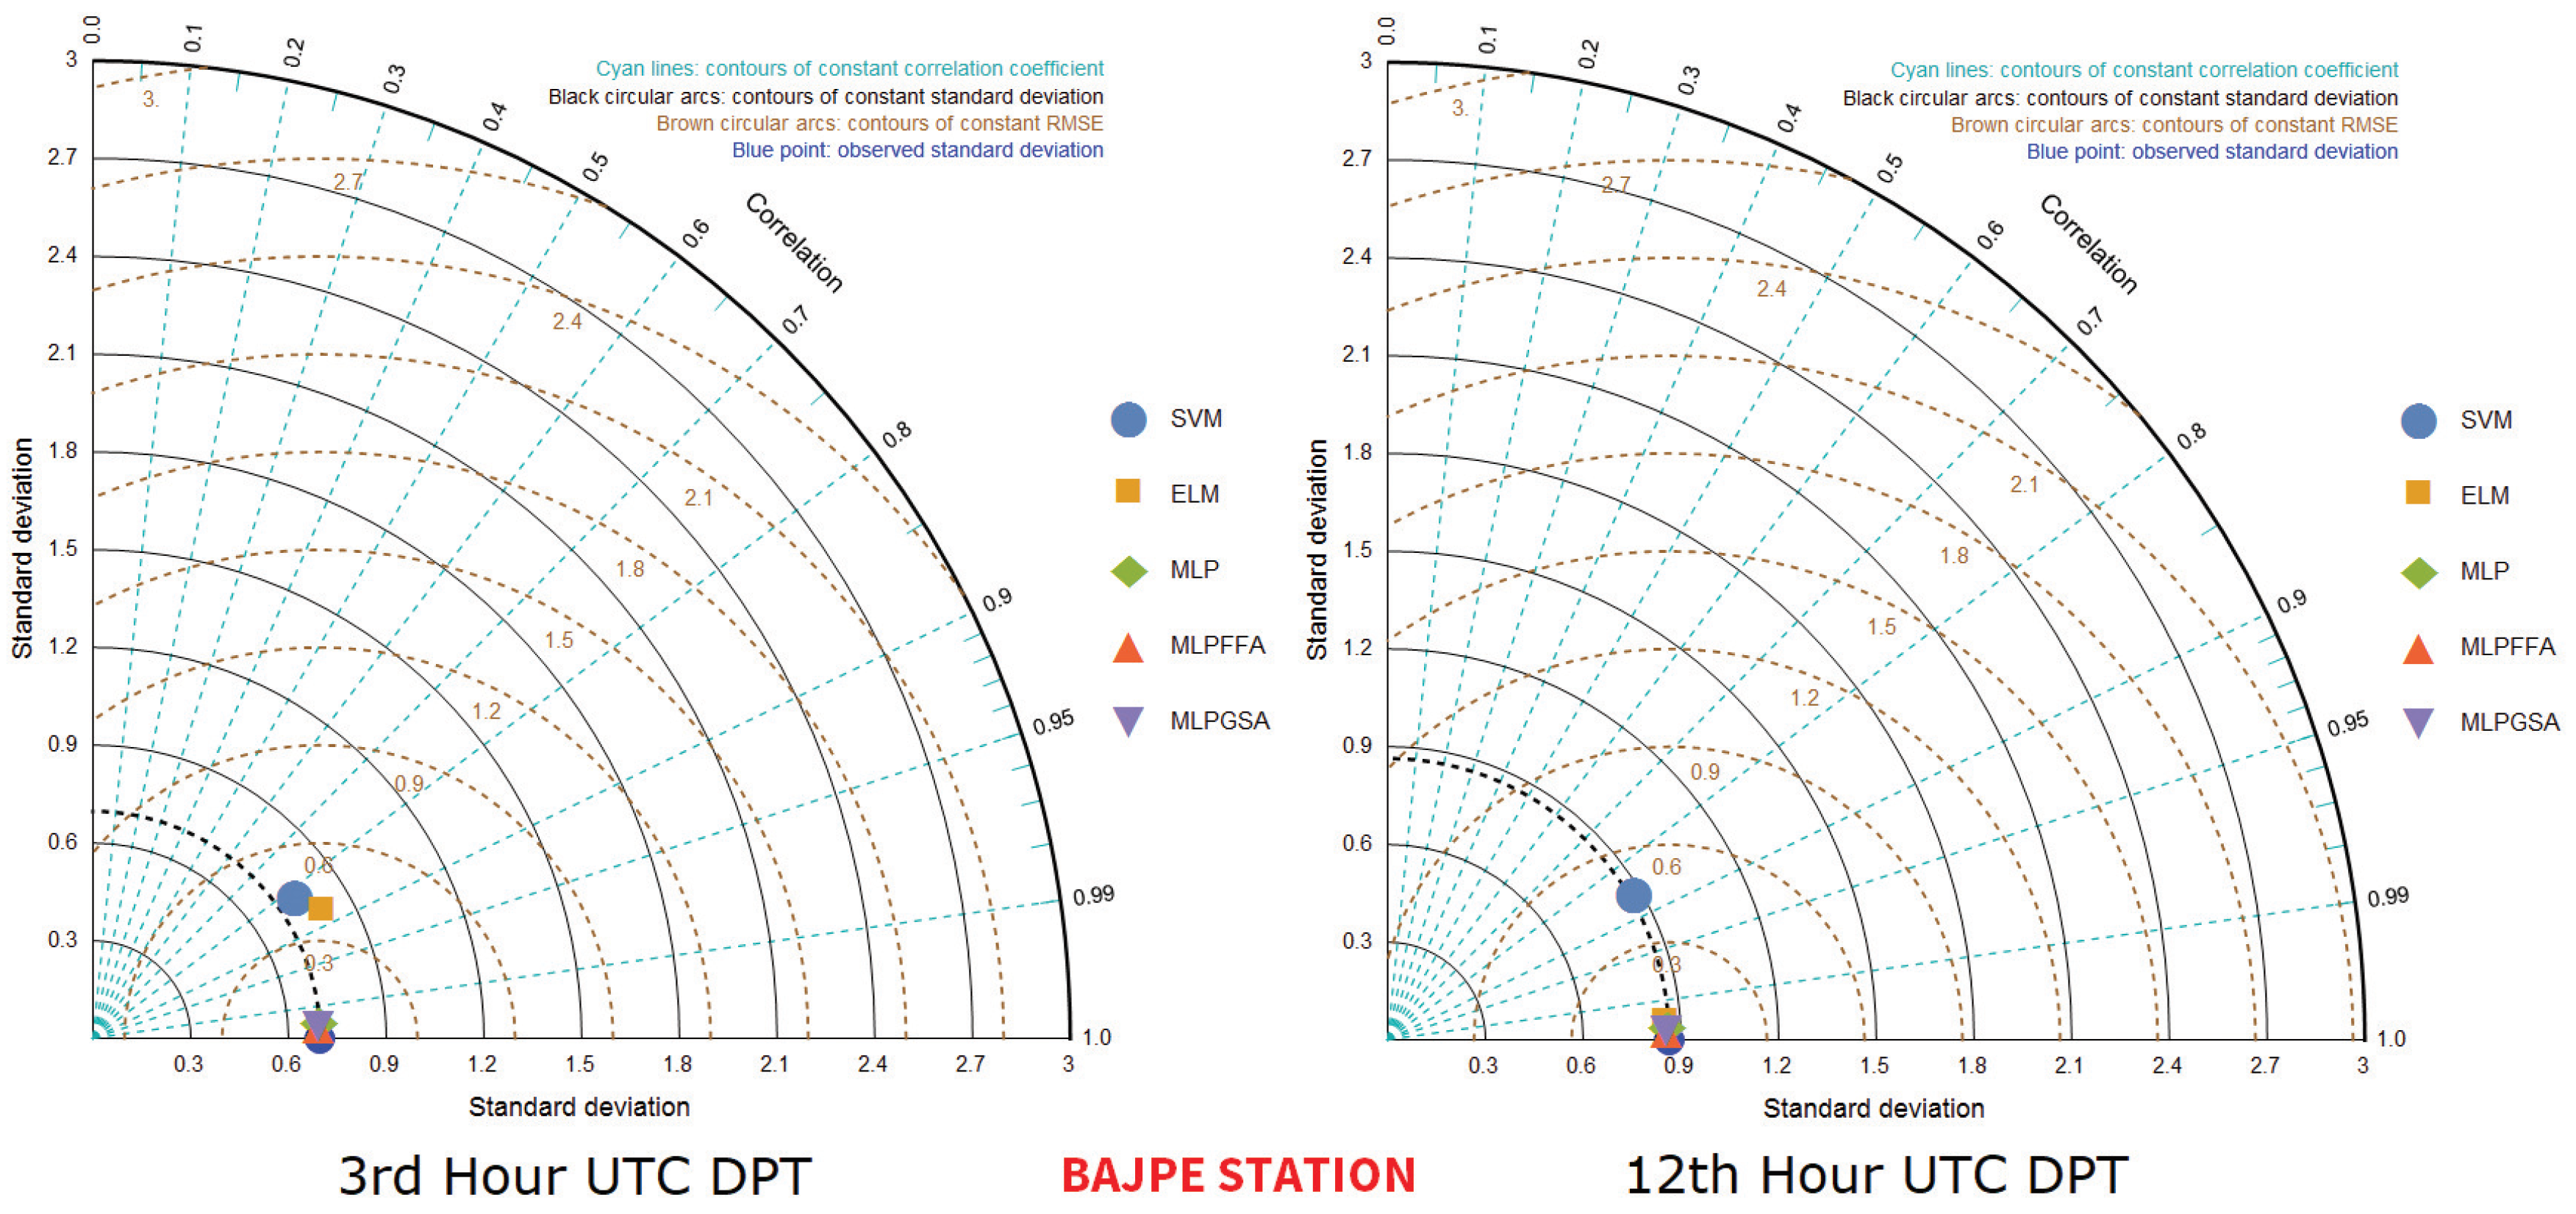
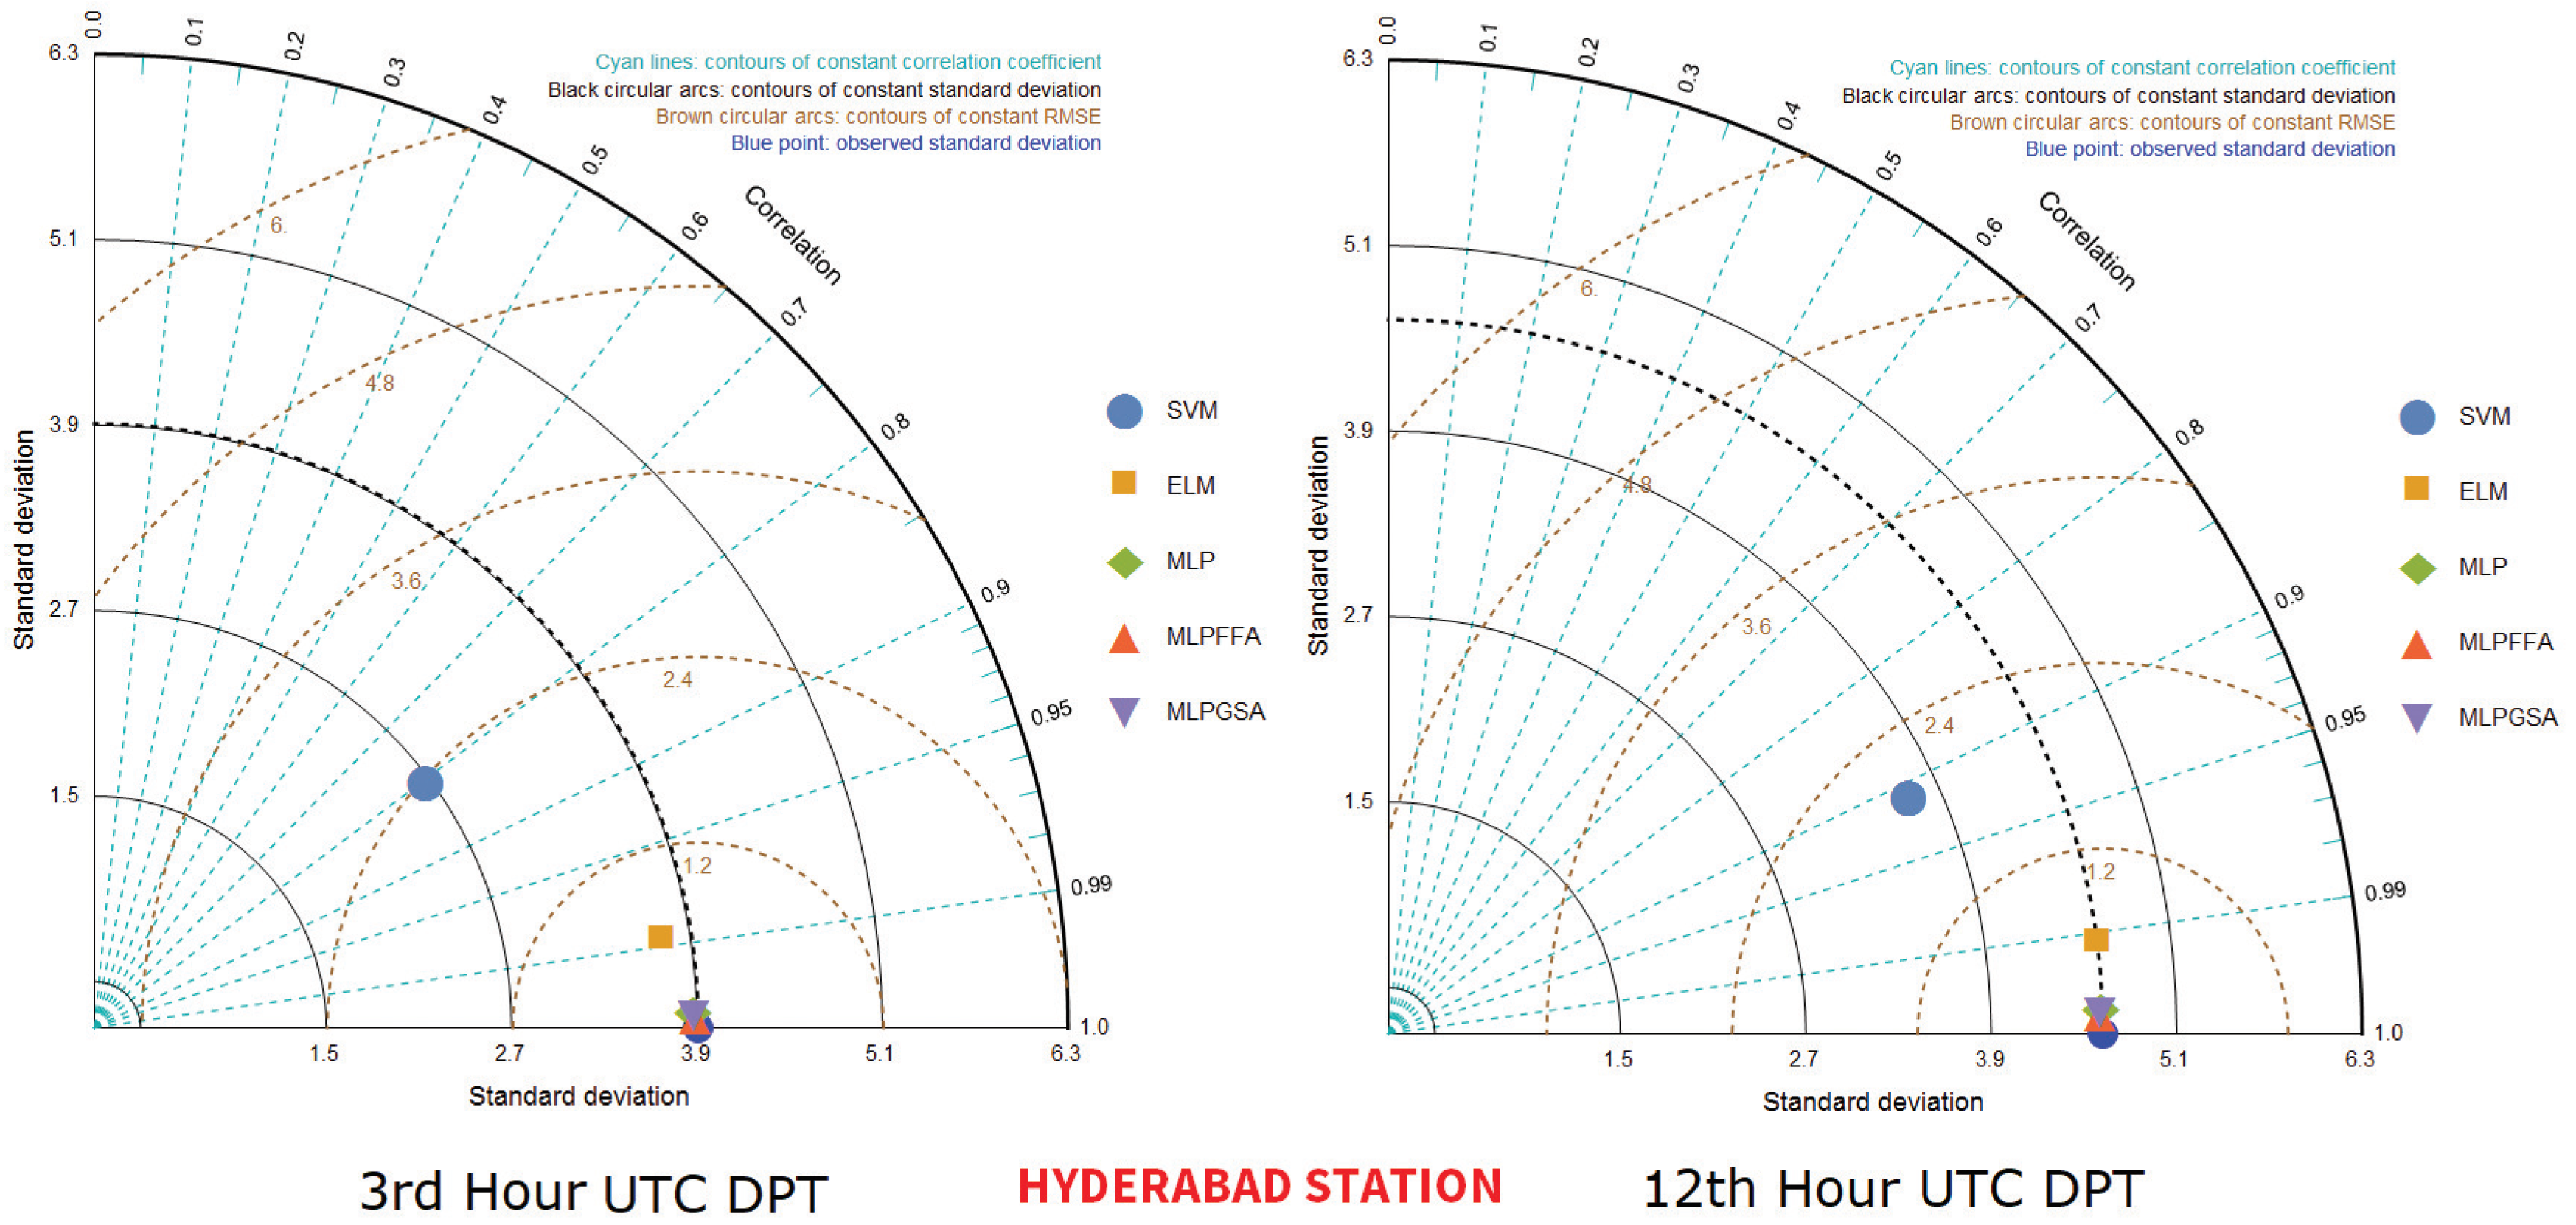
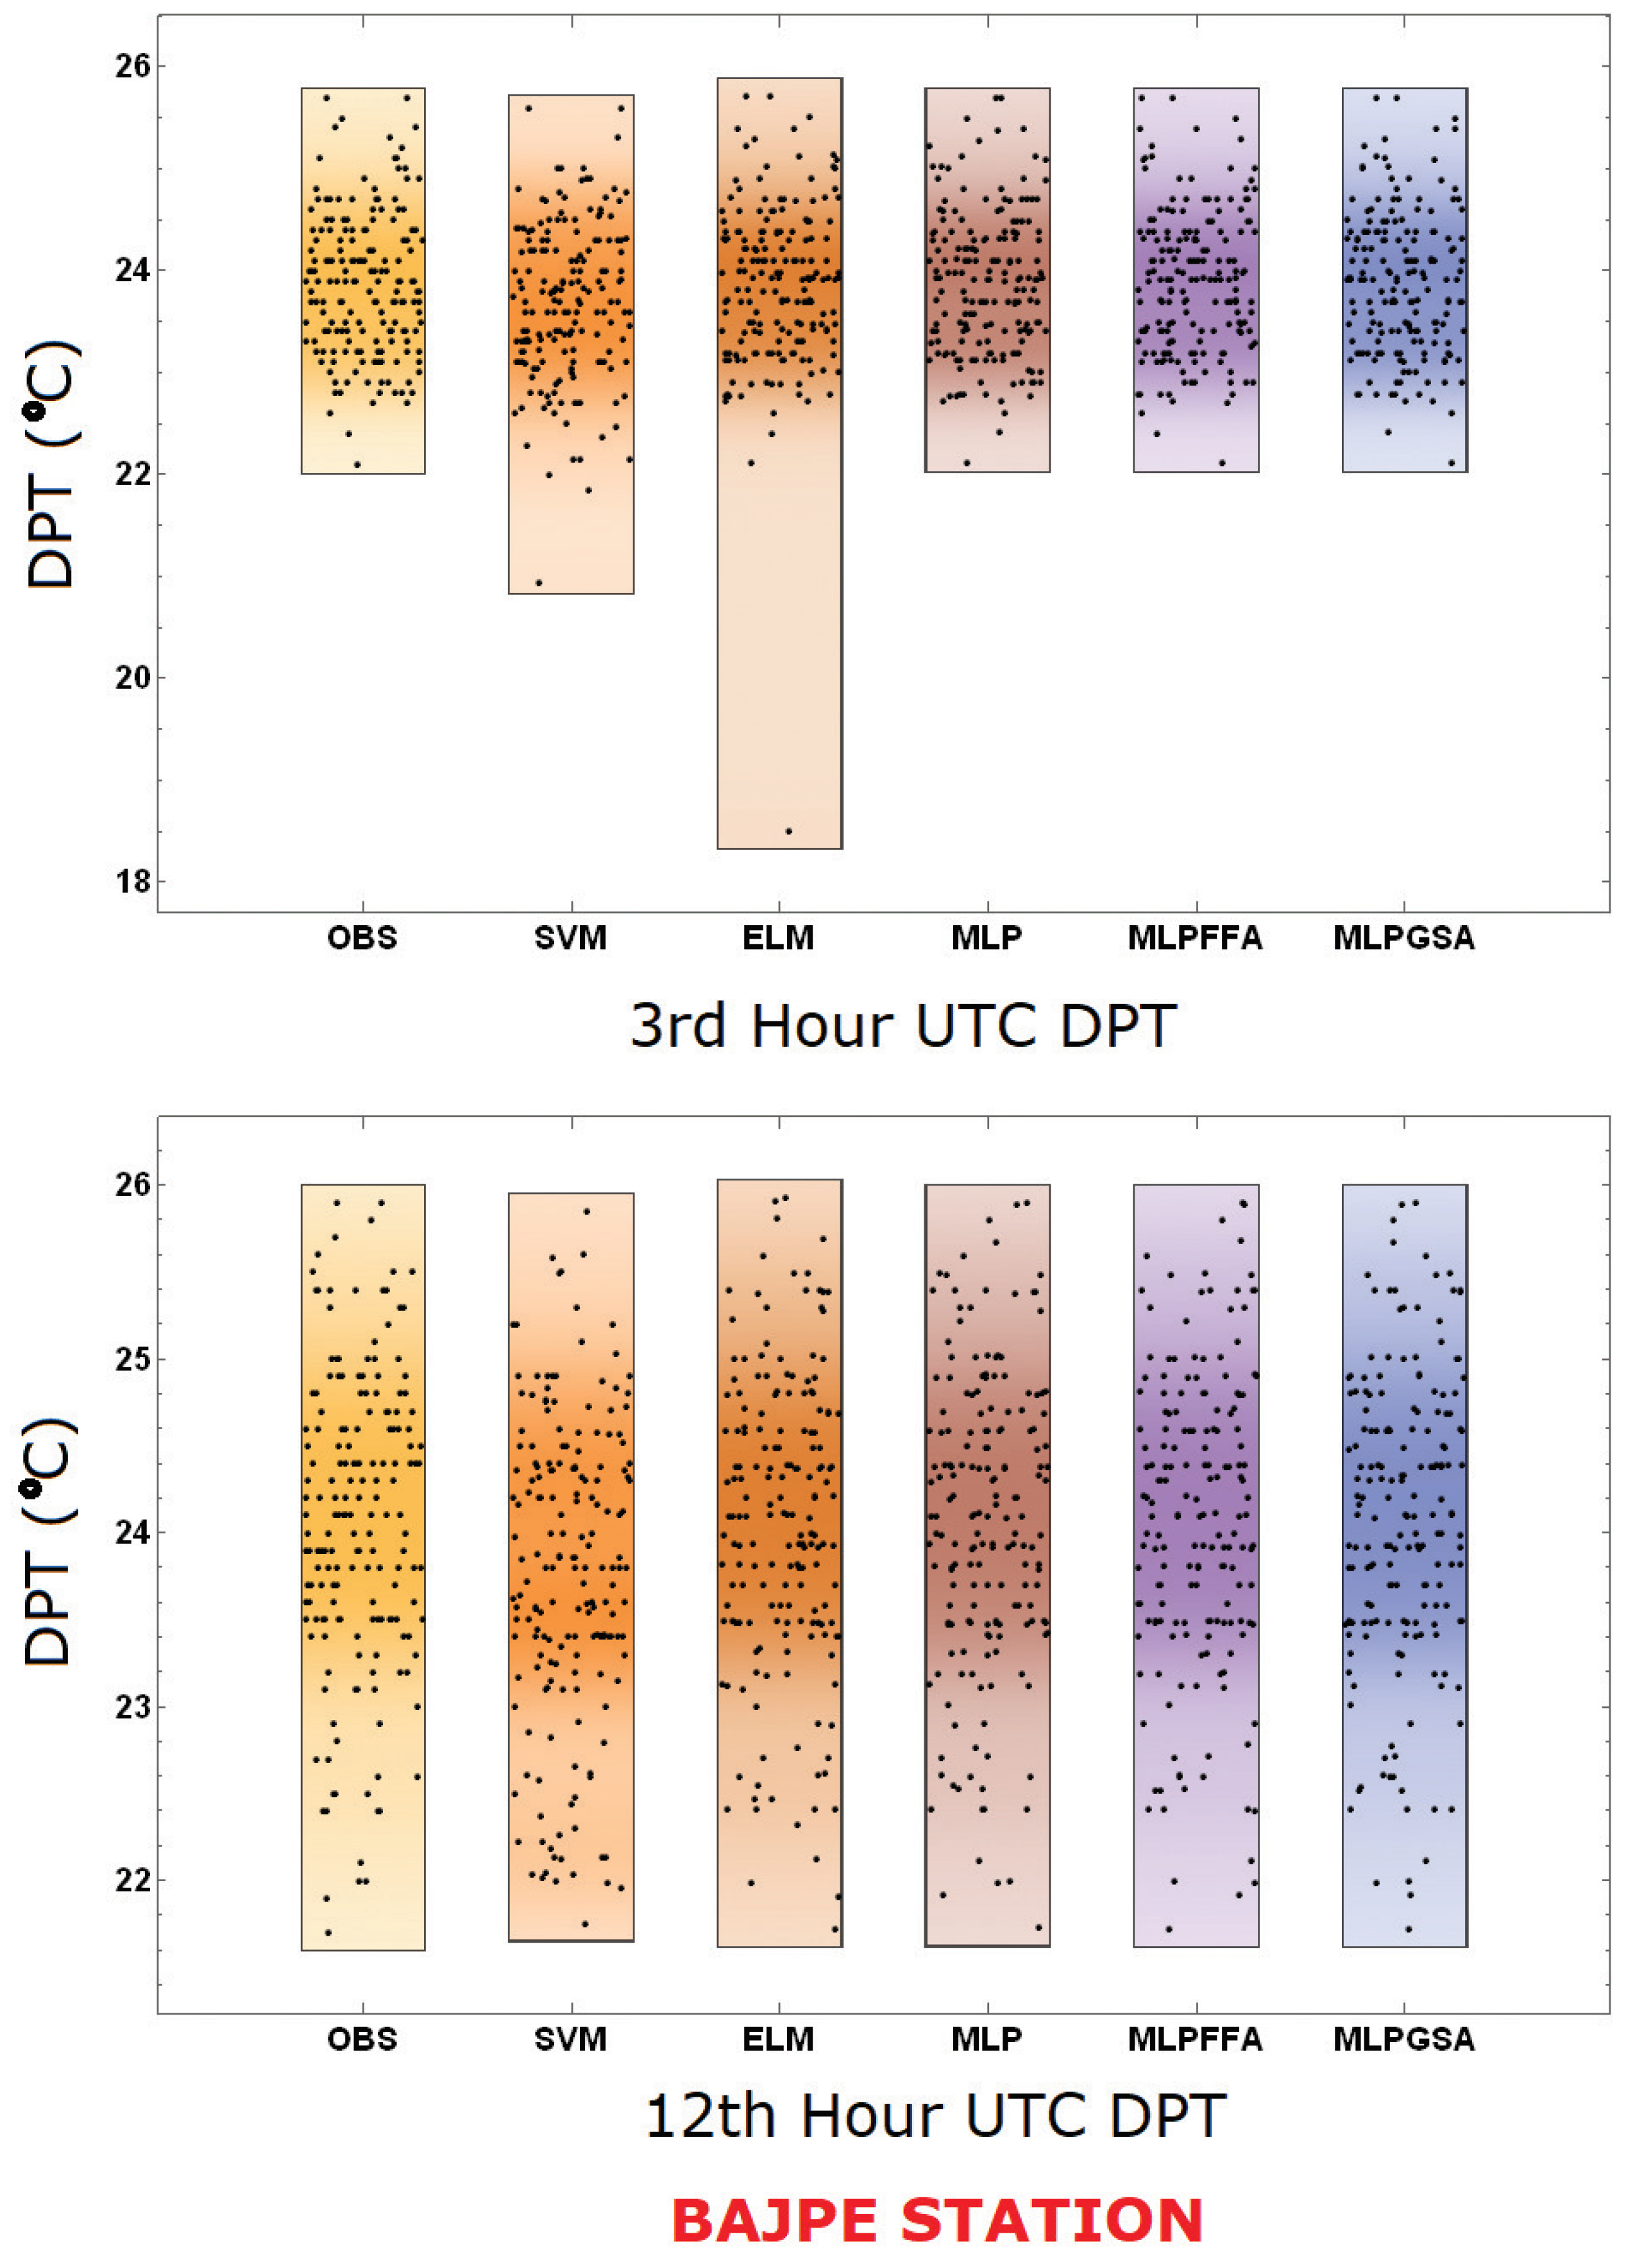
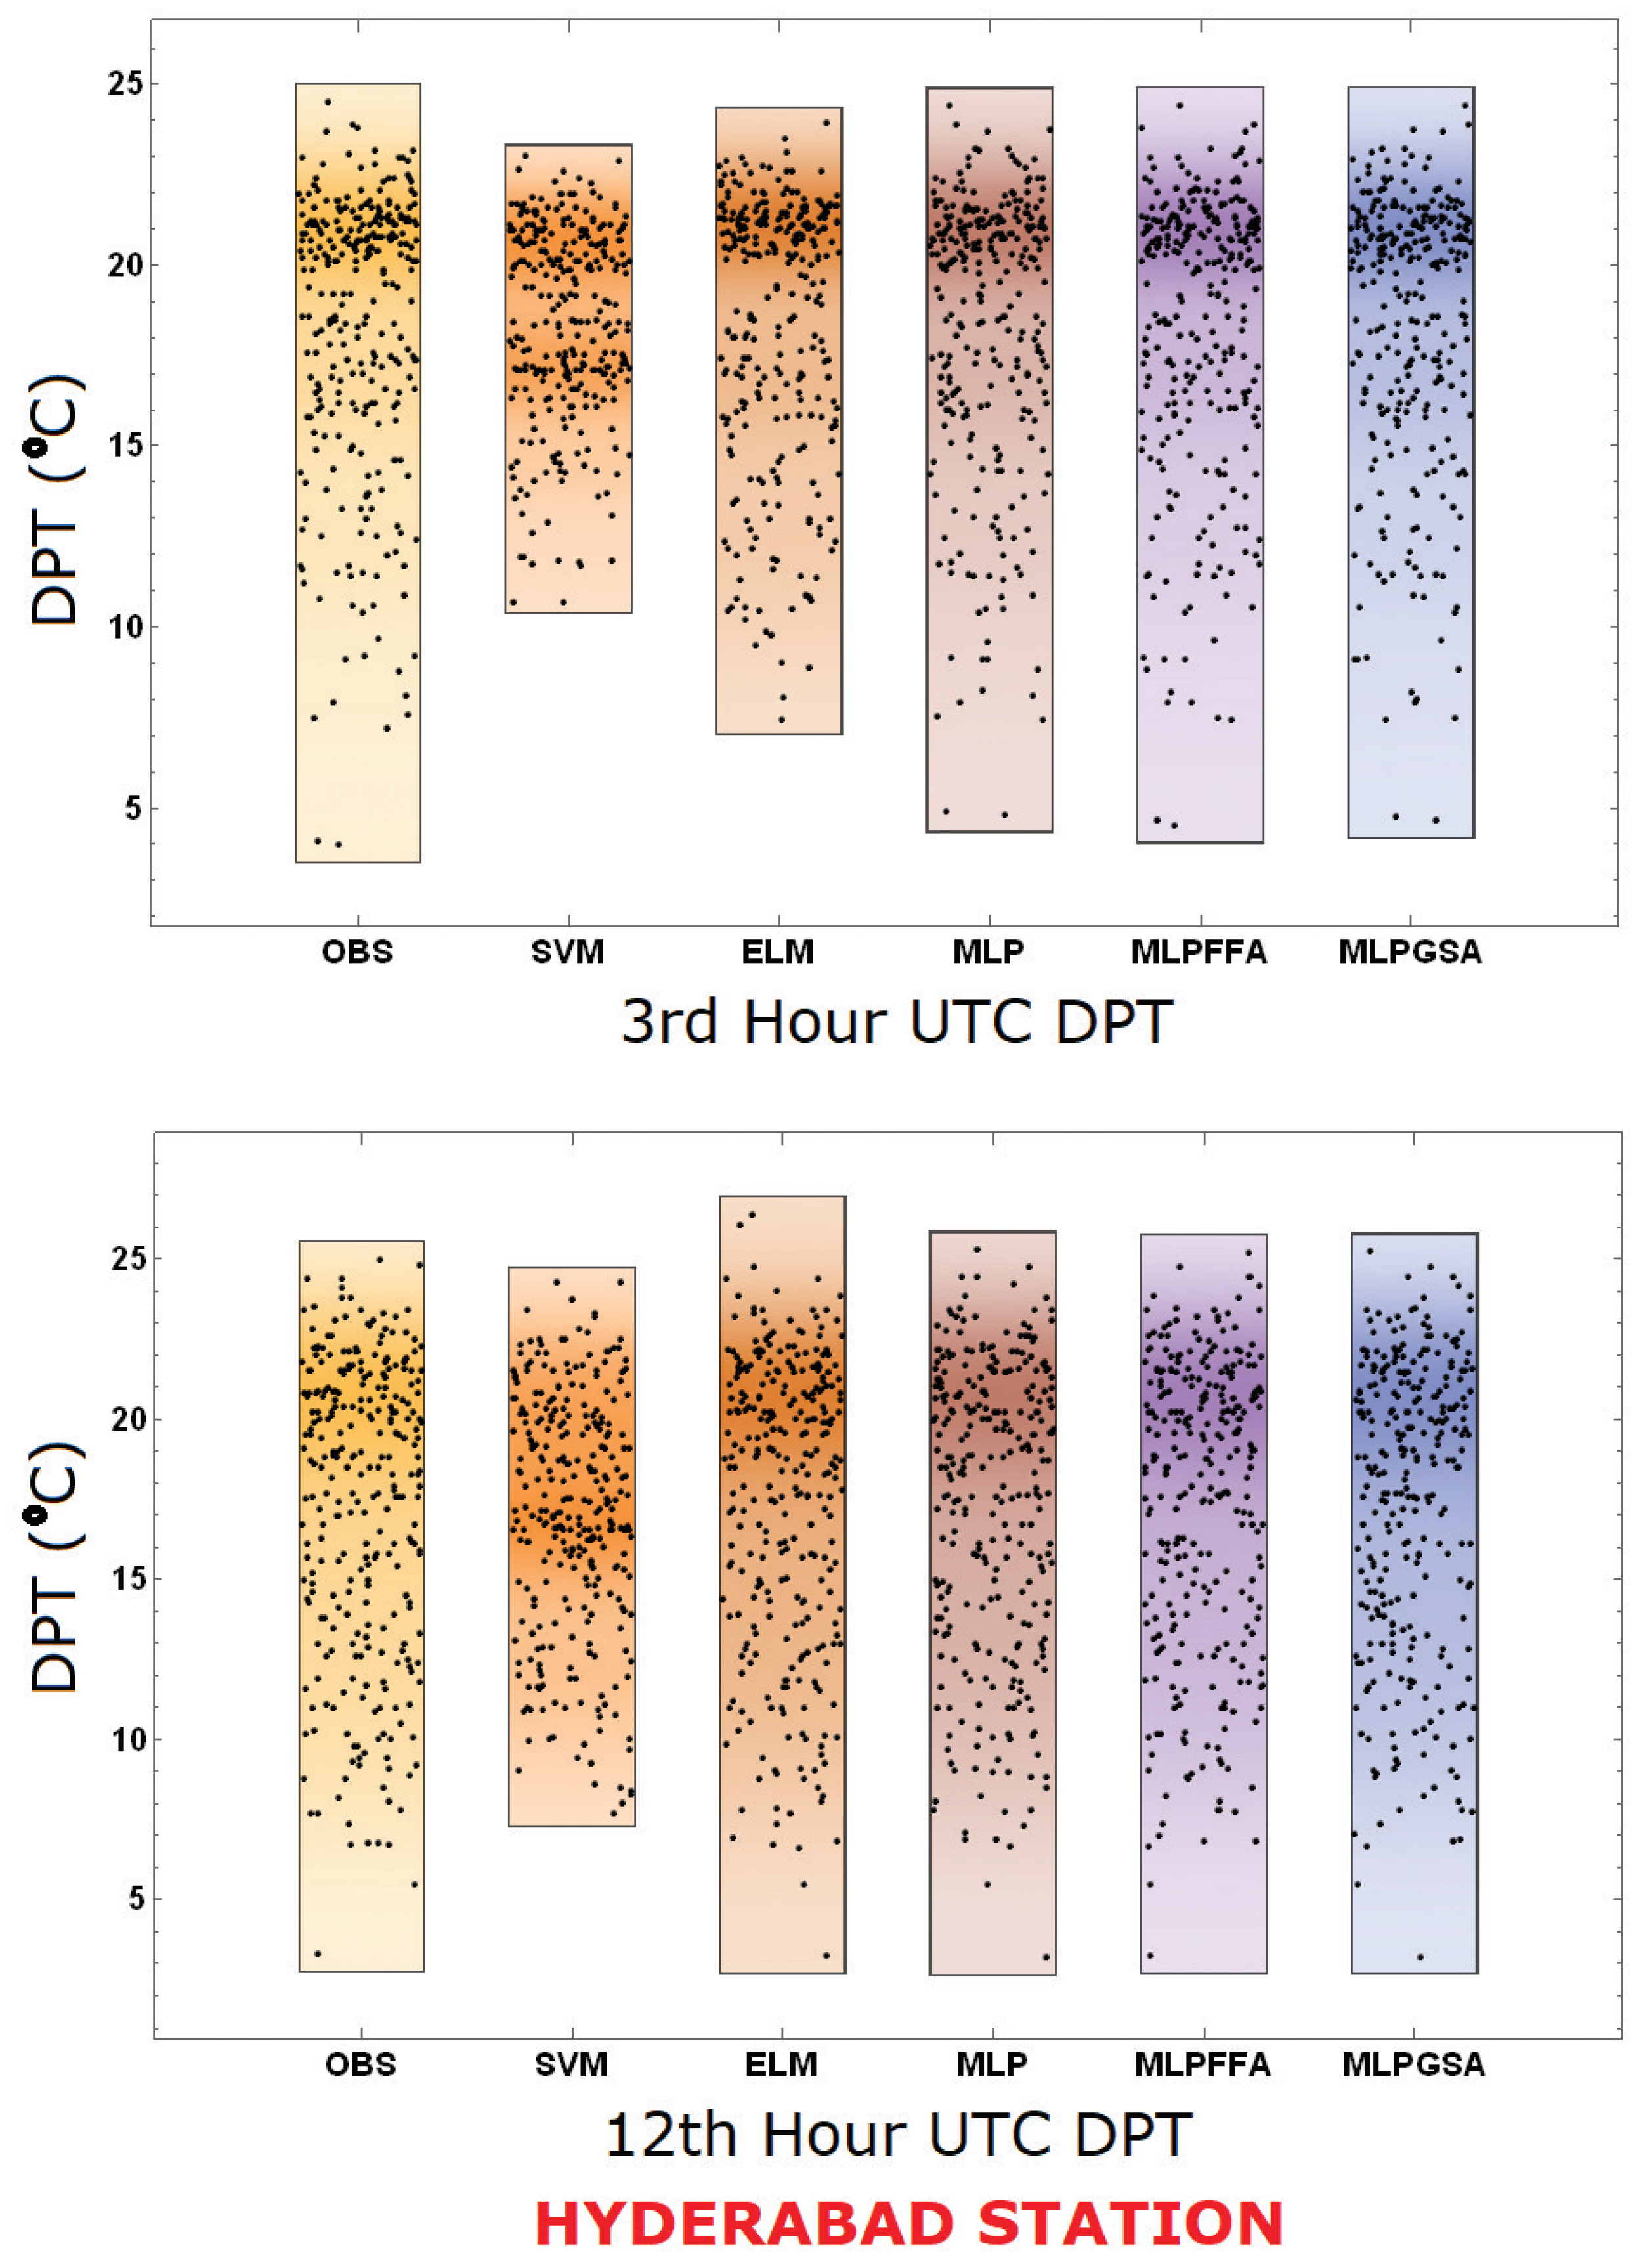
5. Results and Discussion
6. Conclusions
Author Contributions
Funding
Acknowledgments
Conflicts of Interest
References
- Wood, L.A. The use of dew-point temperature in humidity calculations. J. Res. Notional Bur. Stand. 1970, 74, 117–122. [Google Scholar] [CrossRef]
- Ben-Asher, J.; Alpert, P.; Ben-Zvi, A. Dew is a major factor affecting vegetation water use efficiency rather than a source of water in the eastern Mediterranean area. Water Resour. Res. 2010, 46, W10532. [Google Scholar] [CrossRef]
- Ahrens, C.D. Meteorology Today; Chapter Condensation: Dew, Fog, and Clouds; Thomson Higher Education: Belmont, CA, USA, 2007; pp. 106–137. [Google Scholar]
- Changnon, D.; Sandstrom, M.; Schaffer, C. Relating changes in agricultural practices to increasing Dew points in extreme Chicago heat waves. Clim. Res. 2003, 24, 243–254. [Google Scholar] [CrossRef]
- McHugh, T.A.; Morrissey, E.M.; Reed, S.C.; Hungate, B.A.; Schwartz, E. Water from air: An overlooked source of moisture in arid and semiarid regions. Sci. Rep. 2015, 5, 13767. [Google Scholar] [CrossRef] [PubMed]
- Agam, N.; Berliner, P. Dew formation and water vapor adsorption in semi-arid environments—A review. J. Arid Environ. 2006, 65, 572–590. [Google Scholar]
- Eccel, E. Estimating air humidity from temperature and precipitation measures for modelling applications. Meteorol. Appl. 2012, 19, 118–128. [Google Scholar] [CrossRef]
- Ebrahimpour, M.; Ghahreman, N.; Orang, M. Assessment of climate change impacts on reference evapotranspiration and simulation of daily weather data using SIMETAW. J. Irrig. Drain. Eng. 2014, 140, 04013012. [Google Scholar] [CrossRef]
- Mahmood, R.; Hubbard, K.G. Assessing bias in evapotranspiration and soil moisture estimates due to the use of modeled solar radiation and dew point temperature data. Agric. For. Meteorol. 2005, 130, 71–84. [Google Scholar] [CrossRef]
- McMahon, T.; Peel, M.; Lowe, L.; Srikanthan, R.; McVicar, T. Estimating actual, potential, reference crop and pan evaporation using standard meteorological data: A pragmatic synthesis. Hydrol. Earth Syst. Sci. 2013, 17, 1331–1363. [Google Scholar] [CrossRef]
- Roberts, J.S. Encyclopedia of Agricultural, Food and Biological Engineering; Chapter Dew Point Temperature; CRC Press: Boca Raton, FL, USA, 2003; pp. 186–191. [Google Scholar]
- Lawrence, M.G. The relationship between relative humidity and the Dewpoint temperature in moist air: A simple conversion and applications. Bull. Am. Meteorol. Soc. 2005, 86, 225–233. [Google Scholar]
- Pokhrel, P.; Wang, Q.; Robertson, D.E. The value of model averaging and dynamical climate model predictions for improving statistical seasonal streamflow forecasts over Australia. Water Resour. Res. 2013, 49, 6671–6687. [Google Scholar] [CrossRef] [Green Version]
- Liu, Z.; Zhou, P.; Chen, X.; Guan, Y. A multivariate conditional model for streamflow prediction and spatial precipitation refinement. J. Geophys. Res. Atmos. 2015, 120. [Google Scholar] [CrossRef]
- Liu, Z.; Cheng, L.; Hao, Z.; Li, J.; Thorstensen, A.; Gao, H. A framework for exploring joint effects of conditional factors on compound floods. Water Resour. Res. 2018, 54, 2681–2696. [Google Scholar] [CrossRef]
- Khedun, C.P.; Mishra, A.K.; Singh, V.P.; Giardino, J.R. A copula-based precipitation forecasting model: Investigating the interdecadal modulation of ENSO’s impacts on monthly precipitation. Water Resour. Res. 2014, 50, 580–600. [Google Scholar] [CrossRef]
- Tao, H.; Diop, L.; Bodian, A.; Djaman, K.; Ndiaye, P.M.; Yaseen, Z.M. Reference evapotranspiration prediction using hybridized fuzzy model with firefly algorithm: Regional case study in Burkina Faso. Agric. Water Manag. 2018, 208, 140–151. [Google Scholar] [CrossRef]
- Shank, D.B.; McClendon, R.W.; Paz, J.; Hoogenboom, G. Ensemble Artificial Neural Networks for prediction of Dew point temperature. Appl. Artif. Intell. 2008, 22, 523–542. [Google Scholar] [CrossRef]
- Zounemat-Kermani, M. Hourly predictive Levenberg–Marquardt ANN and multi linear regression models for predicting of Dew point temperature. Meteorol. Atmos. Phys. 2012, 117, 181–192. [Google Scholar] [CrossRef]
- Nadig, K.; Potter, W.; Hoogenboom, G.; McClendon, R. Comparison of individual and combined ANN models for prediction of air and Dew point temperature. Appl. Intell. 2013, 39, 354–366. [Google Scholar] [CrossRef]
- Kisi, O.; Kim, S.; Shiri, J. Estimation of Dew point temperature using Neuro-fuzzy and Neural network techniques. Theor. Appl. Climatol. 2013, 114, 365–373. [Google Scholar] [CrossRef]
- Shiri, J.; Kim, S.; Kisi, O. Estimation of daily Dew point temperature using Genetic Programming and Neural Networks approaches. Hydrol. Res. 2014, 45, 165–181. [Google Scholar] [CrossRef]
- Kim, S.; Singh, V.P.; Lee, C.J.; Seo, Y. Modeling the physical dynamics of daily Dew point temperature using soft computing techniques. KSCE J. Civ. Eng. 2015, 19, 1930–1940. [Google Scholar] [CrossRef]
- Mohammadi, K.; Shamshirband, S.; Motamedi, S.; Petković, D.; Hashim, R.; Gocic, M. Extreme learning machine based prediction of daily Dew point temperature. Comput. Electron. Agric. 2015, 117, 214–225. [Google Scholar] [CrossRef]
- Mohammadi, K.; Shamshirband, S.; Petković, D.; Yee, L.; Mansor, Z. Using ANFIS for selection of more relevant parameters to predict Dew point temperature. Appl. Therm. Eng. 2016, 96, 311–319. [Google Scholar] [CrossRef]
- Deka, P.C.; Patil, A.P.; Yeswanth Kumar, P.; Naganna, S.R. Estimation of dew point temperature using SVM and ELM for humid and semi-arid regions of India. ISH J. Hydraul. Eng. 2018, 24, 190–197. [Google Scholar] [CrossRef]
- Attar, N.F.; Khalili, K.; Behmanesh, J.; Khanmohammadi, N. On the reliability of soft computing methods in the estimation of dew point temperature: The case of arid regions of Iran. Comput. Electron. Agric. 2018, 153, 334–346. [Google Scholar] [CrossRef]
- Baghban, A.; Bahadori, M.; Rozyn, J.; Lee, M.; Abbas, A.; Bahadori, A.; Rahimali, A. Estimation of air Dew point temperature using computational intelligence schemes. Appl. Therm. Eng. 2016, 93, 1043–1052. [Google Scholar] [CrossRef]
- Al-Shammari, E.T.; Mohammadi, K.; Keivani, A.; Ab Hamid, S.H.; Akib, S.; Shamshirband, S.; Petković, D. Prediction of daily dewpoint temperature using a model combining the support vector machine with firefly algorithm. J. Irrig. Drain. Eng. 2016, 142, 04016013. [Google Scholar] [CrossRef]
- Amirmojahedi, M.; Mohammadi, K.; Shamshirband, S.; Danesh, A.S.; Mostafaeipour, A.; Kamsin, A. A hybrid computational intelligence method for predicting dew point temperature. Environ. Earth Sci. 2016, 75, 415. [Google Scholar] [CrossRef]
- Ludermir, T.B.; Yamazaki, A.; Zanchettin, C. An optimization methodology for neural network weights and architectures. IEEE Trans. Neural Networks 2006, 17, 1452–1459. [Google Scholar] [CrossRef]
- Lawrence, S.; Giles, C.L.; Tsoi, A.C. What Size Neural Network Gives Optimal Generalization? Convergence Properties of Backpropagation; Technical Report CS-TR-3617; University of Maryland: College Park, MD, USA, 1996. [Google Scholar]
- Lawrence, S.; Giles, C.L. Overfitting and neural networks: Conjugate gradient and backpropagation. In Proceedings of the IEEE-INNS-ENNS International Joint Conference on Neural Networks, Como, Italy, 27 July 2000; Volume 1, pp. 114–119. [Google Scholar]
- Nayak, J.; Naik, B.; Behera, H. A novel nature inspired firefly algorithm with higher order neural network: Performance analysis. Eng. Sci. Technol. Int. J. 2016, 19, 197–211. [Google Scholar] [CrossRef] [Green Version]
- Rashedi, E.; Nezamabadi-pour, H.; Saryazdi, S. GSA: A Gravitational Search Algorithm. Inf. Sci. 2009, 179, 2232–2248. [Google Scholar] [CrossRef]
- Yang, X.S. Firefly algorithm, stochastic test functions and design optimisation. Int. J. Bio-Inspired Comput. 2010, 2, 78–84. [Google Scholar] [CrossRef]
- Siddiquea, N.; Adelib, H. Applications of gravitational search algorithm in engineering. J. Civ. Eng. Manag. 2016, 22, 981–990. [Google Scholar] [CrossRef]
- Yang, X.S.; He, X. Firefly algorithm: Recent advances and applications. Int. J. Swarm Intell. 2013, 1, 36–50. [Google Scholar] [CrossRef]
- Gardner, M.W.; Dorling, S. Artificial Neural Networks (the Multilayer Perceptron)–a review of applications in the atmospheric sciences. Atmos. Environ. 1998, 32, 2627–2636. [Google Scholar] [CrossRef]
- Fabbian, D.; de Dear, R.; Lellyett, S. Application of artificial neural network forecasts to predict fog at Canberra International Airport. Weather Forecast. 2007, 22, 372–381. [Google Scholar] [CrossRef]
- Ghorbani, M.; Deo, R.C.; Yaseen, Z.M.; Kashani, M.H.; Mohammadi, B. Pan evaporation prediction using a hybrid multilayer perceptron-firefly algorithm (MLP-FFA) model: Case study in North Iran. Theor. Appl. Climatol. 2018, 133, 1119–1131. [Google Scholar] [CrossRef]
- Ghorbani, M.A.; Zadeh, H.A.; Isazadeh, M.; Terzi, O. A comparative study of artificial neural network (MLP, RBF) and support vector machine models for river flow prediction. Environ. Earth Sci. 2016, 75, 476. [Google Scholar] [CrossRef]
- Rumelhart, D.E.; McClelland, J.L. Parallel Distributed Processing; MIT Press: Cambridge, MA, USA, 1987; Volume 1. [Google Scholar]
- Lek, S.; Park, Y. Artificial Neural Networks. In Encyclopedia of Ecology; Academic Press: Oxford, UK, 2008; pp. 237–245. [Google Scholar]
- Haykin, S.S. Neural Networks and Learning Machines, 3rd ed.; Prentice-Hall: Upper Saddle River, NJ, USA, 2009; p. 906. [Google Scholar]
- Park, Y.S.; Lek, S. Artificial Neural Networks: Multilayer Perceptron for Ecological Modeling. In Ecological Model Types; Developments in Environmental Modelling; Elsevier: Amsterdam, The Netherlands, 2016; Volume 28, pp. 123–140. [Google Scholar]
- Zhang, L.; Liu, L.; Yang, X.S.; Dai, Y. A Novel Hybrid Firefly Algorithm for Global Optimization. PLoS ONE 2016, 11, 1–17. [Google Scholar] [CrossRef]
- Iztok, F.; Iztok, F.J.; Xin-She, Y.; Janez, B. A comprehensive review of Firefly algorithms. Swarm Evol. Comput. 2013, 13, 34–46. [Google Scholar]
- Raheli, B.; Aalami, M.T.; El-Shafie, A.; Ghorbani, M.A.; Deo, R.C. Uncertainty assessment of the multilayer perceptron (MLP) neural network model with implementation of the novel hybrid MLP-FFA method for prediction of biochemical oxygen demand and dissolved oxygen: A case study of Langat River. Environ. Earth Sci. 2017, 76, 503. [Google Scholar] [CrossRef]
- Ghorbani, M.A.; Deo, R.C.; Karimi, V.; Yaseen, Z.M.; Terzi, O. Implementation of a hybrid MLP-FFA model for water level prediction of Lake Egirdir, Turkey. Stoch. Environ. Res. Risk Assess. 2017, 32, 1683–1697. [Google Scholar] [CrossRef]
- Deo, R.C.; Ghorbani, M.A.; Samadianfard, S.; Maraseni, T.; Bilgili, M.; Biazar, M. Multi-layer perceptron hybrid model integrated with the Firefly optimizer algorithm for windspeed prediction of target site using a limited set of neighboring reference station data. Renew. Energy 2018, 116, 309–323. [Google Scholar] [CrossRef]
- Mirjalili, S.; Hashim, S.Z.M.; Sardroudi, H.M. Training Feedforward Neural Networks using hybrid particle swarm optimization and Gravitational Search Algorithm. Appl. Math. Comput. 2012, 218, 11125–11137. [Google Scholar] [CrossRef]
- Xing, B.; Gao, W.J. Gravitational Search Algorithm. In Innovative Computational Intelligence: A Rough Guide to 134 Clever Algorithms; Springer International Publishing: Berlin, Germany, 2014; pp. 355–364. [Google Scholar]
- Jadidi, Z.; Muthukkumarasamy, V.; Sithirasenan, E.; Sheikhan, M. Flow-Based Anomaly Detection Using Neural Network Optimized with GSA Algorithm. In Proceedings of the 2013 IEEE 33rd International Conference on Distributed Computing Systems Workshops, Philadelphia, PA, USA, 8–11 July 2013; pp. 76–81. [Google Scholar]
- Peel, M.C.; Finlayson, B.L.; McMahon, T.A. Updated world map of the Köppen-Geiger climate classification. Hydrol. Earth Syst. Sci. 2007, 11, 1633–1644. [Google Scholar] [CrossRef]
- De Moura Oliveira, P.B.; Oliveira, J.; Cunha, J.B. Trends in Gravitational Search Algorithm. In 14th International Conference on Distributed Computing and Artificial Intelligence; Omatu, S., Rodríguez, S., Villarrubia, G., Faria, P., Sitek, P., Prieto, J., Eds.; Springer International Publishing: Berlin, Germany, 2018; pp. 270–277. [Google Scholar]
- Taylor, K.E. Summarizing multiple aspects of model performance in a single diagram. J. Geophys. Res. Atmos. 2001, 106, 7183–7192. [Google Scholar] [CrossRef] [Green Version]


| Correlation Co-Efficient | Bajpe Station | Hyderabad Station | ||
|---|---|---|---|---|
| 3rd Hour UTC | 12th Hour UTC | 3rd Hour UTC | 12th Hour UTC | |
| DPT (C) | DPT (C) | DPT (C) | DPT (C) | |
| WBT (C) | 0.97 | 0.9 | 0.9 | 0.87 |
| RH (%) | 0.75 | 0.8 | 0.69 | 0.83 |
| VP (hPa) | 0.99 | 0.99 | 0.98 | 0.99 |
| DPT (C) | 1 | 1 | 1 | 1 |
| TRAIN | TEST | ||||||||
|---|---|---|---|---|---|---|---|---|---|
| WBT (C) | RH (%) | VP (hPa) | DPT (C) | WBT (C) | RH (%) | VP (hPa) | DPT (C) | ||
| Bajpe Station | 3rd Hour UTC | ||||||||
| Min | 15.6 | 39 | 11.7 | 9.3 | 22.6 | 73 | 25.3 | 22.1 | |
| Max | 24.4 | 78 | 27.9 | 22.9 | 24.8 | 84 | 29.3 | 23.7 | |
| Mean | 23.1 | 77 | 25.95 | 21.65 | 24.6 | 82.5 | 29.1 | 23.6 | |
| S.Dev. | 1.83 | 1.41 | 2.75 | 1.76 | 0.28 | 2.12 | 0.28 | 0.14 | |
| Var. | 3.38 | 2 | 7.6 | 3.12 | 0.08 | 4.5 | 0.08 | 0.02 | |
| Skew. | −0.97 | −0.83 | −1.04 | −1.46 | 1.17 | 0.72 | 0.18 | 0.19 | |
| 12th Hour UTC | |||||||||
| Min | 19.8 | 27 | 13.3 | 11.2 | 25 | 65 | 27.6 | 22.7 | |
| Max | 24.8 | 66 | 27.1 | 22.4 | 25.8 | 82 | 31.3 | 24.8 | |
| Mean | 24.3 | 65 | 26.35 | 21.95 | 25.4 | 73.5 | 29.45 | 23.75 | |
| S.Dev | 0.7 | 1.41 | 1.06 | 0.63 | 0.56 | 12.02 | 2.61 | 1.48 | |
| Var. | 0.5 | 2 | 1.125 | 0.4 | 0.32 | 144.5 | 6.845 | 2.205 | |
| Skew. | −0.72 | 0.1 | −0.86 | −1.27 | −0.57 | −0.14 | −0.18 | −0.31 | |
| Hyderabad Station | 3rd Hour UTC | ||||||||
| Min | 10.6 | 26 | 7.7 | 3.3 | 17.2 | 29 | 11.3 | 8.8 | |
| Max | 19 | 73 | 16.5 | 14.5 | 19 | 86 | 20.8 | 18.1 | |
| Mean | 17.7 | 59 | 16.3 | 14.3 | 18.1 | 57.5 | 16.05 | 13.45 | |
| S.Dev. | 1.83 | 19.79 | 0.28 | 0.28 | 1.27 | 40.3 | 6.71 | 6.57 | |
| Var. | 3.38 | 392 | 0.08 | 0.08 | 1.62 | 162.5 | 45.12 | 43.24 | |
| Skew. | −0.57 | −0.35 | −0.34 | −0.75 | −0.93 | −0.3 | −0.69 | −1.14 | |
| 12th Hour UTC | |||||||||
| Min | 17.8 | 25 | 13.9 | 11.9 | 20.4 | 23 | 13.1 | 11 | |
| Max | 21.4 | 40 | 14.8 | 12.8 | 20.6 | 55 | 19.6 | 17.2 | |
| Mean | 19.6 | 32.5 | 14.35 | 12.35 | 20.5 | 39 | 16.35 | 14.1 | |
| S.Dev. | 2.54 | 10.6 | 0.63 | 0.63 | 0.14 | 22.62 | 4.59 | 4.38 | |
| Var. | 6.48 | 112.5 | 0.405 | 0.405 | 0.02 | 512 | 21.12 | 19.22 | |
| Skew | −0.32 | 0.63 | 0.19 | −0.19 | −0.71 | 0.41 | −0.26 | −0.65 | |
| MLP–FFA | MLP–GSA |
|---|---|
| Maximum iterations = 180 | Maximum iterations = 180 |
| Population size: 50 | Population size: 50 |
| = 0.9 | Acceleration Co-efficients () = 1 |
| = 1 | (weighting function) = [0.4, 0.9] |
| = 0.97 | Initial velocities of agents are randomly |
| = 0.6 | generated in the interval [0,1] |
| MODEL | Model Parameters/Structure | Testing | |||
|---|---|---|---|---|---|
| RMSE (C) | MAE (C) | NSE | |||
| 3rd hour UTC | SVM * | 28,8,0.01 | 0.480 | 0.210 | 0.520 |
| ELM * | 3-40-1 | 0.380 | 0.040 | 0.690 | |
| MLP | (3,16,1) | 0.051 | 0.016 | 0.995 | |
| MLP–FFA | (3,16,1) | 0.034 | 0.011 | 0.998 | |
| MLP–GSA | (3,16,1) | 0.041 | 0.013 | 0.997 | |
| 12th hour UTC | SVM * | 28,7,0.01 | 0.520 | 0.28 | 0.62 |
| ELM * | 3-90-1 | 0.100 | 0.02 | 0.9 | |
| MLP | (3,13,1) | 0.039 | 0.016 | 0.998 | |
| MLP–FFA | (3,13,1) | 0.026 | 0.010 | 0.999 | |
| MLP–GSA | (3,13,1) | 0.031 | 0.013 | 0.999 | |
| Note: Model Parameters of SVM—(C, ); ELM—(input–hidden–output layer neurons); MLP—(input, hidden, output layer neurons) | |||||
| MODEL | Model Parameters/Structure | Testing | |||
|---|---|---|---|---|---|
| RMSE (C) | MAE (C) | NSE | |||
| 3rd hour UTC | SVM * | 37,12,0.01 | 2.360 | 1.040 | 0.630 |
| ELM * | 3-50-1 | 0.630 | 0.320 | 0.950 | |
| MLP | (3,4,1) | 0.104 | 0.051 | 0.999 | |
| MLP–FFA | (3,4,1) | 0.069 | 0.034 | 0.999 | |
| MLP–GSA | (3,4,1) | 0.083 | 0.041 | 0.999 | |
| 12th hour UTC | SVM * | 41,14,0.01 | 1.980 | 1.050 | 0.820 |
| ELM * | 3-70-1 | 0.590 | 0.140 | 0.970 | |
| MLP | (3,19,1) | 0.134 | 0.052 | 0.999 | |
| MLP–FFA | (3,19,1) | 0.089 | 0.034 | 0.999 | |
| MLP–GSA | (3,19,1) | 0.107 | 0.041 | 0.999 | |
| Note: Model Parameters of SVM—(C, ); ELM—(input–hidden–output layer neurons); MLP—(input, hidden, output layer neurons) | |||||
© 2019 by the authors. Licensee MDPI, Basel, Switzerland. This article is an open access article distributed under the terms and conditions of the Creative Commons Attribution (CC BY) license (http://creativecommons.org/licenses/by/4.0/).
Share and Cite
Naganna, S.R.; Deka, P.C.; Ghorbani, M.A.; Biazar, S.M.; Al-Ansari, N.; Yaseen, Z.M. Dew Point Temperature Estimation: Application of Artificial Intelligence Model Integrated with Nature-Inspired Optimization Algorithms. Water 2019, 11, 742. https://doi.org/10.3390/w11040742
Naganna SR, Deka PC, Ghorbani MA, Biazar SM, Al-Ansari N, Yaseen ZM. Dew Point Temperature Estimation: Application of Artificial Intelligence Model Integrated with Nature-Inspired Optimization Algorithms. Water. 2019; 11(4):742. https://doi.org/10.3390/w11040742
Chicago/Turabian StyleNaganna, Sujay Raghavendra, Paresh Chandra Deka, Mohammad Ali Ghorbani, Seyed Mostafa Biazar, Nadhir Al-Ansari, and Zaher Mundher Yaseen. 2019. "Dew Point Temperature Estimation: Application of Artificial Intelligence Model Integrated with Nature-Inspired Optimization Algorithms" Water 11, no. 4: 742. https://doi.org/10.3390/w11040742
APA StyleNaganna, S. R., Deka, P. C., Ghorbani, M. A., Biazar, S. M., Al-Ansari, N., & Yaseen, Z. M. (2019). Dew Point Temperature Estimation: Application of Artificial Intelligence Model Integrated with Nature-Inspired Optimization Algorithms. Water, 11(4), 742. https://doi.org/10.3390/w11040742