Abstract
Karst watersheds are often treated as non-karst watersheds that can lead to several hazards. Hence, how do karst watersheds differ from non-karst watersheds and what are the effects of karstification on groundwater availability and quality? In this study, we contrast between a karst and non-karst watershed by elucidating their geomorphological peculiarities and potential impact on spatio-temporal availability and quality of groundwater. GIS morphometric mapping and hydrograph recession analysis are applied to map the watershed features and estimate hydrograph recession coefficient to define the groundwater drainage characteristics as well as the influence of karst drainage attributes (KDA). Furthermore, we characterize streamflow components based on the hydrograph recession limbs (segments) and infer their contributing geomorphological factors. Results show that the karst watershed has higher recession coefficients for successive recession limbs. Consequently, it drains larger volumes of groundwater primarily due to the KDAs, which transmit interflow and groundwater flow more rapidly through large cavities to springs as well as stream channels. The KDAs generate what we term karst drainage flow (KDF), defined by the second recession limb which has high recession coefficient as the first limb (overland flow) and strongly contrasts with the non-karst watershed from visual and ANOVA analysis. The effect is that karst aquifer yield over time is significantly lower and highly exposed to pollution compared to the non-karst aquifer. Consequently, sustainable water management practices should be adopted to ensure the availability and safety of groundwater reserves.
1. Introduction
Groundwater resources in karst regions are under increased pressure from rapid population growth and increased agricultural as well as industrial activities [1]. In China alone, over 100 million people rely on karst water resources [2]. The multiple porosity matrix in carbonate rocks (limestone, dolostone, gypsum, quartzite, and halite) gives karst aquifers the capacity to house large volumes of water, but also, this extreme heterogeneity (secondary and tertiary porosities) from fractures and underground conduits can result in enhanced flow thereby reducing storage and also increase aquifer sensitivity to pollution [3]. Therefore, due to these special characteristics of karst systems, accurate assessment of quality and quantity of karst water is imperative. Unfortunately, karst groundwater systems are often treated as that of non-karst areas, which has led to groundwater pollution risks as well as other environmental and geological hazards [4,5].
Generally, watersheds are bound by high relief which serves as drainage for all precipitation that occurs within it to a single outlet. Therein, precipitation is the most potent catalyst that drives geomorphological work. Typical watersheds comprise of some common components such as a natural stream network, defined catchment divide, general orientation downstream as well as composite geology. These components and their morphometric characteristics define the general catchment response to rainfall events. The primary groundwater drainage controls are topography and geology, with other essential factors being basin physiographic characteristics and stream network length and density. In this study, we focus mainly on the geomorphological peculiarities since karst geological features have direct impacts on groundwater infiltration and drainage, which can lead to large yield due to higher hydraulic conductivity. Conversely, non-karst terrains such as crystalline formations, are known for absences of primary porosity and lower hydraulic potential, but lend itself to the development of thick saprolite overburden that can hold and convey large quantities of water over time [6]. Thus, in basins where the underlying geology is crystalline (hard rock) with exceptionally high regolith and fluvial deposit, this sediment layer can retain large volumes of delayed flow and as such can become a more critical baseflow-sustaining reservoir than the underlying solid bedrock [7].
In this study, we compare between two watersheds, a karst (Miaogou) basin characterized by sedimentary carbonate rocks and a non-karst (Gaojiaping) basin of mainly crystalline rocks. The karst watershed is our primary focus as the objective is to determine how karst geomorphological features impact the interaction between surface and groundwater hydrology in contrast to the non-karst watersheds. Furthermore, we assess the consequences on groundwater availability and quality, as these issues have not been adequately addressed in previous literature. Using streamflow data collected at the outlets of both Miaogou and Gaojiaping watersheds, we analyzed the storm hydrographs of both watersheds with particular focus on the recession curve to determine the recession coefficient of successive limb segments on the curve. Streamflow recession curve holds important information concerning the watershed geology, storage and aquifer properties [8,9,10]. Geomorphological characteristics influencing the hydrograph can be inferred from hydrograph recession curve analysis due to its correlation with watershed geomorphology and hydrogeology [11,12,13,14,15,16,17]. For example, Kullman [15], Luo et al. [16], and Fiorillo et al. [17] applied hydrograph recession analysis to characterize properties of karstic aquifers. Also, Malı’k [18] applied the recession coefficient to determine regional karstification degree as well as groundwater sensitivity to pollution. Hence, recession curve analysis can improve our understanding of low flow periods and aquifer contribution to streamflow which is significant for ensuring sustainable water resources management. Additionally, it is noteworthy that, recently, residents of Miaogou (karst) watershed have been experiencing a shortage of groundwater especially during dry periods of the hydrologic year. This has raised concerns on the availability and quality of groundwater resources in the area, which makes this particular study of importance.
Study Area
Gaolan River basin is located in Xingshan County, western Hubei Province, Southern China. It is characterized by a subtropical monsoon climate with abundant rainfall that averages 900–1200 mm annually. These climate parameters have a direct influence on the karst geomorphology since karstification process is water dependent. The two case study watersheds, Miaogou and Gaojiaping, are less than 9 km apart from each other in Gaolan River basin. Miaogou karst watershed is underlain by a well-developed karst terrain with a surface elevation that ranges between 430 to 1770 m.a.s.l. The predominant carbonate rock in the area is limestone of Cambrian age, which appears like rounded hills or isolated towers (typical of tropical karst). Non-carbonate rocks present in the area are mudstone and shale of Silurian and Lower Cambrian ages, respectively (Figure 1). The karst areas are characterized by large depressions, sinkholes, caves, and several springs, some of which are shown in Figure 2. The landcover is predominantly a mixture of Agriculture land and Evergreen Forest. Gaojiaping (non-karst) watershed has about 75% of its entire catchment underlain by an igneous rock while 15% and 10% is metamorphic and carbonate rocks, respectively. The exposed igneous and metamorphic strata are mainly Proterozoic where the igneous comprises of granite and diorite. The metamorphic rocks are comprised mainly of slant gneiss, graphite gneiss, gneiss, and granulite. This composition collectively forms the ancient crystalline basement in the area where the landcover is mainly evergreen forest.
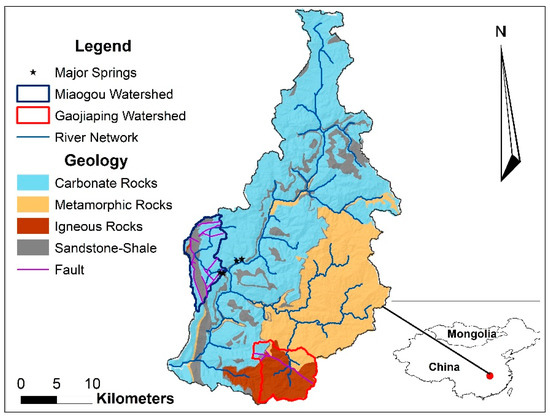
Figure 1.
Major geological units in Gaolan River basin, Hubei Province, South China (Source: China Geological Survey).
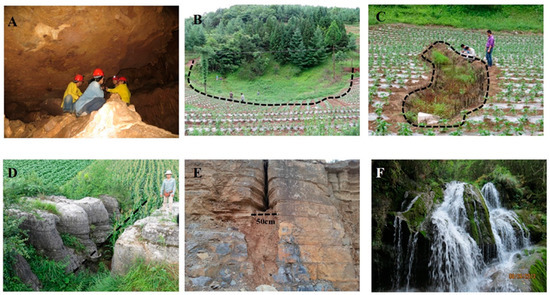
Figure 2.
Some karst features located in Miaogou watershed and environs (A) Xiaosanyou Cave; (B) doline with dotted lines enunciating the perimeter; (C) large sinkhole with dotted lines enunciating the perimeter; (D) vracture with dotted lines enunciating the orientation of fracture; (E) epikarst; and (F) bailongquan spring.
2. Data and Methods
2.1. GIS Watershed Characterization
Several studies have applied GIS and Remote Sensing data and methods for different terrains, and they have proved to be efficient for the characterization of drainage parameters [19,20,21]. The digital elevation model (DEM) and its derivative dataset (slope, aspect etc.) constitute the building blocks for defining the watershed boundary, flow direction, and stream network, which are generally prepared as input for hydrologic models [22,23,24,25,26,27,28,29]. Extrapolating the stream order is conducted based on the hierarchical order method as proposed by Strahler [30] from flow accumulation and flow direction data-sets derived based on the eight-direction pour point algorithm [29,31,32,33] as a module in ArcGIS surface analysis utilizes DEM raster for determining flow direction of grid cells out of their eight neighbouring cells. Extrapolating the stream order is conducted based on the hierarchical order as proposed by Strahler [30]. This is achieved from the flow accumulation and flow direction data-set as derived from the DEM. Since several studies have been carried out describing these methods we will not dwell on it here. For a more detailed description, the reader may refer to Reference [29]. Since several studies have been carried out describing these methods, we will not dwell on it here. For a more detailed description, the reader may refer to Dixon and Uddameri [29]. Figure 3 shows 30 m × 30 m resolution SRTM DEM data for both study areas.
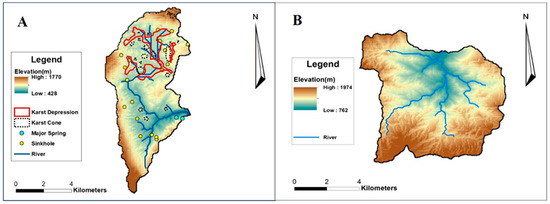
Figure 3.
SRTM DEM data (30 × 30 m) for Miaogou (A) and Gaojiaping (B) watersheds (source: https://earthexplorer.usgs.gov/).
2.2. Hydrograph Recession Curve Analysis
As stated earlier, the recession curve refers to the part of the hydrograph that comes after the crest (peak). The recession curve can be characterized by a uniform recession limb or a set of turbulent segments as the curve regresses over time. The segments or inflection points are generally associated with the non-linearity in rock and soil media storage structure which that contributes to streamflow, generally in the form of interflow and baseflow. The segments on the recession curve have been analyzed in the past using several methods, including the exponential method to determine the discharge processes that make up the total streamflow. The exponential function was first expressed by Boussinesq [34] and Maillet [35], expressed as;
Since then, it has been widely used for hydrograph recession and base-flow analyses for low flow forecasting, drainage basin studies, pollution sensitivity studies [12,14,15,16,17,18,36,37]. This model can describe a relatively closed, independent and large reservoirs whose main water source is precipitation and major losses are through streamflow discharge [16]. Miao and Miao [38] showed how it could be used to describe the drainage of the aquifer reserves over time. The exponential equation can be expanded and further expressed for multiple time-steps as:
where Q0 is the initial flow; Qt is the flow at any moment, and α is the recession coefficient (coefficient of discharge) with dimension [T−1]. It is estimated by plotting the recession limb in a semi-logarithmic plot where Equation (1) appears as a straight-line plot with constant slope independent of the initial Q0 value [16]. Based on the logarithmic scale, the recession curves can generally be classified into several segments, as shown in Figure 4, based on inflection points which are indicative of a transition (micro-regimes) in the drainage structure. Consequently, we can infer major sources and storage systems such as overland and subsurface flows as well as estimate specific volumes of each segment (area under the curve) (Figure 4). For heterogeneous aquifers, on a small scale, especially in areas with highly karstified media, the recession curve can be classified into three (3) or more segments [16,17]. Aquifers with a linear storage function have been reported to have no significant inflections and thus can be hardly segmented. Therefore, it can be understood that the non-linear recession curve cannot be solved only by Equation (1). However, by assuming each recession segment as one being “constant” and the second “decaying,” then it can be solved using the form expressed in Equations (3) and (4).
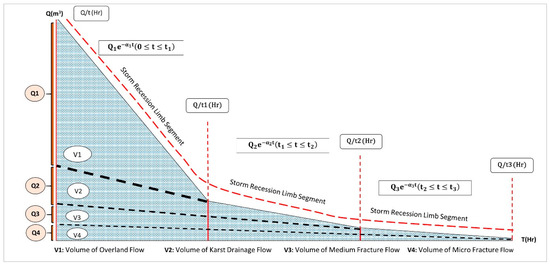
Figure 4.
Schematic presentation of the hydrograph recession limb with four recession segments and corresponding volumes of discharged water (adapted from Kresic N. and Bonacci O. [39]).
From Equation (4), considering Q is known, α (recession coefficient) can then be solved for each segment. Additionally, each segment can be quantified and uniquely defined by integrating the flow at initial time step t0, which represents the lower limit and the next time step being the upper limit, while maintaining the recession coefficients for each time step, respectively, expressed as;
In addition, the total percentage volume of each component (Vi, i=1, 2, 3) to total water storage capacity (V0) is calculated as;
2.3. Streamflow Data
The streamflow data were collected using an automatic ultrasonic water level gauge (CJ 800) stationed at the outlet of both Miaogou and Gaojiaping watersheds. By visually analysing the hydrograph trend (Figure 5), especially the recession limb, it would be noted that for the karst watershed, the recession is smoother and less turbulent than that of the non-karst watershed. This can be attributed to the very large subsurface karst conduits that easily drain percolated precipitation out of the watershed. The recession limb of the non-karst watershed is more turbulent and thus, indicative of a more segmented drainage due to some active geomorphological impediments. In other words, the karst watershed seems to have a more linear reservoir system. Also, the data shows that the karst watershed generally has less volume of discharge during dry periods (November-March, which marks the dry winter season in the catchment area). During this period, groundwater levels are generally at their lowest making abstraction more difficult, especially in Maiogou. Thus, fifteen hydrographs were selected from 2015 and 2016 for the recession curve analysis for this study.
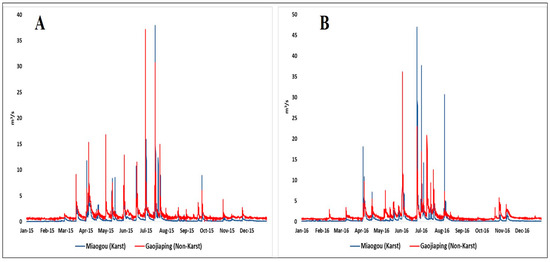
Figure 5.
Streamflow data for Miaogou and Gaojiaping Watersheds for 2015 (A) and 2016 (B).
3. Results and Discussion
3.1. Topographic Analysis
Topography is defined by the general relief of an area, slope as well as the drainage divide which delineates the surface water basin. The hypsographic curve of Miaogou watershed shown in Figure 6 illustrates a complex surface relief where the minimum altitude is 436m while the maximum is 1780 m in an area of only 45 km2. The frequency polygons are divided into 10 topographic classes for both watersheds. In the karst catchment, there are considerable amounts of low to flat-lying areas, which are actually karst depressions that extend between karst cones (domes). About 8.5% of the total area of the watershed ranges between 436–770 m while 63% range between 840–1100 m and 31.5% range between 1175–1780 m. This will have a substantial impact on time of concentration for runoff as well as erosion and sediment transport. Furthermore, since infiltration is inversely related to slope, it, therefore, means that the flat slope areas will contribute more to groundwater recharge, especially with the extensive distribution of sinks in and around these low areas. Conversely, the relief in Gaojiaping watershed is more evenly distributed with gentler slopes. No consecutive areas between two contour intervals were found to be higher than 10% of the entire watershed. This is very different to Miaogou watershed where four classes (7–10) of contour intervals alone cover 15.02, 19.4, 17.6, and 12.45% of the watershed area, respectively (Figure 6). This highlights the impact of carbonate dissolution in creating a rugged topography compared to the more homogenous crystalline watershed. The phenomenon of highly heterogeneous relief system in Miaogou makes for a more dynamic inter-fluvial process within the watershed thereby promoting more carbonate dissolution, higher drainage density (as is the case), and easy diversion of runoff processes into caves, sinks, and dolines within the catchment.
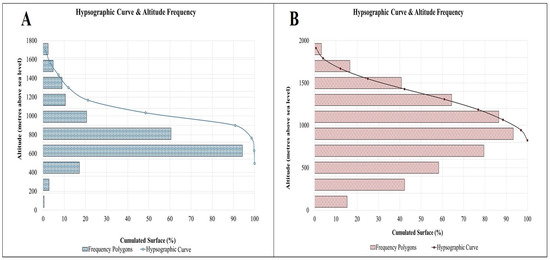
Figure 6.
Hypsographic Curves of Miaogou (A) and Gaojiaping (B) Watershed.
3.2. Drainage Network Analysis
Surface hydraulic transport mechanisms are driven by stream channels and their hierarchy which defines drainage density. Miaogou and Gaojiaping stream networks were extracted, and the main channel length as illustrated in Figure 7. Results from hydrographic computations (Table 1) show the karst watershed area to be 45 km2 and main stream channel to be about 15 km long while the total length of drainage is 30.86 km. Gravelius index was calculated to be 1.93, which is indicative of an elongated drainage system with the potential of having low runoff time of concentration and consequently gentler hydrograph peak. The drainage density is about 0.68 km2, which is same as the stream density is 0.68, while the average length of surface runoff is 0.36.
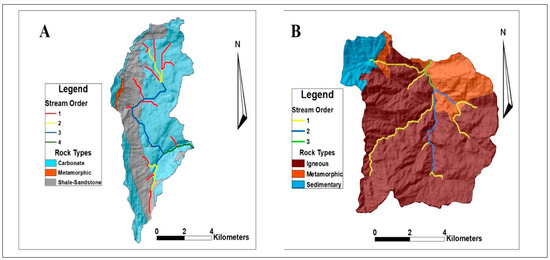
Figure 7.
Stream network order (Strahler Order, [30]) of Miaogou (A) and Gaojiaping (B) watershed.

Table 1.
Summary of parameters for both Miaogou (karst) and Gaojiaping (Non-karst) watersheds.
On the other hand, Gaojiaping watershed area is computed to be 54 km2 (Table 1) while its primary stream channel is 11.91 km long and shorter than that of Miaogou. The total length of its drainage is 25.06 km and also lesser than Miaogou, implying that overall, Gaojiaping watershed has shorter stream channels for the conveyance of its total runoff as compared to Miaogou. Figure 8 shows Gaojiaping to have a fan-shaped perimeter with a Gravelius index of 1.65, also lesser than that of Miaogou watershed which implies a higher runoff time of concentration and consequently generate higher flow in shorter period. In addition, the drainage in Gaojiaping is characterized by a dendritic pattern.
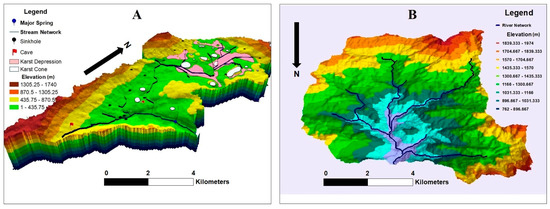
Figure 8.
3D Geomorphometric illustration (A) Miaogou watershed characterized by an elongated shape with the presence of spring, sinkholes, caves, karst depressions and karst cones (B) Gaojiaping watershed characterized by a broader fan-shaped area with no karst features.
3.3. Geomorphic Analysis
Generally, geomorphic dynamics is defined by three factors as proposed by Strahler [40], they include gravitational stresses, molecular stresses and chemical processes. The impact of these forces is generally driven by fluvial process, which is governed principally by relief and underlying geology. In Miaogou for example, which is mainly carbonate rocks, interaction with water with presence of CO2 results in dissolution of the bed rock. This, however is not the case for metamorphic rocks in Gaojiaping, which require large amount of heat (solar) to drive its weathering process (rock exfoliation). Thus, karst in humid-tropics which have abundant rainfall are characterized by karst towers or karst cones (domes) that appear like conical haystack rounded hills [41] with elongated ground depressions extending between them which creates low-flat areas as in our study area [42]. Visual interpretation of Figure 8A reveals some of these features, where about 19 karst cones were delineated in the watershed. The highest cone peak is 1514 m above mean sea level while the lowest is 888m above mean sea level. Additionally, five major karst depressions were also delineated and measured to be around 2.42, 0.48, 1.13 and 0.18 km2 respectively. In addition, 18 sinkholes were identified during ground survey and where found to be mainly distributed in the upper half of the watershed. Also, it should be noted that Figure 8 has no vertical exaggeration, thus, the high concavity of the karstified watershed further highlights the impact of geomorphic work on the overall karstification phenomenon. The valleys along the depressions illustrate the weathering of folding cavities. Gaojiaping on the hand has low concavity, the slopes are generally homogeneous perhaps due to higher resistance to geomorphic work by its crystalline formations (Figure 8B).
3.4. Hydrograph Recession Coefficient (α) Estimation
From the streamflow data, fifteen (15) storms enumerated in Table 2 and Table 3 were selected for hydrograph recession analysis. The recession curve corresponds to the concave part of the hydrograph following a peak i.e., when the crest of the hydrograph is at its highest and is not influenced by recharge processes [43]. Using Equation (3), recession coefficients of successive limbs are calculated. In all, four major limbs were segmented for the fifteen storms even though not all storms had four distinct stages. The recession time of the selected hydrographs ranged from a minimum of 70 h (2.9 days) to over 289 h (12 days). Here, it is noteworthy, Bonacci [44] stated that one of the challenges in recession analysis is the time-step selection, where measurement methods in the past often restrict the treatment to a time unit of one day, however, he stresses that this unit can be too long and thus suggested future research to focus on hourly time-step. For this study, we also found this hourly time step as well as the overall duration of about 12 days suitable for the purpose of our study, which is to determine the impact of geomorphological features on the drainage function of karst watersheds against non-karst watersheds.

Table 2.
Table of recession coefficients and recession stages at Miaogou Karst Watershed.

Table 3.
Table of recession coefficients and recession stages for Gaojiaping Watershed.
Table 2 shows the results for recession coefficients of Miaogou for four (4) major recession stages (limbs) of the storms. The average value for the first segment is 0.0683 for an average period of 34 h while the second stage has an average value of 0.0121 for an average of 93 h. For the third and fourth stages, the recession coefficient drastically depletes to third and fourth order magnitudes at 0.0039 and 0.0007 respectively. The highest coefficients for both first and second stage segments are 0.1008, 0.0149, and 0.0972, 0.0104 for storms 3 and 4, respectively. For Gaojiaping, the average value for the first segment is 0.0405 for an average period of 31 h while the second stage has an average value of 0.0076 for an average of 96 h. For the third and fourth stages, the recession coefficient drastically depletes to third and fourth order magnitudes at 0.0026 and 0.0004, respectively. The highest coefficients for both first and second stage segments are 0.0630, 0.0100, and 0.0615, 0.0150 for storms 8 and 2, respectively. Figure 9 shows the average recession coefficients of the four stages of the recession curves of the two catchments.
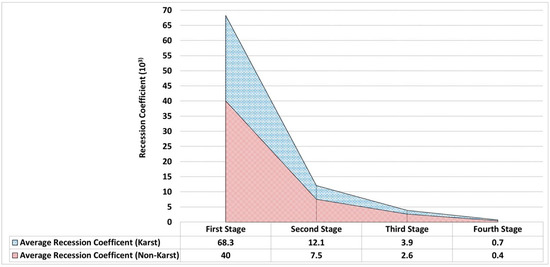
Figure 9.
Average recession coefficients of the four stages of the recession curves.
The contrast between the two watersheds is highest during the first and second stages of the recession limb which is characterized by the fast flow drained immediately after the peak flow. While the slow flow represented by the third and fourth stages are delayed. This phenomena is principally in conformity “matrix-restrained flow” and “conduct-influenced flow” (fast and slow flows respectively) regimes elucidated by Kovács et al. [45]. Fiorillo [43] asserts that the “matrix-restrained flow” is assumed to discharge instatenously to the outlet and therefore, requires well-developed conduit pervading the entire karst system while the “conduct-influenced flow” is slower and thus, modelled as an equal porous medium (non-karst). The longest period analyzed for Miaogou was greater than 1858 h which had maintained a recession coefficient of about 0.0004, while that of Gaojiaping is slightly shorter at about 1729 h in Gaojiaping where the recession coefficient was steady about at 0.0002 due the denser rock matrix.
3.5. ANOVA on Recession Coefficient
The analysis of variance (ANOVA) technique was used to determine the significant statistical difference between the recession coefficients of both Miaogou and Gaojiaping watersheds. Results from Table 2 and Table 3 for each recession stage of both watersheds were individually analysed as a single group with an alpha level of 0.1. It was observed that comparing each recession segment would statistically be better as opposed to lumping all the recession stages together. This is done with a view to ensuring singular groupings for the ANOVA can identify which stage or stages have the most statistical variance and therefrom infer which watershed attributes have the major impact on streamflow.
The first stage of the recession curve, with a total of 15 records for each watershed showed statistically significant difference in the recession coefficient of the two watersheds as determined by one-way ANOVA at (F (1, 28) = 16.232, P = 0.000389). Hence, the null hypothesis is rejected based on the alpha value set at 0.1, and the P value being significantly lower at 3.89 × 10⁻⁴. Similarly, the second stage of the recession curve was analysed where the one-way ANOVA was found to have statistically significant difference at (F (1, 28) = 9.884, P = 0.00392). The P value of 3.92 × 10⁻³ was found to be significantly lower than the alpha value. Finally, for the third stage, there was the statistically significant difference between the recession coefficient of the two watersheds as determined by one-way ANOVA at (F (1, 28) = 5.859, P = 0.0222). It is noteworthy that from the third stage, the statistical difference begins to reduce in magnitude as the degree of variance between the alpha and P value begins to close up. It can therefore be concluded from visual interpretation of Figure 9 that for the third and fourth stages, the statistical variance is not extremely wide.
Figure 10 also shows the variability discharge ratio ln(Qmax/Qmean) of the karst watershed to be much higher by an order of nearly two magnitudes. In addition, the karst discharge variability shows an exponential growth from 2.26 to 4.14 in about 220 h whereas the non-karst discharge, at about 220 h begins to decay rather rapidly. The variability discharge ratio has often been used to determine the “flashiness” of a spring, which distinguishes diffuse (slow) and conduit (fast) flows [46].
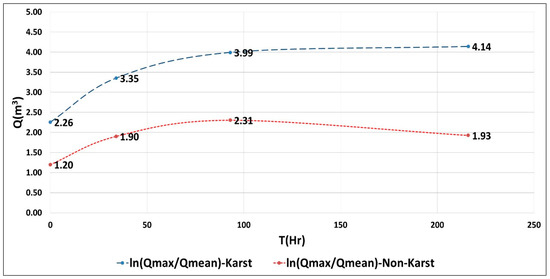
Figure 10.
Variability discharge ratio ln(Qmax/Qmean) showing higher discharge rates with respect to time in karst watershed.
3.6. Streamflow Component Separation
Three typical storms characterized by low, medium, and high volumes of stream discharges were selected for the streamflow components separation. This is to have a balance between dry period and wet periods during the hydrologic year. Using Equations (5)–(7), as well as the recession coefficients generated in Table 2 and Table 3, respectively, the streamflow recession segments and their respective volumetric flows, computed. The initial and steepest part of the recession should characterize a different hydraulic flow type, as it generally reflects the fall of the hydraulic head in the conduit network. This is because the hydraulic behavior depends on two main hydraulic heads which characterize karst aquifers, and connected to the peculiar structure of the medium [47]. The result, shown in Table 4 and Table 5 were quantified based on the function that higher recession coefficient implies higher water drainage capacity per unit time which is primarily attributed to topographical and geomorphological characteristics. The geology is particularly critical here since it defines the drainage porosity which in effect is more impactful after the first overland discharge. Also, the function of the aquifer specific yield is known to be given by the ratio of the volume of water drained to the rock volume. Hence, for Miaogou, we defined four (4) classes of flow regime that contribute to streamflow; (1) overland flow, (2) karst drainage flow, (3) medium fracture flow and (4) micro fracture flow. For Gaojiaping the classes are (1) overland flow, (2) macro fracture flow, (3) medium fracture flow, and (4) micro fracture flow. The streamflow separation results show that overland flow and karst drainage flow have the largest percentages for all three storms that were evaluated. This phenomenon correlates well with the drainage characteristics of karst aquifers having multiple porosity structures due to karstification [48]. Conversely, in Gaojiaping, micro fracture flow, which is generally through regolith deposits and soil sediments contribute the most significant percentage of water ratio. Thus we can conclude that the aquifer matrix of the non-karst basin is more homogenous than that of the karst basin. When the volumes of each stream component are examined and contrasted between the case areas, the disparity becomes apparent. For example, Figure 11 shows the disparity in combined overland and karst drainage flows when compared to the overland, and large fracture flows in between the case study areas. In the first stage of the recession, there is a difference of about 40 m3 while the second stage has a difference of about 30 m3. This implies that the karst watershed tends to discharge larger volumes of water per unit time over the surface as well as subsurface at nearly the same rate. Bonacci [44] elucidated this phenomenon with cases from Switzerland and France [49] and Russia [50] as well as other parts of the world [12], which show that the water retention capacity in karst areas may not be great. This corroborates the findings in this study, even though, the high surficial flow observed in Miaogou, is not primarily attributed to any particular karst feature but more to the basin geometry and morphology, which are ultimately defined by the underlying carbonate system. Hence, there is an indirect correlation but it is merely circumstantial since other geological formations can produce basins geometries that discharge runoff quickly.

Table 4.
Table of streamflow component separation for Miaogou watershed.

Table 5.
Table of streamflow Component Separation for Gaojiaping watershed.
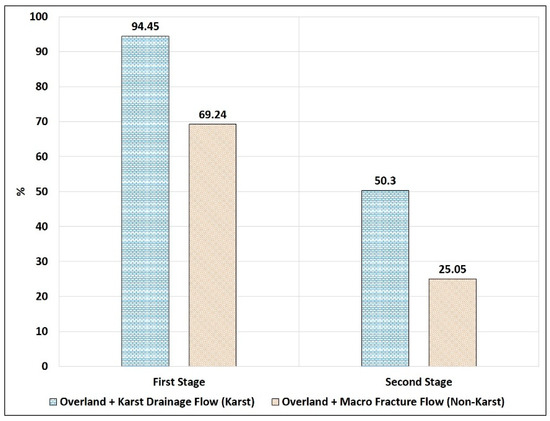
Figure 11.
Contrast in Overland + Karst Drainage Flow Volume vs. Overland + Macro Fracture Flow Volume.
Similarly, Figure 12 shows the disparity in micro fracture flow for both watersheds where the non-karst catchment has a larger volumetric discharge rate. This property of non-karst watershed is even more pronounced during the wetter phases beginning from the first stage through to the third stage which is drier due to the absence of precipitation. From Figure 11 the drainage volumes for all for flow types for each of our case study areas and stacked against each other. It can be concluded that the karst watershed has a faster and more robust drainage system due to the impacts of topography and especially geomorphology, as exemplified by the karst drainage attributes (KDA) such as caves, sinks, and closed depressions. The non-karst watershed, on the other hand, has the potential to hold more groundwater reserves despite being a crystalline hard rock formation.
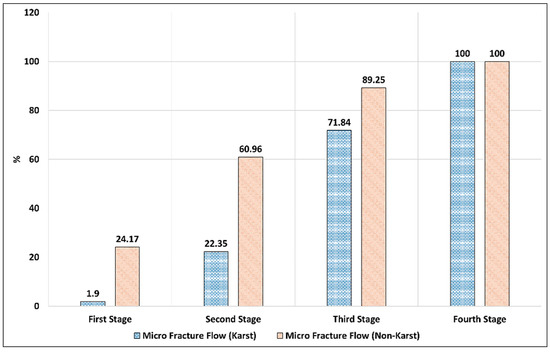
Figure 12.
Contrast in Micro Fracture Flow Volume for all four recession stages.
3.7. Implications on Groundwater Availability and Quality in Karst Areas
High recession coefficient watershed for successive stages of the recession hydrograph has implications on the availability of groundwater especially during dry periods with no precipitation [17]. Fiorillo et al. [17] also reports that when the recession coefficient decreases or increases, the aquifer is emptying more slowly or more quickly than expected, respectively. This is due to the significant influence in hydraulic potential of the aquifers storage capacity resulting from an increase in effective porosity in depth. In the case of Miaogou, higher recession coefficient, along with growing population and industrial activities in the area puts the groundwater system under more pressure. Recent reports from Huangliang Township state that, during the dry winter season, groundwater reserves have been found to be short.
Table 6 shows the average percentile of each streamflow component from the three storms that were selected in this study. In Miaogou, overland flow accounts for 68.12%, karst drainage flow (KDF) accounts for 25.47%, medium fracture flow is 3.93% while micro fracture flow is only 2.48%. However, in Gaojiaping, only 35.44% of its average streamflow is from overland flow compared to Miaogou’s 68.12%. Furthermore, the delayed flow, that is, micro fracture flow is 31.74% making it more than twelve times the size of Miaogou karst watershed. This highlights low groundwater yield in Miaogou due to drainage excess by KDAs. These two characteristics agree with morphometric analyses in above where it was established that Miaogou has a higher concavity that dominates about 50% of its cumulated surface while its average stream network slope is higher than that of Gaojiaping watershed. Thus, we see a higher overland flow percentage as well as a higher macro fracture percentage while the converse is seen in the medium and micro fracture flows, respectively. This disparity between the karst and non-karst watershed is shown in Figure 13, illustrating the inverse relationship between the respective streamflow components and also strongly highlights the groundwater resources availability and potential of both catchments.

Table 6.
Flow type statistics for all three storms and their average percentages.
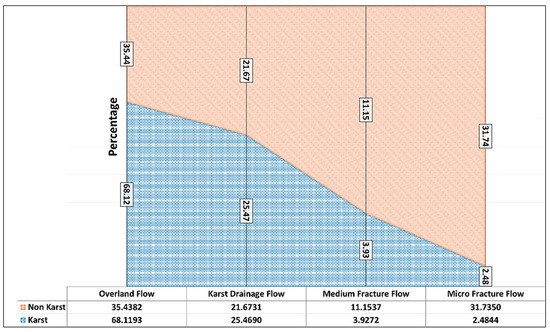
Figure 13.
The plot of disparity in flow type average percentages contribution to streamflow.
Besides the availability of groundwater reserves, another significant concern is groundwater quality. Malik’s [18] revised aquifer pollution sensitivity index show that multiple recession stages with high recession coefficients values imply high heterogeneity and thus higher sensitivity to pollution. Also, Jakada et al., [5] carried out an intrinsic vulnerability assessment of Miaogou catchment area based on the EPIK parametric method and found that most of the catchment is highly vulnerable to pollution. Specifically, Huangliang Township, which has recently been reporting groundwater shortages, falls under the “very high” vulnerability index. Thus, results from this work validate this conclusion as well as establish the fact that groundwater quality will continue to deteriorate until drastic environmental management practices are enforced.
4. Conclusions
This is the first attempt at a comparative hydro-geomorphological and hydrograph recession analysis between a karst and non-karst watershed. By comparing these two distinct watersheds, under common precipitation conditions, a major contrast was observed based on their hydrograph recession characteristics, which has direct correlation with shallow and deep aquifer drainage properties. Results show that the karst watershed in contrast to non-karst watershed tended to drain larger volume of precipitation over shorter period. This is due to larger amounts of interflow influenced by large fractures, while other karst features such as sinks and closed depressions act as siphoning conduits that transmit runoff rapidly through well-developed underground cavities to springs which drain into the surface water system (streams and river channels). These common features usually found in highly karstified areas, referred to in this study as karst drainage attributes (KDA), generate what we also termed karst drainage flow (KDF). The KDF is defined by the second limb of the recession hydrograph and also shares similar properties as overland flow due to high discharge volume as well high recession coefficient. Kresic and Bonacci [39] also argue that the steep curve one the recession limb represents turbulent drainage of large fractures and conduits, followed by a transitional portion that is less turbulent and reflects the contribution of smaller fractures and rock matrix, ending with the slowly decreasing curve, the so-called master recession curve, where the drainage of rock matrix and small fissures is dominant. However, it must be stated that this study by no means attempts to draw conclusions that hydrograph recession analysis fully describes the internal groundwater structure, as the initial catchment area is karst can never be reliably defined [44]. Consequently, the statistically significant variance in recession coefficients between the second stages of the two watersheds simply emphasizes a strong relationship between the recession coefficient and KDAs, as well as catchment morphometric properties, as posited by references [11,12,13].
Additionally, with increasing pressure on groundwater reserves globally, our results seek to draw attention to karst aquifer water retention abilities [12,49,50] relative to groundwater quality, not only locally in the study area but also in other parts of the world. Since higher recession coefficient index for successive recession segments (regimes) imply strong sensitivity to groundwater pollution, the environmental implications cannot be ignored. Escolero et al. [51] state that “the high permeability of karst terrains result in many practical problems such as scarcity and poor predictability of groundwater supplies; scarcity of surface water bodies; instability of the ground (due to the presence of sinkholes); leakage of surface water reservoirs, and an unreliable waste disposal environment”. Previous groundwater vulnerability studies established that the Miaogou area has a high intrinsic susceptibility to pollution due to karstification, hence, sustainable water management measures must be adopted in the area.
Author Contributions
Conceptualization, H.J. and Z.C.; Methodology, H.J. and M.L.; Software, Z.W.; Validation, H.J., Z.C.; Formal Analysis, H.J., Z.C. and M.L.; Investigation, H.J.; Resources, H.Z.; Data Curation, M.L. and H.Z.; Writing-Original Draft Preparation, H.J.; Writing-Review & Editing, H.J., Z.C. and M.H.; Visualization, M.H. and Z.W.; Supervision, Z.C.; Project Administration, H.Z.; Funding Acquisition, H.Z.
Funding
This research was supported through the project of the National Key Research and Development Program of China [2017YFC0406105], Natural Science Foundation China [41807199], Karst Dynamics Laboratory, MLR and GZAR (Institute of Karst Geology, CAGS) [KDL201702], Natural Science Foundation of Hubei [2018CFB170], China Geological Survey [12120113103800, DD20160304] and the Fundamental Research Funds for the Central Universities, China University of Geosciences, Wuhan [CUG170670].
Conflicts of Interest
The Authors declare no conflict of interest. The funders had no role in the design of the study; in the collection, analyses or interpretation of data; in the writing of the manuscript and in the decision to publish.
References
- Hartmann, A.; Goldscheider, N.; Wagener, T.; Lange, J.; Weiler, M. Karst water resources in a changing world: Review of hydrological modeling approaches. Rev. Geophys. 2014, 52, 218–242. [Google Scholar] [CrossRef]
- Ford, D.; Williams, P. Karst Hydrogeology and Geomorphology; John Wiley and Sons: Hoboken, NJ, USA, 2007; ISBN 978-0-470-84996-5. [Google Scholar]
- Stephen, R.; Jeannin, P.Y.; Alexander, E.C.; Davies, G.J.; Schindel, G.M. Contrasting definitions for the term ‘karst aquifer’. Hydrogeol. J. 2017, 25, 1237–1240. [Google Scholar] [CrossRef]
- Kresic, N.; Mikszweski, A. Hydrogeological Conceptual Site Models: Data Analysis and Visualization; CRC Press: Boca Raton, FL, USA, 2013. [Google Scholar]
- Jakada, H.; Chen, Z.; Luo, Z.; Zhou, H.; Luo, M.; Ibrahim, A.; Tanko, N. Coupling Intrinsic Vulnerability Mapping and Tracer Test for Source Vulnerability and Risk Assessment in a Karst Catchment Based on EPIK Method: A Case Study for the Xingshan County, Southern China. Arab. J. Sci. Eng. 2018, 44, 377–389. [Google Scholar] [CrossRef]
- Singhal, B.B.S. Nature of Hard Rock Aquifers: Hydrogeological Uncertainties and Ambiguities. In Groundwater Dynamics in Hardrock Aquifers; Ahmed, S., Jayakumar, R., Salih, A., Eds.; Springer: Dordrecht, Germany, 2008. [Google Scholar] [CrossRef]
- Price, K. Effects of watershed topography, soils, land use, and climate on baseflow hydrology in humid regions: A review. Prog. Phys. Geogr. Earth Environ. 2011, 35, 465–492. [Google Scholar] [CrossRef]
- Christina, T.; Gordon, G.E. A geological framework for interpreting the low-flow regimes of Cascade streams. Willamette River Basin Oregon Water Resour. Res. 2004, 40, W04303. [Google Scholar]
- Clark, M.P.; Rupp, D.E.; Woods, R.A.; Meerveld, H.J.T.-V.; Peters, N.E.; Freer, J.E. Consistency between hydrological models and field observations: Linking processes at the hillslope scale to hydrological responses at the watershed scale. Hydrol. Process. 2009, 23, 311–319. [Google Scholar] [CrossRef]
- Sayama, T.; McDonnell, J.J.; Dhakal, A.; Sullivan, K. How much water can a watershed store? Hydrol. Process. 2011, 25, 3899–3908. [Google Scholar] [CrossRef]
- Avdagić, I. Oticanje u Kraškim Hidrološkim Sistemima (Modelling of Runoff from Karstic Catchments). Ph.D. Thesis, Sarajevo University, Sarajevo, Yugoslavia, 1987. [Google Scholar]
- Bonacci, O. Karst Hydrology; Springer: Herdelberg, Germany, 1987. [Google Scholar]
- Bonacci, O.; Jelin, J. Identification of a karst hyrological system in the Dinaric karst (Yugoslavia). Hydrol. Sci. J. 1988, 33, 483–497. [Google Scholar] [CrossRef]
- Soulios, G. Contribution à l’étude des courbes de récession des sources karstiques: Exemples du pays Hellénique. J. Hydrol. 1991, 127, 29–42. [Google Scholar] [CrossRef]
- Kullman, E. Krasovo–Puklinové vody. Karst-Fissure Waters; Geologický ústav Dionýza Štúra: Bratislava, Czechoslovakia, 1990. [Google Scholar]
- Luo, M.; Chen, Z.; Yin, D.; Jakada, H.; Huang, H.; Zhou, H.; Wang, T. Surface flood and underground flood in Xiangxi River Karst Basin: Characteristics, models, and comparisons. J. Earth Sci. 2016, 27, 15–21. [Google Scholar] [CrossRef]
- Fiorillo, F.; Revellino, P.; Ventafridda, G. Karst aquifer draining during dry periods. J. Cave Stud. 2012, 74, 148–156. [Google Scholar] [CrossRef]
- Malik, P. Assessment of regional karstification degree and groundwater sensitivity to pollution using hydrograph analysis in the Velka Fatra Mountains, Slovakia. Environ. Earth Sci. 2006, 51, 707–711. [Google Scholar] [CrossRef]
- Pankaj, A.; Kumar, P. GIS-based morphometric analysis of five major sub-watersheds of Song River, Dehradun District, Uttarakhand with special reference to landslide incidences. J. Soc. Remote. Sens. 2009, 37, 157–166. [Google Scholar] [CrossRef]
- Doctor, D.H.; Young, J.A. An Evaluation of Automated GIS Tools for Delineating Karst Sinkholes and Closed Depressions from 1-Meter LIDAR-derived Digital Elevation Data. In Proceedings of the 13th Multidisciplinary Conference on Sinkholes and the Engineering and Environmental Impacts of Karst, Carlsbad, NM, USA, 6–10 May 2013. [Google Scholar]
- Prafull, S.; Ankit, G.; Madhulika, S. Hydrological inferences from the watershed analysis of water resource management using remote sensing and GIS techniques. Egypt. J. Remote Sens. Space Sci. 2014, 17, 111–121. [Google Scholar]
- Olivera, F.; Maidment, D. GIS for hydrologic data development for the design of highway drainage facilities. Transp. Res. Rec. 1998, 1625, 131–138. [Google Scholar] [CrossRef]
- Olivera, F.; Maidment, D. GIS tools for HMS modeling support. In Hydrologic and Hydraulic Modeling Support with Geographic Information Systems; Maidment, D., Djokic, D., Eds.; ESRI Press: Redlands, CA, USA, 2000; pp. 85–112. [Google Scholar]
- HEC. Geospatial Hydrologic Modeling Extension HEC-GeoHMS: Version 1.0 User’s Manual; Hydrologic Engineering Center (HEC) Technical Report No CPD-77; U.S. Army Corps of Engineers: Champaign, IL, USA, 2000.
- Oliveira, E.D.; Crestani, A. Physiographic characterization of the watershed of stream Jandaia, Jandaia do Sul/PR. Acta Geogra´Fica 2011, 5, 169–183. [Google Scholar]
- EPA. Better Assessment Science Integrating Point and Nonpoint Sources (BASINS): Version 3.0 User’s Manual; Office of Water Technical Report No EPA-823-B-01-001; Environmental Protection Agency: Washington, DC, USA, 2001.
- Di Luzio, M.; Srinivasan, R.; Arnold, J.G.; Neitsch, S.L. Soil and water assessment tool. In ArcView GIS Interface Manual: Version 2002; International Center for Tropical Agriculture: Cali, Colombia, 2002. [Google Scholar]
- Luzio, M.; Srinivasan, R.; Arnold, J.G. Integration of Watershed Tools and Swat Model into Basins. JAWRA J. Am. Resour. Assoc. 2002, 38, 1127–1141. [Google Scholar] [CrossRef]
- Dixon, B.; Uddameri, V. GIS and Geocomputation for Water Resource Science and Engineering; John Wiley & Sons, Ltd.: Hoboken, NJ, USA, 2016. [Google Scholar]
- Strahler, A.N. Quantitative Geomorphology of Drainage Basins and Channel Networks. In Hand Book of Applied Hydrology; Te Chow, V., Ed.; McGraw Hill Book Company: New York, NY, USA, 1964. [Google Scholar]
- O’Callaghan, J.F.; Mark, D.M. The extraction of drainage networks from digital elevation data. Comput. Vis. Graph. Process. 1984, 28, 323–344. [Google Scholar] [CrossRef]
- Jenson, S.K.; Domingue, J.O. Extracting topographic structure from digital elevation data for geographic information system analysis. Photogramm. Eng. Remote Sens. 1988, 54, 1593–1600. [Google Scholar]
- Jenson, S.K. Applications of hydrologic information automatically extracted from digital elevation models. Hydrol. Process. 1991, 5, 31–44. [Google Scholar] [CrossRef]
- Boussinesq, J. Recherches Théoriques sur l’écoulement des Nappes d’eau Infiltrées dans le sol et sur dÉbit de Sources. J. De Mathématiques Pures Et Appliquées 1904, 10, 5–78. [Google Scholar]
- Maillet, E. Essais d’Hydraulique Souterraine et Fluviale; Hermann: Paris, France, 1905. (In French) [Google Scholar]
- Kullman, E. Nové metodické prístupy k riešeniu ochrany a ochranných pásiem zdrojov podzemných vôd v horninových prostrediach s krasovo—puklinovou priepustnosťou [New methods in groundwater protection and delineation of protection zones in fissure-karst rock environment; in Slovak]. Podzemn. Voda 2000, 6, 31–41. [Google Scholar]
- Malík, P.; Vojtkova, S. Use of recession-curve analysis for estimation of karstification degree and its application in assessing overflow/underflow conditions in closely spaced karstic springs. Environ. Earth Sci. 2012, 65, 2245–2257. [Google Scholar] [CrossRef]
- Miao, Z.L.; Miao, Z.Z. Application of Recession Equation in Groundwater Studies. Investig. Sci. Technol. 1984, 5, 1–6. (In Chinese) [Google Scholar]
- Kresic, N.; Bonacci, O. Spring Discharge Hydrograph. In Groundwater Hydrology of Springs; Kresic, N., Stevanovic, Z., Eds.; Butterworth-Heinemann: Oxford, UK, 2010. [Google Scholar]
- Strahler, A.N. Dynamic basis of geomorphology. Geol. Soc. Am. Bull. 1952, 63, 923–938. [Google Scholar] [CrossRef]
- Lambert, A.R. Satellite Geology and Photogeomorphology: An Instructional Manual for Data Integration; Springer: Berlin/Heidelberg, Germany, 2011; pp. 78–79. ISBN 978-3-642-20607-8. [Google Scholar]
- Stevanovic, Z. Karst Aquifers—Characterization and Engineering. Prof. Pract. Earth Sci. 2015. [Google Scholar] [CrossRef]
- Fiorillo, F. Tank-reservoir drainage as a simulation of the recession limb of karst spring hydrographs. Hyogeol. J. 2011, 19, 1009–1019. [Google Scholar] [CrossRef]
- Bonacci, O. Karst springs hydrographs as indicators of karst aquifers. Hydrol. Sci. J. 1993, 38, 51–62. [Google Scholar] [CrossRef]
- Kovács, A.; Perrochet, P.; Király, L.; Jeannin, P. A quntitative method for characterization of karst aquifers based on the spring hydrograph analysis. J. Hydrol. 2005, 303, 152–164. [Google Scholar] [CrossRef]
- Florea, L.J.; Vacher, H. Springflow Hydrographs: Eogenetic vs. Telogenetic Karst. Ground Water 2006, 44, 352–361. [Google Scholar] [CrossRef]
- Fiorillo, F. The Recession of Spring Hydrographs, Focused on Karst Aquifers. Resour. Manag. 2014, 28, 1781–1805. [Google Scholar] [CrossRef]
- Birk, S.; Hergarten, S. Early recession behaviour of spring hydrographs. J. Hydrol. 2010, 387, 24–32. [Google Scholar] [CrossRef]
- Burger, A.; Pasquier, F. Prospection et captage d’eau par fprages dans la vallée de la Brevine (Jura Suisse). In Hydrogeology of Karstic Terrains; Burger, A., Dubertret, L., Eds.; UNESCO: Paris, France, 1984; Volume 1, pp. 145–149. [Google Scholar]
- Babushkina, V.D.; Lebedyanskaya, Z.P.; Plotnikov, I.I. The distinctive features of predicting total water discharge from deep-level mines in fissure and karst rocks. In Hydrogeology of Karstic Terrains; Burger, A., Dubertret, L., Eds.; UNESCO: Paris, France, 1984; Volume 1, pp. 229–232. [Google Scholar]
- Escolero, O.A.; Marin, L.E.; Steinich, B.; Pacheco, A.J.; Cabrera, S.A.; Alcocer, J. Development of a Protection Strategy of Karst Limestone Aquifers: The Merida Yucatan, Mexico Case Study. Resour. Manag. 2002, 16, 351–367. [Google Scholar]
© 2019 by the authors. Licensee MDPI, Basel, Switzerland. This article is an open access article distributed under the terms and conditions of the Creative Commons Attribution (CC BY) license (http://creativecommons.org/licenses/by/4.0/).
