Article

Dew Yield and Its Influencing Factors at the Western Edge of Gurbantunggut Desert, China

1
Institute of Water and Development, Chang’an University, Xi’an 710054, China
2
School of Environmental Science and Engineering, Chang’an University, Xi’an 710054, China
3
Key Laboratory of Subsurface Hydrology and Ecological Effects in Arid Region, Ministry of Education, Chang’an University, Xi’an 710054, China
*
Author to whom correspondence should be addressed.
Water 2019, 11(4), 733; https://doi.org/10.3390/w11040733
Submission received: 4 March 2019 / Revised: 2 April 2019 / Accepted: 8 April 2019 / Published: 9 April 2019
(This article belongs to the Section Hydrology)

Abstract

:
Dew is a significant water resource in arid desert areas. However, information regarding dew is scarce because it is difficult to measure due to the harsh environment of locations such as Gurbantunggut Desert, China. In this study, a non-destructive field experiment was conducted from 2015 to 2018 at a desert test station located in the western edge of the Gurbantunggut Desert, using a calibrated leaf wetness sensor (LWS) to measure dew yield. The results are as follows: (1) Dew formed after sunset with the atmospheric temperature gradually dropping and evaporated after sunrise with the temperature increasing in the second morning. (2) Dew was featured as ‘high frequency and low yield’. The average daily dew yield during dew days was 0.10 mm with a daily maximum of 0.62 mm, while dew days accounted for 44% of the total monitoring days, with a monthly maximum of 25 days. Compared with rainfall, dew days were two times as frequent as rainy days, while the average annual dewfall (12.21 mm) was about 1/11th of the average annual rainfall (134.6 mm), which indicates the dew contribution to regional water balance is about 9%. (3) March–April and October–November are the main periods of dew occurrence in this region because accumulated snow begins to melt slowly in March–April, providing sufficient vapor for dew formation, and the air temperature difference between day and night in October–November is the highest in the year, meaning that the temperature drops rapidly at night, making it easier to reach the dewpoint for vapor condensation. (4) Daily dew yield (D) was positively correlated to relative humidity (RH) and the difference between soil temperature at 10 cm below the ground and surface soil temperature (Tss), and negatively correlated to wind speed (V), air temperature (Ta), surface soil temperature (Ts), cloud cover (N), dewpoint temperature (Td) and the difference between air temperature and dewpoint temperature (Tad). It should be noted that the measured values of all factors above were the average value of the overnight period. The multivariate regression equation, D = −0.705 + 0.011 × RH − 0.006 × N − 0.01 × V, can estimate the daily dew yield with the thresholds of the parameters, i.e., RH > 70%, N < 7 (oktas) and V < 6 m/s.

1. Introduction

Water availability is the most important limiting factor in arid lands. Any additional source of water may have a positive impact upon the ecosystem [1,2]. Dew is a kind of sustainable and stable water resource in arid desert areas, and it is very important in maintaining the survival of plants and small animals [3]. For example, dew often serves as a primary water resource for biological soil crusts [4,5,6], lichens [7,8], small shrubs [9] and nematodes [10] in a desert ecosystem. Hence, a large number of studies have aimed to understand the hydrology and ecological significance of dew.
Dew forms when the temperature of a surface is lower than or equal to the dewpoint temperature, such that water vapor in the air condenses on the colder surface [11,12]. Dew is usually attached to the leaves of plants and the soil surface or in shallow soil. Water vapor from lower atmospheres [13], soil [14,15] and transpiration of plant leaves in the lower canopy [16] can be involved in the process of dew formation in an ecosystem. Due to the different sources of water vapor, dew hydrology is very complicated and is affected by meteorological conditions and underlying surface conditions. Meteorological conditions include relative humidity, air temperature and wind speed. Previous studies have shown that low air temperature [17] and high relative humidity of air [18], as well as moderate wind speed [19], are favorable to dew formation. Underlying surface conditions include topography, vegetation and soil texture. The hilltops obtained a longer duration and higher dew yields than wadi beds in a small arid drainage basin in the Negev Highlands, Israel, which may be explained by their wind-sheltered location, impeding wind ventilation during the afternoon breeze, and by slower long wave radiational cooling at the narrow wadi [1]. The mean daily dew yield for sand (0.12 mm) was greater than that for gravel (0.071 mm) at the Gaolan Research Station of Ecology and Agriculture located in the transitional zone between arid and semi-arid regions in China, due to lower surface temperature and vapor conductivity for sand [20]. Dew yield in the planting area was significantly higher than that of the biological crust and quicksand, and the yield in the biological crust was significantly higher than that of quicksand in Southern Maowusu Sandy Land, China [21]. A similar experiment was carried out in xerophyte shrub plantations at the southeast margin of Tengger Desert, Northern China [6], and a longer daily dew production period and more dew yield were shown on moss compared with mixed crusts and dune sand, which proved that habitats with better vegetation conditions are more conducive to dew formation.
Up until now, there is no unique standardized method to measure dew formation [17,22]. The difficulty of dew measurement is both in the definition of dew and in its actual measurement. However, scholars have developed various dew measurement instruments or methods in the past 70 years, including dew gauge [23], electrical resistance sensor [24], hiltner-type dew balance method [25], soil moisture sensor [1], leaf wetness sensor [26,27,28,29,30], artificial condensation surface method [31,32,33,34], and weighing method [6,12,35,36]. The last three items of the methods mentioned above are widely used. For example, materials (tissues, woods and plastic) were weighed before and after the dew event to calculate the dew yield [17], high precision lysimeters were weighed to obtain dew formation at night on natural ecosystems [37] and a leaf wetness sensor was used to estimate the presence or absence of wetness on its surface [26], which can also be calibrated to provide a potential dew yield [29,30,38,39].
To effectively quantify the processes of dew formation, many attempts have been carried out to predict dew yield from the parameters, such as relative humidity, air temperature, cloud coverage, wind speed and radiation [2,3]. Most of the models are usually designed from an energy balance, such as the Penman–Monteith equation, where the latent heat released by water vapor condensation is the parameter to solve for. Other than this, a purely statistical approach based on artificial networks has been successfully tested by Lekouch et al. [32]. A semi-empirical model by Beysens [40], calculated from the relationships between dew formation and its drivers: relative humidity, wind speed and cloud cover, is also reliable and gives the opportunity to study dew formation on a larger scale.
Although previous studies have been resourceful in the dew formation process, many aspects of dew hydrology are site-specific due to uncertainties [30]. Dew assessment is still mainly dependent on site observation instead of hydrologic predictions, since the influence degrees of different factors to dew formation are inconsistent with different climatic regions in a manner that is still not fully and precisely modeled. Gurbantunggut Desert, located in the middle of the Junggar Basin, is the largest fixed and semi-fixed desert in China. The mean annual rainfall is no more than 200 mm [41], while vegetation coverage is up to 40% [42]. Playing an important role in fixing the sand surface, biological soil crusts are widely developed in the desert, especially in lowlands between hills. Mosaic distribution of moss crusts and lichen crusts make the biological crusts thicker and more resistant to mechanical interference. In the analysis of the reasons for the distribution of different types of soil crusts, differences in water conditions have also attracted people’s attention, aside from the differences in soil texture and soil nutrients. The objectives of this study are to: (1) assess dew yield by conducting an in-situ observation experiment at the western edge of Gurbantunggut Desert, China; (2) determine the main influencing factors in the dew formation process by regression analysis; (3) develop a multiple regression model for dew yield.

2. Materials and Methods

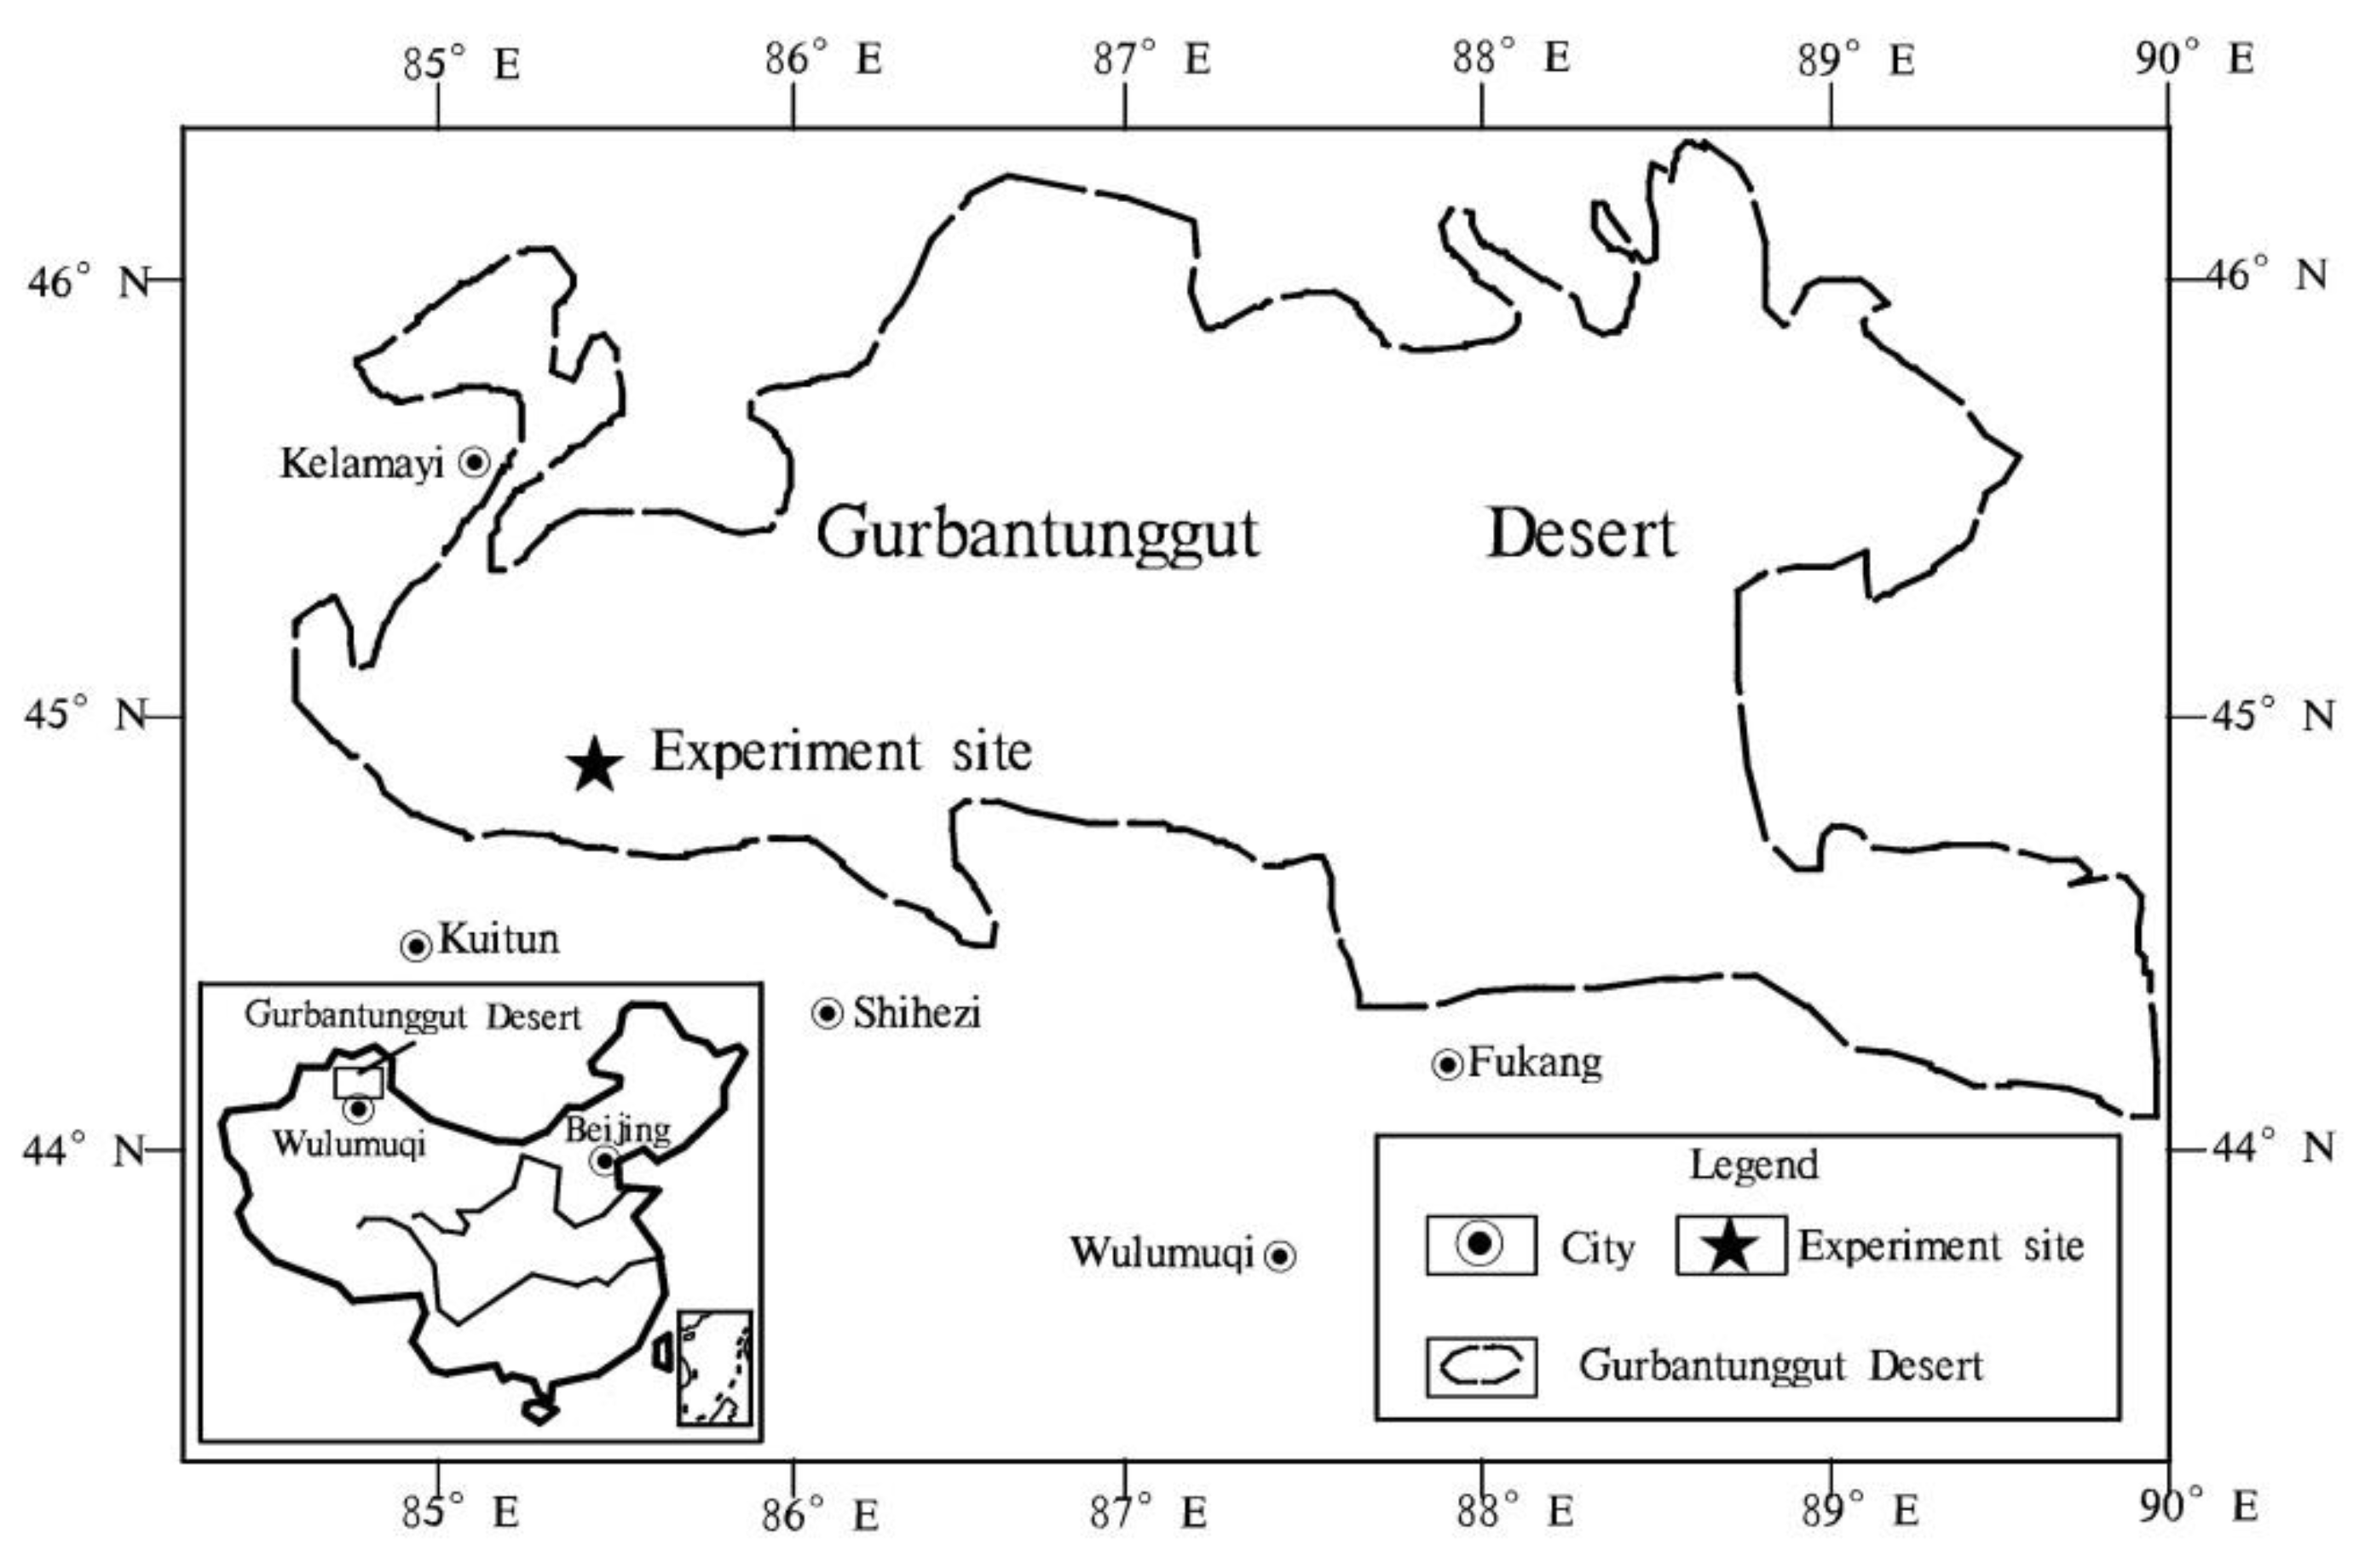
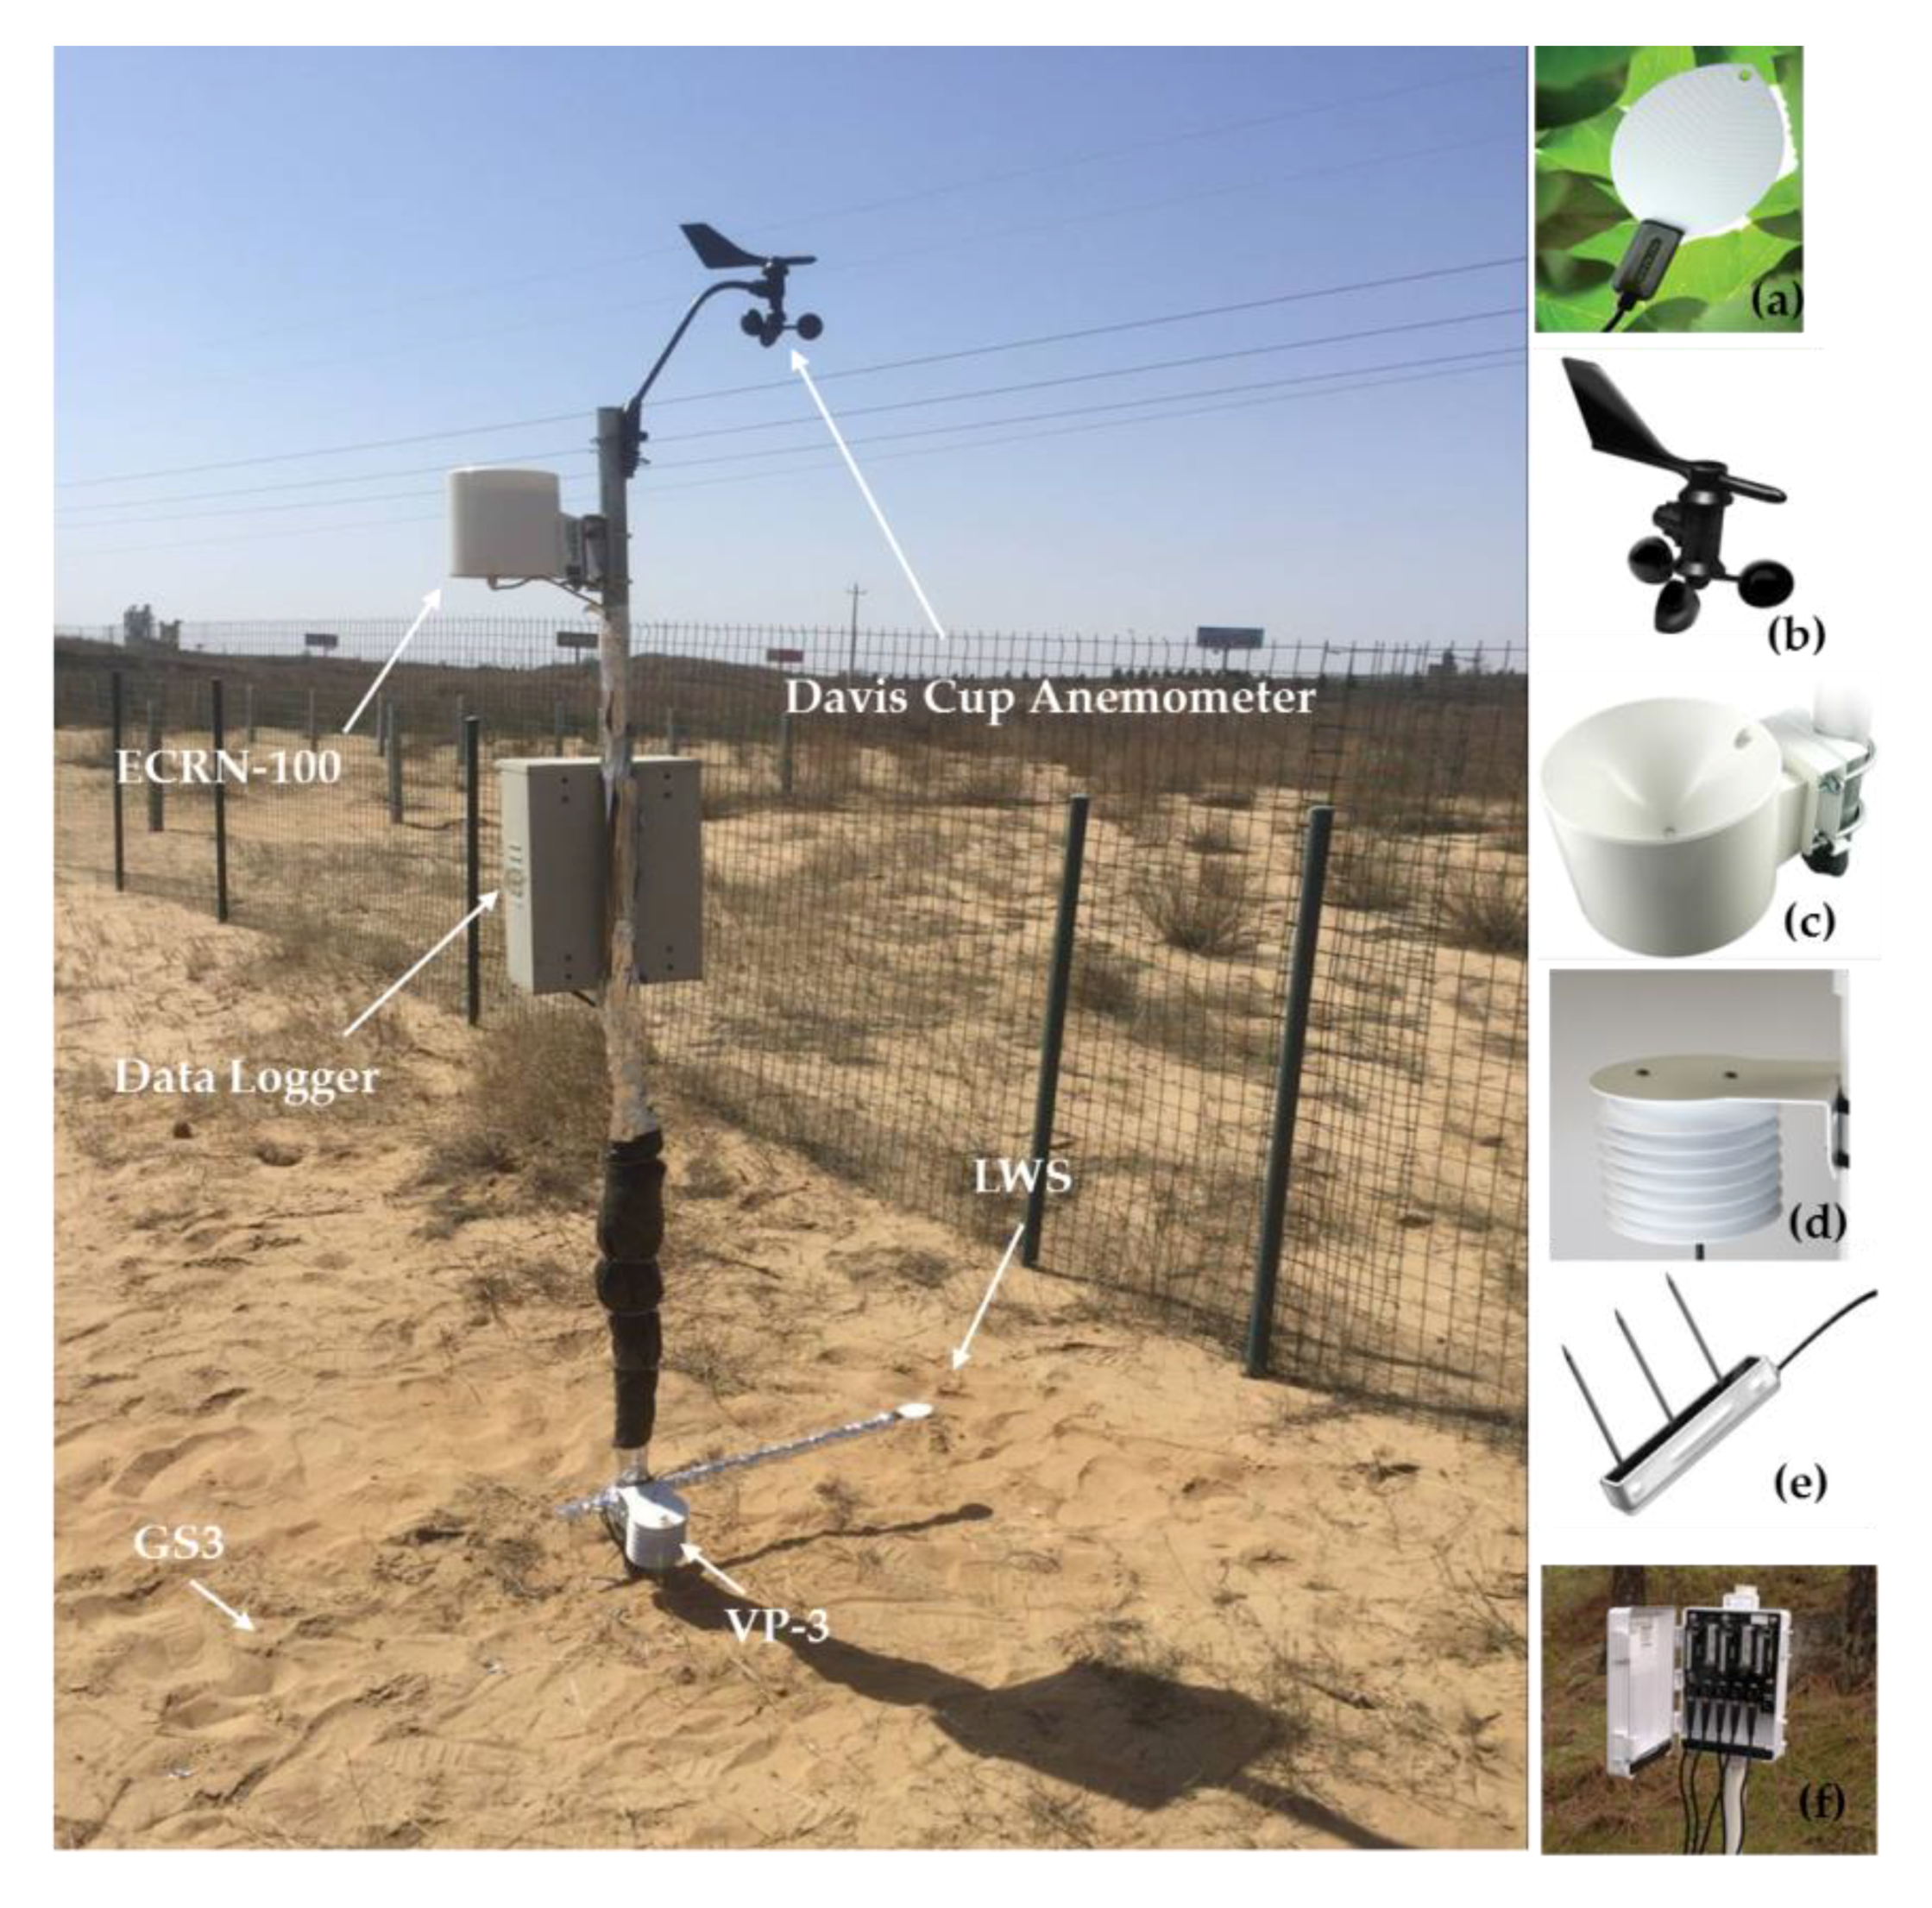
2.1. Measurement Site

The field experiment was carried out at Paotai Soil Improvement Test Station (44°48′ N, 85°33′ E), located at the western edge of the Gurbantunggut desert in northwestern China (Figure 1). The climate in this region is temperate continental, characterized mainly by aridity, long-cold winter and short-hot summer. The mean annual temperature is 6.6 °C (1997–2016), with the annual cumulative temperature (>10 °C) of 3400 °C [42]. Mean annual precipitation ranges from 70 to 180 mm [41], while the mean annual evaporation exceeds 2000 mm [43]. The mean annual values of the frost-free period and sunshine duration are 160 days and 2772 h, respectively. In winter, the Gurbantunggut Desert experiences 95–110 days of snow cover, beginning in late November and ending in mid-March of the following year [43]. The maximum depths of frozen soil and accumulated snow cover are 90 cm and 35 cm, respectively. The dominant plants are Haloxylon ammodendron and H. persicum [43]. In addition to this, there are many biological soil crusts, containing cyanobacteria-dominated, lichen-dominated, and moss-dominated crusts [44]. The soil in the desert has a sandy texture, with sand (0.05–2 mm) content, 85%; silt (0.002–0.05 mm) content, 13.7%; and clay (<0.002 mm) content, 1.3%.

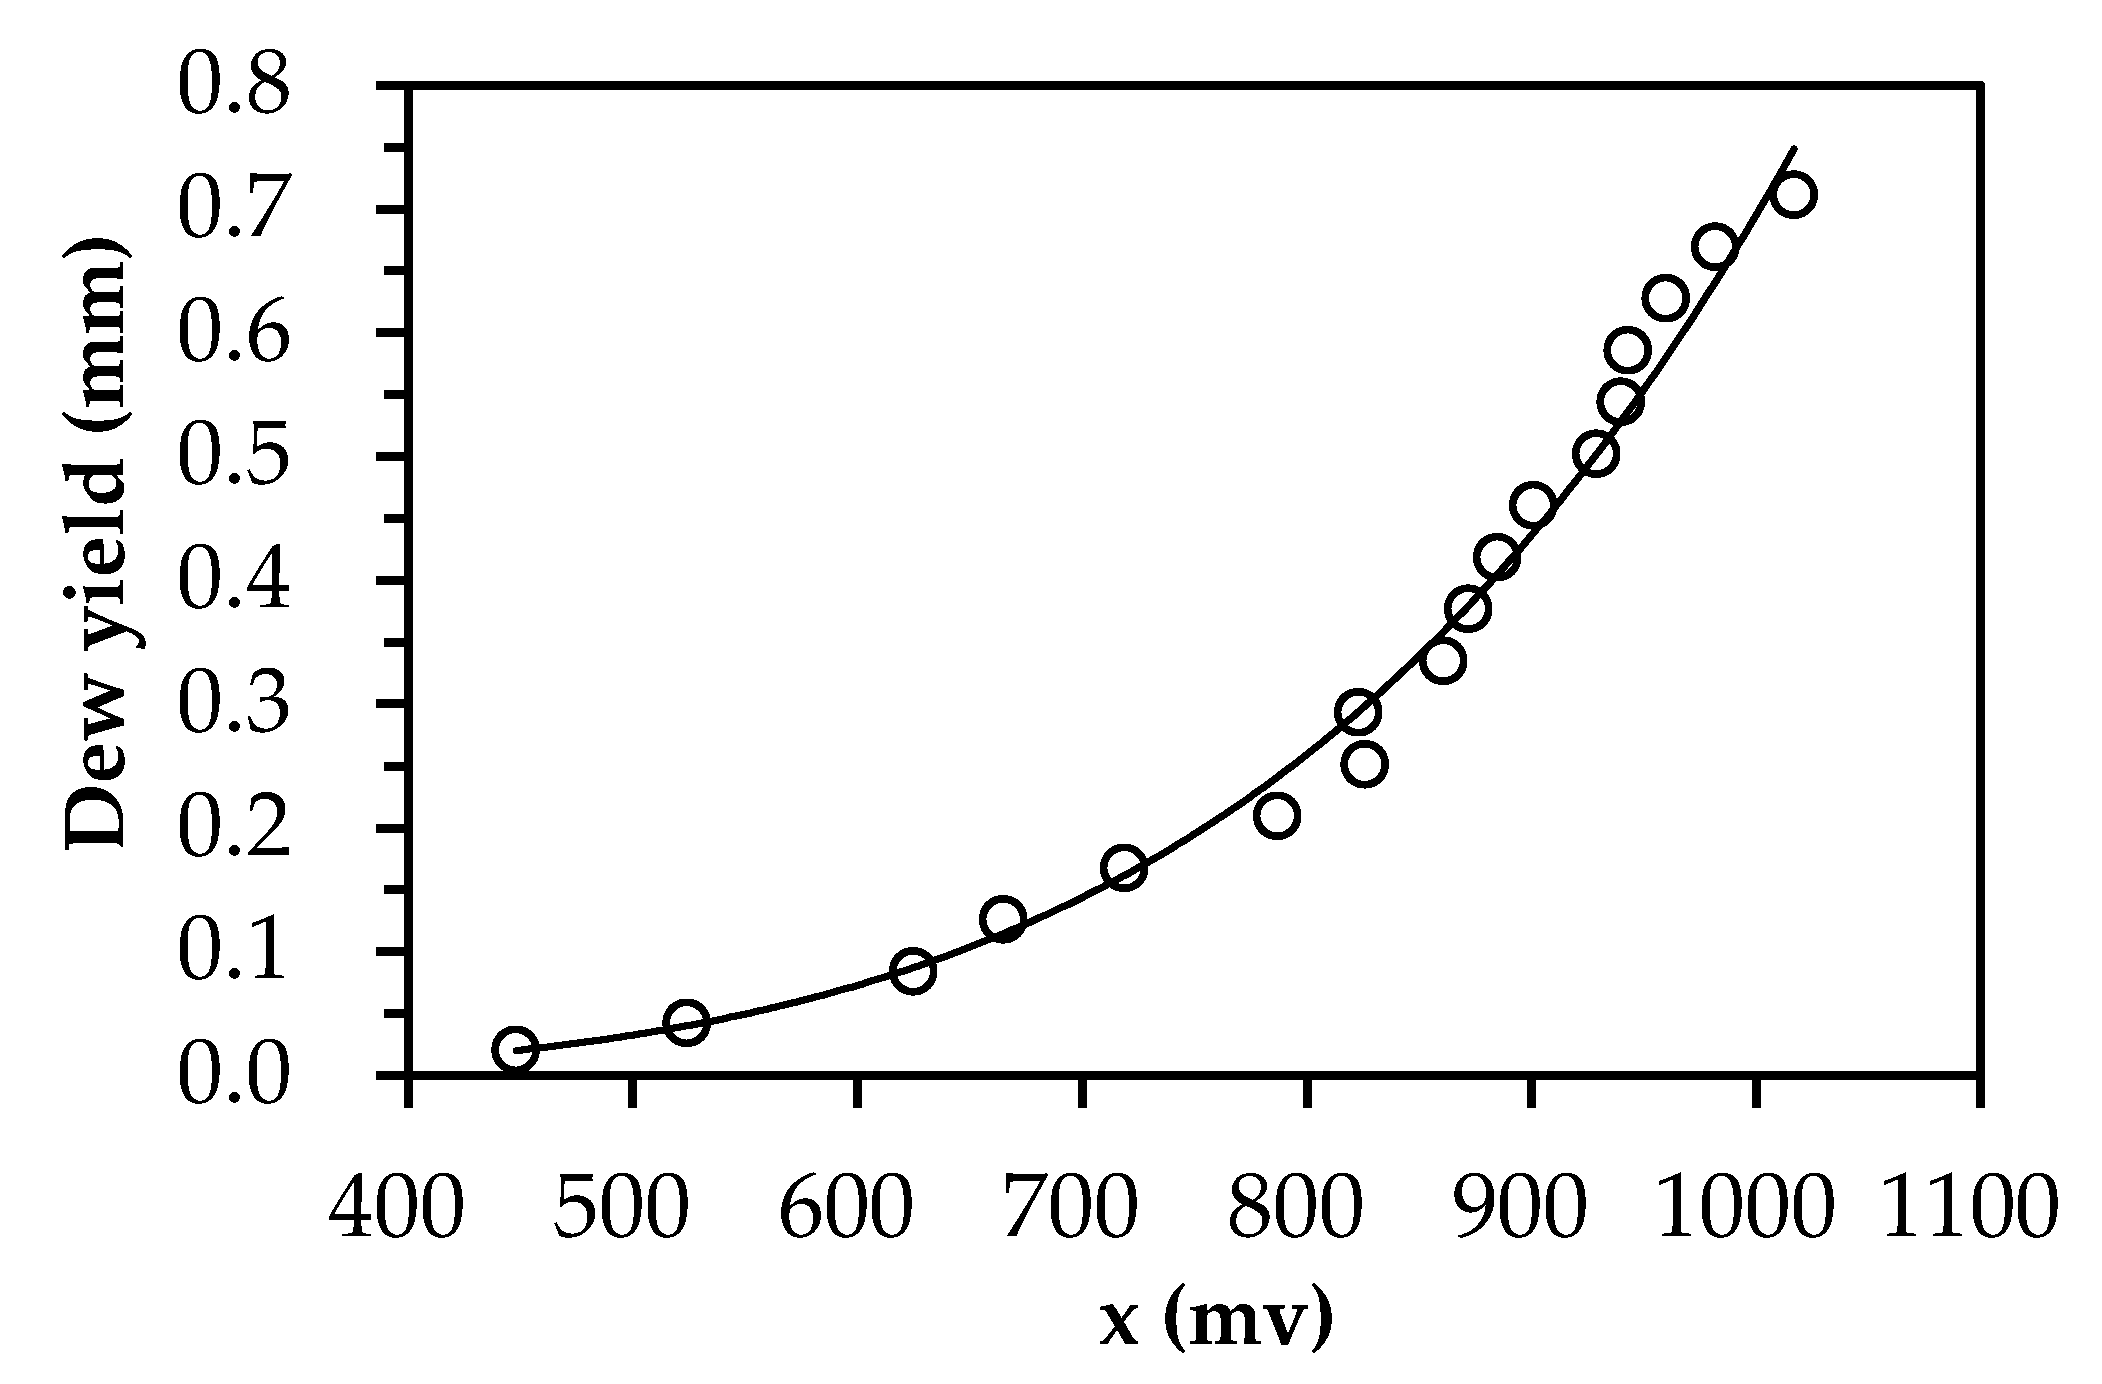
2.2. LWS Calibration

The dielectric Leaf Wetness Sensor (LWS, Model, PHYTOS 31, by Decagon Devices, Pullman, WA, USA) was chosen to measure the duration and yield of dew. The LWS measures the dielectric constant of a zone approximately 1 cm from the upper surface of the sensor. The dielectric constant of water (80) and ice (5) are much higher than that of air (1), so the measured dielectric constant is strongly dependent on the presence of moisture or frost on the sensor surface. The sensor outputs a mV signal proportional to the dielectric of the measurement zone, which can be converted into the dew yield by calibration. Calibration was carried out by placing the LWS horizontally, with its signal output port plugged into a data logger (Model, EM50, by Decagon Devices, USA). A small sprayer was used to spray a known amount of water on the surface of the LWS. By increasing the amount of sprayed water, the corresponding increase of the electric signal in mini voltage is recorded in the EM50, as shown in Figure 2.
The calibration equation was expressed as follows:
D = a x b
where, x is the raw voltage counts (mv) recorded in EM50, D is the accumulated dew yield over the surface of LWS (mm), a and b are fitting parameters, a = 4 × 10⁻¹⁴ and b = 4.4188 (r = 0.997, p < 0.01).
It should be noted that LWS has been specially designed to closely approximate the thermodynamic properties of a leaf. If the specific heat of the leaf is estimated at 3750 J·kg−1·K−1, the density is estimated to be 0.95 g/cm3, and as the thickness of a typical leaf is 0.4 mm, the heat capacity of the leaf is 1425 J·kg−1·K−1. This is closely approximated by the thin (0.65 mm) fiberglass construction of the LWS, which has a heat capacity of 1480 J·kg−1·K−1 [45]. Since dew condensation may be affected by minute differences in the substrate temperatures, heterogeneity in the substrate properties, size and position may affect the substrate temperatures and hence dew condensation [46]. It was hypothesized that dew yield measured by LWS is approximated by the integrated value on soil crusts and plant leaves.

2.3. Experimental Design

A bare patch of ground was selected for the installation of instruments. The LWS sensor with 0.02 mm resolution was placed 5 cm above the ground. Air relative humidity (RH) and temperature at the same height of LWS were measured by a sensor (Model, VP-3) with 0.1% RH resolution and 0.1 °C temperature resolutions, respectively. Wind speed at 300 cm above the ground was measured by a Davis Cup Anemometer with a stalling speed of 0.5 m/s and within 0.1 m/s resolution. Precipitation at 160 cm above the ground was measured by a high-resolution rain gauge (Model, ECRN-100) with 0.2 mm resolution. Soil temperature and moisture at 2 cm and 10 cm below the ground were measured by two sensors (Model, GS3) with 0.1 °C temperature resolutions and 2% volumetric water content, respectively. Soil temperature and moisture at 2 cm below the ground were approximated to that of the surface soil in this study. All sensors were plugged into the data ports of EM50 Data Logger to synchronously record the measured values at 30 min intervals. All sensors above were made by Decagon Devices Inc., USA. The mounting positions of all instruments are shown in Figure 3. Aside from this, the cloud cover data collected at 8:00, 14:00 and 20:00 were obtained from the local weather station within 4.8 km from the measurement site. The experiment was carried out from 1 August 2015 to 1 December 2018, excluding the period from 1 December to 1 March the following year, during which the air temperature remained below 0 °C.

2.4. Data Processing

2.4.1. Dew Yield, Intensity and Frequency

Dew yield is the vapor condensation amount within a specified period of time. For dew intensity, the time period is specified as 1 h. For the daily dew yield, the time period is defined to start on day one and end on day two at 16:00, which is the most unlikely time for dew condensation in the 24-hour period [30]. Dew frequency in a day is defined as the ratio of the number of dew-producing time periods to the total number of observation periods. In addition, it is assumed in this study that dew does not occur on rainy, foggy, frosty and snowy nights. Here, a rainy night is determined by rainfall gauge. A foggy night is defined as a morning during which the visibility is restricted to <1 km for >0.5 h [36]. Nights during which air temperature is less than 0 °C are regarded as frosty or snowy nights.

2.4.2. Dewpoint Temperature

Dewpoint temperature was calculated by using the Lawrence equation [47]:
T d = B 1 [ ln ( R H 100 ) + A 1 T B 1 + T ] A 1 ln ( R H 100 ) A 1 T B 1 + T
where, RH is relative humidity (%), T and Td are air temperature and dewpoint temperature (°C), respectively, A1 and B1 are coefficients described by Alduchov and Eskridge: A1 = 17.625, B1 = 243.04 °C [48].

2.4.3. Cloud Cover

The cloud cover data were recorded with its value in the range 0–10, with 10 for full cloud cover, which were multiplied by 0.8 to correlate with standard measurements on a scale 0–8 (oktas) [31,49].

2.4.4. Wind Speed

Wind speed was measured at 3 m above the ground. In order to correlate with standard measurements at 10 m above the ground, the measured data were converted by using the classical regression [16]:
V z 1 V z 2 = ln ( z 1 z c ) ln ( z 2 z c )
where zc (m) corresponds to the ground roughness length and taken to be 0.1 m. V z 1 (m/s) and V z 2 (m/s) are wind speeds at different heights of z1 (m) and z2 (m), respectively. The relationship between wind speeds at heights of 10 m and 3 m was determined by Equation (3) (here, z1 is equal to 10 m and z2 is equal to 3 m).
V z 1 = 1.35 V z 2

2.4.5. Statistical Analysis

Linear regression was applied to analyze the relationship between dew yield and main factors. Trends, significance and fitting degree were respectively determined by correlation coefficient (R), P-value at the 0.01 level and the coefficient of determination (R2). Mean absolute error (MAE) was used to evaluate the goodness of the model:
M A E = i = 1 n | C i O i | n
where Ci and Oi are the daily dew yield calculated and measured at the specific day (mm), respectively, with n as the measurement of days.
All statistical analyses were performed using SPSS Statistics 22.0 (SPSS Inc., Chicago, IL, USA), and all figures were plotted by Office 2016 (Microsoft Corp., Redmond, WA, USA) and Origin 8.0 (Origin Lab Corp., Northampton, MA, USA).

3. Results

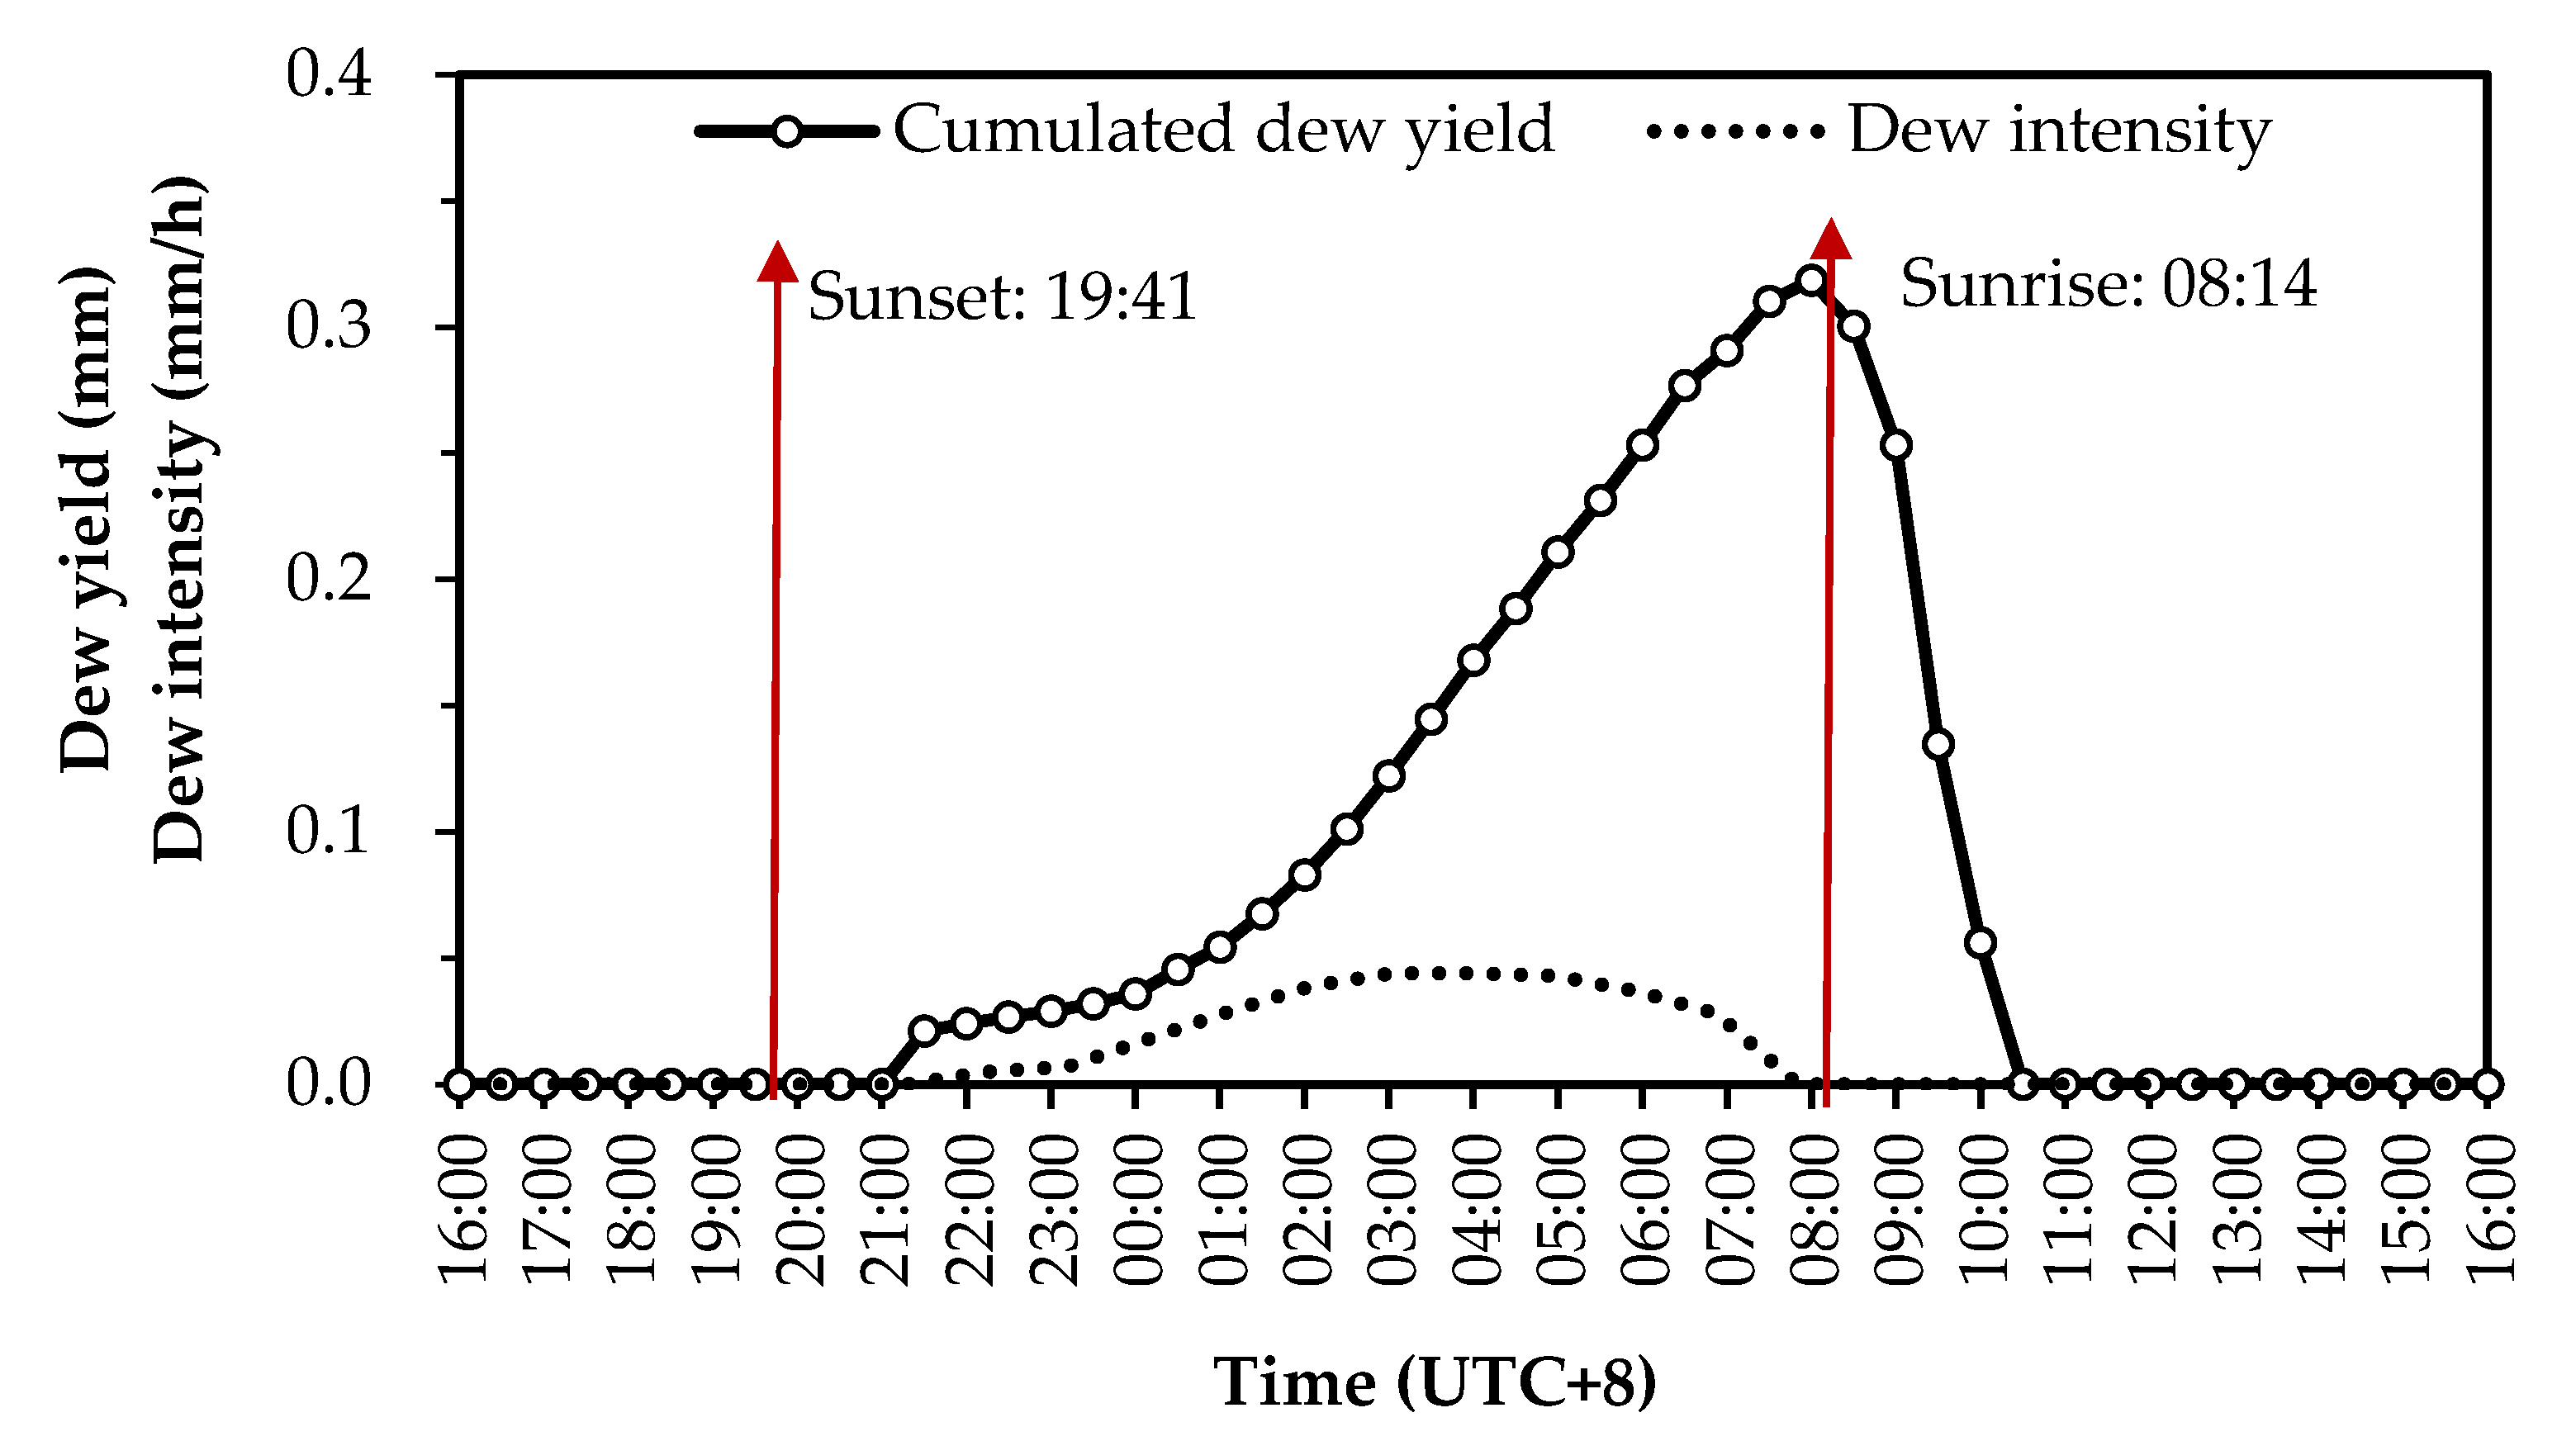
3.1. Daily Variation of Dew

A typical daily process of dew formation (on 6–7 October 2016) was shown in Figure 4. It is clear that dew existed on the LWS for 13 h from 21:00 to 10:00 the next day (UTC+8, the same as the following time involved), but really formed between 21:00 and 08:00 which corresponds with the time of dew intensity. The maximum net dew yield for the day was 0.32 mm and the maximum dew intensity was 0.044 mm/h. The red arrows mark the time of sunrise and sunset. It can be seen that dew forms after sunset and evaporates after sunrise in the second morning.

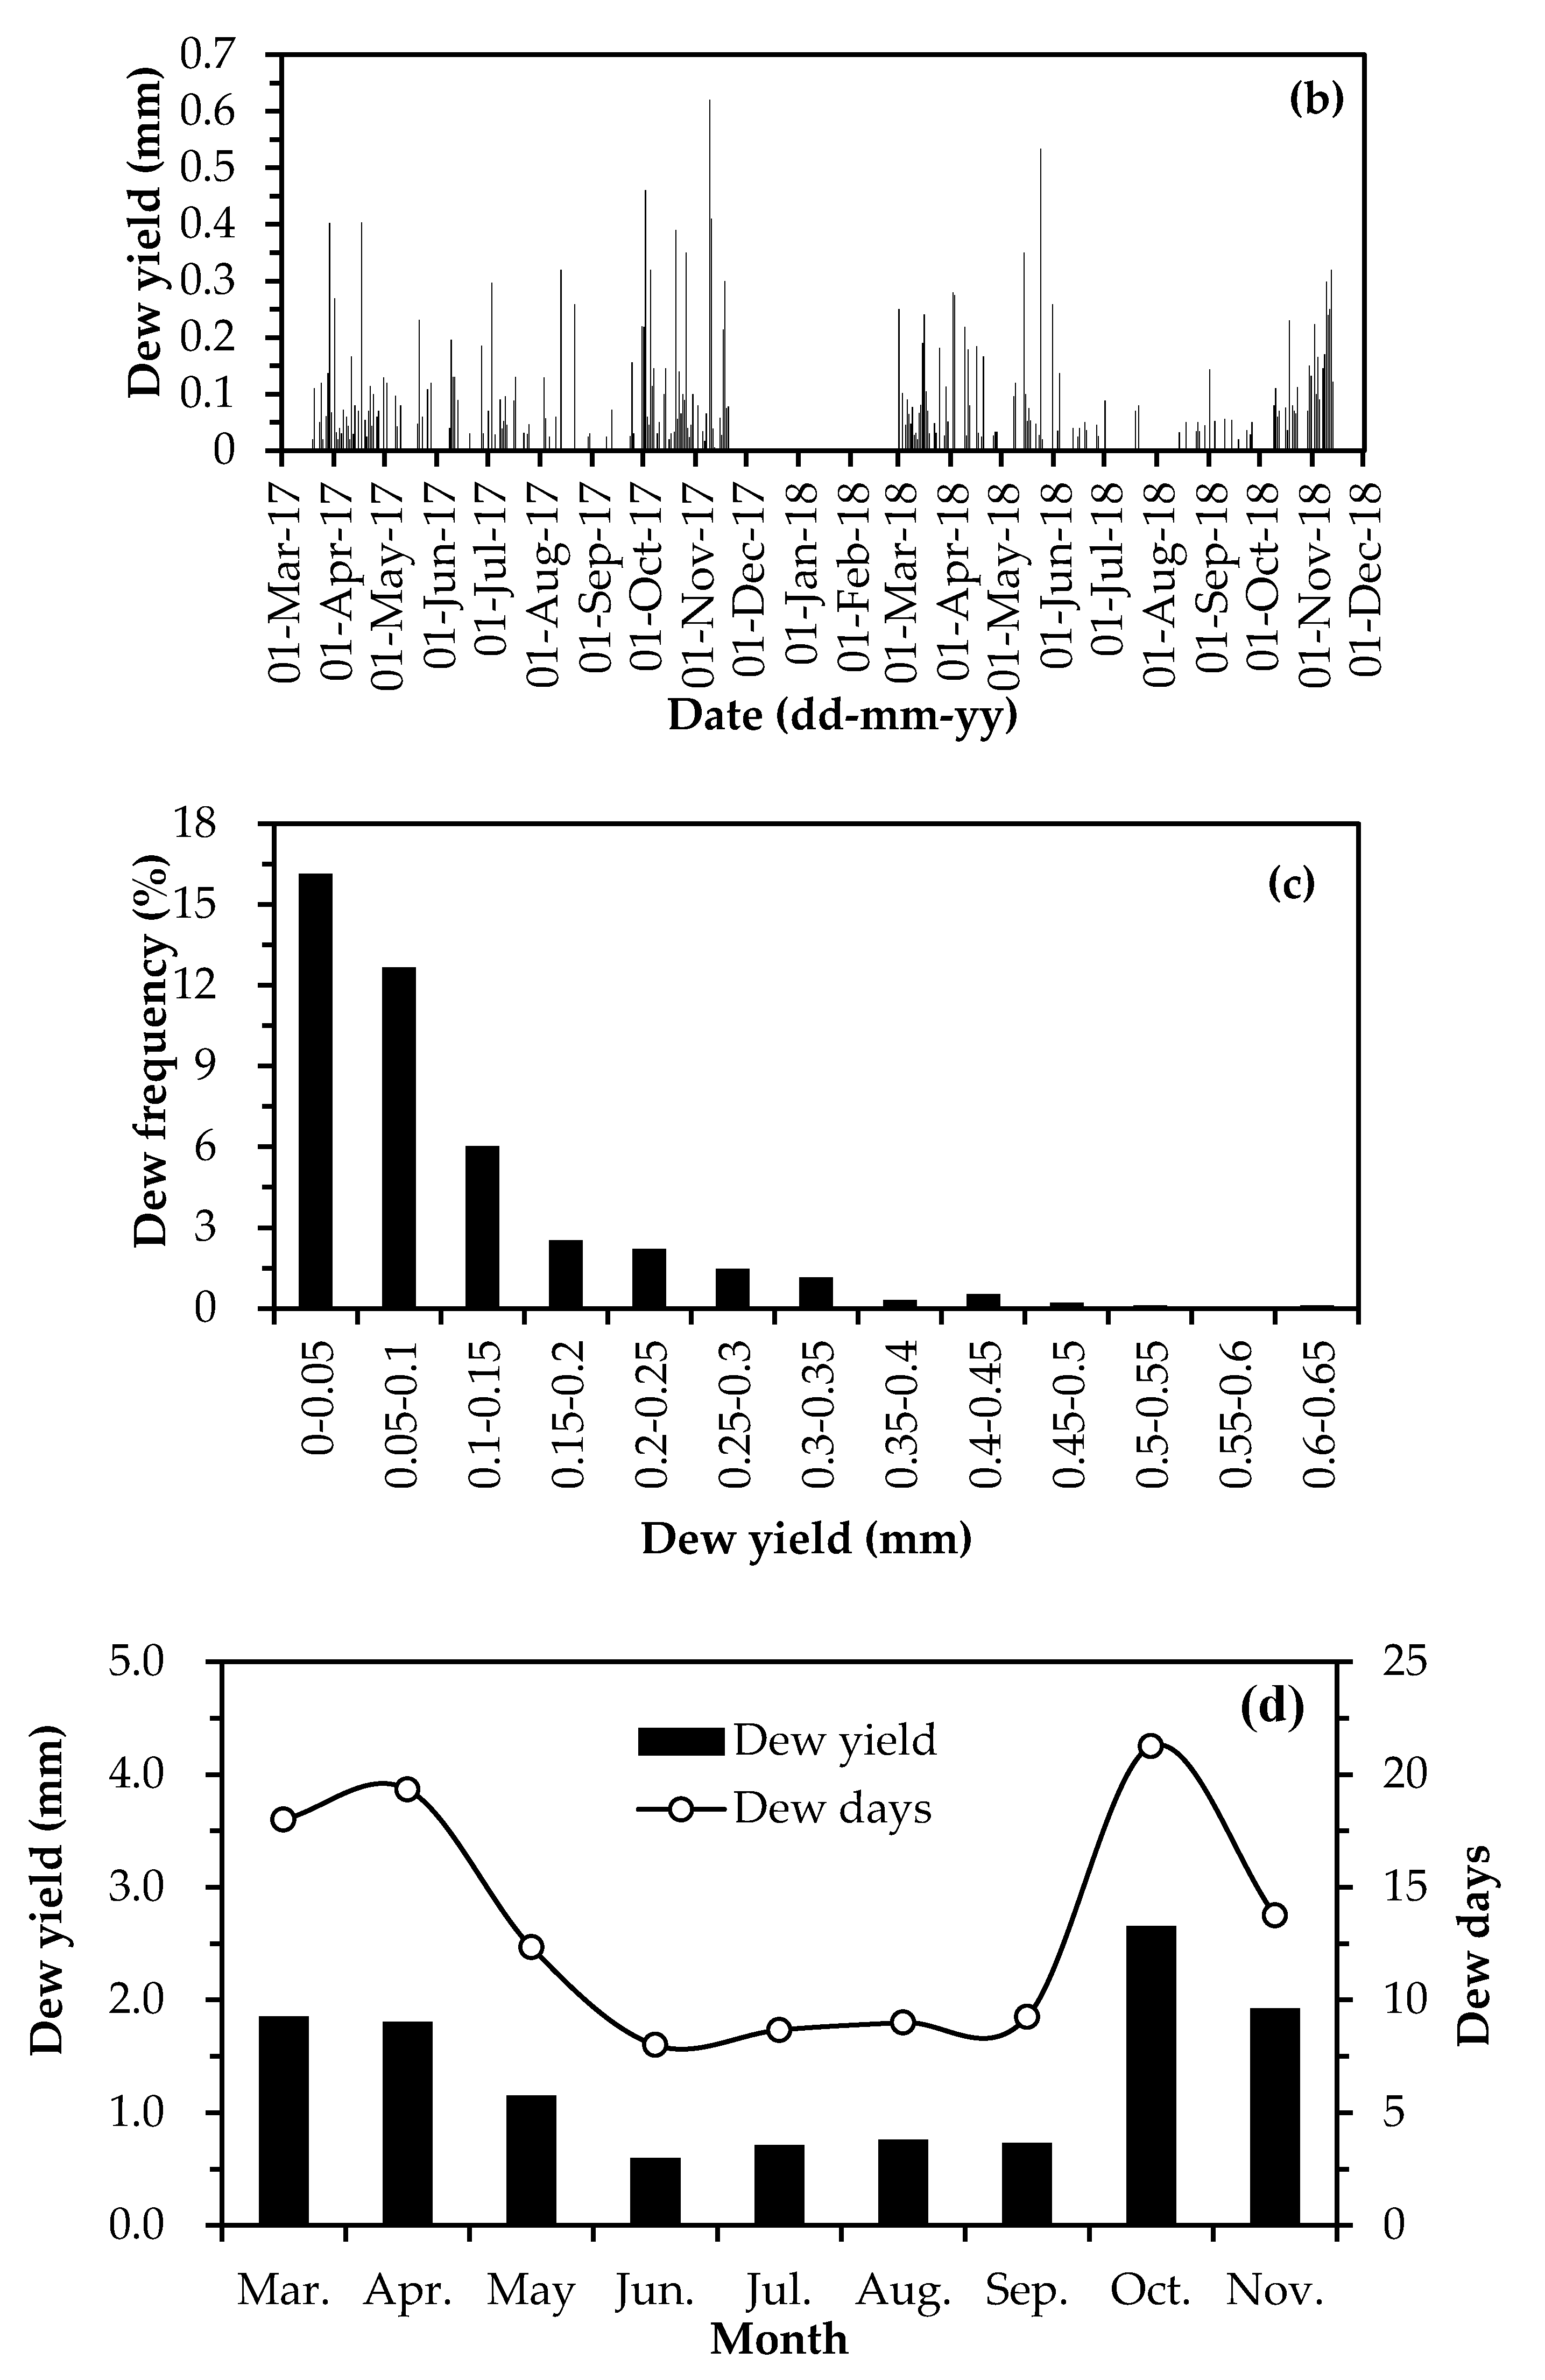
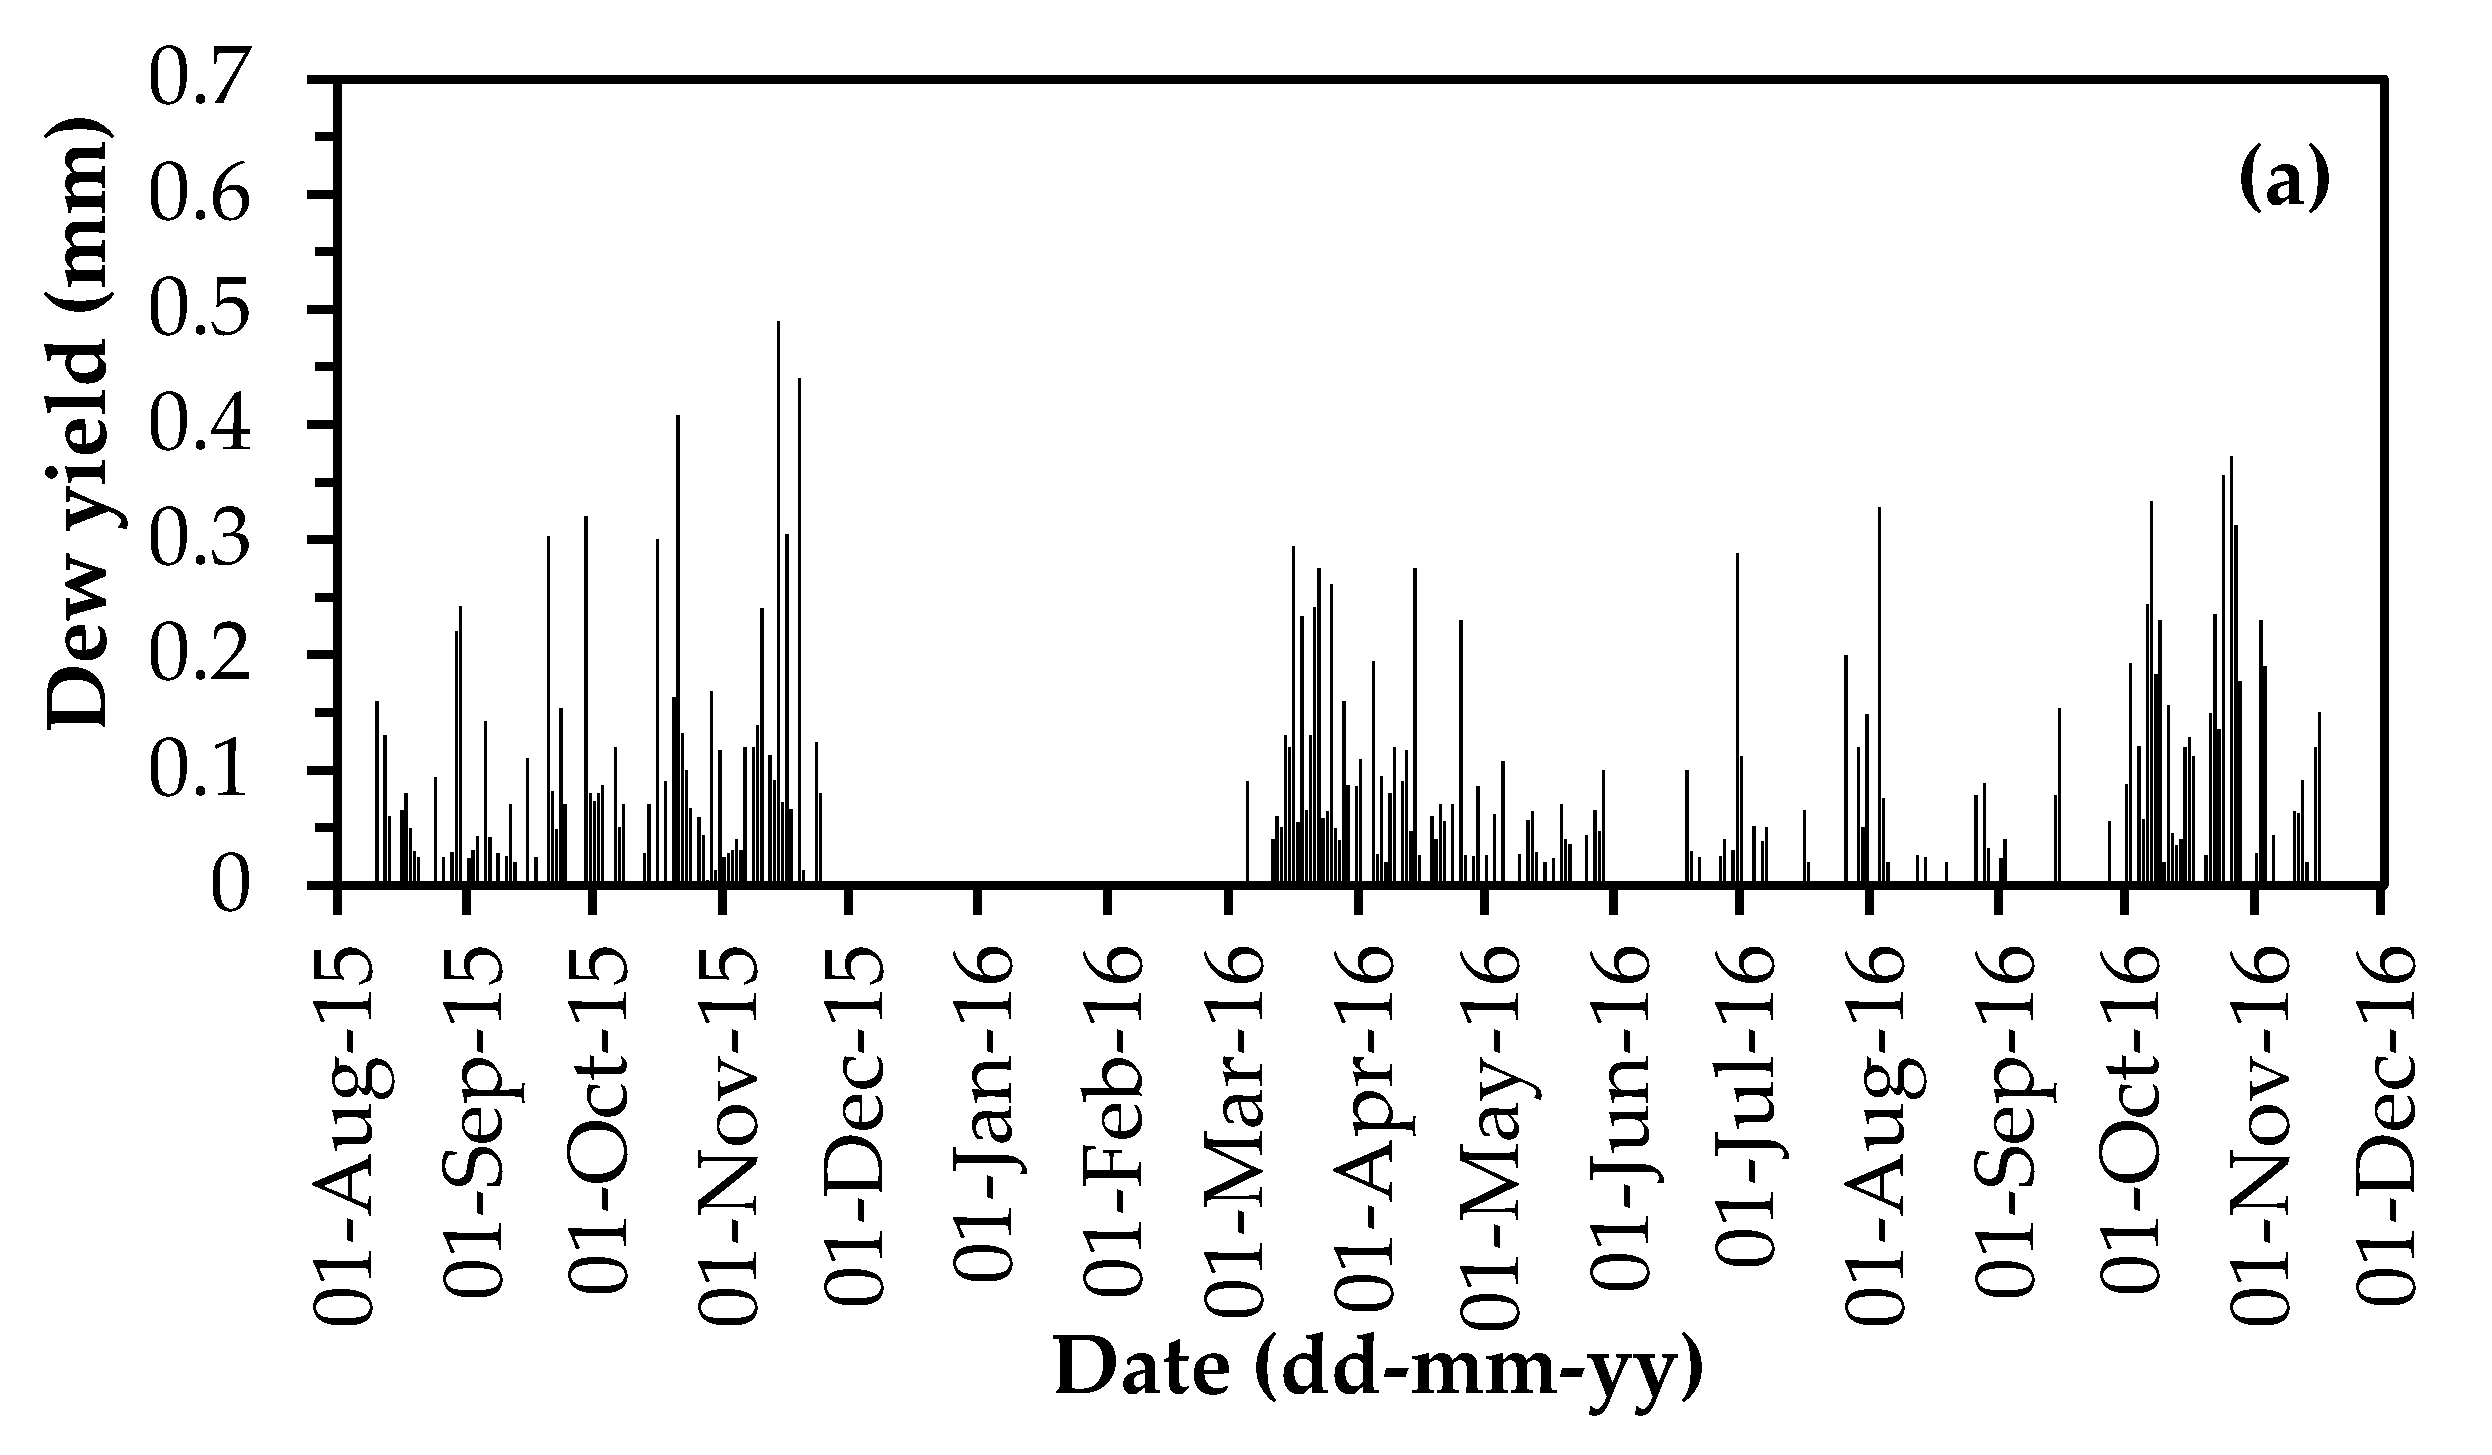
3.2. Annual Variation of Dew

Figure 5 shows the variation and distribution of dew yield in the entire monitoring period. The daily dew yield varied between 0 and 0.62 mm (Figure 5a,b), which is extremely skewed toward smaller values of 0−0.05 mm (Figure 5c). Days of no dew (including rainy days, foggy days, frosty days and snowy days) accounted for 56% of the total monitoring days. Days of any dew with an amount below 0.05 mm accounted for 16% of the total days. Days of dew yield between 0.05 and 0.35 mm accounted for 26% of the total days. Thus, the days of daily dew yield greater than 0.35 mm only accounted for 2% of the total days. The average daily dew yield in the entire monitoring period was 0.044 mm, while that in dew days reached up to 0.10 mm. As shown in Figure 5d, monthly dew yield, with its peak value in March–April and October–November, was consistent with monthly dew days. Thus, the optimal time for collecting dew as an alternative source of water should be in the March–April and October–November periods.

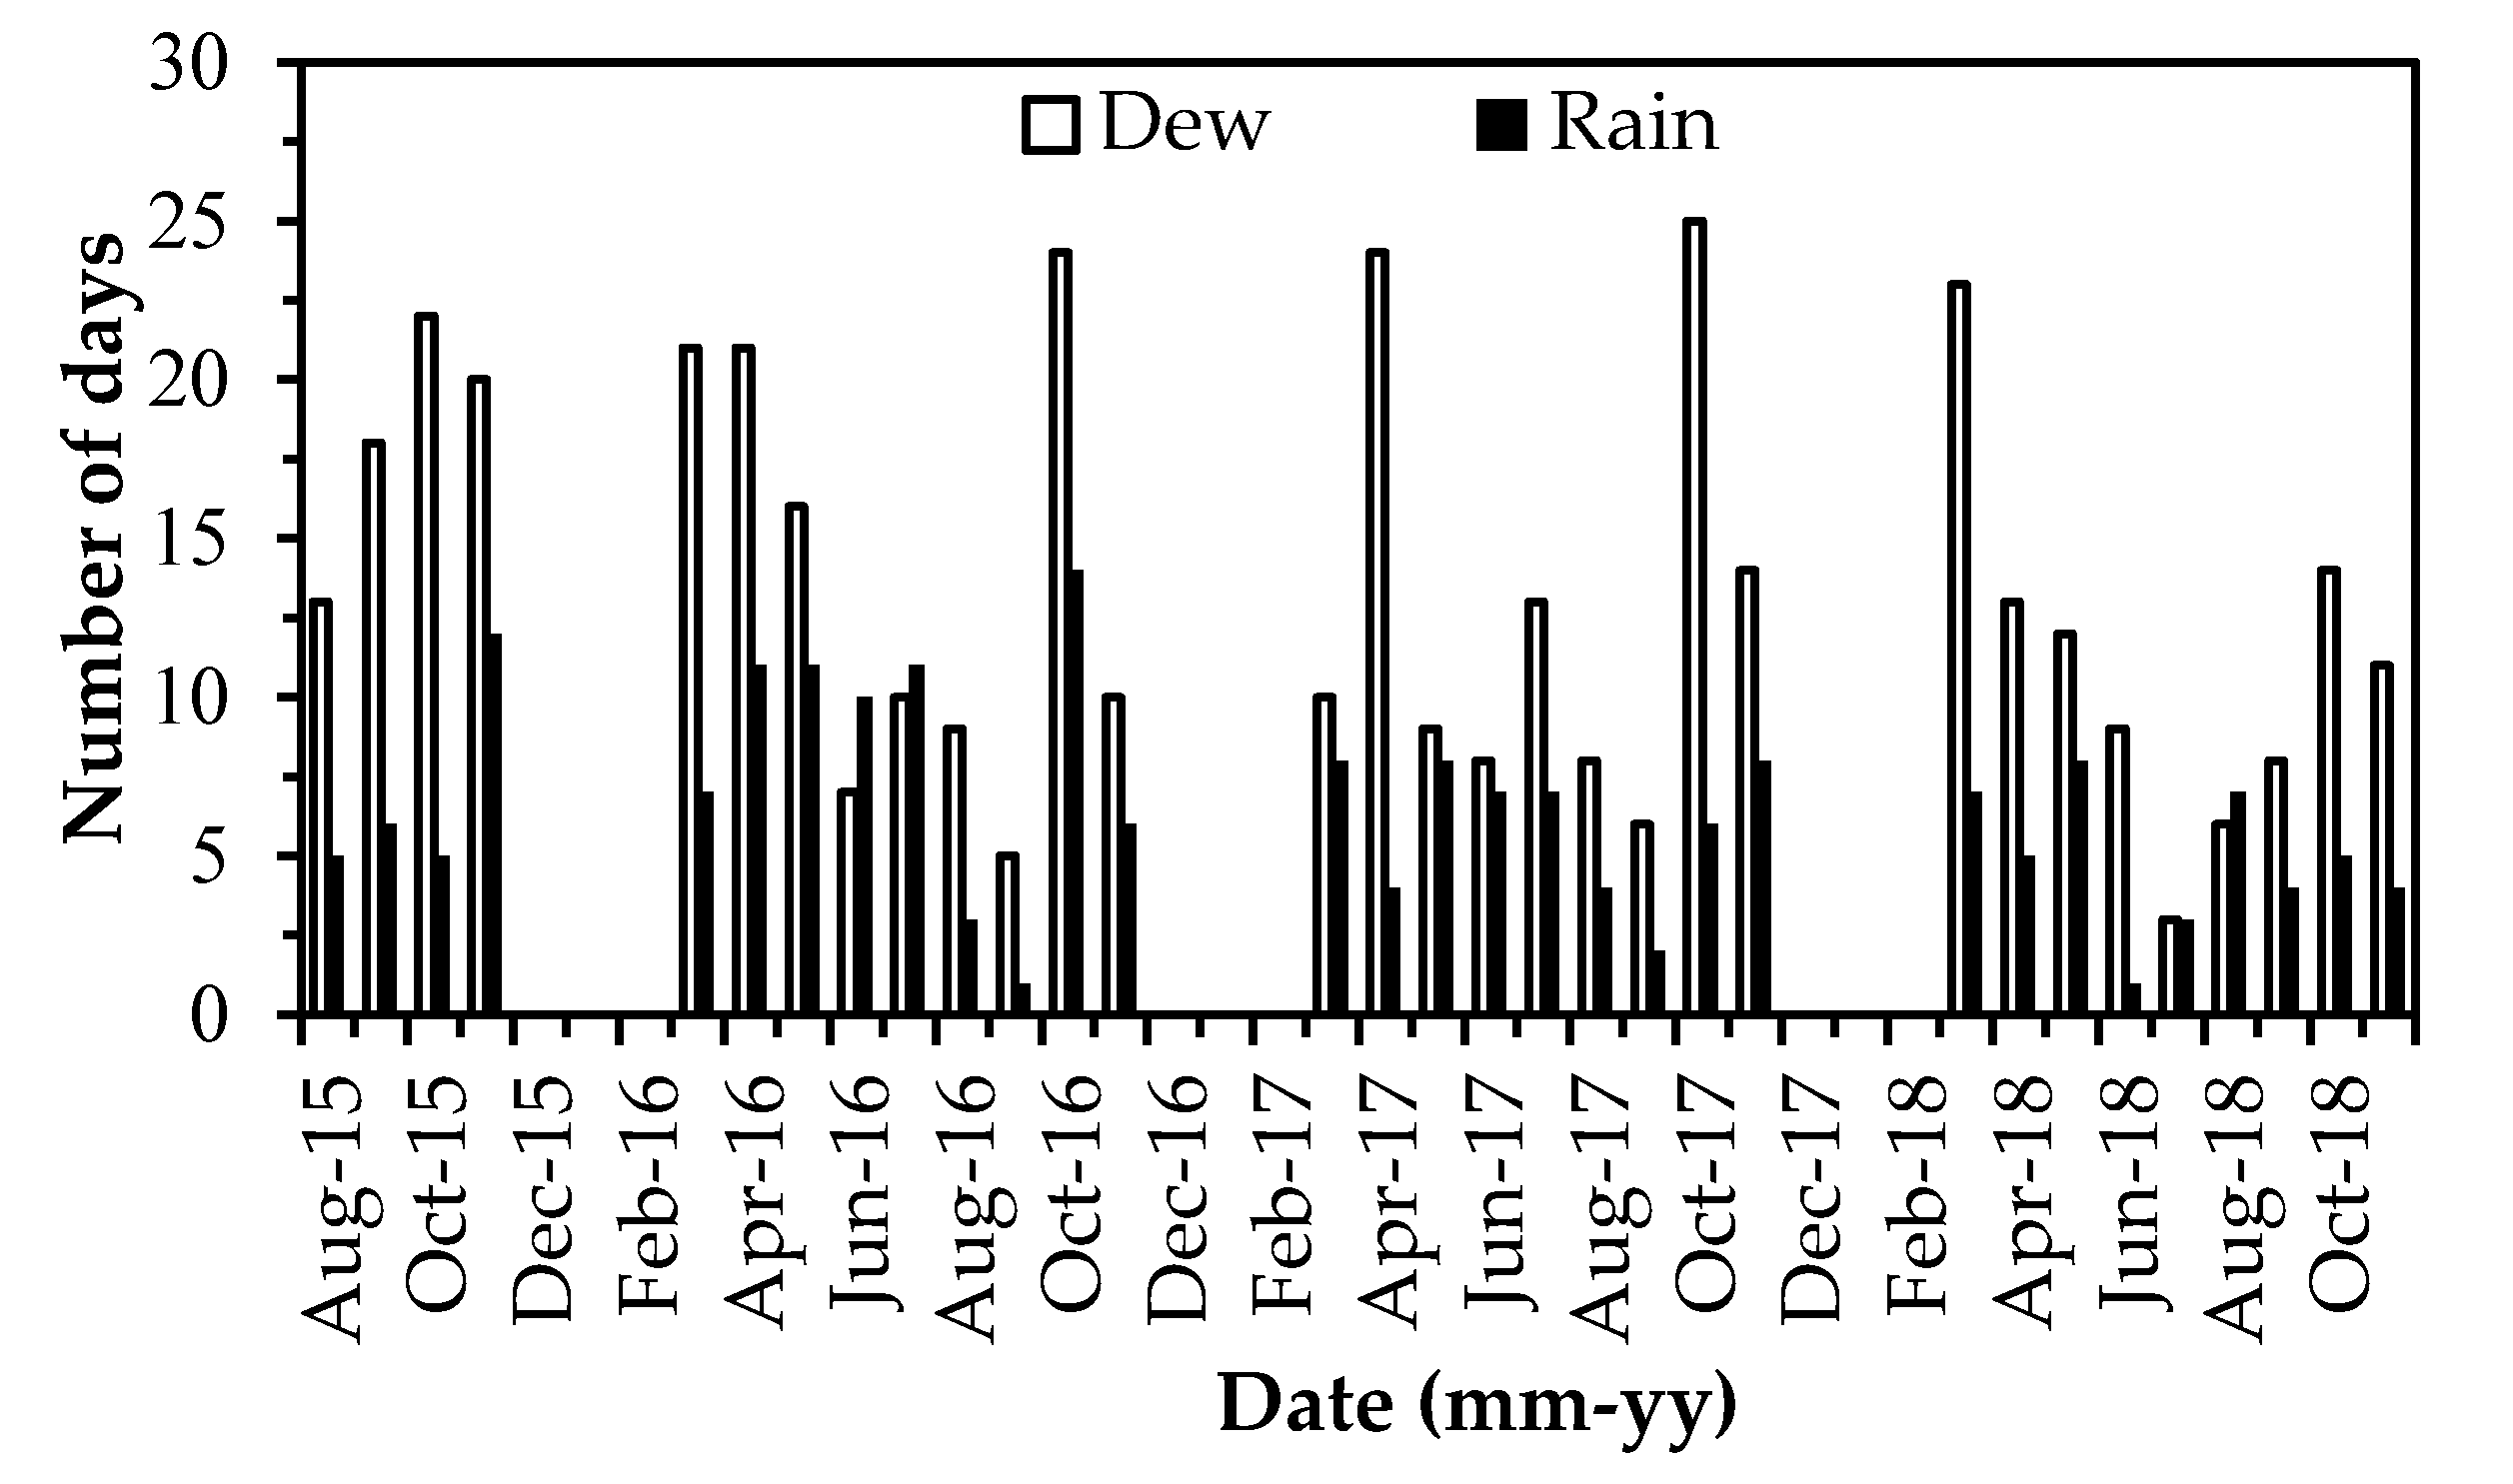
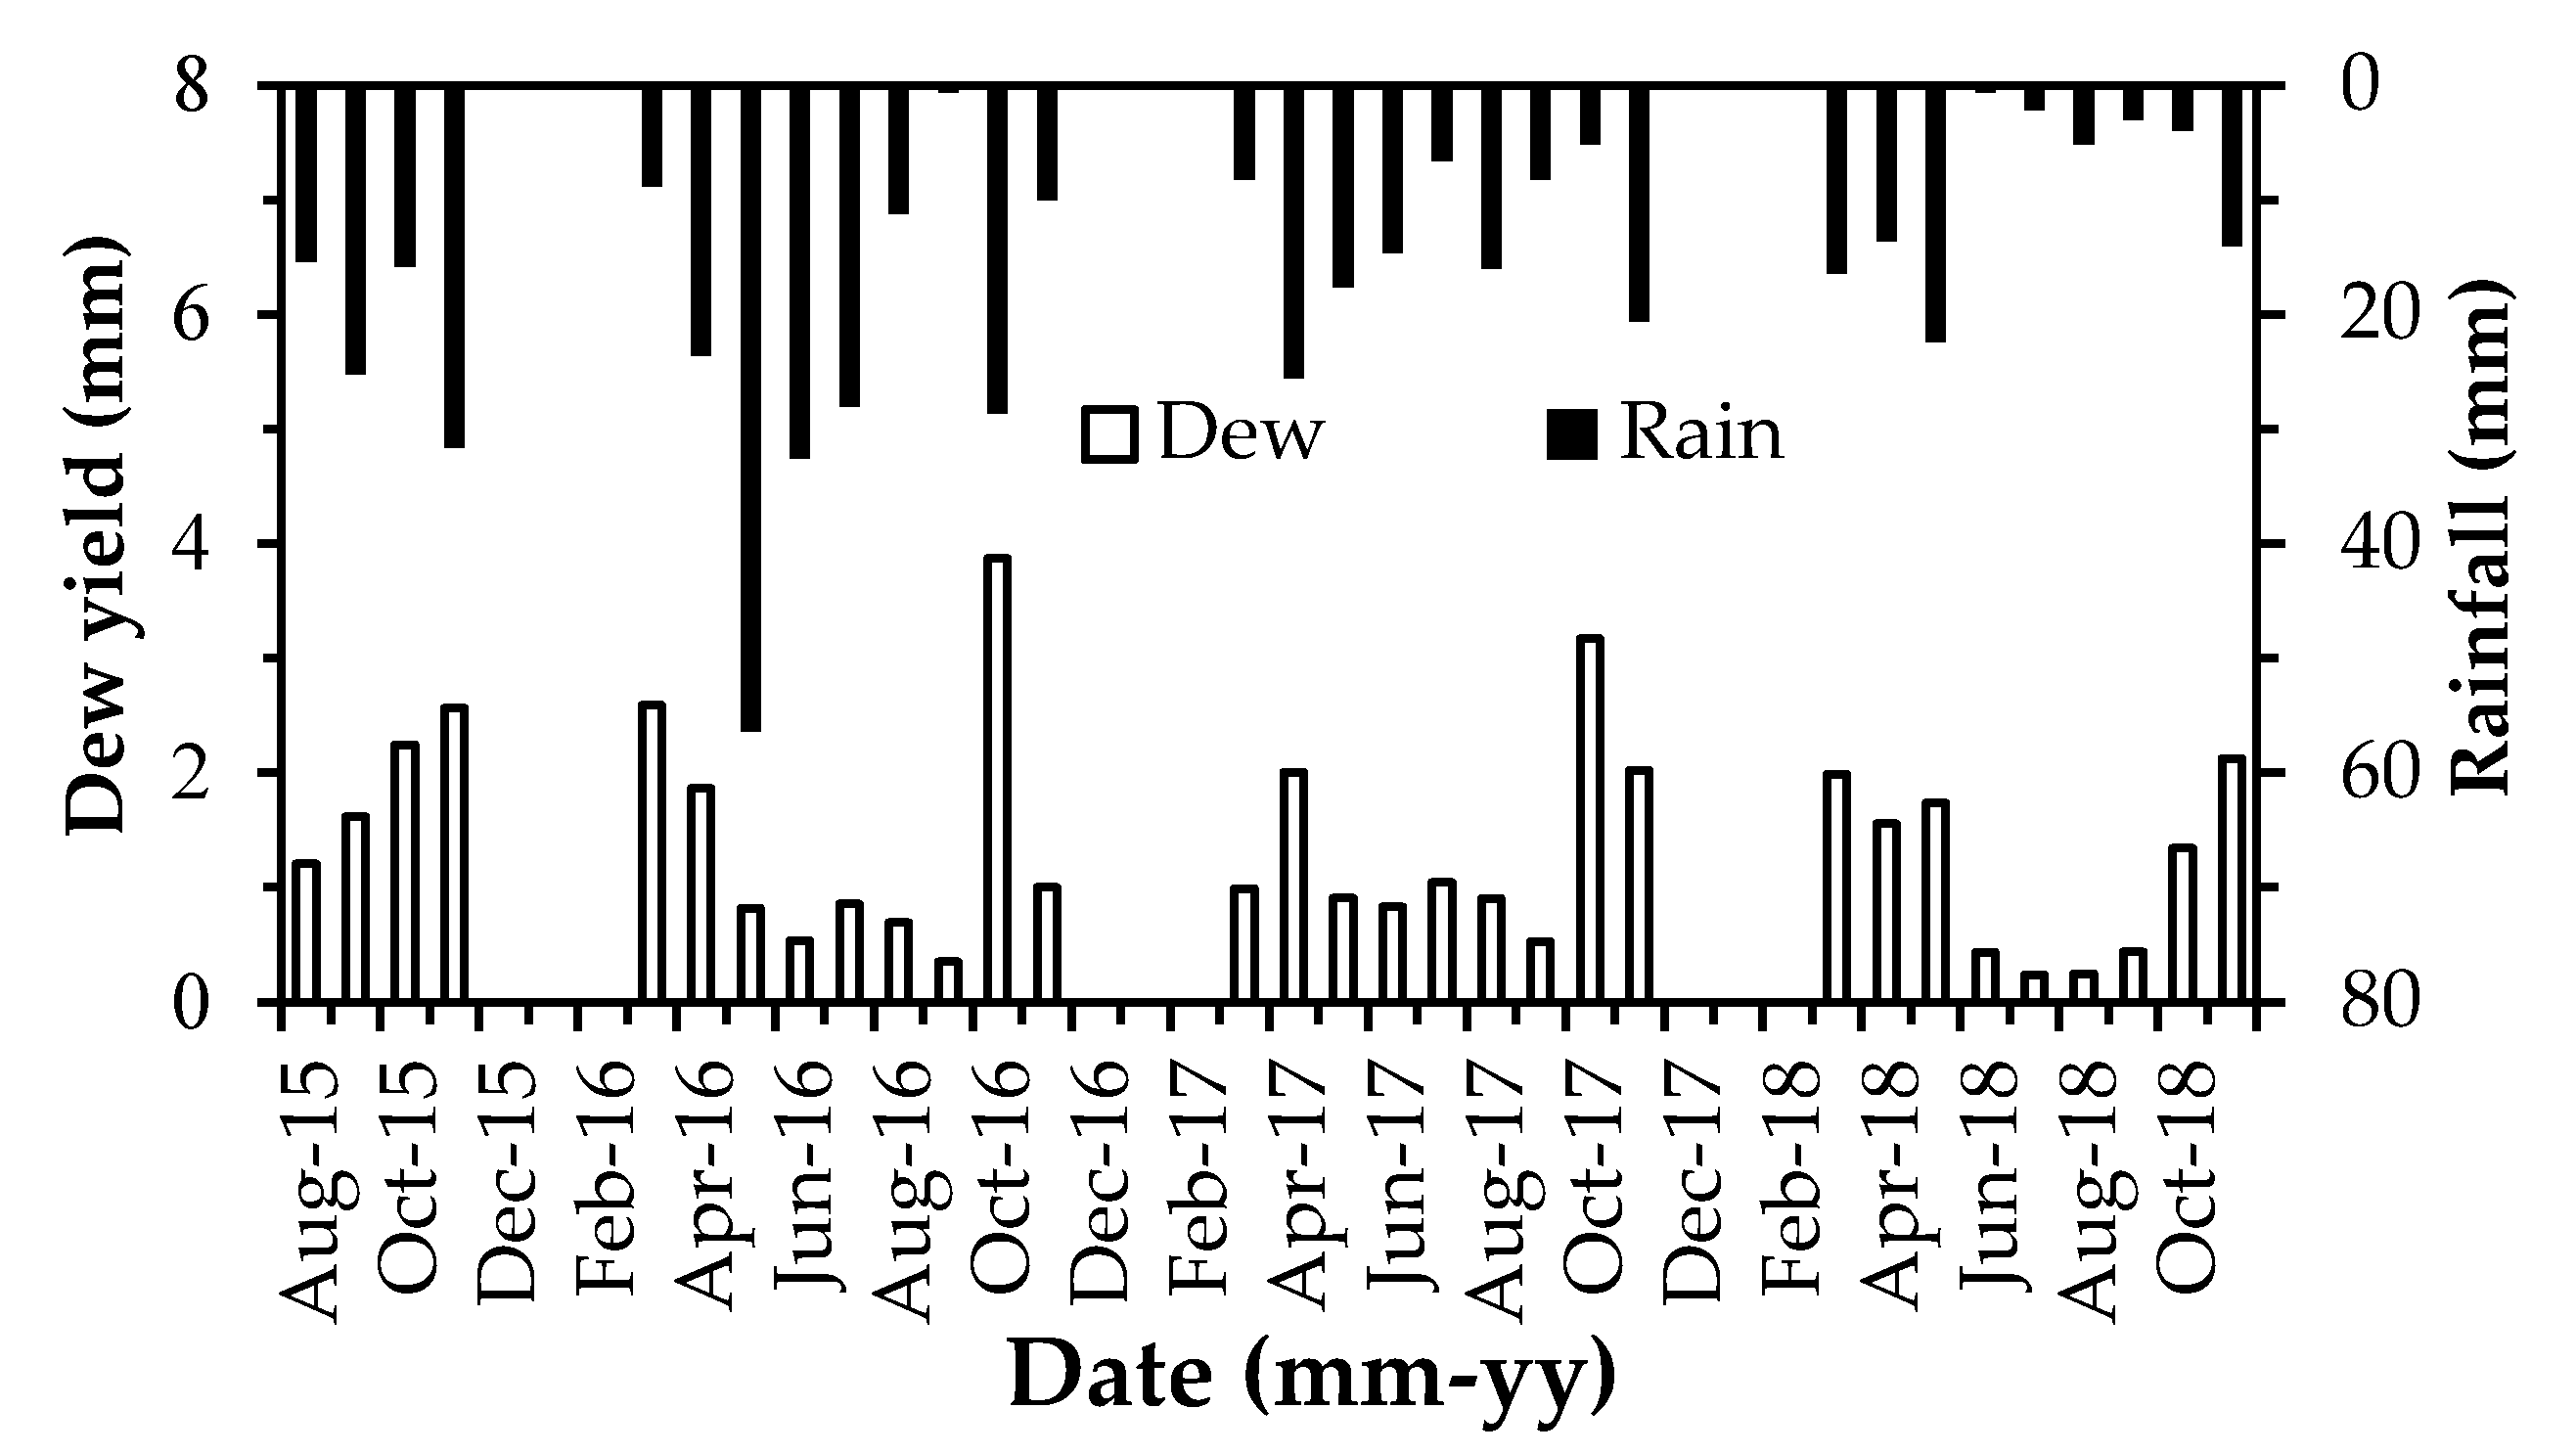
3.3. Dew versus Rain

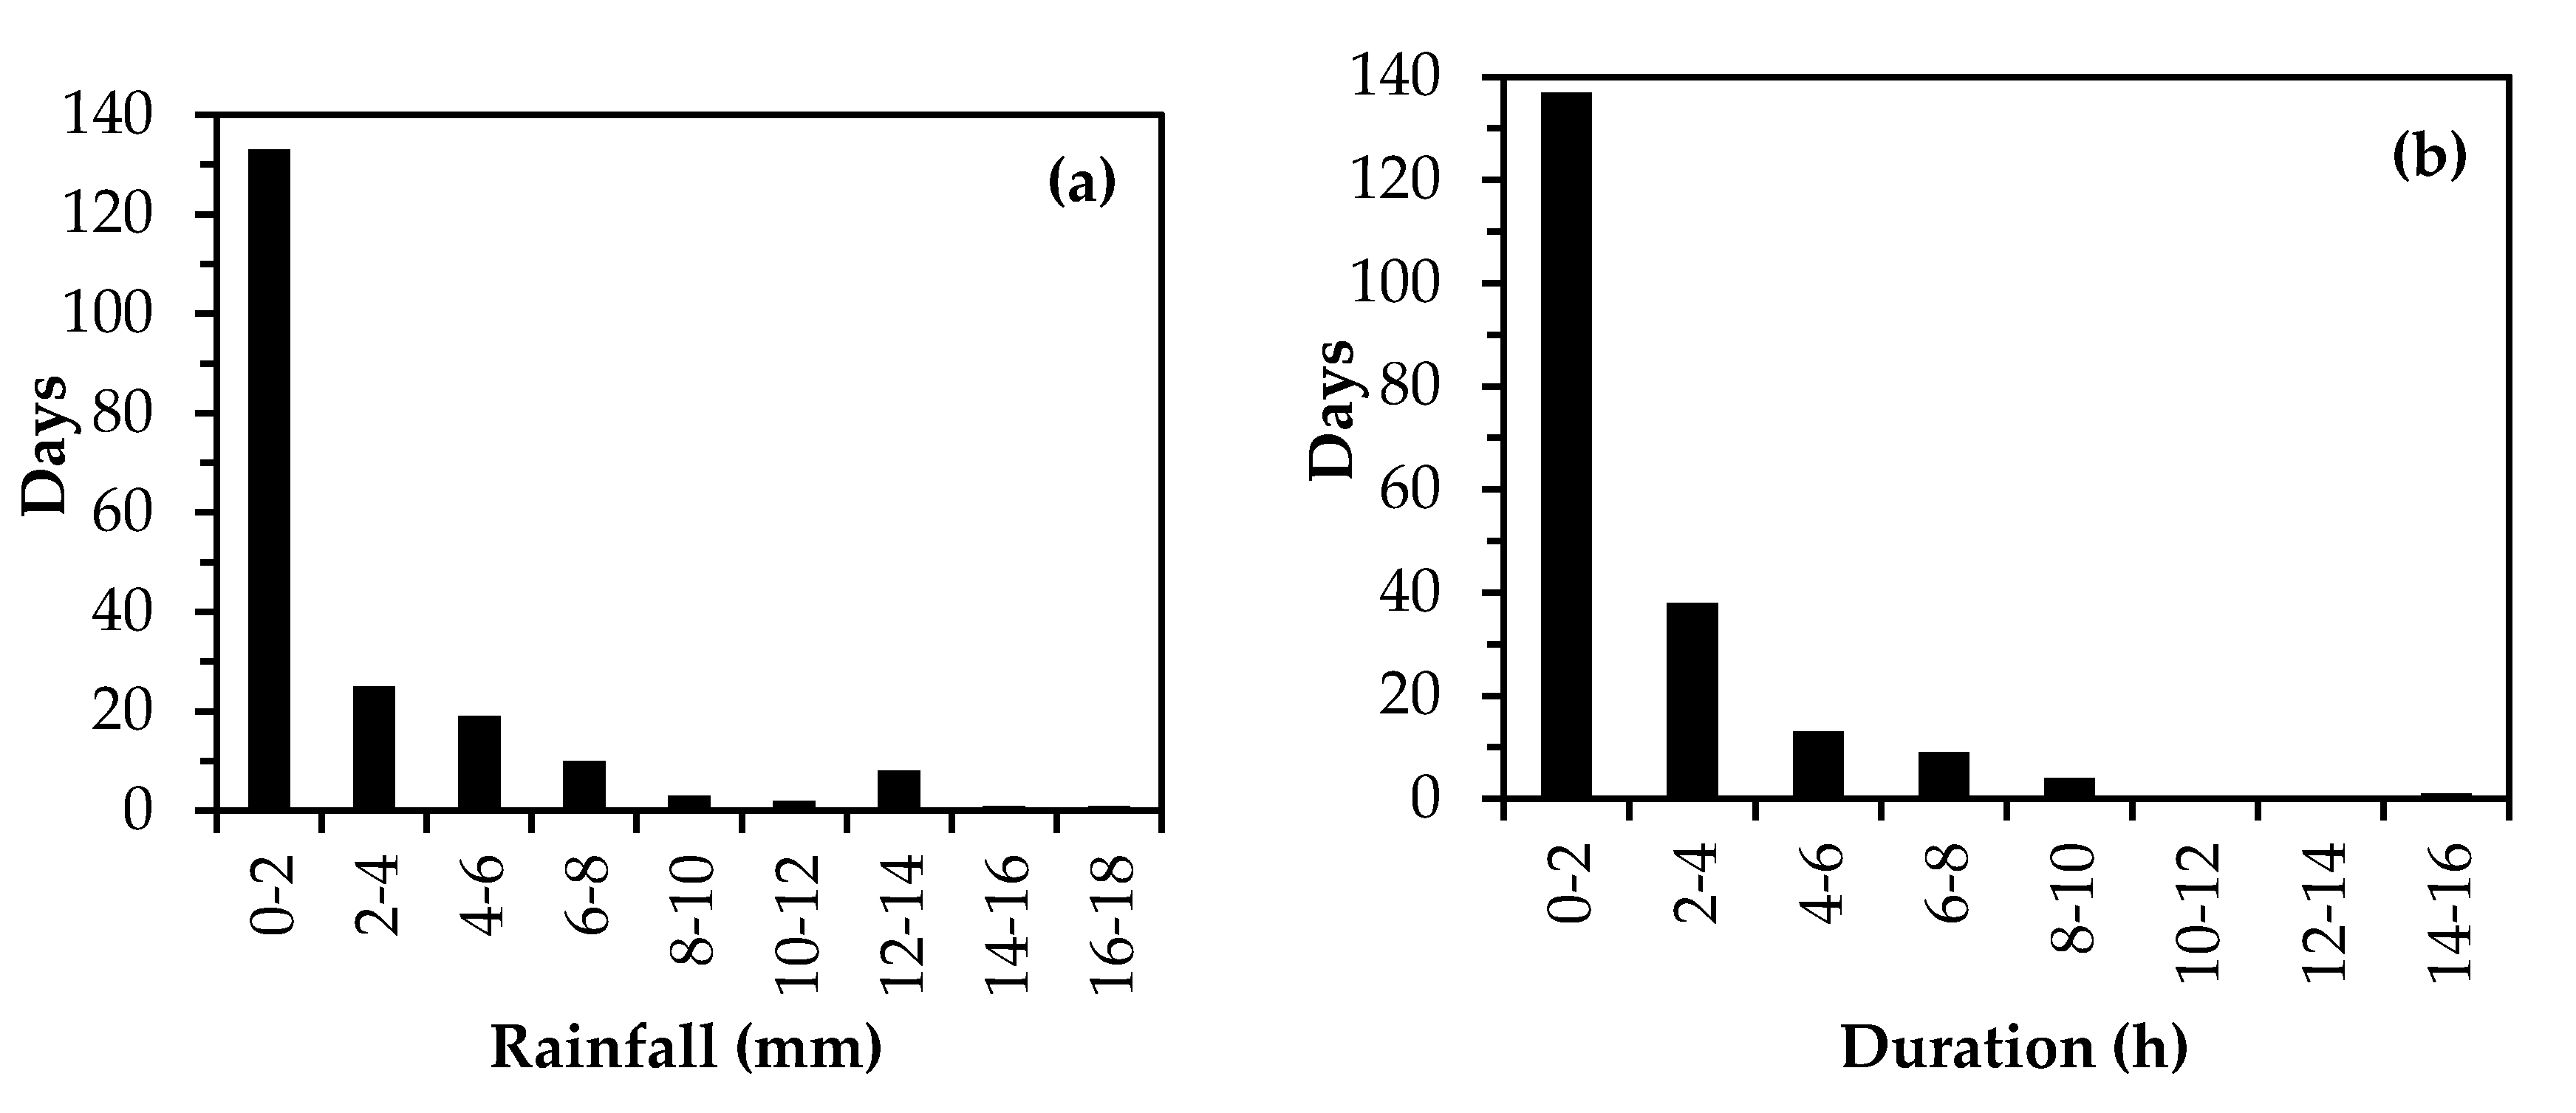
3.3.1. Daily Rainfall

Distribution of daily rainfall and daily duration in the entire observation period is shown in Figure 6. Days of any rain with an amount below 2 mm reached up to 133 days which accounted for 66% of the total rain days (202 days), while the days of daily rainfall greater than 10 mm were 12 days, which only accounted for 0.06% of the total rain days. Meanwhile, the duration of daily rainfall is extremely skewed toward smaller values of 0–2 h. The characteristics of daily rainfall manifested a ‘light rain and short duration’ pattern in this region.

3.3.2. Dew Days

Figure 7 shows the number of dew days and rain days over a monthly time scale in the entire observation period. The number of monthly dew days was always greater than that of rain days. The maximum number of monthly dew days, occurring in April 2017, was 25 days, whereas that of monthly rain days, occurring in October 2016, was 14 days. The number of dew days was 44% of the total observation days, which was about two times that of the rain days.

3.3.3. Dew Yield

Figure 8 shows the monthly yield of dew versus rain. The dewfall was about an order of magnitude less than the rainfall. The maximum value of monthly dew yield, occurring in October 2016, was 3.9 mm, whereas that of monthly rain days, occurring in May 2016, was 56.4 mm. The average annual rainfall (134.6 mm) was 11 times that of the average annual dewfall (12.21 mm).

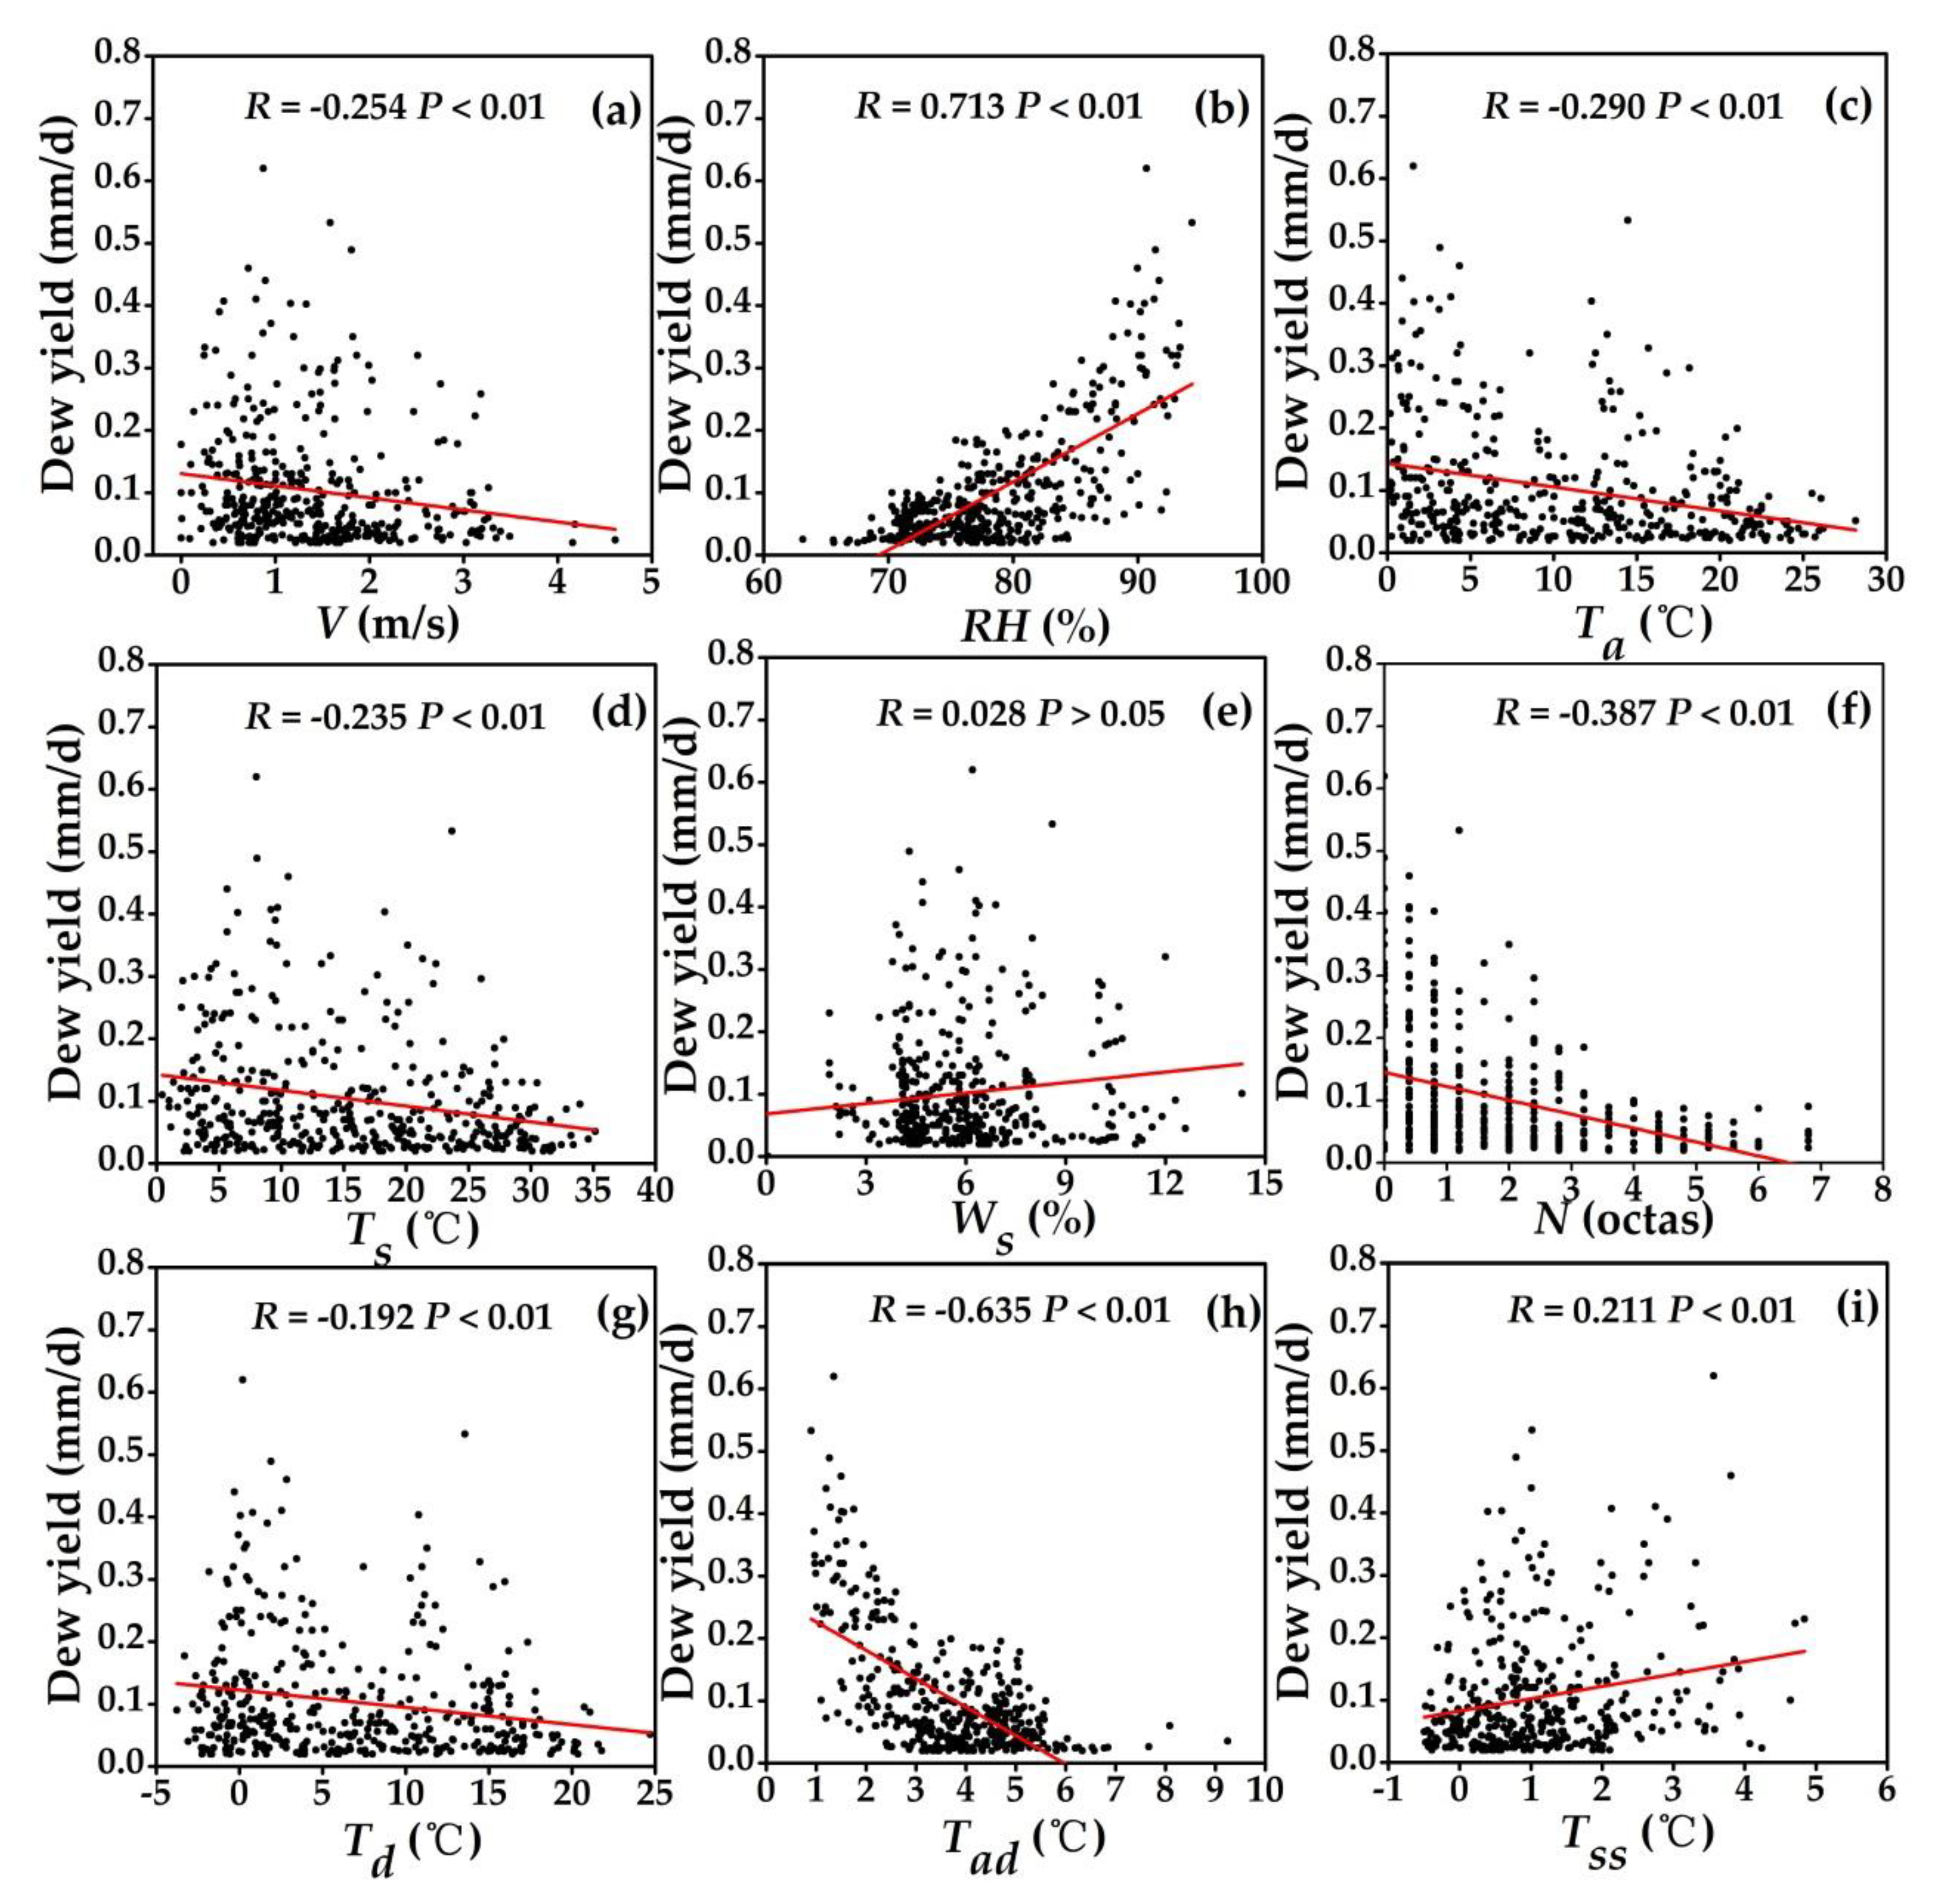
3.4. Influence Factors

3.4.1. Correlation Analysis on Single Factor

Data that suffered from inaccuracies caused by bad weather or instrument failure were excluded before the correlation analysis on single factor was carried out. Based on 406 sets of data, the variation of daily dew yield with the main factors, i.e., wind speed (V), relative humidity (RH), air temperature (Ta), surface soil temperature (Ts), soil moisture (Ws), cloud cover (N), dewpoint temperature (Td), the difference between air temperature and dewpoint temperature (Tad) and the difference between soil temperature at 10 cm below the ground and surface soil temperature (Tss), are shown in Figure 9. The values of all factors above were the average value of the overnight period. Daily dew yield is positively correlated with RH, Ws and Tss, and negatively correlated with V, Ta, Ts, N, Td and Tad. However, it has an insignificant linear correlation to Ws (P > 0.05), while it has extremely significant correlation to others (P < 0.01). Surface soil moisture (Figure 9e) and the peak of dew yield correspond at around 6% (m3/m3), which is also the most frequent soil moisture due to less rainfall and has little effect on dew formation. For other parameters, low wind speed (Figure 9a), high relative humidity (Figure 9b), high values of the difference between soil temperature at 10 cm below the ground and surface soil temperature (Figure 9i), low temperature (Figure 9c,d,g,h) and little cloud cover (Figure 9f) are more conducive to dew formation.

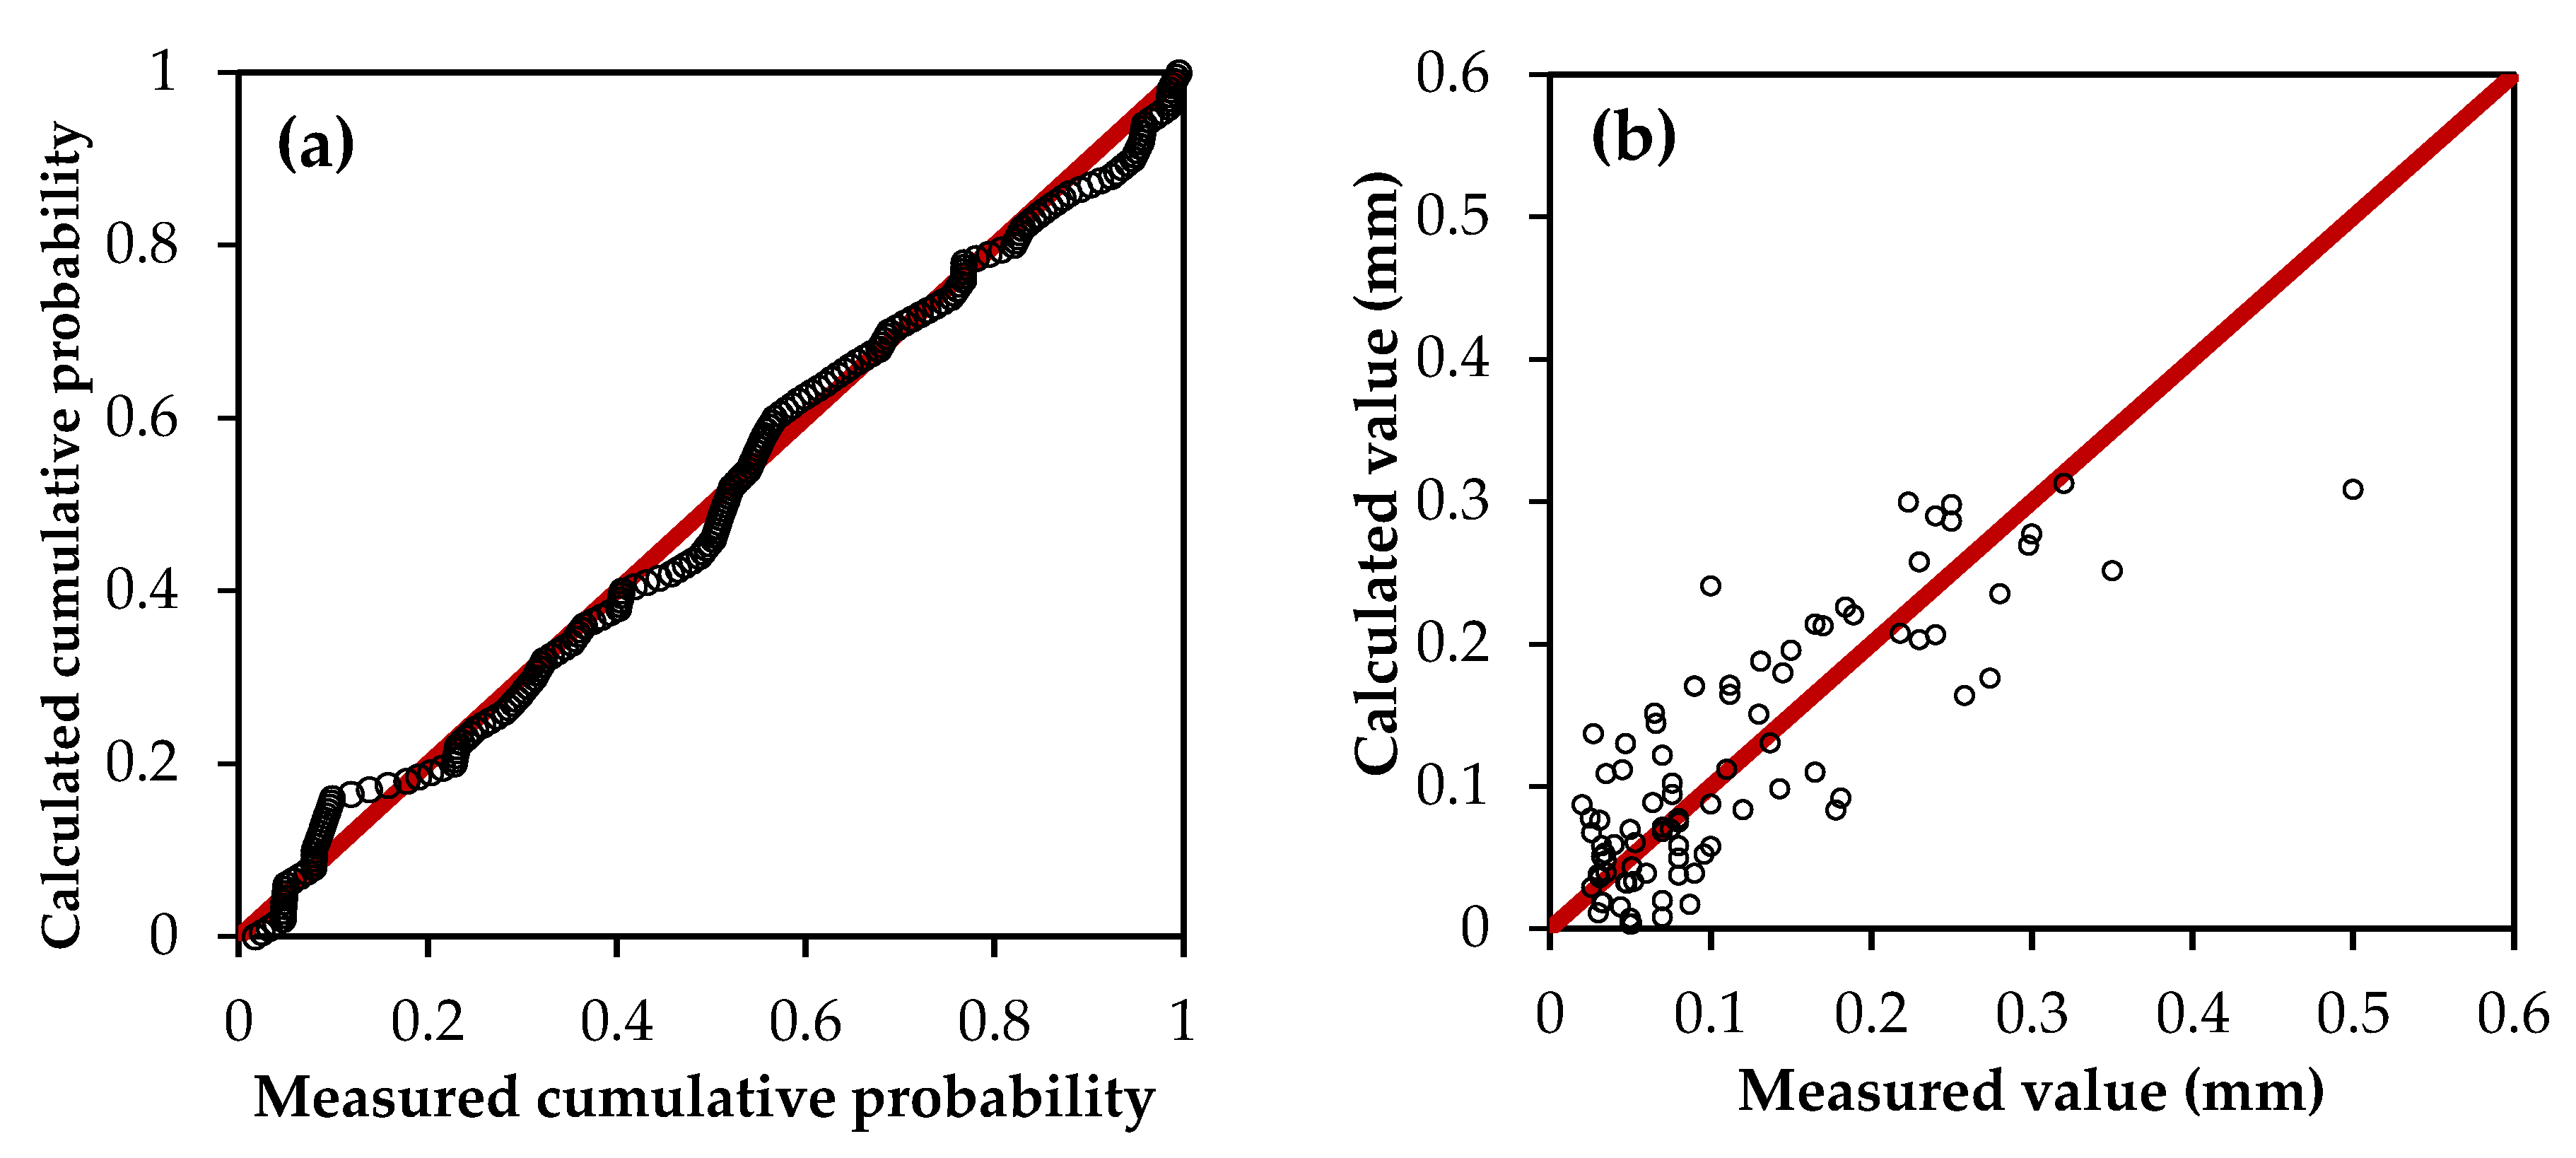
3.4.2. Multiple Regression Analysis

Since dew formation is under the combined action of various factors, 308 sets of data in 1 August 2015 to 1 December 2017 were chosen to conduct a multiple regression between daily dew yield and main factors, and 98 sets of data in 1 March to 1 December 2018 were chosen for model validation. Parameters with extremely significant correlation to daily dew yield (Figure 9) were considered as independent variables. The stepwise regression method was used to choose the appropriate variable. The P-values for entry and removal criteria were 0.01 and 0.05, respectively. Models with tolerance values less than 0.1 for each variable were eliminated, owing to serious collinearity between variables. The results are shown in Table 1. All models have statistical significance in that their F-values are greater than the values with the significant level of 0.01, which means that P-values are less than 0.01. Constant and coefficients from Model 1 to 3 are extremely significant (P < 0.01), and their coefficient values of determination (R Square) increase with the increase of the number of variables, which shows that the fitting degree is gradually improved.
As for Model 3, normal P–P plot of regression standardized residual and model validation plot are shown in Figure 10. Points in Figure 10a are based around the two sides of the diagonal line, which indicates that the residual errors of the model-simulated values are of normal distribution. Although the points composed of calculated values by Model 3 and measured values are dispersed around the two sides of the diagonal line on the whole in Figure 10b (ideal for y = x), only a few events with the highest dew yields (>0.3 mm/d) are under-estimated due to fewer training samples at a higher value. The value of MAE is only 0.023 mm, which is small and approximate to the accuracy of the LWS sensor. Therefore, Model 3 is most suitable to reflect the relationship between daily dew yield and main factors, which is represented by Formula 6 as follows:
D = −0.705 + 0.011 × RH − 0.006 × N − 0.01 × V
It should be noted that the thresholds of the parameters in Formula 6 are RH > 70%, N < 7 (oktas) and V < 6 m/s, according to the regression curve in Figure 9. The positive and negative coefficients of the parameters in Formula 6 reflect the effect of different parameters on dew yield. The water vapor condensation process is the result of overnight thermal exchanges between the substrate and the sky (radiation cooling) and the surrounding atmosphere (convective heating). The lower limit of RH corresponds to the maximum possible cooling with the available energy. Higher values of cloud cover limit the radiative cooling and lead to a decrease of the condensation, and large wind speeds are responsible for enhanced heating convective effects that hamper the condensation process on the substrate rate [2,32,33].

4. Discussion

The duration of dew events as well as resultant yield are dependent upon favorable atmospheric conditions, the condensing substrate properties and geometry. Such circumstances are not entirely restrictive, however, as it is generally accepted that dew is a recurrent phenomenon as evidenced by droplets upon car windshields and grass observed in the early morning hours [2,3,40]. In this study, a typical daily process of dew formation shows that dew existed on the LWS for 13 h from 21:00 to 10:00 the next day, but really formed between 21:00 and 08:00 (sunset and sunrise are at 19:41 and 08:14, respectively), which demonstrated that dew forms after sunset with the atmospheric temperature gradually dropping, and evaporates after sunrise with the temperature increasing in the second morning. This is similar with the results of Jacobs et al. [50], Moro et al. [26], Kabela et al. [28], Hanisch et al. [51] and Pan et al. [6].
The daily average dew yield in dew days was 0.1 mm and the daily maximum yield was 0.62 mm, while dew days accounted for 44% of the total monitoring days, and the monthly maximum of dew days was 25 days. This study re-confirmed that dew manifested a ‘high frequency and low yield’ pattern. Even though daily dew yield is very small, it is beneficial to microorganisms as long as dew yield exceeds 0.03 mm in desert areas [1,52]. As for the desert ecosystem, low frequency of rainfall, light rain, short duration and intense evaporation during the day in desert ecosystems make it impossible for desert organisms to obtain a water supply over a long period. Thus, it is very difficult for desert plants to absorb water through their roots due to prolonged soil moisture deficiencies [29]. Leaf water absorption is very important, and micro dew can also be absorbed directly by plant leaves [11]. Also, frequent dew formation makes the cumulated yield important for desert organisms and improves the rate of seed germination and the survival of small animals. The annual dew yield pattern revealed that it is higher in the March–April and October–November periods. In March–April, accumulated snow begins to melt slowly, providing sufficient vapor for dew formation. In October–November, the air temperature difference between day and night is highest in a year, and the temperature drops rapidly at night, making it easier to reach the dewpoint for vapor condensation. March–April is the main period of spring, and October–November is that of autumn. Previous studies have shown that some ephemeral species in the desert, such as Astragalus arpilobus [53], Isatis violascens [54] and Erodium oxyrhynchum [55] have two germination seasons: spring and autumn. The seeds of ephemeral plants can germinate in spring, and complete their life cycle in summer. Then, they can germinate in autumn, over winter in the form of seedlings, and complete the life cycle in the spring of the following year [56]. The germination seasons happen to be the period with the most dew yield, which further indicates that dew may be one of the main water sources for desert organisms and plays a significant role in desert ecosystems.
Correlation analysis on single factor indicates that the occurrence of dew is not only connected to meteorological conditions, but also to soil conditions. Dew yield was positively correlated to relative humidity (RH) with its threshold greater than 70% (Figure 9b) and negatively correlated to the difference between air temperature and dewpoint temperature (Tad) with its threshold less than 6 °C (Figure 9h). This is similar to the results of Clus et al. [57], Maestre-Valero et al. [58] and Beysens [2,34]. In particular, dew yield increases significantly when RH is greater than 80% and Tad is less than 3 °C. This indicates that dew forms before the relative humidity reaches saturation and before the air temperature drops to the dewpoint. Other factors, such as wind speed (V), air temperature (Ta), surface soil temperature (Ts), cloud cover (N) and dewpoint temperature (Td), are negatively and significantly correlated to dew yield. Wind can bring vapor, but high wind speed increases the heat exchange by convection and turbulence and hinders dew from forming [59]. Monteith thought that wind speed less than 0.5 m/s is favorite to dew formation [60], while Lekouch et al. found that wind speed less than 3 m/s is good for dew formation [32]. The results of this study showed that low wind speed around 0.5 m/s (Figure 9a) in this region is more conducive to dew formation. Ta and Ts are closely related to evaporation. When other factors are constant, the higher the temperature is, the greater the evaporation is [40]. Thus, dew formed is not easy to evaporate under the low air temperature and surface soil temperature. As a simple relative characterization of the radiative cooling effect between the condensing surface and the fraction of clear sky, cloud cover N (oktas) is negatively correlated to cooling energy (Ri) which can be approximately expressed as Ri = (1 − εs) · σ · (285)4 · (1 − N/8) by Beysens [40]. εs and σ in the formula are the total sky emissivity and the Stefan–Boltzmann constant, respectively. High values of cloud cover limit radiative cooling and lead to a decrease of the condensation rate [2,32]. As for dewpoint temperature Td, lower dewpoint temperature is conducive to dew formation. The reason is that Td is negatively correlated to the sky emissivity (1 − εs), which can be expressed as 1 − εs = 0.2422 × [1 + 0.204323 × H − 0.0238893 × H2 − (18.0132 − 1.04963 × H + 0.21891 × H2) × 10−3 × Td] by Berger and Bathiebo [61]. The variable H in the formula is the elevation of the considered site in km. Considered cooling energy (Ri), high values of Td also limit radiative cooling and lead to a decrease of the condensation rate. As for the difference between the soil temperature at 10 cm below the ground and surface soil temperature (Tss), it is positively correlated to dew yield (Figure 9i). The higher temperature difference from underground to the surface created upward gradients of water vapor and heat [62], which can provide more vapors from the soil for dew condensation. As for the surface soil moisture (Ws), the higher surface soil moisture can also provide more abundant water vapor to promote the formation of dew in theory [15], but scarce rainfall in desert areas result in soil moisture at a low level for a long time and has little effect on the dew yield in this study (Figure 9e).
Although many models based on energy balance can estimate dew production [63,64,65,66,67], some parameters of the models, such as soil heat flux, heat exchange coefficient and the properties of the condensing surface, are complex and difficult to obtain. Thus, a simplified model that would demand only a few regular, simple data, available everywhere in the world, would be much more helpful. A statistical approach based on artificial networks has been successfully tested by Lekouch et al., which requires wind speed and wind direction, cloud cover, air and dewpoint temperature and/or relative humidity [32]. An analytical formula valid for planar dew collectors was built by Beysens, which only requires cloud coverage, wind speed, air and dewpoint temperature data to be collected [40]. In this study, a multivariate regression model was constructed to estimate the daily dew yield. A good agreement between calculated and measured values was found. It appears that dew yield is strongly correlated with only a few statistically independent parameters, such as wind speed (V), relative humidity (RH) and cloud cover (N). These data are collected on a regular basis in many meteorological stations and can be easily obtained. Compared with the models of Lekouch et al., wind direction was not considered as one the main factors in this study because the influence of wind direction on dew formation varied with geographical locations and regional prevailing wind directions. Compared with the models of Beysens, the main parameters are the same because air and dewpoint temperature data can be converted to RH by the Lawrence equation which is approximately expressed as RH = 100 − 5 × (TaTd) on the premise of large RH and small (TaTd) [2,47]. Based on meteorological data, it is easier for scientists to estimate the daily dew yield by the multivariate regression equation. However, there are some differences in dew yield at different heights from the ground [46,68,69]. The results of this study represent the dew formation characteristics on a level substrate surface at 5 cm above ground. More research focusing on dew yield at different heights should be further conducted.

5. Conclusions

In a desert ecosystem, non-destructive field measurements were carried out in the study of dew occurring on natural surfaces. It can be concluded that:
(1) A typical daily process of dew formation shows that dew existed on the LWS for 13 h from 21:00 to 10:00 the next day, but really formed between 21:00 and 08:00 (sunset and sunrise are 19:41 and 08:14, respectively), which indicates dew forms after sunset with the atmospheric temperature gradually dropping and evaporates after sunrise with the temperature increasing in the second morning.
(2) The daily average dew yield in dew days was 0.1 mm with a maximum of 0.62 mm, while dew days accounted for 44% of the total monitoring days, with a monthly maximum of 25 days, which can be featured as a ‘high frequency and low yield’ pattern. Compared with rainfall, the number of dew days was two times the number of rain days, while the average annual dewfall (12.21 mm) was about 1/11th of the average annual rainfall (134.6 mm). As for the annual dew yield pattern, dew mainly occurred in March–April and October–November. In March–April, accumulated snow begins to melt slowly, providing sufficient vapor for dew formation. In October–November, the air temperature difference between day and night is highest in a year, and the temperature drops rapidly at night, making it easier to reach the dewpoint for vapor condensation.
(3) Daily dew yield was positively correlated with relative humidity (RH) and the difference between soil temperature at 10 cm below the ground and surface soil temperature (Tss), and negatively correlated with wind speed (V), air temperature (Ta), surface soil temperature (Ts), cloud cover (N), dewpoint temperature (Td) and the difference between air temperature and dewpoint temperature (Tad). The multivariate regression equation, D = −0.705 + 0.011 × RH − 0.006 × N − 0.01 × V, can estimate daily dew yield with the thresholds of the parameters, i.e., RH > 70%, N < 7 (oktas) and V < 6 m/s.

Author Contributions

Conceptualization, Z.J.; methodology, Z.J and Z.Z.; software, Z.J., Z.Z., Q.Z. and W.W.; validation, Z.J., Z.Z., Q.Z. and W.W.; investigation, Z.J. and Z.Z.; writing—original draft preparation, Z.J.; writing—review and editing, Z.J., Z.Z., Q.Z. and W.W.

Funding

This work was supported by the “111” Project (B08039), Innovation and Entrepreneurship Training Program for College Students (201810710101), National Natural Science Foundation of China (41761144059 and 41877179), special Fund for Basic Scientific Research of Central Colleges (300102299206), open fund of Key Laboratory of Subsurface Hydrology and Ecological Effect in Arid Region of Ministry of Education (300102298502) and China Postdoctoral Science Foundation (2018M633438).

Acknowledgments

The authors would like to thank Zhi Wang at California State University for assisting in the dew measurements, and thank all members at Paotai Soil Improvement Test Station for providing places and facilities in the dew experiments.

Conflicts of Interest

The authors declare no conflict of interest.

References

  1. Kidron, G.J. Analysis of dew precipitation in three habitats within a small arid drainage basin, Negev Highlands, Israel. Atmos. Res. 2000, 55, 257–270. [Google Scholar] [CrossRef]
  2. Beysens, D. Dew Water; River Publishers Series in Chemical, Environmental, and Energy Engineering; River Publishers: Gistrup, Denmark; Delft, The Netherlands, 2018. [Google Scholar]
  3. Tomaszkiewicz, M.; Abou Najm, M.; Beysens, D.; Alameddine, I.; El-Fadel, M. Dew as a Sustainable Non-Conventional Water Resource: A Critical Review. Environ. Rev. 2015, 23, 425–442. [Google Scholar] [CrossRef]
  4. Kidron, G.J.; Herrnstadt, I.; Barzilay, E. The role of dew as a moisture source for sand microbiotic crusts in the Negev Desert, Israel. J. Arid Environ. 2002, 52, 517–533. [Google Scholar] [CrossRef]
  5. Rao, B.Q.; Liu, Y.D.; Wang, W.B.; Hu, C.X.; Li, D.H.; Lan, S.B. Influence of dew on biomass and photosystem II activity of cyanobacterial crusts in the Hopq Desert, northwest China. Soil Biol. Biochem. 2009, 41, 2387–2393. [Google Scholar] [CrossRef]
  6. Pan, Y.X.; Wang, X.P.; Zhang, Y.F.; Hu, R. Dew formation characteristics at annual and daily scale in xerophyte shrub plantations at Southeast margin of Tengger desert, Northern China. Ecohydrology 2018, 11, e1968. [Google Scholar] [CrossRef]
  7. Zhang, J.; Zhang, Y.M.; Downing, A.; Cheng, J.H.; Zhou, X.B.; Zhang, B.C. The influence of biological soil crusts on dew deposition in Gurbantunggut Desert, Northwestern China. J. Hydrol. 2009, 379, 220–228. [Google Scholar] [CrossRef]
  8. Kidron, G.J.; Temina, M. The effect of dew and fog on lithic lichens along an altitudinal gradient in the Negev Desert. Geomicrobiol. J. 2013, 30, 281–290. [Google Scholar] [CrossRef]
  9. Pan, Y.X.; Wang, X.P. Effects of shrub species and microhabitats on dew formation in a revegetation-stabilized desert ecosystem in Shapotou, northern China. J. Arid Land 2014, 6, 389–399. [Google Scholar] [CrossRef]
  10. Steinberger, Y.; Loboda, I.; Garner, W. The influence of autumn dewfall on spatial and temporal distribution of nematodes in the desert ecosystem. J. Arid Environ. 1989, 16, 177–183. [Google Scholar] [CrossRef]
  11. Agam, N.; Berliner, P.R. Dew formation and water vapor adsorption in semi-arid environments—A review. J. Arid Environ. 2006, 65, 572–590. [Google Scholar] [CrossRef]
  12. Groh, J.; Slawitschika, V.; Herndl, M.; Graf, A.; Vereecken, H.; Pütz, T. Determining dew and hoar frost formation for a low mountain range and alpine grassland site by weighable lysimeter. J. Hydrol. 2018, 563, 372–381. [Google Scholar] [CrossRef]
  13. Wen, X.F.; Lee, X.H.; Sun, X.M.; Wang, J.L.; Hu, Z.M.; Li, S.G.; Yu, J.R. Dew water isotopic ratios and their relationships to ecosystem water pools and fluxes in a cropland and a grassland in China. Oecologia 2012, 168, 549–561. [Google Scholar] [CrossRef]
  14. Richards, K. Observation and simulation of dew in rural and urban environments. Prog. Phys. Geogr. 2004, 28, 76–94. [Google Scholar] [CrossRef]
  15. Saito, H.; Simunek, J.; Scanlon, B.R.; Reedy, R.C. Numerical Analysis of Coupled Water, Vapor, and Heat Transport in the Vadose Zone. Vadose Zone J. 2006, 5, 784–800. [Google Scholar] [CrossRef]
  16. Monteith, J.L.; Unsworth, M. Principles of Environmental Physics, 2nd ed.; Edward Arnold: London, UK, 1990; p. 291. [Google Scholar]
  17. Pan, Y.X.; Wang, X.P.; Zhang, Y.F. Dew formation characteristics in a revegetation-stabilized desert ecosystem in Shapotou area, Northern China. J. Hydrol. 2010, 387, 265–272. [Google Scholar] [CrossRef]
  18. Ye, Y.H.; Zhou, K.; Song, L.Y.; Jin, J.H.; Peng, S.L. Dew amounts and its correlations with meteorological factors in urban landscapes of Guangzhou, China. Atmos. Res. 2007, 86, 21–29. [Google Scholar] [CrossRef]
  19. Beysens, D. The formation of dew. Atmos. Res. 1995, 39, 215–237. [Google Scholar] [CrossRef]
  20. Li, X.Y. Effects of gravel and sand mulches on dew deposition in the semiarid region of China. J. Hydrol. 2002, 260, 151–160. [Google Scholar] [CrossRef]
  21. Zhang, X.; Li, X.; Wang, W. Experimental Observation Analysis on Dew Formation in Southern Mu us Sandy Land. Arid Meteorol. 2008, 26, 8–13. [Google Scholar]
  22. Ritter, F.; Berkelhammer, M.; Beysens, D. Dew frequency across the US from a network of in situ radiometers. Hydrol. Earth Syst. Sci. Eur. Geosci. Union 2019, 23, 1179–1197. [Google Scholar] [CrossRef]
  23. Duvdevani, S. An optical method of dew estimation. Q. J. R. Meteorol. Soc. 1947, 73, 282–296. [Google Scholar] [CrossRef]
  24. Davis, D.R.; Hughes, J.E. A new approach to recording the wetting parameter by the use of electrical resistance sensors. Plant Dis. Rep. 1970, 54, 474–479. [Google Scholar]
  25. Zangvil, A. Six years of dew observations in the Negev Desert, Israel. J. Arid Environ. 1996, 32, 361–371. [Google Scholar] [CrossRef]
  26. Moro, M.J.; Were, A.; Villagarcía, L.; Canto´n, Y.; Domingo, F. Dew measurement by Eddy covariance and wetness sensor in a semiarid ecosystem of SE Spain. J. Hydrol. 2007, 335, 295–302. [Google Scholar] [CrossRef]
  27. Sentelhas, P.C.; Marta, A.D.; Orlandini, S. Suitability of relative humidity as an estimator of leaf wetness duration. Agric. For. Meteorol. 2008, 148, 392–400. [Google Scholar] [CrossRef]
  28. Kabela, E.D.; Hornbuckle, B.K.; Cosh, M.H.; Anderson, M.C.; Gleason, M.L. Dew frequency, duration, amount, and distribution in corn and soybean during SMEX05. Agric. For. Meteorol. 2009, 149, 11–24. [Google Scholar] [CrossRef]
  29. Wang, X.; Gao, Z.Y.; Wang, Y.K.; Wang, Z.; Jin, S. Dew measurement and estimation of rain-fed jujube (Zizyphus jujube Mill) in a semi-arid loess hilly region of China. J. Arid Land 2017, 9, 547–557. [Google Scholar] [CrossRef]
  30. Jia, Z.F.; Wang, Z.; Wang, H. Characteristics of Dew Formation in the Semi-Arid Loess Plateau of Central Shaanxi Province, China. Water 2019, 11, 126. [Google Scholar] [CrossRef]
  31. Muselli, M.; Beysens, D.; Mileta, M.; Milimouk, I. Dew and rain water collection in the Dalmatian Coast, Croatia. Atmos. Res. 2009, 92, 455–463. [Google Scholar] [CrossRef]
  32. Lekouch, I.; Lekouch, K.; Muselli, M.; Mongruel, A.; Kabbachi, B.; Beysens, D. Rooftop dew, fog and rain collection in southwest Morocco and predictive dew modeling using neural networks. J. Hydrol. 2012, 448–449, 60–72. [Google Scholar] [CrossRef]
  33. Beysens, D.; Milimouk, I.; Nikolayev, V.; Muselli, M.; Marcillat, J. Using radiative cooling to condense atmospheric vapour: A study to improve water yield. J. Hydrol. 2003, 276, 1–11. [Google Scholar] [CrossRef]
  34. Beysens, D.; Pruvost, V.; Pruvost, B. Dew observed on cars as a proxy for quantitative measurements. J. Arid Environ. 2016, 135, 90–95. [Google Scholar] [CrossRef]
  35. Zhang, Q.; Wang, S.; Yang, F.; Yue, P.; Yao, T.; Wang, W.Y. Characteristics of Dew Formation and Distribution, and Its Contribution to the Surface Water Budget in a Semi-arid Region in China. Bound. Layer Meteorol. 2015, 154, 317–331. [Google Scholar] [CrossRef]
  36. Kidron, G.J.; Kronenfeld, R. Assessing the effect of micro-lysimeters on NRWI: Do micro-lysimeters adequately represent the water input of natural soil? J. Hydrol. 2017, 548, 382–390. [Google Scholar] [CrossRef]
  37. Meissner, R.; Seeger, J.; Rupp, H.; Seyfarth, M.; Borg, H. Measurement of dew, fog, and rime with a high-precision gravitation lysimeter. J. Plant Nutr. Soil Sci. 2007, 170, 335–344. [Google Scholar] [CrossRef]
  38. Ucles, O.; Villagarcia, L.; Moro, M.J.; Canton, Y.; Domingo, F. Role of dewfall in the water balance of a semiarid coastal steppe ecosystem. Hydrol. Process. 2014, 28, 2271–2280. [Google Scholar] [CrossRef]
  39. Gao, Z.; Wang, Y.; Wang, X. Dew Amount of Jujube Plantation in Semi-arid Loess Hilly-gully Region. Trans. Chin. Soc. Agric. Mach. 2015, 46, 105–115. (In Chinese) [Google Scholar]
  40. Beysens, D. Estimating dew yield worldwide from a few meteo data. Atmos. Res. 2016, 167, 146–155. [Google Scholar] [CrossRef]
  41. Fan, L.L.; Tang, L.S.; Wu, L.F.; Ma, J.; Li, Y. The limited role of snow water in the growth and development of ephemeral plants in a cold desert. J. Veg. Sci. 2014, 25, 681–690. [Google Scholar] [CrossRef]
  42. Tiemuerbieke, B.; Min, X.J.; Zang, Y.X.; Xing, P.; Ma, J.Y.; Sun, W. Water use patterns of co-occurring C3, and C4, shrubs in the Gurbantonggut desert in northwestern China. Sci. Total Environ. 2018, 634, 341–354. [Google Scholar] [CrossRef]
  43. Zhao, R.; Hui, R.; Liu, L.; Xie, M.; An, L.Z. Effects of snowfall depth on soil physical–chemical properties and soil microbial biomass in moss–dominated crusts in the Gurbantunggut Desert, Northern China. Catena 2018, 169, 175–182. [Google Scholar] [CrossRef]
  44. Zhou, X.B.; Zhang, Y.M.; Yin, B.F. Divergence in physiological responses between cyanobacterial and lichen crusts to a gradient of simulated nitrogen deposition. Plant Soil 2016, 399, 121–134. [Google Scholar] [CrossRef]
  45. Decagon Devices, Inc. Dielectric Leaf Wetness Sensor Operator’s Manual Version 3; Decagon Devices, Inc.: Pullman, WA, USA, 2007–2010. [Google Scholar]
  46. Kidron, G.J. The effect of substrate properties, size, position, sheltering and shading on dew: An experimental approach in the Negev Desert. Atmos. Res. 2010, 98, 378–386. [Google Scholar] [CrossRef]
  47. Lawrence, M.G. The relationship between relative humidity and the dewpoint temperature in moist air. Am. Meteorol. Soc. 2005, 86, 225–233. [Google Scholar] [CrossRef]
  48. Alduchov, O.A.; Eskridge, R.E. Improved Magnus form approximation of saturation vapor pressure. J. Appl. Meteorol. 1996, 35, 601–609. [Google Scholar] [CrossRef]
  49. Beysens, D.; Muselli, M.; Nikolayev, V.; Narhe, R.; Milimouk, I. Measurement and modelling of dew in island, coastal and alpine areas. Atmos. Res. 2005, 73, 1–22. [Google Scholar] [CrossRef]
  50. Jacobs, A.F.G.; Heusinkveld, B.G.; Kruit, R.J.W.; Berkowicz, S.M. Contribution of dew to the water budget of a grassland area in the Netherlands. Water Resour. Res. 2006, 42, 446–455. [Google Scholar] [CrossRef]
  51. Hanisch, S.; Lohrey, C.; Buerkert, A. Dewfall and its ecological significance in semi-arid coastal south-western Madagascar. J. Arid Environ. 2015, 121, 24–31. [Google Scholar] [CrossRef]
  52. Kappen, L.; Lange, O.L.; Schulze, E.D.; Evenari, M.; Buschbom, V. Ecophysiological investigations on lichens of the Negev Desert: IV. Annual course of the photosynthetic production of Ramalina maciformis (Del.) Bory. Flora 1979, 168, 85–105. [Google Scholar] [CrossRef]
  53. Long, Y.; Tan, D.Y.; Baskin, C.C.; Baskin, J.M. Seed dormancy and germination characteristics of Astragalus arpilobus (Fabaceae, subfamily Papilionoideae), a central Asian desert annual ephemeral. S. Afr. J. Bot. 2012, 83, 68–77. [Google Scholar] [CrossRef]
  54. Zhou, Y.M.; Lu, J.J.; Tan, D.Y.; Baskin, C.C.; Baskin, J.M. Seed germination ecology of the cold desert annual Isatis violascens (Brassicaceae): Two levels of physiological dormancy and role of the Pericarp. PLoS ONE 2015, 10, e0140983. [Google Scholar] [CrossRef]
  55. Chen, Y.; Zhang, L.; Shi, X.; Ban, Y.; Liu, H.; Zhang, D. Life history responses of spring-and autumn-germinated ephemeral plants to increased nitrogen and precipitation in the Gurbantunggut Desert. Sci. Total Environ. 2019, 659, 756–763. [Google Scholar] [CrossRef]
  56. Lu, J.J.; Tan, D.Y.; Baskin, C.C.; Baskin, J.M. Effects of germination season on life history traits and on transgenerational plasticity in seed dormancy in a cold desert annual. Sci. Rep. 2016, 6, 25076. [Google Scholar] [CrossRef]
  57. Clus, O.; Ortega, P.; Muselli, M.; Milimouk, I.; Beysens, D. Study of dew water collection in humid tropical islands. J. Hydrol. 2008, 361, 159–171. [Google Scholar] [CrossRef]
  58. Maestre-Valero, J.; Martinez-Alvarez, V.; Baille, A.; Martín-Górriz, B.; Gallego-Elvira, B. Comparative analysis of two polyethylene foil materials for dewharvesting in a semi-arid climate. J. Hydrol. 2011, 410, 84–91. [Google Scholar] [CrossRef]
  59. Sharan, G.; Beysens, D.; Milimouk-Melnytchouk, I. A study of dew water yields on Galvanized iron roofs in Kothara (North-West India). J. Arid Environ. 2007, 69, 259–269. [Google Scholar] [CrossRef]
  60. Monteith, J.L. Dew. Q. J. R. Meteorol. Soc. 1957, 83, 322–341. [Google Scholar] [CrossRef]
  61. Berger, X.; Bathiebo, J. Clear sky radiation as a function of altitude. Int. J. Renew. Energy 1992, 2, 139–157. [Google Scholar] [CrossRef]
  62. Hao, X.M.; Li, C.; Guo, B.; Ma, J.X.; Ayup, M.; Chen, Z.S. Dew formation and its long-term trend in a desert riparian forest ecosystem on the eastern edge of the Taklimakan Desert in China. J. Hydrol. 2012, 472–473, 90–98. [Google Scholar] [CrossRef]
  63. Garratt, J.R.; Segal, M. On the contribution to dew formation. Bound.-Layer Meteorol. 1988, 45, 209–236. [Google Scholar] [CrossRef]
  64. Xiao, H.; Meissner, R.; Borg, H.; Wang, R.; Cao, Q. Agreement of Four Equations for Computing Dewfall in Northern Germany. Water 2017, 9, 607. [Google Scholar] [CrossRef]
  65. Jacobs, A.F.G.; Heusinkveld, B.G.; Berkowicz, S.M. Passive dew collection in a grassland area, The Netherlands. Atmos. Res. 2008, 87, 377–385. [Google Scholar] [CrossRef]
  66. Maestre-Valero, J.F.; Ragab, R.; Martínez-Alvarez, V.; Baille, A. Estimation of dew yield from radiative condensers by means of an energy balance model. J. Hydrol. 2012, 460–461, 103–109. [Google Scholar] [CrossRef]
  67. Wang, H.; Sanchez-Molina, A.S.; Li, M.; Díaz, F.R. Improving the Performance of Vegetable Leaf Wetness Duration Models in Greenhouses Using Decision Tree Learning. Water 2019, 11, 158. [Google Scholar] [CrossRef]
  68. Subramaniam, A.R.; Kesava Rao, A.V.R. Dew fall in sand dune areas of India. Int. J. Biometeorol. 1983, 27, 271–280. [Google Scholar] [CrossRef]
  69. Yan, B.X.; Deng, W. Study on the dew resource in Sanjiang Plain. J. Nat. Resour. 2004, 19, 732–737. (In Chinese) [Google Scholar]
Figure 1. Location of the experimental site: Paotai Soil Improvement Test Station.
Water 11 00733 g001
Figure 2. Calibration curve of leaf wetness sensor (LWS) for measuring dew yield.
Water 11 00733 g002
Figure 3. Experimental setup. Instruments include: (a) LWS; (b) Davis Cup Anemometer; (c) Rain gauge (ECRN-100); (d) Air relative humidity and temperature sensor (VP-3); (e) Soil temperature and moisture sensor (GS3); (f) Data logger (EM50) inside the security box.
Water 11 00733 g003
Figure 4. Typical daily variations of cumulative dew yield and dew intensity (the time of sunset and sunrise are marked by red arrows).
Water 11 00733 g004
Figure 5. Variations of dew yields: (a) daily dew yields in 1 August 2015 to 1 December 2016; (b) daily dew yields in 1 March 2017 to 1 December 2018; (c) distribution of daily dewfall; (d) monthly dew yields and dew days.
Water 11 00733 g005aWater 11 00733 g005b
Figure 6. Distribution of daily rainfall (a) and daily duration (b) in the entire observation period.
Water 11 00733 g006
Figure 7. Comparison of the number of dew days and rain days in the entire observation period.
Water 11 00733 g007
Figure 8. Monthly amount of dew versus rain in the entire observation period.
Water 11 00733 g008
Figure 9. Relationships between the daily dew yield and main parameters: (a) wind speed at 10 m above the ground, V; (b) relative humidity, RH; (c) air temperature, Ta; (d) surface soil temperature, Ts; (e) surface soil moisture, Ws; (f) cloud cover, N; (g) dewpoint temperature, Td; (h) the difference between air temperature and dewpoint temperature, Tad; and (i) the difference between soil temperature at 10 cm below the ground and surface soil temperature, Tss.
Water 11 00733 g009
Figure 10. Normal P–P plot of regression standardized residual (a) and model validation plot (b).
Water 11 00733 g010
Table 1. Multivariate regression analysis between daily dew yield and main significance factors.
ModelVariableUnstandardized CoefficientsSignificanceToleranceR SquareF Value
BStd. Error
1Constant−0.6640.0490.000 0.512243.182
RH0.00960.0010.0001.000
2Constant−0.7290.0480.000 0.598158.228
RH0.0110.0010.0000.713
N−0.0070.0030.0010.713
3Constant−0.7050.0510.000 0.64282.987
RH0.0110.0010.0000.704
N−0.0060.0030.0010.703
V−0.0100.0050.0080.943

