Review

Recommendations for Improving Integration in National End-to-End Flood Forecasting Systems: An Overview of the FFIR (Flooding From Intense Rainfall) Programme

1
Department of Meteorology, University of Reading, Reading RG6 6BB, UK
2
School of Environmental Sciences, University of Hull, Hull HU6 7RX, UK
3
Met Office@Reading, University of Reading, Reading RG6 6BB, UK
4
School of Engineering, Newcastle University, Newcastle Upon Tyne NE1 7RU, UK
5
Centre for Water Systems, University of Exeter, Exeter EX4 4QF, UK
6
Department of Geography and Environmental Science, University of Reading, Reading RG6 6AB, UK
7
School of Geography Politics and Sociology, Newcastle University, Newcastle Upon Tyne NE1 7RU, UK
8
School of Geographical Sciences, University of Bristol, Bristol BS8 1RL, UK
*
Author to whom correspondence should be addressed.
Current address: LMD/IPSL, Département de Géosciences, ENS, PSL Research University, Ecole Polytechnique, Université Paris Saclay, Sorbonne Universités, UPMC Univ Paris 06, CNRS, Paris, France.
Current address: Hull City Council, Hull HU1 2AA, UK.
§
Current address: Météo France/CNRS, CNRM-GAME URA 1357, CEN, 38400 St. Martin d’Hères, France.
Current address: School of Architecture, Building and Civil Engineering, Loughborough University, Loughborough LE11 3TU, UK.
Current address: College of Engineering, Mathematical and Physical Sciences, University of Exeter, Exeter EX4 4QF, UK.
**
Current address: Fathom, Engine Shed, Station Approach, Bristol BS1 6QH, UK.
Water 2019, 11(4), 725; https://doi.org/10.3390/w11040725
Submission received: 13 March 2019 / Revised: 29 March 2019 / Accepted: 2 April 2019 / Published: 8 April 2019
(This article belongs to the Special Issue Flash Floods in Urban Areas)

Abstract

:
Recent surface-water and flash floods have caused millions of pounds worth of damage in the UK. These events form rapidly and are difficult to predict due to their short-lived and localised nature. The interdisciplinary Flooding From Intense Rainfall (FFIR) programme investigated the feasibility of enhancing the integration of an end-to-end forecasting system for flash and surface-water floods to help increase the lead time for warnings for these events. Here we propose developments to the integration of an operational end-to-end forecasting system based on the findings of the FFIR programme. The suggested developments include methods to improve radar-derived rainfall rates and understanding of the uncertainty in the position of intense rainfall in weather forecasts; the addition of hydraulic modelling components; and novel education techniques to help lead to effective dissemination of flood warnings. We make recommendations for future advances such as research into the propagation of uncertainty throughout the forecast chain. We further propose the creation of closer bonds to the end users to allow for an improved, integrated, end-to-end forecasting system that is easily accessible for users and end users alike, and will ultimately help mitigate the impacts of flooding from intense rainfall by informed and timely action.

Graphical Abstract

1. Introduction

Flooding is one of the leading global natural hazards and can result in loss of life and devastation (e.g., [1]). In 2007, the UK experienced some of its worst summer flooding leading to “the largest peacetime emergency since World War II” [2]. Much of this flooding was due to large-scale storms; however, flash and surface-water flooding also occurred. That summer’s events caused an estimated £4 billion (8 billion USD) in damages [3].
In the aftermath of the 2007 floods the Pitt Review [2] was commissioned to examine the events that led to the flooding. The review considered many different perspectives of the flooding, e.g., forecasting, defence and response. The Pitt Review was set up with the premise of improving the services and warnings for those communities directly involved with the flooding, from the first responders to the flood victims. The review made 92 recommendations on improving all areas including flood forecasting, response and preparedness actions that local government and citizens can take. One of the key recommendation themes to come out of the review was the need for co-operation of meteorological and hydrological agencies in both research and practice.
The Flooding From Intense Rainfall (FFIR) (throughout this article the acronym is only used as a direct reference to the project and not to the phenomenon) programme arose (in part) out of that key recommendation. The FFIR programme is a partnership between university researchers and the UK Met Office, with the universities being funded by the Natural Environment Research Council (NERC), and ran from 2013 to 2019. The programme consists of multiple researchers across a number of universities and disciplines. The researchers and Met Office worked closely with the UK Environment Agency (EA), Scottish Environmental Protection Agency (SEPA), Natural Resources Wales (NRW), Flood Forecasting Centre (FFC), Scottish Flood Forecasting Service (SFFS), Health and Safety Laboratory, Centre for Ecology and Hydrology, British Geological Survey, JBA consulting, Jacobs, Public Health England and European Centre for Medium Range Weather Forecasting (ECMWF). The programme has also had strong advice and direction from international agencies including Météo France, Deutscher Wetterdienst (DWD, Germany), Norwegian Meteorological Institute, European Commission Joint Research Centre (JRC), High resolution limited area modelling consortium (HIRLAM), Swedish Meteorological and Hydrological Institute (SMHI), Centre de Recerca Aplicada en Hidrometeorologia (Spain), and Rijkswaterstaat (Netherlands).
The FFIR programme considered end-to-end flood forecasting to further our understanding of these types of events and how to predict and manage them. An end-to-end flood forecasting system is one in which forecasts of different components of the earth system are linked, e.g., hydrological and meteorological forecasts for flood forecasting (see Hill et al. [4] Chapter 8). The FFIR programme considered end-to-end forecasting as each stage in the forecast chain from observations through to the flood warnings and impacts (Section 3.2). The resulting actions to the warnings and the groups responsible for those actions are not considered within the scope of the FFIR programme. The FFIR programme’s view is but one of many views of what an end-to-end forecasting system is. The FFIR programme also aims to produce tools that assist the education of the public about flooding from intense rainfall, from looking at susceptibility of catchments in the past to helping identify the risk of susceptibility to floods in real-time, thus enhancing the end-to-end forecasting chain.
End-to-end forecasting has been around for some time and many meteorological or hydrological centres have some form of operational end-to-end flood forecast (e.g., [5,6]). The more sophisticated end-to-end forecasts go further down the chain, i.e., they include hydraulic components either through a look-up library of static flood maps (e.g., [7,8]) or by running hydraulic models (e.g., [4,9]). Thus the FFIR programme develops the end-to-end forecasts by improving stages in the forecasting chain and the overall integration of such systems, with a specific focus on small-scale intense rainfall events that lead to flooding in high-resolution models.
The FFIR programme consists of three components. It first considers the meteorological (Forecasting Rainfall exploiting new data Assimilation and Novel observations of Convection: FRANC) and hydrological aspects (Susceptibility of catchments to INTense RAinfall and flooding: SINATRA) separately before combining the results (Towards END-to End flood forecasting and a tool for ReaL-time catchment susceptibilitY: TENDERLY) and considering how the improvements in FRANC and SINATRA feed into the end-to-end forecasting chain. In this manuscript we make recommendations for improving the integration of an end-to-end flood forecasting system based on the work completed during the FFIR programme. The works that are direct outputs from the FFIR programme are marked with an asterisk (*) to distinguish them from other referenced work. We begin by defining flooding from intense rainfall (Section 2). We then discuss the UK operational end-to-end flood forecasting system prior to FFIR, which is more focused on large-scale and coastal flooding (Section 3.1). The system proposed for flooding from intense rainfall is broadly discussed in Section 3.2. We then consider if it is possible to have any large-scale indications of when the full high resolution (i.e., including hydraulic components) end-to-end forecasting system should be used several days in advance in Section 4. The improvements from the FFIR programme are considered in the following two sections with improvements from radar observations, and data assimilation through to the weather forecasts being considered in Section 5 and downstream applications such as catchment susceptibility, hydraulic modelling, model connectivity (to allow for improved integration), and public engagement in Section 6. The key recommendations from the FFIR programme are discussed in Section 7 before a summary is made in Section 8.

2. Definition and Examples of Flooding From Intense Rainfall

We define flooding from intense rainfall as flooding caused by a short-duration extreme rainfall event. The intense rain is produced from convective storms (e.g., thunderstorms), and often lasts a few hours at most. Therefore the criterion required for a flood to be classed as a flooding from intense rainfall event is that it is produced by convective rainfall. This definition is intentionally broad. We do not specify a duration or intensity to distinguish convective rainfall from other types of rainfall as the specification of such thresholds is largely arbitrary and can vary between case studies depending on the models used. Flooding from intense rainfall typically describes two key types of flooding: surface-water flooding and rapid-rate-of-rise river flooding. The amount of rainfall required to produce a flood will depend on the catchment area, soil or drainage permeability and the antecedent conditions. Table 1 provides examples of flooding from intense rainfall events in the UK, illustrating the variety of durations and rainfall totals that fall within the typical range for these type of events.
Flooding from intense rainfall events tend to happen more frequently in the summer (June, July and August; e.g., [14]) but can occur at any time of the year (e.g., [15])*. For more classifications and a historic record of flooding from intense rainfall events refer to [16]*. Due to the nature of flooding from intense rainfall events (being caused by convective storms which are short-lived and localised events) these floods are hard to predict from all aspects of the forecast (e.g., [17]). Therefore, an end-to-end forecasting system that takes into account the uncertainty would be a useful (and necessary) tool for end users of flood forecasts (see Section 7).

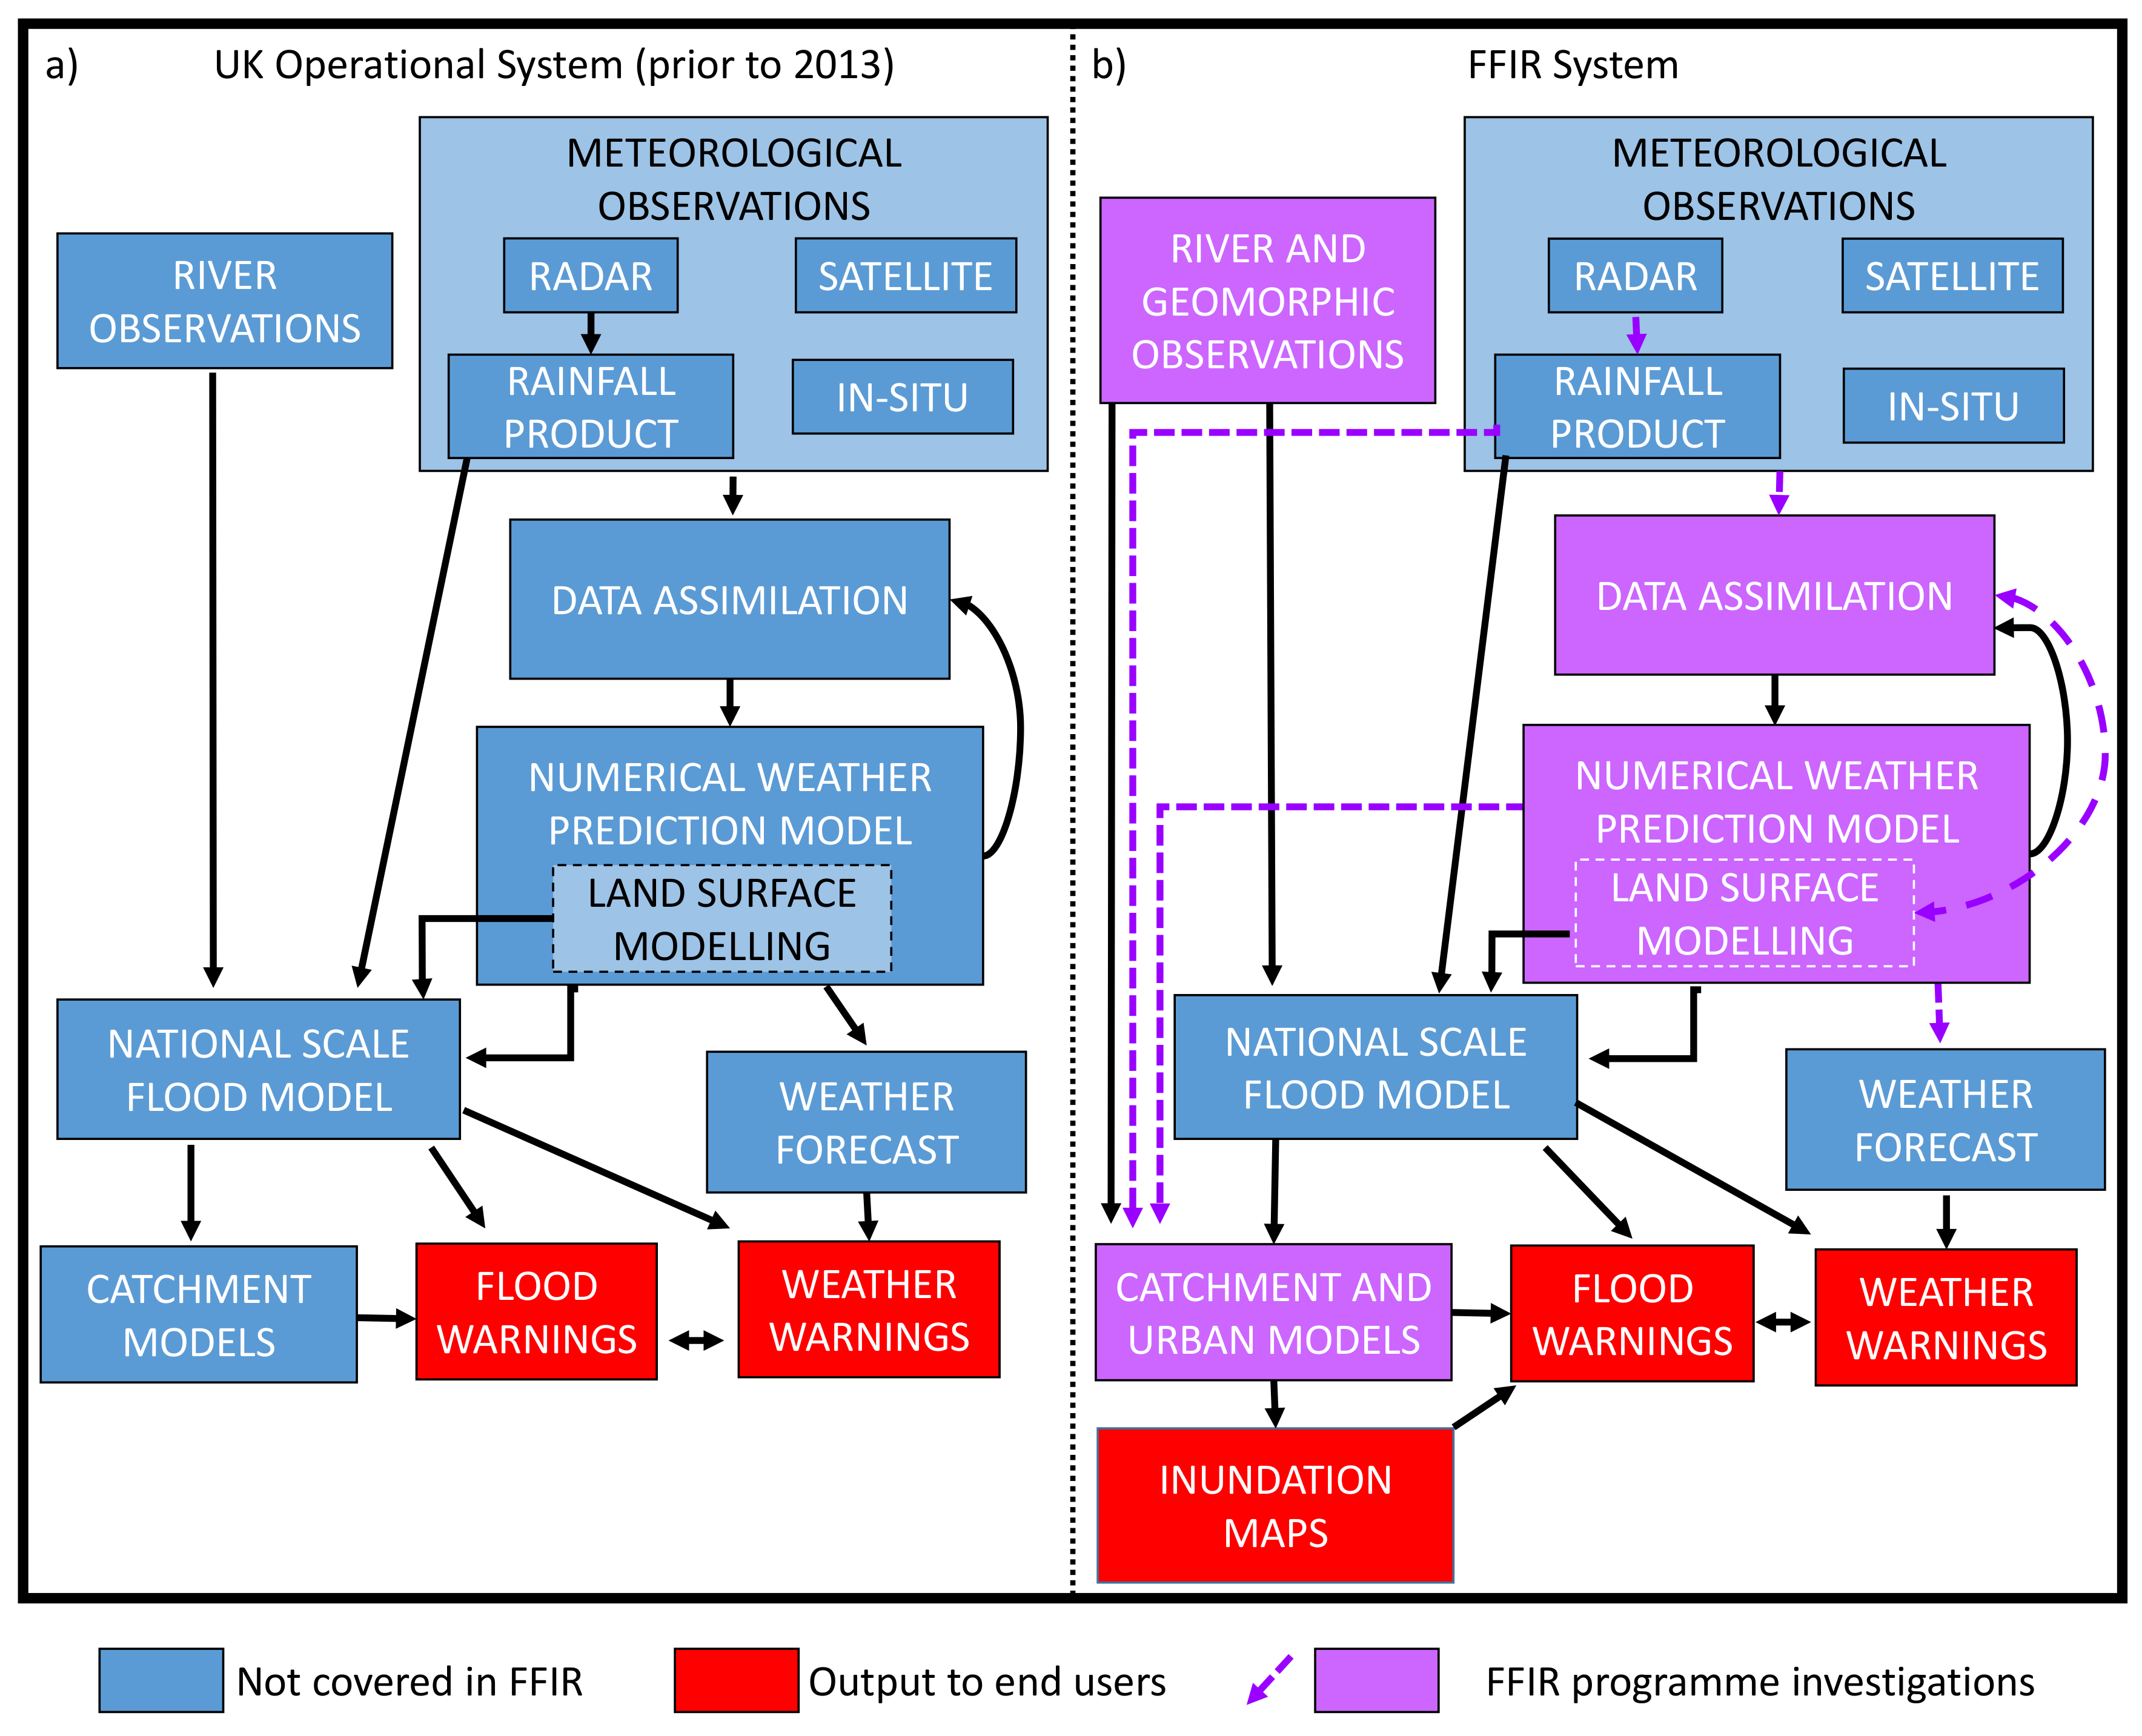
3. End-to-End Flood Forecasting in Practice and FFIR Programme End-to-End Flood Forecasting System

To be able to see improvements and how the recommendations produced by the FFIR programme fit into practice, we describe the UK operational system prior to the commencement of the FFIR programme (Section 3.1; Figure 1a) before discussing the FFIR end-to-end forecast (Section 3.2; Figure 1b). The UK operational system has been chosen due to the close ties of this work with the Met Office and the EA. However, the recommendations and implications of the work presented in this manuscript are widely applicable, and the UK system is broadly similar to other existing systems (e.g., the Swedish, French and Australian systems; [5,18,19], respectively).

3.1. Flood Forecasting in the UK Prior to FFIR

Recommendation six of the Pitt Review was the creation of a joint Met Office and EA (plus SEPA for Scotland) centre to advance flood forecasting capabilities [2]. These joint centres became known as the FFC and SFFS; they have formed the operational flood forecasting practice in the UK since their formation in 2009. Flood forecasting in the UK is continually being developed (e.g., [20,21]), thus the focus here remains on the operational system prior to the start of the FFIR programme in 2013. The discussion of the UK flood forecasting practice prior to the start of FFIR is because many aspects of the FFIR programme have become part of the current operational system, or aspects of FFIR were designed to run alongside with the proposed developments at the time. Recent updates to the operational flood forecasting practice for the FFC and SFFS can be found in [6,8], respectively.
When the FFC and SFFS were first setup the science of integrated flash flood forecasting (i.e., beyond the weather forecast) was just beginning to gain momentum. Thus the initial structure was developed to support fluvial and coastal flood forecasting. A schematic of the 2013 operational system is presented in Figure 1a. As with all weather forecasting, and end-to-end forecasting, we begin with the observations. The operational system uses both meteorological and hydrological observations (e.g., temperature, rainfall, pressure, wind, river levels) and also includes observations that are derived from radar and satellites. The meteorological observations are then combined with the previous output from the Numerical Weather Prediction (NWP) model using sophisticated mathematical algorithms to find the best starting conditions for the next forecast, in a process known as data assimilation. A review of operational variational schemes are presented in [22]. Using the initial conditions derived from data assimilation the NWP model is then used to create a weather forecast. For the Met Office the NWP model used is the Met Office Unified Model (MetUM; [23,24,25,26]). The MetUM is used either in deterministic mode (where a single forecast is run) or in ensemble mode (where multiple forecasts, with subtle changes to them, are run for the same event, [27]). This produces the weather forecast (for which severe weather warnings for rain, wind, temperature, etc. are derived) and also the input for the hydrological model (the Grid-to-Grid model; [28,29]) where either the single deterministic forecast is used as input or all members of the ensemble are used as input. The Grid-to-Grid model simulates the surface runoff and river flow in the UK and helps to determine where there is increased flood risk. Should the Grid-to-Grid model indicate a flood risk, a catchment model is then run using data from the rainfall forecast and radar. This flood risk is then communicated through the daily Flood Guidance Statement (issued by the FFC and SFFS); National Severe Weather Warnings (issued by the Met Office in conjunction with the FFC/SFFS for heavy rainfall); flood alerts and flood warnings (issued by the EA/SEPA).

3.2. Improvements from the FFIR Proposed System

The FFIR proposed end-to-end forecasting system (Figure 1b) is superficially similar to that of the current operational system (Figure 1a). This similarity arises in part due to the first stages of the forecasting chain being a tried and tested method [6] and thus a strong starting point for such a system. The additions, apart from the added capability of being able to produce warnings for flooding from intense rainfall, of the FFIR system to the operational system described (Section 3.1) are set out below
  • improved quality of radar-derived rainfall.
  • Greater usage, and more, river and geomorphic observations used within the models.
  • More data being applied within the data assimilation system,
  • better ways of treating the data used with the assimilation process including better treatment of correlated data.
  • Improved representation of convection in kilometre-scale NWP models.
  • Improved understanding of variability within kilometre-scale NWP models leading to more appropriate warnings.
  • Improved infiltration rates for land surface modelling, leading to better links to the runoff for hydrological models,
  • data assimilation of soil moisture in the model,
  • more observations and data being fed into the national-scale flood models and catchment models,
  • use of urban models for modelled inundation maps.
Many aspects of the FFIR proposed system have become operational in their own right (e.g., radar improvements, Section 5.1) and these are indicated throughout the following sections. Other aspects such as the data assimilation of soil moisture and links between land surface modelling and hydrology, although researched within the programme (e.g., [30,31])*, are not covered within this article due to the results not directly considering flooding from intense rainfall. This was because the models/data used were not able to represent the small scales at which flooding from intense rainfall occurs.

4. Improving the Lead Time for Flooding From Intense Rainfall Forecasts

One of the challenges of forecasting flooding from intense rainfall is the short lead time between identifying a convective feature in the NWP model that could lead to flooding, and the flooding occurring. Being able to identify weather systems further in advance that have the potential to result in flooding from intense rainfall would enable increased preparedness. This could be achieved through raising the awareness of a potential event to flood forecasters in advance, increasing the number of staff on operational duty, or running the more computationally demanding urban flood models. Therefore the FFIR programme looked for indications of whether flooding from intense rainfall was likely to occur days in advance.
The main drivers of winter rainfall are extra-tropical cyclones (e.g., [32]) and UK winter flooding has been linked with Atmospheric Rivers, bands of intense moisture transport within the warm sector of these cyclones (e.g., [33]). However, the most intense summer rainfall events based on an assessment of daily rain gauges are not found to be associated with these larger-scale atmospheric features [34]*. Therefore, different drivers such as moisture convergence [35] and stability [36] are more likely to have an influence on the large-scale weather conditions leading to flooding from intense rainfall.
Investigations within the FFIR programme looked at the atmospheric conditions that would lead to a potentially unstable atmosphere, thus increasing the chances of convective processes being triggered. The focus was on large-scale processes that could be identified days in advance rather than the small-scale processes that can only be identified a few hours in advance.
The results of the study, which uses the quality controlled rain gauge observations from [15], are discussed in detail in [37]*. The results showed that the processes that lead to extreme rainfall events depend on the location of the event. Over the North-West of England orographic effects were more important, and the rainfall events could be associated with the presence of a high in the geopotential height at 200 hPa over the UK and Western Europe. This “high” was seen up to five days prior to the rain event. However, for the South-East of England the presence of locally high moisture anomalies were required and no large-scale precursor was found.
Despite the lack of indicators five days in advance (on large scales) for some forms of flooding from intense rainfall, there may be some indication of convection present in forecasts up to 48 h in advance. If this indication is present then it may still be worth running a high-resolution end-to-end forecast (i.e., with hydraulic component) as an early indicator, as opposed to fully relying upon it with 6–12 h notice.

5. Improvements and Lessons for Weather Forecasting Capabilities in an End-to-End System

The initial stage of the end-to-end forecast focuses on the meteorological component of flood forecasting. First the observations of the rainfall are considered through the use of weather radars and improvements to the UK radar network (Section 5.1). Secondly the process by which the observations are optimally combined with a previous forecast (i.e., data assimilation) is considered (Section 5.2). This data assimilation process will produce the best initial starting point for the weather forecast. Finally, the uncertainty of the weather that leads to flooding from intense rainfall is considered; this is achieved via predictability experiments to show how different the forecasts of rainfall could be (Section 5.3).

5.1. Improved Rainfall Estimates from Radar

At the start of the end-to-end forecasting chain (Figure 1b) are the meteorological observations. Traditionally, rainfall at the surface has been measured using rain gauges, however, these only provide point coverage. This limitation of an operational rain gauge network is shown in Figure 2 where a significant flood event (Coverack Flood: 18 July 2017) was missed with the operational rain gauge network. The spatial coverage needed to capture extreme rainfall events would require a rain gauge network with very high spatial density; instead we turn to weather radars to detect and measure rainfall with large spatial coverage as satellite-derived rainfall observations have limited coverage within this region.
The UK weather radar network has recently undergone a major upgrade, now having 16 radars (15 operational and a testing and research radar), all dual-polarisation, Doppler capable operating at C-band (wavelength of 5.6 cm) with a 1 beamwidth. This provides coverage of rainfall estimation for 99% of the UK population, most of this area with 1 km spatial resolution (Although the raw data is available at a resolution of 75 m for much of the UK) and 5 min temporal resolution. The upgraded radars have the addition of dual-polarisation, i.e., they can transmit and receive vertically and horizontally polarised microwaves. This ability gives a number of new radar parameters over just reflectivity, and provides new data to improve the quality and accuracy of the surface-rainfall estimates (e.g., [38]).
The FFIR programme has included a number of developments for the radar network, aimed to improve the rainfall estimates from heavy rain. These developments include
  • The correction and improved quality of the radar-derived rainfall rates to account for non-meteorological effects (e.g., insects, birds, trees, buildings) on the signal [39]*.
  • Using the radar as a radiometer for attenuation estimation, to correct in heavy rainfalls, but also monitor the radome as first described in [40].
  • Using newly available polarisation parameters to improve the conversion from radar reflectivity to rainfall rate [39]*.
  • Improved radar scanning strategy to allow for radar refractivity measurements to be taken and hence allow measurements of boundary-layer moisture from the radar [41]*.
  • Better accounting for variations in the raindrop size distributions [39]*.
These corrections have been implemented operationally between 2014–2018 by the Met Office to improve national-gridded estimates of rainfall from radar [39]*. The improved estimates are then used later in the forecasting chain and more directly by users from first responders to the public.

5.2. Improving the Initial Conditions for Weather Forecasts

To initialise a forecast, observations are combined with previous model predictions, taking account of their relative errors, using sophisticated mathematical algorithms known as data assimilation. To provide accurate forecasts of the meteorological conditions that can lead to flooding from intense rainfall it is necessary to assimilate observations that provide us with information about the factors that lead to the formation of rainfall events, where and how fast rainfall events are moving, and also their depth and spatial coverage.
Work in the FFIR programme has considered how to include novel observations in the data assimilation schemes. For example, the Met Office are developing and testing an improved technique for the assimilation of radar reflectivity observations directly into the NWP model [41,42]* rather than through the latent heat nudging method [43] used currently.
The research has also shown that it is possible to use more of the existing observations, through improved uncertainty quantification, to improve the data assimilation output. Methods for estimating observation error uncertainties have been theoretically evaluated [44,45,46]*. These methods have then been applied to estimate observation uncertainties for Doppler radar radial winds, satellite radiances and atmospheric motion vectors [47,48,49]*. Using these new uncertainty estimates allows observations to be assimilated at increased spatial density which allows us to capture small-scale features such as those which can cause flooding from intense rainfall [50,51]*. This gives greater chance of convective initiation to occur in an NWP model.

5.3. Variability within Weather Forecasts

With improved representation of the data used to initialise the forecast and higher-resolution forecasts, weather forecasts are significantly improving [52,53]. However, in modelling the atmosphere at higher resolutions any errors in the forecast grow rapidly (e.g., [54,55]). To help determine the uncertainty in the forecasts we consider an ensemble of weather forecasts, which should all be equally likely to occur (e.g., [56]). These are created by changing the initial and boundary conditions and including some form of representation of model uncertainty. These changes are associated with our understanding of the physical atmosphere and the uncertainty in the observations. However, ensembles only become useful if there is an understanding of the uncertainty of the events being forecast.
Throughout the FFIR programme the forecasts of convective storms have been examined in kilometre-scale ensembles. The location of the intense rainfall event varies in each ensemble member. Some events show more locational predictability, with the storms occurring in a similar position in the different ensemble members. On the other hand some events show less locational predictability with storms occurring in very different places between the different ensemble members [57]*. For 85% of the cases examined the meteorological conditions are close to convective quasi-equilibrium which means that there is more likely to be relatively large uncertainty in the position of the rainfall events (e.g., [57,58])*. This locational uncertainty has impacts for identifying areas most at risk as the potential area at risk could cover large urban areas, with one area being more susceptible than another area, or multiple catchments. This result impacts the interpretation of the rainfall forecast and the other forecasts further down the end-to-end chain. The impact is noticed as uncertainty in the precipitation feeds into the uncertainty in surface runoff and hence onto the inundation extent. Table 2 indicates the uncertainty associated with precipitation and subsequent runoff based on an area over Cornwall (depicted in Figure 2) for the Coverack flood by considering the rainfall accumulation and runoff between 1300 and 1500 UTC generated by the MetUM. The larger runoff values compared to the rainfall reflects the runoff occurring from an accumulation of rain in surrounding grid points, as opposed to at a single point like in the rainfall. This range in precipitation and runoff not only helps to motivate the need for considering ensembles for an end-to-end forecast but it also shows that there is large uncertainty (particularly when comparing the maximum and minimum with the mean) which is being fed into the models further down the end-to-end chain.

6. Downstream Applications in the End-to-End Forecast

Up until now the improvements indicated in this article have either been implemented in the current operational system, or will equally apply to the current and proposed systems. The next stage in the end-to-end forecast is to use the meteorological forecasts described in the previous section to determine the risk of flash flooding within catchments and urban areas. Catchments susceptible to flash flooding can be determined using statistical indicators, especially catchment slopes, we discuss these indicators in Section 6.1. The catchments and urban areas susceptible to flooding can be handled in more detail using hydrological and hydraulic modelling to determine the locations most at risk (Section 6.2). Finally, for the end-to-end forecast to be successful it must be communicated in a way which is useful to agencies responsible for mitigating flood risk, and also to the general public. The FFIR programme’s activities for public engagement to improve this communication are discussed in Section 6.3. These improvements are in areas that go beyond the current operational flood forecasting system.

6.1. Susceptibility Indicators in Landscapes

There have been a number of studies that have explored the link between the morphological characteristics and the flood response of catchments. For example, the UK Flood Estimation Handbook (FEH) rainfall-runoff method, widely used by practitioners to estimate flood risk, relates a catchment’s rainfall response to its attributes including channel length and slope, derived from a statistical analysis. While such approaches can provide insight into morphological controls on hydrological response, there are limitations in applying such statistical analyses to rare flash flood events [61]. Analyses of historical extreme flow events in Europe have, however, identified catchment steepness as a key characteristic, causing the rapid concentration of flows, and through the orographic enhancement of rainfall and the anchoring of convective events [62].
Collier and Fox [61] developed a simple scoring technique to assess the vulnerability of a catchment to flooding from extreme rainfall. The additive scoring system considered static morphological variables relating to slope, land use and soil type, and dynamic variables relating to soil moisture as well as storm characteristics. One of the shortcomings of this method is that each variable is given equal weighting, but some variables have a greater influence in the formation of flash floods [63]. However, this approach does provide a useful screening tool for catchment susceptibility, and we have been developing a metric that does not prescribe equal weighting for each variable, but a weighting that depends upon the river catchment itself, to provide a tailored metric for catchment susceptibility for intense rainfall.

6.2. Improving Representation of Connectivity in Landscape Models

To identify the locations that are at risk of flooding from intense rainfall, hydraulic modelling is necessary to analyse how flood water propagates within a catchment. Rainfall observations (from radar and rain gauges), NWP model data, and runoff estimations from upstream catchments (via hydrological modelling or observations) are utilised to drive hydraulic simulations. Topography, urban drainage networks and flood defences are all reflected in a hydraulic model set up to properly describe the influences of these key factors (e.g., [64,65])*. These factors are all demonstrated in the representation of the flooding extent from the Coverack 2017 flood (Figure 3). The data used to model the Coverack flood was radar observations, the model (urban inundation model (UIM); [66]) was ran (offline) after the event.
The use of flood inundation maps, such as (Figure 3), is a particularly useful component of the end-to-end forecast. Figure 3 not only shows that the village would be cut-off from other areas, but also the houses most at risk of flooding and the areas that would need evacuation and most help from the first responders. This vital information allows more informed decisions to be made.
Established procedure can only apply high resolution (<5 m) hydraulic modelling to small areas due to computational expense and run time. For example, a traditional hydraulic model such as a George’s finite volume model can take 595 min to run a 5 m grid length, 10 h-simulation for a catchment the size of Haltwhistle Burn (42 km 2 ; [67])*. However, in the FFIR programme HiPIMS, a hydraulic model which takes advantage of modern high-performance computing capabilities to solve the 2D shallow water equations [67]*, has been applied to the whole Eden Catchment with 5 m grid resolution to simulate the flood event caused by Storm Desmond in 2015. This simulation took 36 h for a 96 h event on a workstation with 6 graphic processing units. This aligns university research with state-of-the-art capabilities in industry thus allowing closer collaboration in the future to improve the use of hydraulic models in practice. With radar-derived rainfall or NWP as the only input and minimal calibration applied, the simulation results matched the observations closely in terms of both inundation areas and water levels at river channels. This study indicates that application of hydraulic models over a large area is a promising way to increase the accuracy and reduce the uncertainty of flood forecasting. It also demonstrates an expanding capability to be able to model multiple sub-catchments simultaneously that could be at risk of flooding from intense rainfall depending on where the rainfall occurs in a large catchment. It further indicates the possibility for use in large urban areas, whilst the case used shows its advantages for adding value to the current forecasting system through the accurate representation of large-scale flooding.
One important step towards integration in flood forecasting, and part of the proposed FFIR end-to-end system, is the link between hydrological and hydraulic models. Investigations with the FFIR programme has unidirectionally coupled the Dynamic TOPMODEL [68] and LISFLOOD-FP [69] hydrological and hydraulic codes to see if this is a feasible method for linking hydrology and hydraulic models. The unidirectional coupling is achieved by routing the time series of lateral inflows along the river network (computed by Dynamic TOPMODEL) through the 1D subgrid network of the hydraulic model (LISFLOOD). This unidirectional coupling is used to produce a flexible and computationally efficient coupled hydrological-hydrodynamic modelling framework. The coupling aims to meet the need for robust probabilistic flood predictions over catchment to national scales, and explicitly represents relevant physical processes throughout a region. The modelling approach is highly flexible in how the spatial-temporal rainfall-runoff processes are resolved, while being fully automated from freely available raw data sets (utilising a suite of novel approaches for flood inundation model construction and input specification) and maintaining computational efficiency essential for the provision of probabilistic predictions. Due to the flexibility of this code, it is one of many frameworks that could be used in the end-to-end forecast to improve integration. The use of this system would depend upon the computational facilities and resolution required so may not be suitable for all purposes. Coupling is a crucial step towards the idea of improving the integration in an end-to-end flood forecast system as it will enable the transition from hydrological to hydraulic modelling to become quicker and better able at handling uncertainties such as when a river channel’s capacity will be exceeded.

6.3. Public Engagement

The success of any end-to-end forecasting system relies on the effective communication of warnings, which leads to timely actions which in turn reduce the impacts on lives and property. This requires a flood literate public, who understand the risks and are prepared to engage with warnings and relevant agencies. The “Flash Flood!” applications [70]* were developed to allow FFIR scientists to interact with the public in festival-like settings. Figure 4 shows “Flash Flood!” in action at the Royal Society. The audiences at these events are usually school-aged children and the focus was to build a positive experience of flood forecasting and science in general. The application used data collected from the Thinhope Burn valley, which witnessed a geomorphically-active flooding from intense rainfall event in 2007 [71], to build a 3D environment within the Unity-3D gaming engine. The scene can be viewed via Virtual Reality (VR) and recreates the 2007 event and shows the user before and after scenes. Flash Flood! has been successfully demonstrated at national-level science festivals in the UK, such as the NERC Into the Blue and Unearthed science showcases which were attended by over 11,000 members of the public. As well as the VR festival version, desktop software (https://sourceforge.net/projects/flash-flood/files) and a YouTube version (https://www.youtube.com/watch?v=23JPhz631Mc) are freely available, and suggestions for use in school lessons can be found in [72]*. “Flash Flood!” has been particularly useful for engaging and enthusing the public with issues of flood risk, in particular around the flood risk when it may not be raining at your location (as with many flash floods), and future work will seek to formally assess the effectiveness of the activity for improving flood literacy amongst the public.

7. Limitations and Recommendations

The FFIR programme has considered the current state of end-to-end forecasting and how such a system might function operationally, and within the programme of research some key improvements have been made. However, there have not been improvements in all areas and the interdisciplinary work has indicated that there is still a way to go for integrated interdisciplinary research to be fully effective. This section provides an overview of the limitations of the programme (Section 7.1) and highlights some key areas and knowledge gaps as recommendations for future work (Section 7.2).

7.1. Limitations of the FFIR Programme

As with all research projects the FFIR programme has overcome many (but not all) obstacles. These challenges not only act to influence deliverables and goals of projects but also could indicate potential problems for the end-to-end forecasting chain. The limitations influencing the FFIR programme were
  • backward compatibility of models — this limited the availability of data from past events to use for case studies and hence a full demonstration of the system was not viable;
  • data consistency —much of the data had to be converted between different file formats for use in the different components of the chain which added complications and delays;
  • understanding of operational requirements — towards the end of the chain many of the models were run offline so were not subject to the strong constraints or rigorous validation put on operational systems. Whilst this is viable for individual research areas, when combining could lead to compatibility problems due to updates in the operational system.
However, despite these limitations (which should be continued to be worked on) valuable future areas of research have been identified to help improve the integration of end-to-end forecasts further.

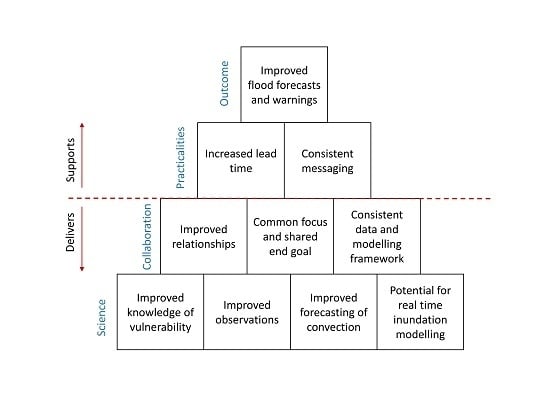
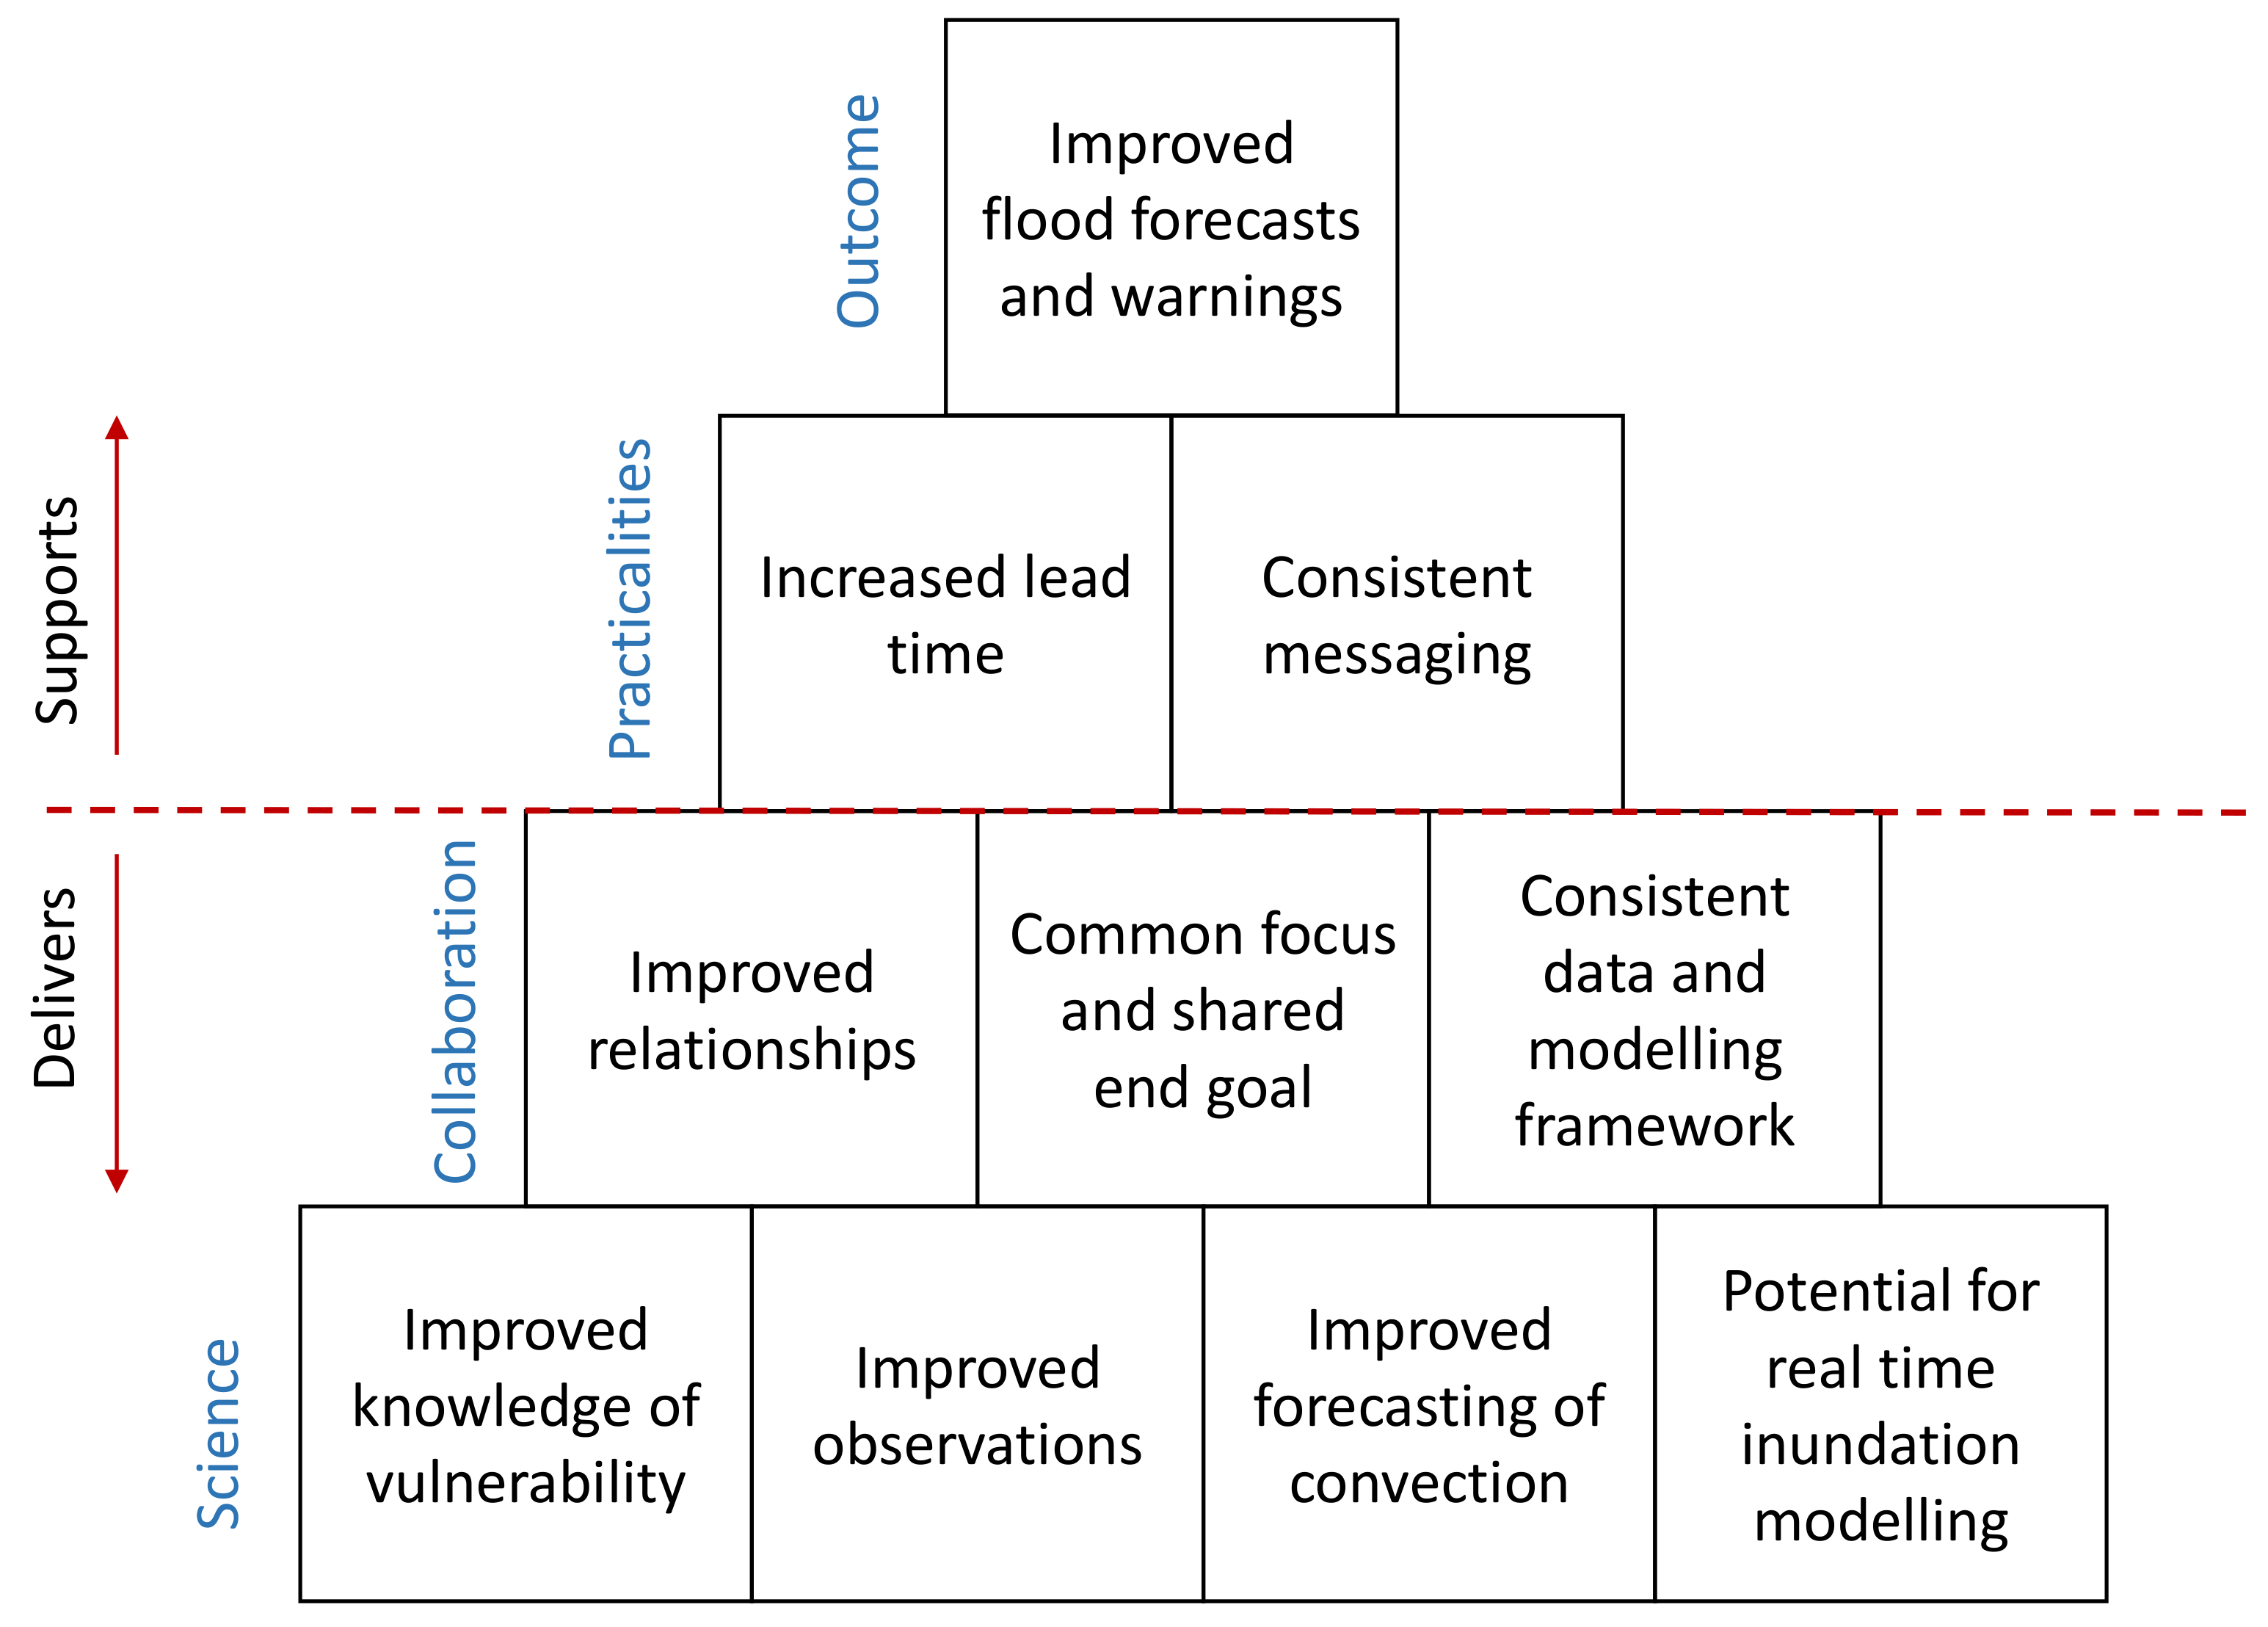
7.2. Recommendations

Within the three following subsections, we focus on the key recommendations from the programme: more research into the propagation of uncertainty through the end-to-end chain (Section 7.2.1); improved integration with the end users (Section 7.2.2); and a real-time demonstration of the FFIR system (Section 7.2.3).

7.2.1. Propagation of Uncertainty

Many of the components, particularly data assimilation and NWP use an element of ensemble forecasting to help express uncertainty in their respective systems. The use of ensembles is also useful for generating probabilistic forecasts [56]. However, the question of how best to deal with an ensemble in an end-to-end forecast poses many challenges. Namely, which aspects of uncertainty to focus on. Generally, if one aspect of uncertainty is considered in one forecast, the output from that forecast will need to be considered in the next stage of the chain. This consideration of uncertainty throughout the forecasting chain then leads to the problem of rapidly escalating data volume and processing time. However, there may be sophisticated post-processing methods (such as a neighbourhood approach, some of which are discussed in [73]) that will enable a large ensemble without having the number of members escalate too quickly, and potentially reduce the data volume. Work within TENDERLY has examined whether this post-processing is possible for intense rainfall forecasts [60]*. However, whether this form of post-processing is feasible for non-meteorological forecasts and how the uncertainty propagates down the forecast chain remain important unanswered research questions. It may also lead to potential problems with communicating probabilistic forecasts to the end users, such as what the probabilities explicitly refer to. Probabilistic forecasts also lead to problems with verification and given the cross-component nature of this work a standard probabilistic diagnostic will need to be created that not only works for meteorological forecasts but also for hydrological and hydraulic forecasts as well.

7.2.2. Improved Integration of End Users

At the end of the forecast the most important part is the final dissemination of warnings and the responses of first responders and communities at risk. The value of flood warnings depends on the level of accuracy, lead time and clear messaging provided. A dissemination system needs to be flexible as the message, lead time and accuracy required by end users differs based on the user and as the flood event unfolds. Expert users of an end-to-end forecasting system need to be skilled in communicating model outputs in a way that supports decision making before, during and after an event. There is not a “one size fits all” solution and current work (within the FFIR programme) is examining the end user requirements of an end-to-end forecasting system. The flexibility of the system necessitates the need to interact and integrate end users into the processes to find out what they need and crucially what they understand to allow the message to become as clear as possible. However, more research is still required within this area to produce the most appropriate integration and forecast for all parties involved.

7.2.3. Real-time Demonstration of an End-to-End Forecasting System

The FFIR programme has demonstrated that an improved, and integrated, operational end-to-end system is scientifically feasible, but the true test of its feasibility will be to put it into action through a real-time demonstration. This demonstration could be in the form of an integrated case study (such as Coverack 18 July 2017) to demonstrate the potential as a first step. Then it could be extended through a multi-agency “exercise” of a past flood event, responding as in real-time, using the proposed end-to-end forecasting system—this would require the involvement of representatives of all potential end users to respond to the forecasts and communication thereof. The effectiveness of the end-to-system could then be evaluated against the response of the actual event, and any added value compared to the existing operational system quantified.

8. Summary

Flooding from intense rainfall is a short-lived, localised natural hazard that is hard to predict accurately and is the main focus of the joint NERC and Met Office FFIR programme. The technical contributions of the FFIR programme to improving end-to-end forecasting for intense rainfall as outline in this paper can be summarised under four themes: improved knowledge of vulnerability to flash flooding, improved observations during events, improved forecasting of convection (which includes the data assimilation improvements), and real time flood inundation modelling (Figure 5). Through consideration of how these components link together in an end-to-end framework, the programme has demonstrated the benefits of interdisciplinary collaboration and laid strong foundations for future integrated research. These achievements will support improvements in the logistics of delivering forecasts and warnings for flash flooding and will ultimately improve flood forecast and warnings (Figure 5). We conclude that the current state of the science is such that further integration is possible and a first attempt at an improved-integrated platform for flash flooding can be made for demonstration purposes. However, there are still improvements, required before all the new research components presented here can be used operationally. These improvements are not only linked to the recommendations mentioned within this manuscript but also the real-time running of hydraulic models on supercomputer platforms to ensure consistency with the NWP models (to allow for its use in an operational context), and testing and validation of the complete system for multiple cases across the country. Given these improvements required to make this system operational it is likely to be many years before the proposed FFIR end-to-end system becomes a fully operational reality.
We recommend that these improvements to the operational end-to-end forecasting system, particularly focused on intense rainfall, should be a policy priority. Such a system would unify all the components into a fully automated, rapidly updating framework, and this streamlined system would provide better information to improve decision making by end users. The present warning chain relies upon the manual transfer of information between agencies, and the automated end-to-end system would removed these potential points of failure. There are scientific and logistical barriers to such a system, and we have proposed a way forward in bringing each of the components together, including the following key recommendations
  • Research into the propagation of uncertainty through the end-to-end modelling chain.
  • Build closer relationships with and between users throughout the chain to better understand their requirements from an end-to-end system to inform their response to flood events.
  • Real-time demonstration of the end-to-end system through testing on detailed case studies of flooding from intense rainfall events.
Further advances could be made through the integration and pull-through of ideas presented in the FFIR programme, and this article, into current projects considering earth system forecasting such as UK Environmental Prediction (e.g., [74,75]) or impact modelling of hazards (e.g., [76]).
Through combined research across multiple disciplines the FFIR programme has not only helped provide ways to improve the forecasts and representation of flooding from intense rainfall it has also encouraged stronger links and greater understanding between all the communities interested in flooding from intense rainfall (i.e., researchers, practitioners, policy-makers, the general public) thus enhancing research, output and understanding for all involved.

Author Contributions

All of the authors contributed to the writing and editing of this manuscript. D.L.A.F. led the writing, co-led a writing workshop and meetings for the writing of this manuscript and research on convective-scale predictability. C.J.S. co-led the writing workshop and meetings and completed research on geomorphological uncertainties within flooding from intense rainfall and led the FlashFlood! VR applications. Both D.L.A.F. and C.J.S. made significant edits to the first draft leading to the final version. L.H-S., G.O., R.J.T. and J.A.W. all contributed to the writing workshop and early design meetings and researched on (Radar data assimilation, catchment susceptibility, radar improvements and uncertainty in data assimilation, respectively). A.S.C. and J.M. contributed to the writing workshop and conducted research into hydraulic modelling and palaeofloods respectively. C.L. and X.X. contributed to the writing meetings and researched on land surface modelling and hydraulic modelling, respectively. S.B. researched into rain gauge data, A.J.C. researched into precursors for flooding from intense rainfall, M.T.P. researched into river and geomorphological observations of floods, N.Q. researched into coupling between hydrological and hydraulic modelling. L.J.S. was the policy fellow for the programme and engaged with the end users.

Funding

This work was funded under the Flooding From Intense Rainfall programme under NERC and is funded by grants NE/K00896X/1 (SINATRA) and NE/K008900/1 (FRANC). D.L.A.F. acknowledges the use of the MONSooN system, a collaborative facility supplied under the Joint Weather and Climate Research Programme, which is a strategic partnership between the Met Office and NERC.

Acknowledgments

The authors would like to thank all the members of the FFIR programme not listed as authors (see blogs.reading.ac.uk/flooding/participants), whose input throughout the programme and whilst preparing the manuscript have been particularly valuable. We also wish to thank all the members of the advisory board of the project for useful discussions related to the work produced by the product. Key members of the programme and advisory board for the programme to thank, that have helped improve the manuscript are: Richard Allan, Sue Ballard, Hannah Cloke, Murray Dale, Sarah Dance, Suzanne Gray, Rob Lamb, Huw Lewis, Charles Piling, Robert Plant, and Roger Saunders. We also wish to thank the Met Office who not only led some of the research involved in the FFIR programme, but also provided access to equipment, the Met Office models and provided valuable discussions around the data, model and results. We also thank the EA, SEPA, NRW, JBA consulting and Jacobs who have provided valuable contributions (including data) and discussions throughout the programme. Everyone who has appeared in Figure 4 has signed a release giving permission for the image to be used for this purpose. The authors also indicate that the recommendations presented in this manuscript are purely the views of the authors and do not reflect the operational plans of the Met Office, EA, SEPA, NRW, FFC and SFFS.

Conflicts of Interest

The authors declare no conflict of interest. The funders had no role in the design of the study; in the collection, analyses, or interpretation of data; in the writing of the manuscript, or in the decision to publish the results.

References

  1. Hapuarachchi, H.A.P.; Wang, Q.J.; Pagano, T.C. A Review of Advances in Flash Flood Forecasting. Hydrol. Process. 2011, 25, 2771–2784. [Google Scholar] [CrossRef]
  2. Pitt, M. Learning Lessons from the 2007 Floods. An Independent Review by Sir Michael Pitt; Cabinet Office: London, UK, 2008. Available online: http://archive.cabinetoffice.gov.uk/pittreview/thepittreview.html (accessed on 27 October 2017).
  3. Chatterton, J.; Viavattene, C.; Morris, J.; Penning-Rowsell, E.C.; Tapsell, S.M. The Costs of the Summer 2007 Floods in England; Technical Report; Environment Agency: Bristol, UK, 2010. [Google Scholar]
  4. Hill, C.; Verjee, F.; Barrett, C. Flash Flood Early Warning System Reference Guide; University Corporation for Atmospheric Research: Boulder, CO, USA, 2010. [Google Scholar]
  5. Arheimer, B.; Lindström, G.; Olsson, J. A systematic review of sensitivities in the Swedish flood-forecasting system. Atmos. Res. 2011, 100, 275–284. [Google Scholar] [CrossRef]
  6. Pilling, C.; Dodds, V.; Cranston, M.; Price, D.; Harrison, T.; How, A. Chapter 9: Flood Forecasting—A National Overview for Great Britain. In Flood Forecasting; Adams, T.E., Pagano, T.C., Eds.; Academic Press: Boston, MA, USA, 2016; pp. 201–247. [Google Scholar] [CrossRef]
  7. Krajewski, W.F.; Ceynar, D.; Demir, I.; Goska, R.; Kruger, A.; Langel, C.; Mantilla, R.; Niemeier, J.; Quintero, F.; Seo, B.C.; et al. Real-time flood forecasting and information system for the state of Iowa. Bull. Am. Meteor. Soc. 2017, 98, 539–554. [Google Scholar] [CrossRef]
  8. Speight, L.; Cole, S.; Moore, R.; Pierce, C.; Wright, B.; Golding, B.; Cranston, M.; Tavendale, A.; Dhondia, J.; Ghimire, S. Developing surface water flood forecasting capabilities in Scotland: An operational pilot for the 2014 Commonwealth Games in Glasgow. J. Flood Risk Manag. 2018, 11, S884–S901. [Google Scholar] [CrossRef]
  9. Rabuffetti, D.; Ravazzani, G.; Barbero, S.; Mancini, M. Operational flood-forecasting in the Piemonte region–development and verification of a fully distributed physically-oriented hydrological model. Adv. Geosci. 2009, 17, 111–117. [Google Scholar] [CrossRef]
  10. Golding, B.; Clark, P.; May, B. The Boscastle Flood: Meteorological Analysis of the Conditions Leading to Flooding on 16 August 2004. Weather 2005, 60, 230–235. [Google Scholar] [CrossRef]
  11. Newcastle City Council. Summer 2012 Flooding in Newcastle Upon Tyne; Technical Report; Newcastle City Council: Newcastle, UK, 2013. Available online: https://www.newcastle.gov.uk/sites/default/files/wwwfileroot/environment/environment/microsoft_word_-_summer_2012_flooding_report_-_final_-_july_2013.pdf (accessed on 27 October 2017).
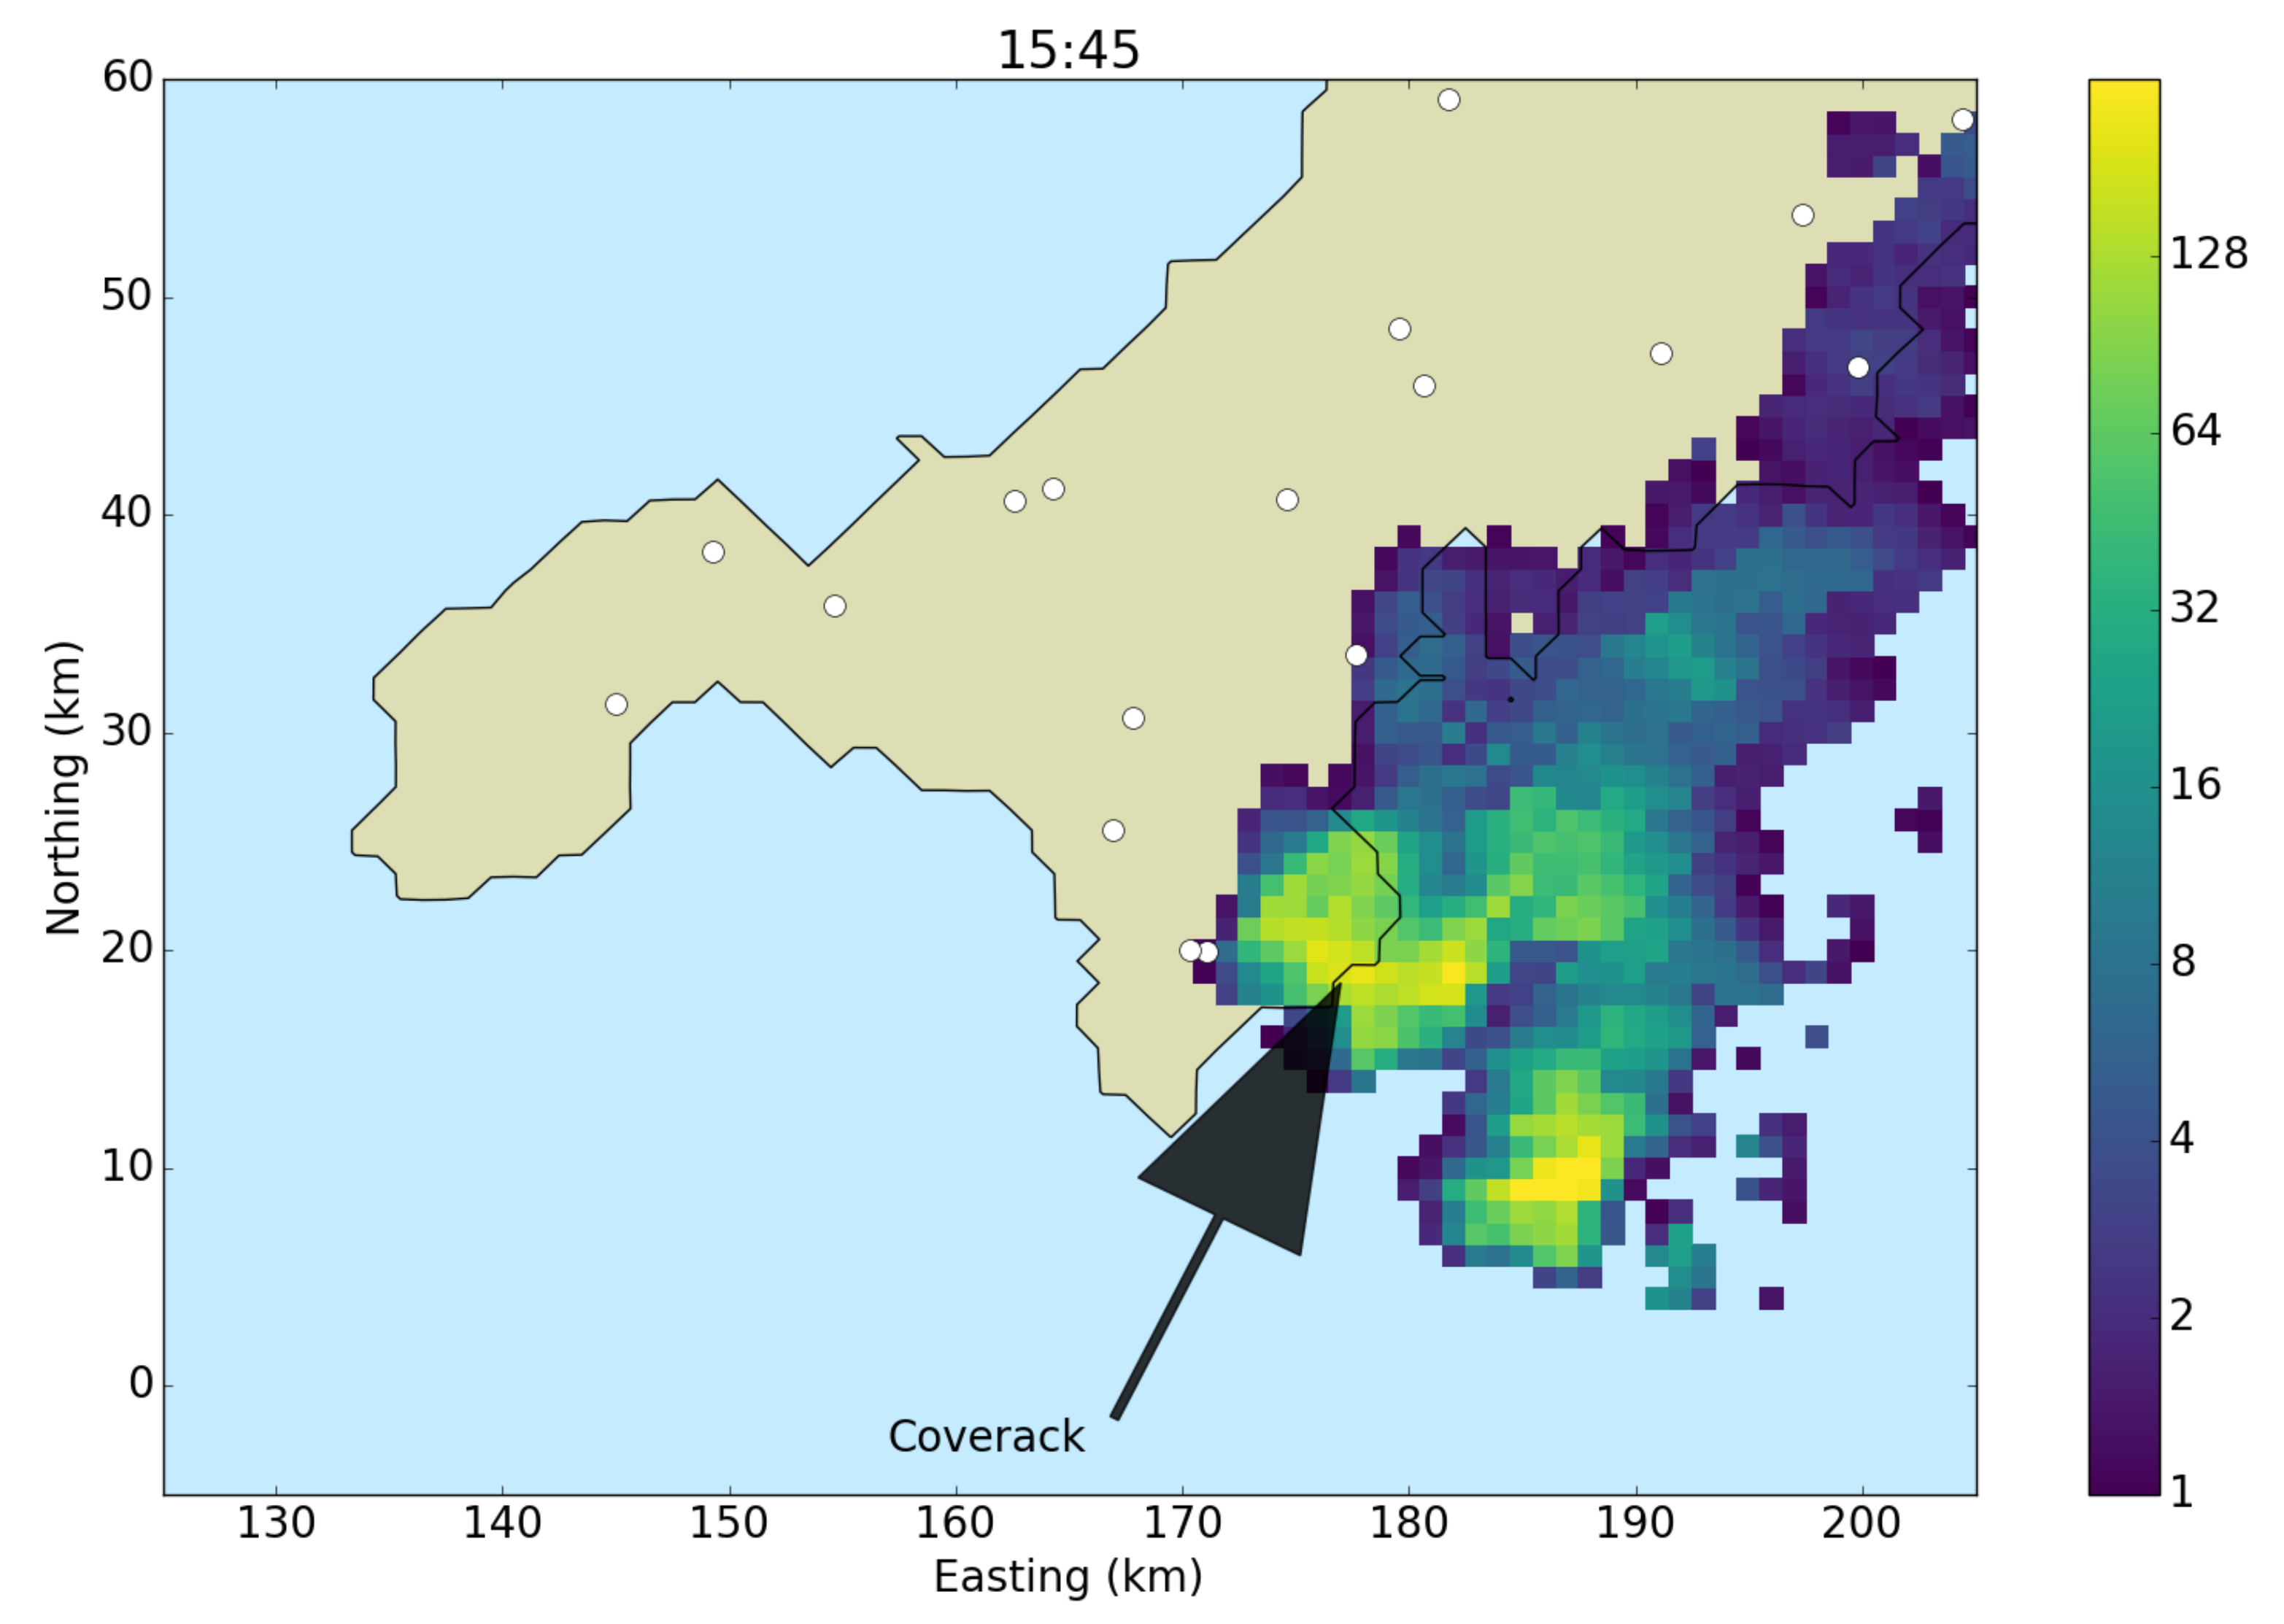
  12. Essex, J. Coverack Flood Incident Review; Technical Report; JBA Consulting: Bodmin, UK, 2018. Available online: http://www.cornwall.gov.uk/media/32471292/coverack-flood-incident-review-technical-summary-report-2017s6474_v20-mar-2018.pdf (accessed on 27 October 2017).
  13. Thompson, R.J. A Summer of Floods! 2017. Available online: http://blogs.reading.ac.uk/flooding/2017/10/11/a-summer-of-floods/ (accessed on 1 July 2018).
  14. Hand, W.H.; Fox, N.I.; Collier, C.G. A Study of Twentieth-Century Extreme Rainfall Events in the United Kingdom with Implications for Forecasting. Meteor. Appl. 2004, 11, 15–31. [Google Scholar] [CrossRef]
  15. Blenkinsop, S.; Lewis, E.; Chan, S.C.; Fowler, H.J. Quality-control of an hourly rainfall dataset and climatology of extremes for the UK. Int. J. Climatol. 2017, 37, 722–740. [Google Scholar] [CrossRef] [PubMed]
  16. Archer, D.; Fowler, H. Characterising flash flood response to intense rainfall and impacts using historical information and gauged data in Britain. J. Flood Risk Manag. 2015. [Google Scholar] [CrossRef]
  17. Cuo, L.; Pagano, T.C.; Wang, Q. A Review of Quantitative Precipitation Forecasts and Their Use in Short- to Medium-Range Streamflow Forecasting. J. Hydrometeor. 2011, 12, 713–728. [Google Scholar] [CrossRef]
  18. Javelle, P.; Organde, D.; Demargne, J.; de Saint-Aubin, C.; Garandeau, L.; Janet, B.; Saint-Martin, C.; Fouchier, C. Development of a National Flash Flood Warning System in France Using the AIGA Method: First Results and Main Issues. In Proceedings of the EGU General Assembly Conference Abstracts, Vienna, Austria, 17–22 April 2016; p. EPSC2016-16433. [Google Scholar]
  19. Pagano, T.; Elliott, J.; Anderson, B.; Perkins, J. Chapter 1—Australian Bureau of Meteorology Flood Forecasting and Warning. In Flood Forecasting; Adams, T.E., Pagano, T.C., Eds.; Academic Press: Boston, MA, USA, 2016; pp. 3–40. [Google Scholar] [CrossRef]
  20. Dale, M.; Davies, P.; Harrison, T. Review of recent advances in UK operational hydrometeorology. Proc. Inst. Civ. Eng. 2012, 165, 55–64. [Google Scholar] [CrossRef]
  21. Stephens, E.; Cloke, H. Improving flood forecasts for better flood preparedness in the UK (and beyond). Geogr. J. 2014, 180, 310–316. [Google Scholar] [CrossRef]
  22. Bannister, R.N. A review of operational methods of variational and ensemble-variational data assimilation. Q. J. R. Meteorol. Soc. 2017, 143, 607–633. [Google Scholar] [CrossRef]
  23. Cullen, M.J.P.; Davies, T. A conservative split-explicit integration scheme with fourth-order horizontal advection. Q. J. R. Meteorol. Soc. 1991, 117, 993–1002. [Google Scholar] [CrossRef]
  24. Davies, T.; Cullen, M.; Malcolm, A.; Mawson, M.; Staniforth, A.; White, A.; Wood, N. A New Dynamical Core for the Met Office’s Global and Regional Modelling of the Atmosphere. Q. J. R. Meteorol. Soc. 2005, 131, 1759–1782. [Google Scholar] [CrossRef]
  25. Walters, D.; Wood, N.; Vosper, S.; Milton, S.; Bysouth, C.; Earnshaw, P.; Heming, J.; Mittermaier, M.; Sanchez, C.; Roberts, M.; et al. ENDGame: A New Dynamical Core for Seamless Atmospheric Prediction; Technical Report; Met Office: Exeter, UK, 2014. Available online: http://www.metoffice.gov.uk/binaries/content/assets/mohippo/pdf/s/h/endgamegovsci_v2.0.pdf (accessed on 27 October 2017).
  26. Wood, N.; Staniforth, A.; White, A.; Allen, A.; Diamantakisa, M.; Gross, M.; Melvin, T.; Smith, C.; Vosper, S.; Zerroukat, M.; et al. An Inherently Mass-Conserving Semi-Implicit Semi-Lagrangian Discretisation of the Deep-Atmosphere Global Nonhydrostatic Equations. Q. J. R. Meteorol. Soc. 2014, 140, 1505–1520. [Google Scholar] [CrossRef]
  27. Hagelin, S.; Son, J.; Swinbank, R.; McCabe, A.; Roberts, N.; Tennant, W. The Met Office convective-scale ensemble, MOGREPS-UK. Q. J. R. Meteorol. Soc. 2017, 143, 2846–2861. [Google Scholar] [CrossRef]
  28. Cole, S.J.; Moore, R.J. Distributed hydrological modelling using weather radar in gauged and ungauged basins. Adv. Water Resour. 2009, 32, 1107–1120. [Google Scholar] [CrossRef]
  29. Price, D.; Hudson, K.; Boyce, G.; Schellekens, J.; Moore, R.J.; Clark, P.; Harrison, T.; Connolly, E.; Pilling, C. Operational use of a grid-based model for flood forecasting. Proc. Inst. Civ. Eng. Water Manag. 2012, 165, 65–77. [Google Scholar] [CrossRef]
  30. Mason, D.C.; Garcia-Pintado, J.; Cloke, H.L.; Dance, S.L. Evidence of a topographic signal in surface soil moisture derived from ENVISAT ASAR wide swath data. Int. J. Appl. Earth Obs. Geoinf. 2016, 45, 178–186. [Google Scholar] [CrossRef]
  31. Largeron, C.; Cloke, H.; Verhoef, A.; Martinez-de-la Torre, A.; Mueller, A. Impact of the Representation of the Infiltration on the River Flow during Intense Rainfall Events in JULES; European Centre for Medium-Range Weather Forecasts: Reading, UK, 2018. [Google Scholar]
  32. Hawcroft, M.; Shaffrey, L.; Hodges, K.I.; Dacre, H. How much Northern Hemisphere precipitation is associated with extratropical cyclones? Geophys. Res. Lett. 2012, 39. [Google Scholar] [CrossRef]
  33. Lavers, D.L.; Allan, R.P.; Wood, E.; Wade, A. Winter floods in Britain are connected to atmospheric rivers. Geophys. Res. Lett. 2011, 38. [Google Scholar] [CrossRef]
  34. Champion, A.J.; Allan, R.P.; Lavers, D.L. Atmospheric Rivers do not explain UK Summer Extreme Rainfall. J. Geophys. Res. Atmos. 2015, 120, 6371–6741. [Google Scholar] [CrossRef]
  35. Lenderink, G.; Fowler, H. Hydroclimate: Understanding rainfall extremes. Nat. Clim. Chang. 2017, 7. [Google Scholar] [CrossRef]
  36. Chan, S.C.; Kahana, R.; Kendon, E.J.; Fowler, H.J. Projected changes in extreme precipitation over Scotland and Northern England using a high-resolution regional climate model. Clim. Dyn. 2018. [Google Scholar] [CrossRef]
  37. Champion, A.J.; Blenkinsop, S.; Li, X.; Fowler, H.J. Synoptic-scale precursors of extreme UK summer 3-hourly rainfall. J. Geophys. Res. Atmos. 2019, in press. [Google Scholar] [CrossRef]
  38. Wang, Y.; Chandrasekar, V. Quantitative Precipitation Estimation in the CASA X-band Dual-Polarization Radar Network. J. Atmos. Ocean. Technol. 2010, 27, 1665–1676. [Google Scholar] [CrossRef]
  39. Darlington, T.; Adams, D.; Best, S.; Husnoo, N.; Lyons, S.; Norman, K. Optimising the Accuracy of Radar Products With Dual Polarisation :Project Benefits; Technical Report; Met Office: Exeter, UK, 2016. [Google Scholar]
  40. Thompson, R.; Illingworth, A.; Ovens, J. Emission: A simple new technique to correct rainfall estimates from attenuation due to both the radome and heavy rainfall. In Weather Radar and Hydrology; Moore, R.J., Cole, S.J., Illingworth, A.J., Eds.; IAHS Press: Wallingford, UK, 2012; pp. 39–44. [Google Scholar]
  41. Dance, S.L.; Ballard, S.P.; Bannister, R.N.; Clark, P.; Cloke, H.L.; Darlington, T.; Flack, D.L.A.; Gray, S.L.; Hawkness-Smith, L.; Husnoo, N.; et al. Improvements in forecasting intense rainfall: Results from the FRANC (Forecasting Rainfall exploiting new data Assimilation techniques and Novel observations of Convection) project. Atmosphere 2019, 10, 125. [Google Scholar] [CrossRef]
  42. Simonin, D.; Pierce, C.; Roberts, N.; Ballard, S.P.; Li, Z. Performance of Met Office hourly cycling NWP-based nowcasting for precipitation forecasts. Q. J. R. Meteorol. Soc. 2017, 143, 2862–2873. [Google Scholar] [CrossRef]
  43. Jones, C.; Macpherson, B. A latent heat nudging scheme for the assimilation of precipitation data into an operational mesoscale model. Meteorol. Appl. 1997, 4, 269–277. [Google Scholar] [CrossRef]
  44. Waller, J.A.; Dance, S.L.; Nichols, N.K. Theoretical insight into diagnosing observation error correlations using observation-minus-background and observation-minus-analysis statistics. Q. J. R. Meteorol. Soc. 2016, 142, 418–431. [Google Scholar] [CrossRef]
  45. Waller, J.A.; Dance, S.L.; Nichols, N.K. On diagnosing observation error statistics in localized ensemble data assimilation. Q. J. R. Meteorol. Soc. 2017. [Google Scholar] [CrossRef]
  46. Janjić, T.; Bormann, N.; Bocquet, M.; Carton, J.A.; Cohn, S.E.; Dance, S.L.; Losa, S.N.; Nichols, N.K.; Potthast, R.; Waller, J.A.; et al. On the representation error in data assimilation. Q. J. R. Meteorol. Soc. 2018, 144, 1257–1278. [Google Scholar] [CrossRef]
  47. Waller, J.A.; Simonin, D.; Dance, S.L.; Nichols, N.K.; Ballard, S.P. Diagnosing observation error correlations for Doppler radar radial winds in the Met Office UKV model using observation-minus-background and observation-minus-analysis statistics. Mon. Wea. Rev. 2016, 144, 3533–3551. [Google Scholar] [CrossRef]
  48. Waller, J.A.; Ballard, S.P.; Dance, S.L.; Kelly, G.; Nichols, N.K.; Simonin, D. Diagnosing Horizontal and Inter- Channel Observation Error Correlations for SEVIRI Observations Using Observation-Minus-Background and Observation-Minus-Analysis Statistics. Remote Sens. 2016, 8, 581. [Google Scholar] [CrossRef]
  49. Cordoba, M.; Dance, S.L.; Kelly, G.A.; Nichols, N.K.; Waller, J.A. Diagnosing Atmospheric Motion Vector observation errors for an operational high resolution data assimilation system. Q. J. R. Meteorol. Soc. 2017, 143, 333–341. [Google Scholar] [CrossRef]
  50. Fowler, A.M.; Dance, S.L.; Waller, J.A. On the interaction of observation and prior error correlations in data assimilation. Q. J. R. Meteorol. Soc. 2018, 144, 48–62. [Google Scholar] [CrossRef]
  51. Simonin, D.; Waller, J.A.; Ballard, S.P.; Dance, S.; Nichols, N. Doppler Radial Wind Spatially Correlated Observation Error Statistics: Operational Implementation and Initial Results; Met Office, University of Reading: Reading, UK, 2018. [Google Scholar]
  52. Lean, H.W.; Clark, P.A.; Dixon, M.; Roberts, N.M.; Fitch, A.; Forbes, R.; Halliwell, C. Characteristics of high-resolution versions of the Met Office Unified Model for forecasting convection over the United Kingdom. Mon. Weather Rev. 2008, 136, 3408–3424. [Google Scholar] [CrossRef]
  53. Clark, P.; Roberts, N.; Lean, H.; Ballard, S.P.; Charlton-Perez, C. Convection-Permitting Models: A Step- Change in Rainfall Forecasting. Meteor. Appl. 2016, 23, 165–181. [Google Scholar] [CrossRef]
  54. Lorenz, E.N. The Predictability of a Flow Which Possesses Many Scales of Motion. Tellus 1969, 21, 289–307. [Google Scholar] [CrossRef]
  55. Hohenegger, C.; Lüthi, D.; Schär, C. Predictability Mysteries in Cloud-Resolving Models. Mon. Wea. Rev. 2006, 134, 2095–2107. [Google Scholar] [CrossRef]
  56. Leith, C. Theoretical Skill of Monte Carlo Forecasts. Mon. Weather Rev. 1974, 102, 409–418. [Google Scholar] [CrossRef]
  57. Flack, D.L.; Gray, S.L.; Plant, R.S.; Lean, H.W.; Craig, G.C. Convective-Scale Perturbation Growth across the Spectrum of Convective Regimes. Mon. Weather Rev. 2018, 146, 387–405. [Google Scholar] [CrossRef]
  58. Flack, D.; Plant, R.; Gray, S.; Lean, H.; Keil, C.; Craig, G. Characterisation of Convective Regimes over the British Isles. Q. J. R. Meteorol. Soc. 2016, 142, 1541–1553. [Google Scholar] [CrossRef]
  59. Clark, P.A.; Halliwell, C.; Flack, D.L.A. A Simple, Physically-Based, Stochastic Boundary-Layer Parametrization. Part I: The Scheme Formulation and Sensitivity. 2019; in preparation. [Google Scholar]
  60. Flack, D.L.A.; Clark, P.A.; Halliwell, C.; Roberts, N.M.; Gray, S.L.; Plant, R.S.; Lean, H.W. A Simple, Physically-Based, Stochastic Boundary-Layer Parametrization. Part II: Application Within a Convective-Sacle Super Ensemble. 2019, in preparation.
  61. Collier, C.; Fox, N. Assessing the flooding susceptibility of river catchments to extreme rainfall in the United Kingdom. Int. J. River Basin Manag. 2003, 1, 225–235. [Google Scholar] [CrossRef]
  62. Marchi, L.; Borga, M.; Preciso, E.; Gaume, E. Characterisation of selected extreme flash floods in Europe and implications for flood risk management. J. Hydrol. 2010, 394, 118–133. [Google Scholar] [CrossRef]
  63. Dale, M.; Dempsey, P.; Dent, J. Extreme Rainfall Event Recognition: Phase 2 Work Package 5–Establishing a User Requirement for a Decision-Support Tool. In Research and Development Technical Report FD2208 of Defra/Environment Agency Flood and Coastal Defence R&D Programme; Department of the Environment, Food and Rural Affairs: London, UK, 2004. [Google Scholar]
  64. Chang, T.J.; Wang, C.H.; Chen, A.S.; Djordjević, S. The effect of inclusion of inlets in dual drainage modelling. J. Hydrol. 2018, 559, 541–555. [Google Scholar] [CrossRef]
  65. Wang, Y.; Chen, A.S.; Fu, G.; Djordjević, S.; Zhang, C.; Savić, D.A. An integrated framework for high-resolution urban flood modelling considering multiple information sources and urban features. Environ. Model. Softw. 2018, 107, 85–95. [Google Scholar] [CrossRef]
  66. Chen, A.; Hsu, M.; Chen, T.; Chang, T. An integrated inundation model for highly developed urban areas. Water Sci. Technol. 2005, 51, 221–229. [Google Scholar] [CrossRef]
  67. Xia, X.; Liang, Q.; Ming, X.; Hou, J. An efficient and stable hydrodynamic model with novel source term discretization schemes for overland flow and flood simulations. Water Resour. Res. 2017, 53, 3730–3759. [Google Scholar] [CrossRef]
  68. Beven, K.; Freer, J. A dynamic topmodel. Hydrol. Process. 2001, 15, 1993–2011. [Google Scholar] [CrossRef]
  69. Bates, P.D.; Horritt, M.S.; Fewtrell, T.J. A simple inertial formulation of the shallow water equations for efficient two-dimensional flood inundation modelling. J. Hydrol. 2010, 387, 33–45. [Google Scholar] [CrossRef]
  70. Skinner, C. SeriousGeoGames—Flash Flood Living Manual; Zenodo: Geneva, Switzerland, 2018. [Google Scholar] [CrossRef]
  71. Milan, D.J. Geomorphic impact and system recovery following an extreme flood in an upland stream: Thinhope Burn, northern England, UK. Geomorphology 2012, 138, 319–328. [Google Scholar] [CrossRef]
  72. Skinner, C. Riding the (flood) wave: The Flash Flood! desktop application. Teach. Geogr. Spring 2018, 43, 28–31. [Google Scholar]
  73. Ebert, E.E. Neighborhood verification: A strategy for rewarding close forecasts. Wea. Forecast. 2009, 24, 1498–1510. [Google Scholar] [CrossRef]
  74. Lewis, H.W.; Castillo Sanchez, J.M.; Graham, J.; Saulter, A.; Bornemann, J.; Arnold, A.; Fallmann, J.; Harris, C.; Pearson, D.; Ramsdale, S.; et al. The UKC2 regional coupled environmental prediction system. Geosci. Model Dev. 2018, 11, 1–42. [Google Scholar] [CrossRef]
  75. Lewis, H.W.; Castillo Sanchez, J.M.; Arnold, A.; Fallmann, J.; Saulter, A.; Graham, J.; Bush, M.; Siddorn, J.; Palmer, T.; Lock, A.; et al. The UKC3 regional coupled environmental prediction system. Geosci. Model Dev. Discuss. 2018, 2018, 1–67. [Google Scholar] [CrossRef]
  76. Cole, S.J.; Moore, R.J.; Aldridge, T.A.; Gunawan, O.; Balmforth, H.; Hunter, N.; Mooney, J.; Lee, D.; Fenwick, K.; Price, D.; et al. Natural Hazards Partnership Surface Water Flooding Hazard Impact Model: Phase 2 Final Report; Technical Report; Natural Hazards Partnership: Wallingford, UK, 2016; Available online: http://www.naturalhazardspartnership.org.uk/wp-content/uploads/2016/10/NHP-HIM-Surface-Water-Flooding-Phase-2-Final-Report.pdf (accessed on 20 February 2019).
Figure 1. Schematics of end-to-end flood forecasts: (a) the UK operational system prior to the start of the FFIR (Flooding From Intense Rainfall) programme in 2013 and (b) the FFIR proposed vision for a national end-to-end forecast for flash and surface water flooding. Arrows represent the links between the different boxes. Purple items are those considered by the FFIR programme directly, blue (regardless of shade) boxes are the items that have not been directly researched/changed by the programme and red boxes indicate the output to the end user. The land-surface modelling is operationally run as part of the NWP (Numerical Weather Prediction) model so is thus included within that box.
Water 11 00725 g001
Figure 2. Radar-derived rainfall over the South-West peninsular of the UK, at 1545 UTC on 18 July 2017. The circles indicate the position of rain gauges, the colour scale refers to the radar-derived instantaneous rainfall rates in mm h 1 .
Water 11 00725 g002
Figure 3. Hydraulic modelling, using radar observations, of the Coverack flood, showing the flooding extent and depth for the village.
Water 11 00725 g003
Figure 4. Flash Flood! being demonstrated at the FFIR Showcase at the Royal Society in November 2018.
Water 11 00725 g004
Figure 5. The achievements from the FFIR programme and how they impact the end users and the end-to-end forecasting chain. Whilst data assimilation has not been explicitly shown in this schematic it is treated within the improved forecasts box.
Water 11 00725 g005
Table 1. Examples of UK rainfall events that led to flooding from intense rainfall, and the type of flooding it led to.
EventFlood TypeRainfall TypeRainfall Total (mm)Rainfall Duration (h)
Boscastle 2004 [10]Rapid-rate-of-rise river floodingConvective1835
Newcastle 2012 [11]Surface-water floodingConvective502
Coverack 2017 [12]Rapid-rate-of-rise river floodingConvective165–2013
Reading 2017 [13]Surface-water floodingConvective391
Table 2. Maximum, mean and minimum of rainfall and runoff accumulations between 1300 and 1500 UTC on 18 July 2017 (T + 22–T + 24) forecasts. The values are generated from an ensemble (run with the MetUM) with 144 members (further details in references [59,60])*. The values are taken from all members and all points within a 26 × 26 grid points (57.2 km × 57.2 km) region, as all of these accumulations are equally valid over the grid point containing Coverack. Both the rainfall and the runoff have been generated by the MetUM.
Rainfall (mm)Runoff (mm)
Maximum22.883.3
Mean2.43.3
Minimum0.00.0

