Article

Unraveling the Role of Human Activities and Climate Variability in Water Level Changes in the Taihu Plain Using Artificial Neural Network

1
School of Geography and Tourism, Chongqing Normal University, Chongqing 401331, China
2
School of Geographic and Oceanographic Sciences, Nanjing University, Nanjing 210023, China
3
Hydraulics Section, Department of Civil Engineering, KU Leuven, 3000 Leuven, Belgium
*
Author to whom correspondence should be addressed.
Water 2019, 11(4), 720; https://doi.org/10.3390/w11040720
Submission received: 22 February 2019 / Revised: 22 March 2019 / Accepted: 2 April 2019 / Published: 6 April 2019
(This article belongs to the Special Issue Hydrological Impacts of Climate Change and Land Use/Land Cover Change)

Abstract

:
Water level, as a key indicator for the floodplain area, has been largely affected by the interplay of climate variability and human activities during the past few decades. Due to a nonlinear dependence of water level changes on these factors, a nonlinear model is needed to more realistically estimate their relative contribution. In this study, the attribution analysis of long-term water level changes was performed by incorporating multilayer perceptron (MLP) artificial neural network. We took the Taihu Plain in China as a case study where water level series (1954–2014) were divided into baseline (1954–1987) and evaluation (1988–2014) periods based on abrupt change detection. The results indicate that climate variables are the dominant driver for annual and seasonal water level changes during the evaluation period, with the best performance of the MLP model having precipitation, evaporation, and tide level as inputs. In the evaluation period, the contribution of human activities to water level changes in the 2000s is higher than that in the 1990s, which indicates that human activities, including the rapid urbanization, are playing an important role in recent years. The influence of human activities, especially engineering operations, on water level changes in the 2000s is more evident during the dry season (March-April-May (MAM) and December-January-February (DJF)).

1. Introduction

It is widely recognized that climate variability and human activities have exerted considerable impacts on hydrological processes globally during the past decades [1,2,3,4]. Climate variability can influence these processes through altering the spatial and temporal patterns of precipitation and evaporation [5,6,7]. The influence of human activities, such as landscape change, hydraulic construction, and river channelization, make hydrological processes more complex [8,9,10]. In order to effectively manage regional water resources, it is important to investigate the influence of both climate variability and human activities on hydrological processes.
The water level is an important indicator of surface water studies and flood management across the floodplain areas [11,12]. Recently, the variations in water level have attracted increasing attention because of a worldwide increased risk of flood and drought/water scarcity [13,14]. Some researchers have investigated the influence of either climate variability or anthropogenic activities on water level variations [15,16]. However, both climatic and anthropogenic factors should be considered for the attribution analyses of water level variations. As human activities and the interventions in catchments have increased in recent decades, especially in fast-developing countries, such as China, the need to recognize and address the related impact becomes even more urgent [17,18,19,20]. Despite this urgency, the number of studies quantifying the relative contribution of climate variability and human activities to water level changes in China is still limited. Zhang et al. [21] reported that sand excavation was one of the most intensive human activities after the 1980s in the Pearl River Delta, which affected extreme water levels by altering the morphology of the river channels and estuary. In the Hang-Jia-Hu plain, rapid urbanization since the 1980s has changed the temporal and spatial variation of water levels [22]. In the Mekong River basin, the temporal and spatial trends in water infrastructure development after 1991 have caused alterations in water level patterns [23].
The Taihu Plain is one of the typical Chinese floodplains located in the center of the Yangtze River Delta with complex fluvial systems and heavy industrialization [24]. Due to the flat topography and gentle slope, the plain has a complex flow direction which makes runoff monitoring quite difficult. It, moreover, experiences continuous rainfall with high flood risks in summer [25]. Thus, water level becomes a prime indicating factor for hydraulic construction as well as flood control. The Taihu Plain is also one of the most prosperous areas in China and has experienced a rapid urban development over the past three decades, which has triggered the occurrence of different kinds of human activities in this region [26]. With further urbanization and a projected increase for future summer precipitation in this region, the flood risks are expected to increase by approximately 4–15 times by 2050 under different climatic and socio-economic scenarios [27]. The largest flood disaster in the region in 1999 resulted in a direct economic loss of $16 billion. Therefore, it is necessary to conduct a quantitative attribution analysis of each driving force on regional hydrological processes to reduce the increasing flood risks and implement water management projects in the floodplain area.
The previous studies have mostly performed linear attribution analyses for hydrological changes [21,23]. However, due to an interaction of different human activities and climate variability influencing water level, water level varies nonlinearly. Modeling of such complex process requires a robust model as otherwise, results can be biased. The artificial neural network (ANN) is one of the mathematical models with high abilities to find the nonlinear relationship between input and output parameters [28]. Until now, although the ANN method has been widely used in many hydrological and meteorological applications [29,30,31,32], there is a lack of study using ANN for the attribution analysis of hydrological changes. To address this knowledge gap, this study applied multilayer perceptron (MLP) artificial neural network for the attribution analysis of long-term water level changes during 1954–2014 in the Taihu Plain. The relative contributions of climate variability and human activities to water level changes are quantified.

2. Study Area and Data
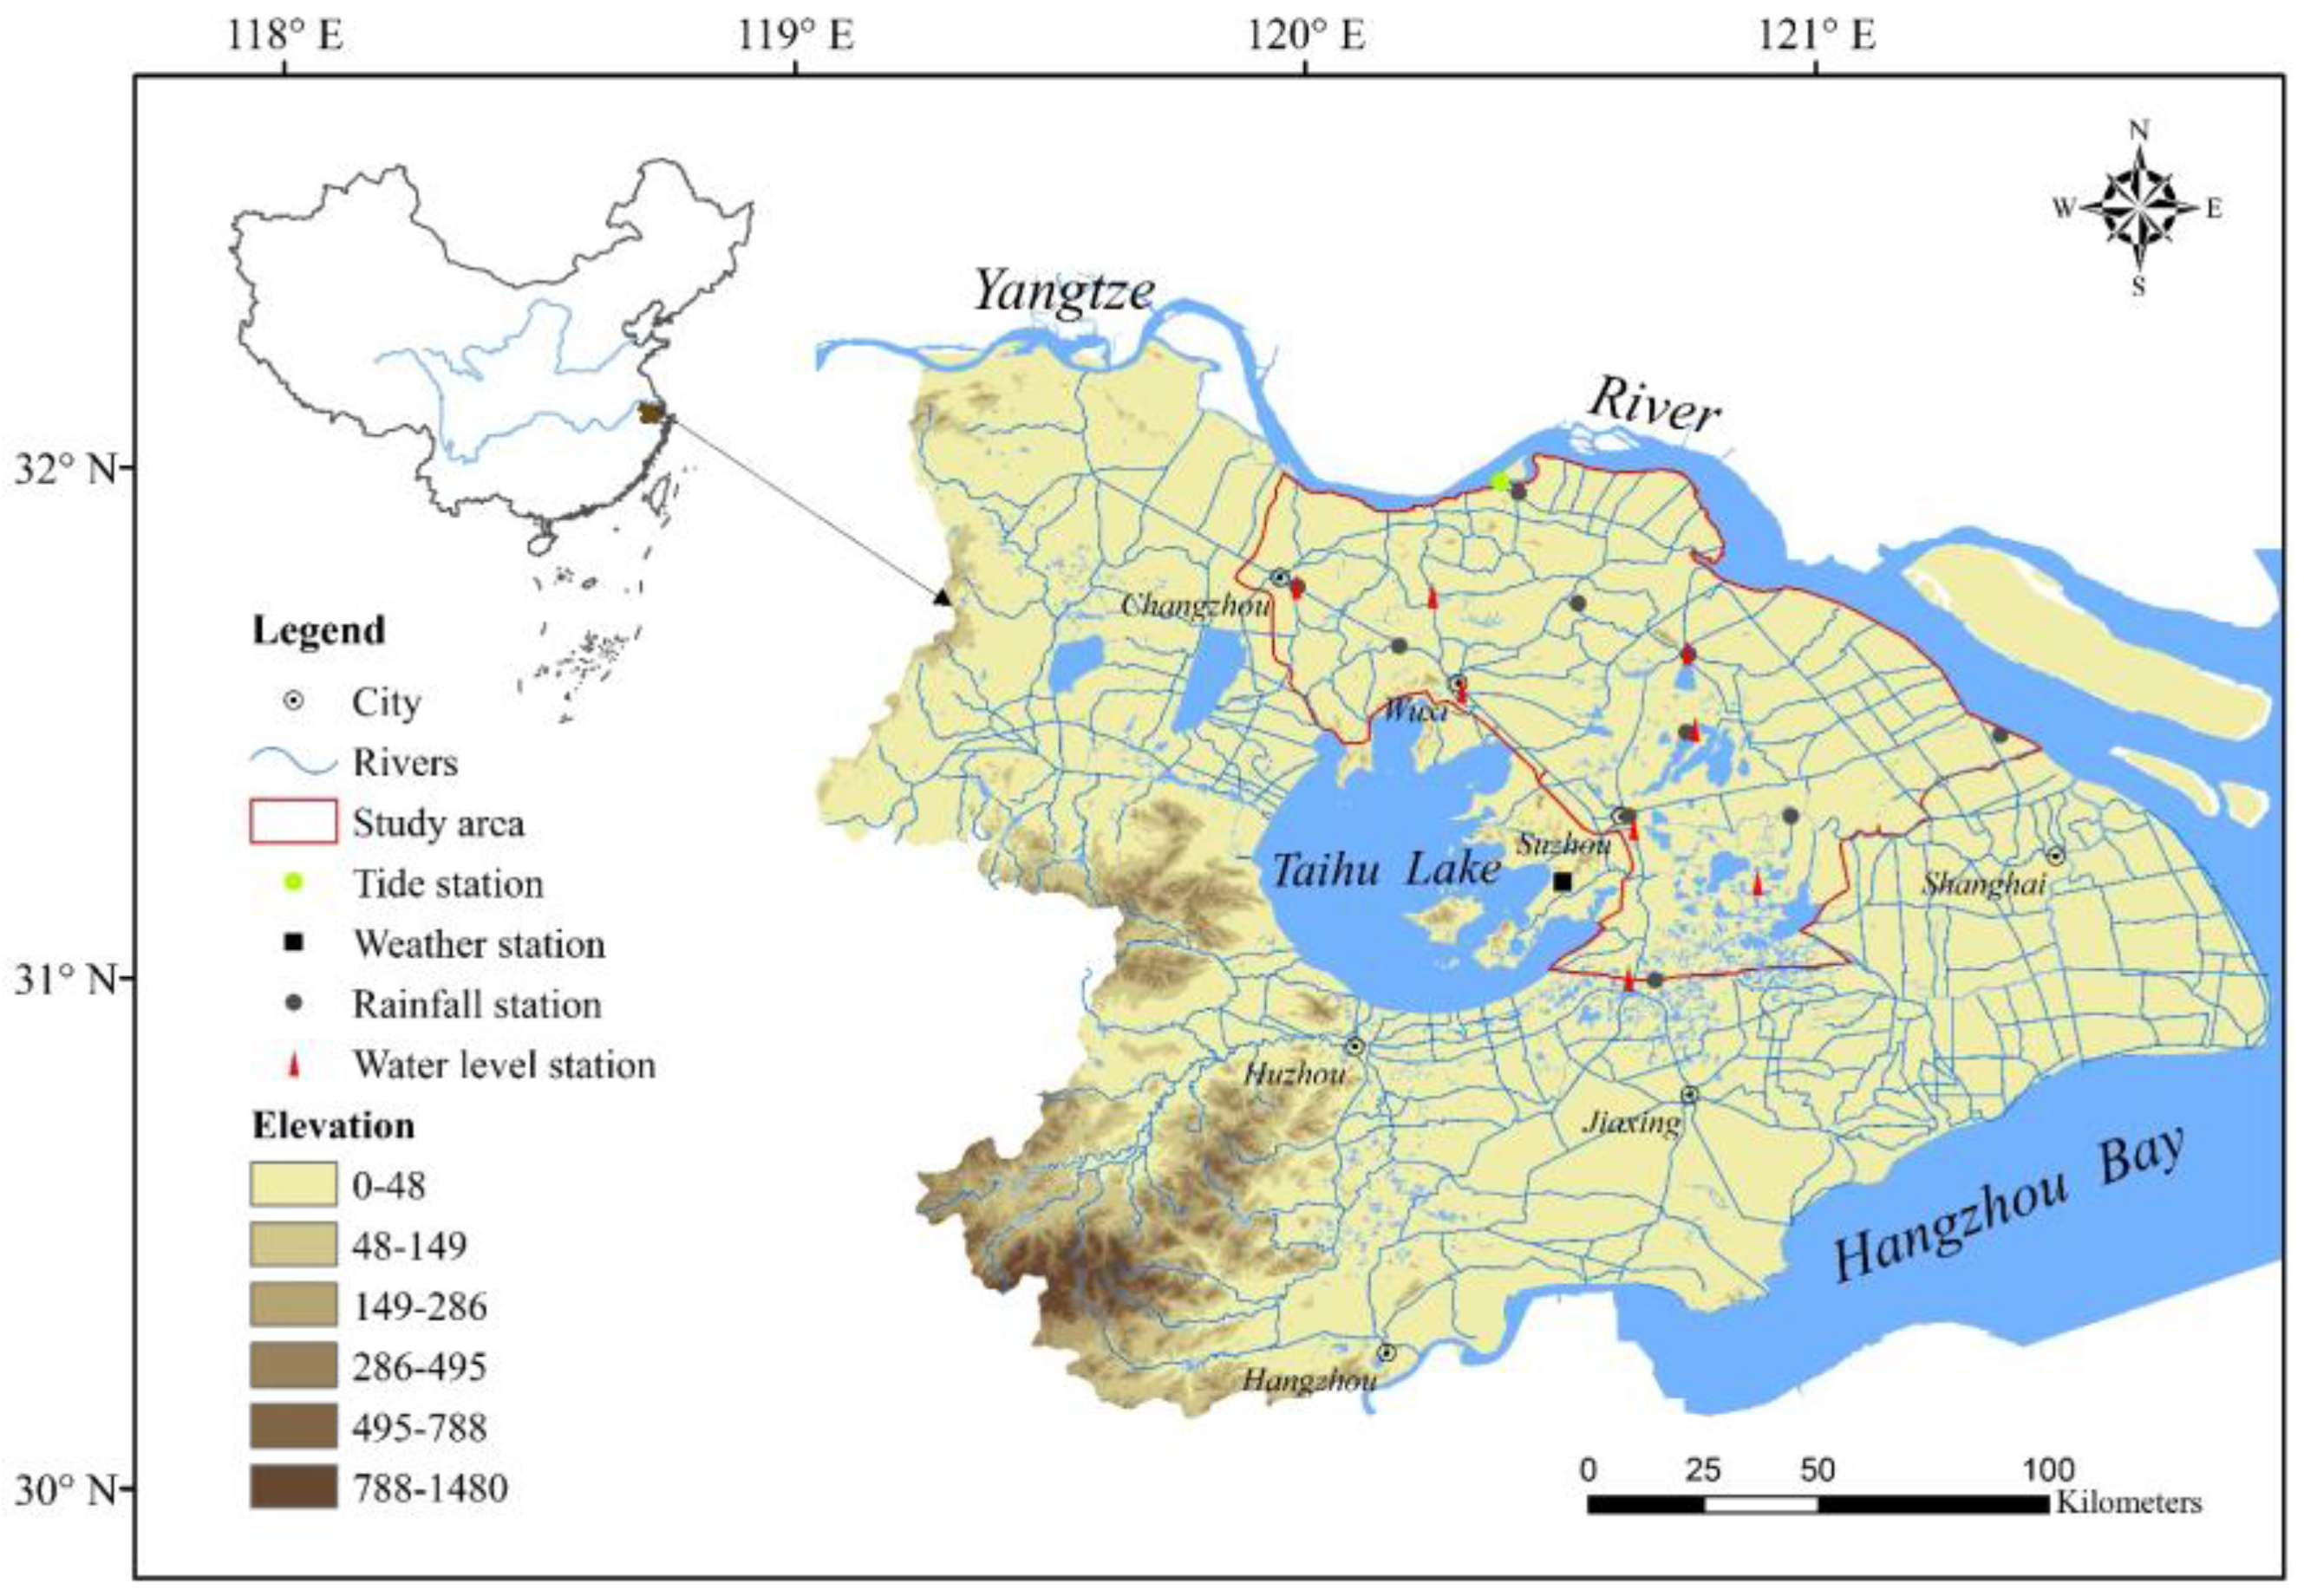
2.1. Study Area

The Taihu Plain covers a total land area of 7929 km2, with an elevation of 2–4 m above sea level (Figure 1). The region is controlled by the East Asia Monsoon with four distinct seasons: spring (March-April-May: MAM), summer (June-July-August: JJA), autumn (September-October-November: SON), and winter (December-January-February: DJF). The average annual rainfall is 1180 mm, and the average annual temperature is 16 °C. The precipitation is mainly concentrated in summer, which accounts for almost 60% of the annual precipitation [33,34].
Rapid urbanization and economic growth have taken place in this region since the 1980s [35]. The population of the Taihu Plain increased from 9.08 million in 1962 to 14.65 million in 2010. Industrial production in 2010 increased by 1000 times than that in 1960 and reached 4500 billion RMB [36]. The proportion of farmland areas decreased sharply, while industrial and urban areas increased by 4.7% annually during the same period, which indicates that the urbanization in this region is a process of farmland occupation. River system has also been severely disturbed during the rapid urbanization, with the decrease in drainage density and water surface ratio by 12.6% and 20.2% from the 1980s to the 2010s, respectively [24]. The hydrological processes of the Taihu Plain are also affected by tide level changes to some extent [37,38]. Meanwhile, more and more hydraulic structures, including sluices and pumps, have been constructed for water resources management and flood control [39]. Overall, the dense population, rapid industrialization, and heavy urbanization have put considerable pressure on the hydrology of the region.

2.2. Data Preparation

Monthly water level data from January 1954 to December 2014 were collected from eight water level stations within the Taihu Plain (Figure 1). Monthly precipitation data of the same period were obtained from ten rainfall stations. Monthly tidal level data at Jiangyin station located in the estuary of the Yangtze River were also collected. What’s more, monthly meteorological data of Dongshan station obtained from the China Administration of Meteorology, including air temperature, sunshine hours, relative humidity, and wind speed, were used to estimate potential evaporation using the Food and Agriculture Organization (FAO) Penman-Monteith method.
The geographic information of the study stations and some statistical metrics, including long-term mean (LTM) and coefficient of variation (CV), are listed in Table 1. Considering similar characteristics of water level and rainfall at each station, regional mean time series for the Taihu Plain was calculated by the Thiessen polygon in ArcGIS 9.3. In addition to climate data, human activity related data, including land use and hydraulic structure within the Taihu Plain, were collected. The land use data with a resolution of 1 km for five periods during 1990–2010 were provided by Data Center for Resources and Environmental Sciences (RESDC, http://www.resdc.cn). The hydraulic structures, including sluices and pumps, were acquired from the Taihu Basin Authority.

3. Methodology

3.1. Statistical Analysis

To determine the change point in the water level time series, the Pettitt [40], Sequential Cluster [41], and Mann-Kendall [42,43] tests were used. They are commonly used methods to identify the occurrence of a change point in hydrological series [44,45,46]. Then, the most probable change point is selected based on the overall results of the three methods. In this way, the detected change points by different methods can be validated. Once the change point is detected, the time series is divided into two sub-series and the series, which are expected to have different statistics (e.g., mean and standard deviation).
The Mann-Whitney test was used to test the null hypothesis that the two samples come from the same population; whether observations in one sample tend to be larger or smaller than observations in the other sample. Given the time series X = (x1, x2, ⋯, xn), partition X such that Y1 = (x1, x2, ⋯, xn1) and Y2 = (xn1+1, xn1+2, ⋯, xn1+n2). The Mann-Whitney test statistic is given as
Z c = i = 1 n 1 r ( x i ) n 1 n 2 2 [ n 1 n 2 ( n 1 + n 2 + 1 ) 12 ] 1 2
where r(xi) is the rank of the observations, n1 and n2 are the sizes of samples. The null hypothesis H0 of no steep change between two periods is accepted if −Z1−α/2ZcZ1−α/2, where α is the significance level. Z1−α/2 for the selected α = 0.01 and α = 0.05 is equal to 2.58 and 1.96, respectively.

3.2. ANN-Based Attribution Analysis

In order to separate the impacts of climate variability and human activities on the changes in water level, the sub-series before and after the detected change points were referred to as baseline and evaluation periods, respectively. An assumption was made that there is no significant human activity during the baseline period (1954–1987) [47]. The total change ( Δ H ) in mean water level between two independent periods can be estimated as:
Δ H = H 2 o b s ¯ H 1 o b s ¯
where H 1 o b s ¯ and H 2 o b s ¯ denote the observed mean water level during the baseline and evaluation periods, respectively. The total changes in water level caused by the combined impacts of climate variability and human activities can be expressed as:
Δ H = Δ H c + Δ H h
Δ H c = H 2 s i m ¯ H 1 o b s ¯
Δ H h = H 2 o b s ¯ H 2 s i m ¯
η c = Δ H c Δ H × 100 %
η h = Δ H h Δ H × 100 %
where Δ H c is the water level change due to the climate variability between two periods, Δ H h is the water level change caused by the changes in human activities, H 2 s i m ¯ is natural water level during the evaluation period, and ηc and ηh are the contributions of climate and human activity to the water level change, respectively. To partition water level impacts induced by climate variability and human activities, Δ H c and Δ H h need to be quantified. In this study, a monthly scale non-linear model between mean monthly water and climate variables (i.e., monthly rainfall, evaporation, and tide level) was built based on ANN. The H 2 s i m ¯ and Δ H c can be estimated using the validated ANN model. Then, the percentage contribution of climate-induced (ηc) and human-activities-induced (ηh) to water level changes can be calculated. The used ANN model is briefly explained below. In this study, the multilayer perceptron (MLP) model was applied, which is probably the most popular ANN model in hydrological studies [48,49,50]. The MLP is a feed-forward network that consists of three layers of neurons: the input layer, the hidden layers, and the output layer. The hidden layer provides the nonlinearity between the input and output sets. Most complex problems can be solved by increasing the number of hidden layers and/or the neurons in the hidden layer. The MLP neural network can be expressed as follows.
Y t = f 2 [ j = 1 J w j f 1 ( i = 1 I w i x i ) ]
where Yt is the output vector, xi is the input vector, wi and wj are the weights vector between the neurons of the input and hidden layers and between the hidden and output layers, respectively, f1 and f2 are the transfer functions for the hidden layer and output layer, respectively. In order to lie all the data in the central zone of the sigmoid function, all inputs were normalized between 0.1 and 0.9 before training the MLP model, as recommended by [51]. The normalization prevents the problem of output signal saturation that sometimes happens in ANN applications [52]. The model was trained using the Levenberg-Marquardt algorithm.
To find the optimal hidden neurons, a trial and error process was used, starting with two hidden neurons and gradually increased up to 10 with a step size of 1 in each trial. For each set of hidden neurons, the network was trained in a batch mode to minimize the mean square error at the output layer. In order to avoid overfitting, early stop technique and cross-validation were performed by keeping track of the efficiency of the fitted model [53]. Once no significant improvement in the efficiency was noticed, the training was stopped. The best MLP model was selected based on Nash-Sutcliffe efficiency (NSE) and the coefficient of determination (R2).

4. Results and Discussions

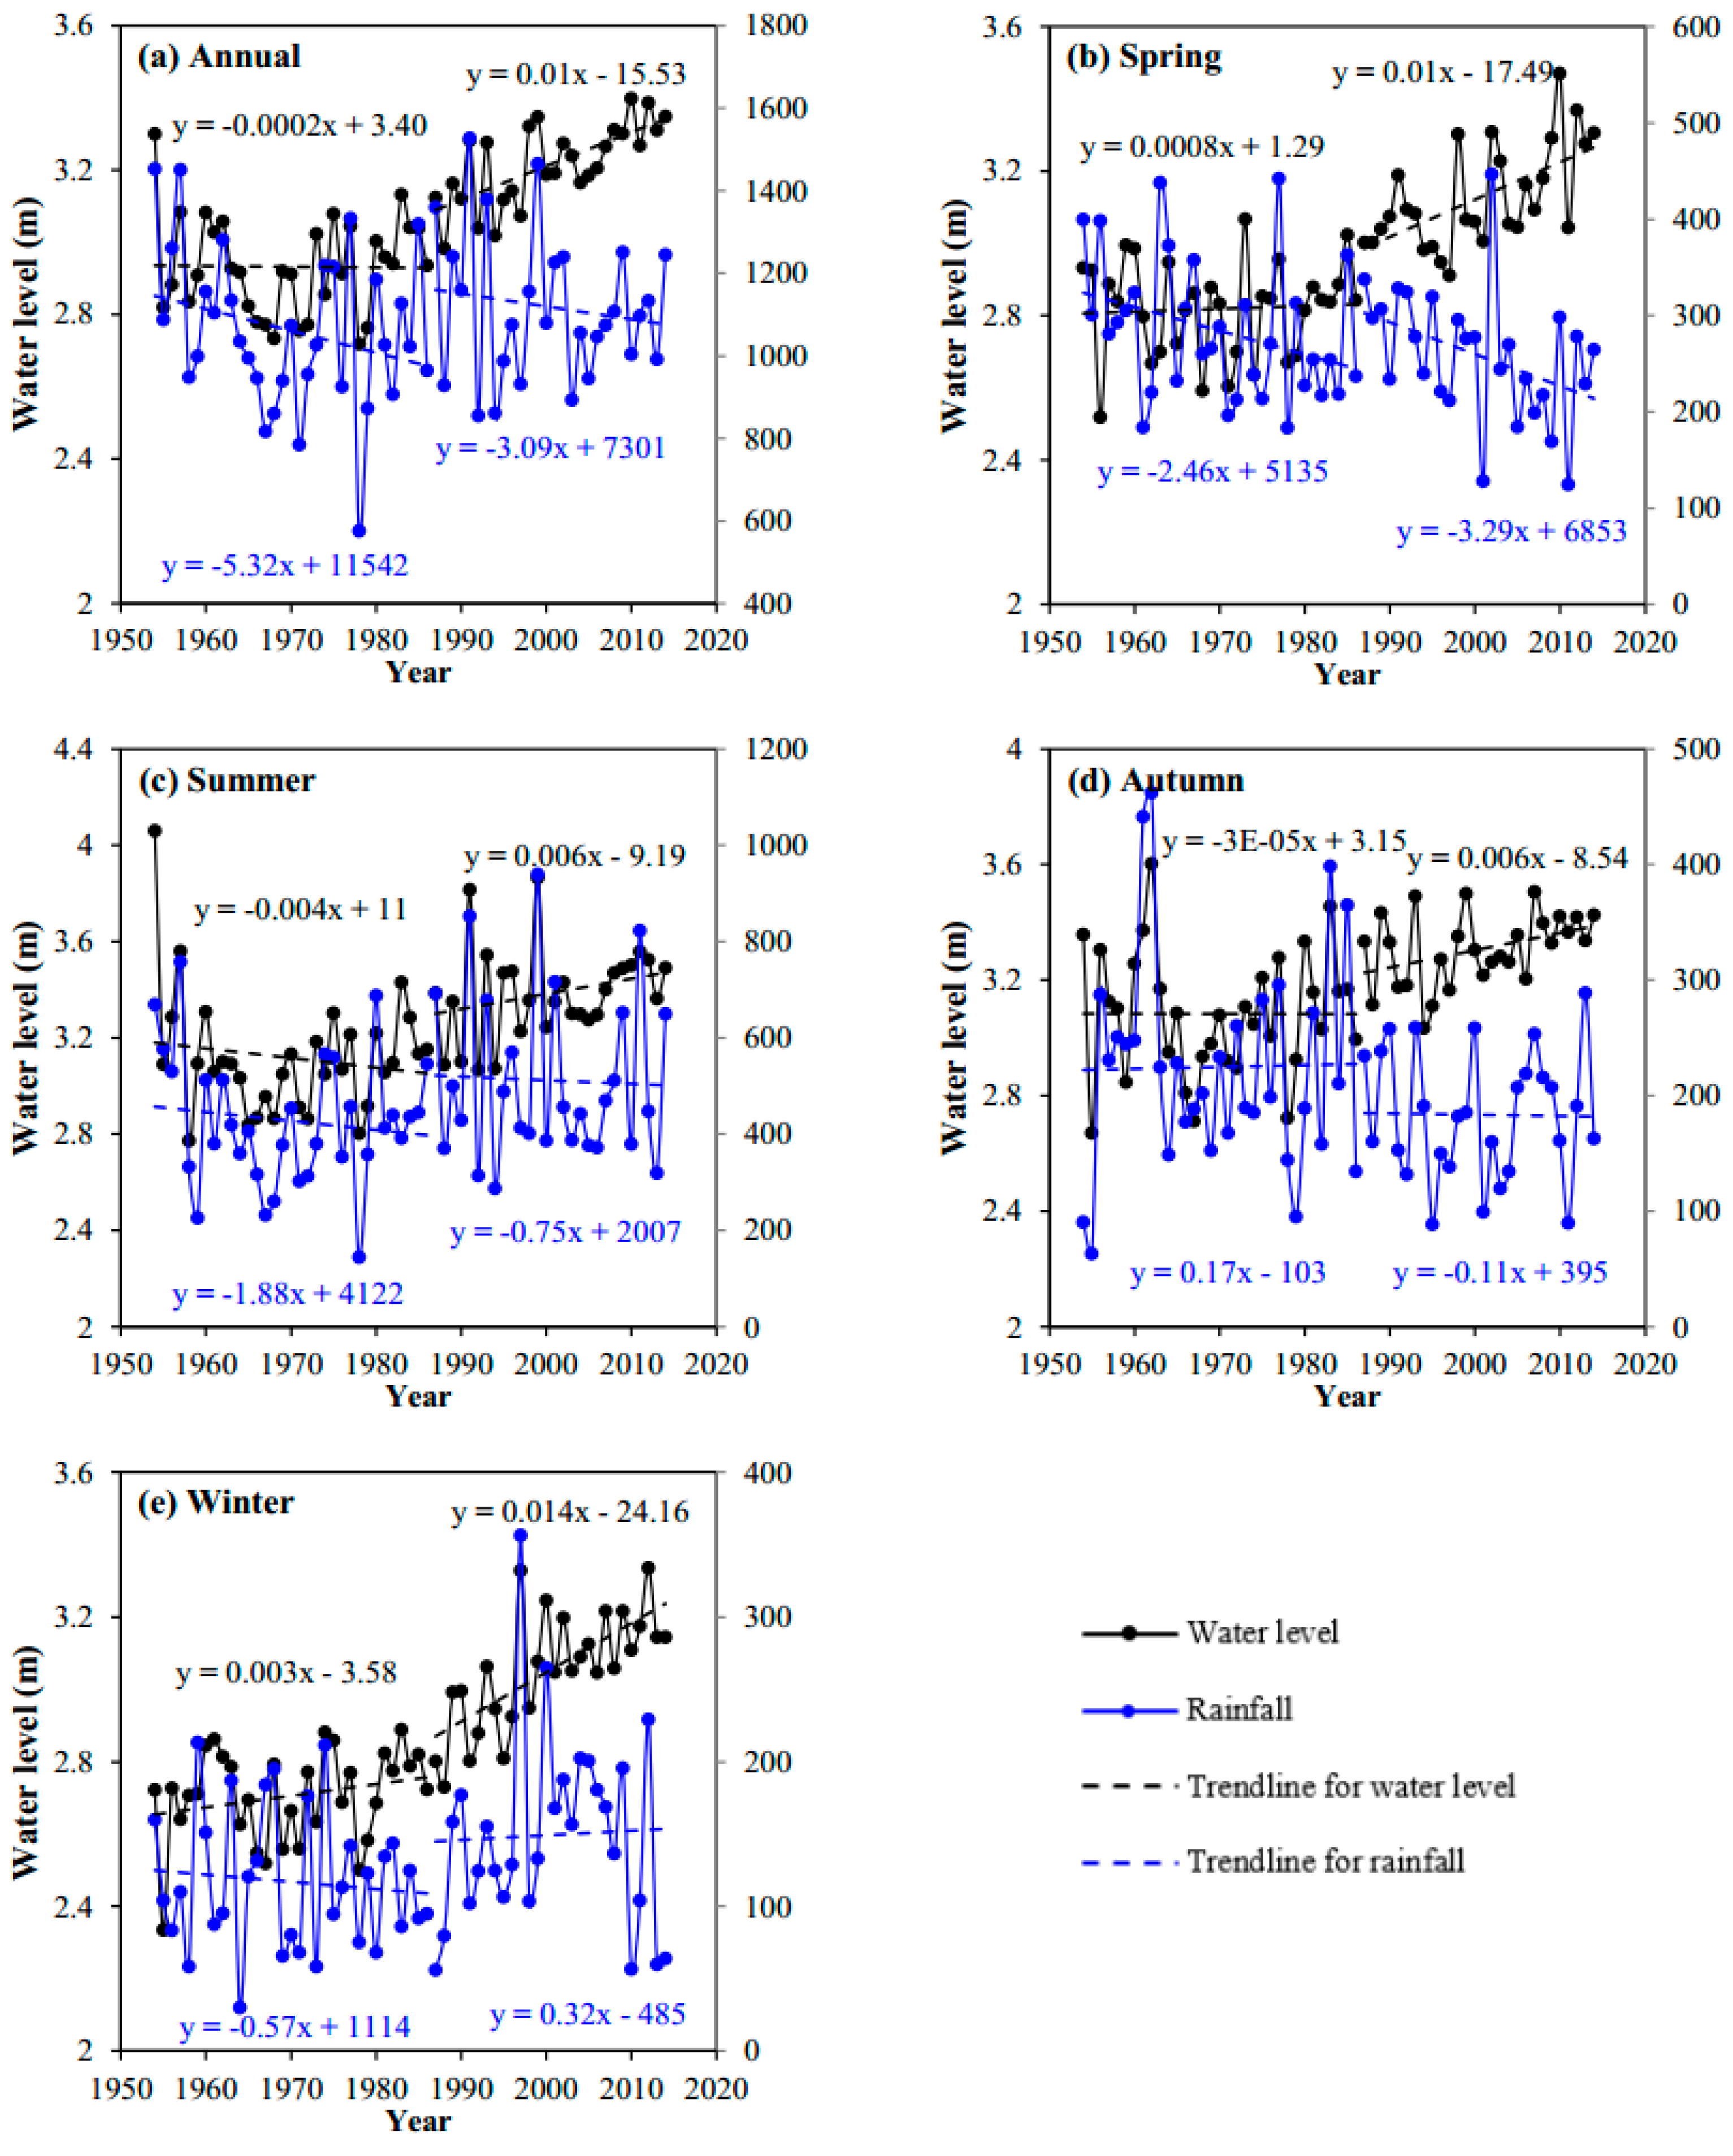
4.1. Variability of Annual and Seasonal Water Level

The variation of regional annual water level and rainfall from 1954 to 2014 was analyzed by linear regression. It can be seen from Figure 2a that an upward trend was detected for annual water level series. Minimum and maximum annual water level occurred in 1978 and 2010, respectively. Further visual inspection of Figure 2a shows the 1970s as a period with a lower water level than other decades, which is related to the shortage of rainfall in this decade. There is an increase in water level during the 1990s, which is related to the abundant rainfall in this decade. On the seasonal scale (Figure 2b–e), there are increasing linear trends in water level for each season. The evolution of water level in JJA similar to that of the annual water level.
The change point detection results show a significant change point at the 95% confidence level in annual water level at around 1988, 1990, and 1988 using the Pettitt, Mann-Kendall, and Sequential Cluster tests, respectively (Table 2). As for seasonal water level, significant abrupt changes are identified in the late 1980s. The change point identified for annual and seasonal water level in the late 1980s is more or less consistent with the beginning of the extensive rapid urbanization in the Taihu Plain.
H0 represents null hypothesis. R represents that H0 is rejected at the 95% confidence level. MAM: March-April-May, JJA: June-July-August, SON: September-October-November, DJF: December-January-February.According to the results, it can be concluded that the Taihu Plain experienced two different hydrological periods with a change point at around the late 1980s. For comparison, the entire study period was split into two sub-periods (baseline and evaluation periods) by the change point year. The Mann-Whitney test was applied for comparing the water level in the two sub-periods (Table 3). The results show that the null hypothesis H0 of the Mann-Whitney test is rejected at the 95% confidence level, implying significant changes in the annual and seasonal water level series between the two sub-periods. The largest shift changes in water level are observed for winter and spring, respectively. To better understand the characteristics of the water level changes, the means and standard deviations of annual and seasonal water level in the two sub-periods were compared. There is an increasing ratio of 9.9% for the mean annual water level in the evaluation period relative to the baseline period. For the seasonal scale, the increasing ratios of water level between the two sub-periods range from 7.5% to 13.3%. In contrast to water level, annual and seasonal rainfall series do not show a significant increase (Figure 2). Thus, we can infer that the significant changes in water level in the Taihu Plain might be influenced by a combination of human activity and climate variability.

4.2. The Relative Impact of Climate Variability and Human Activities on Water Level Changes

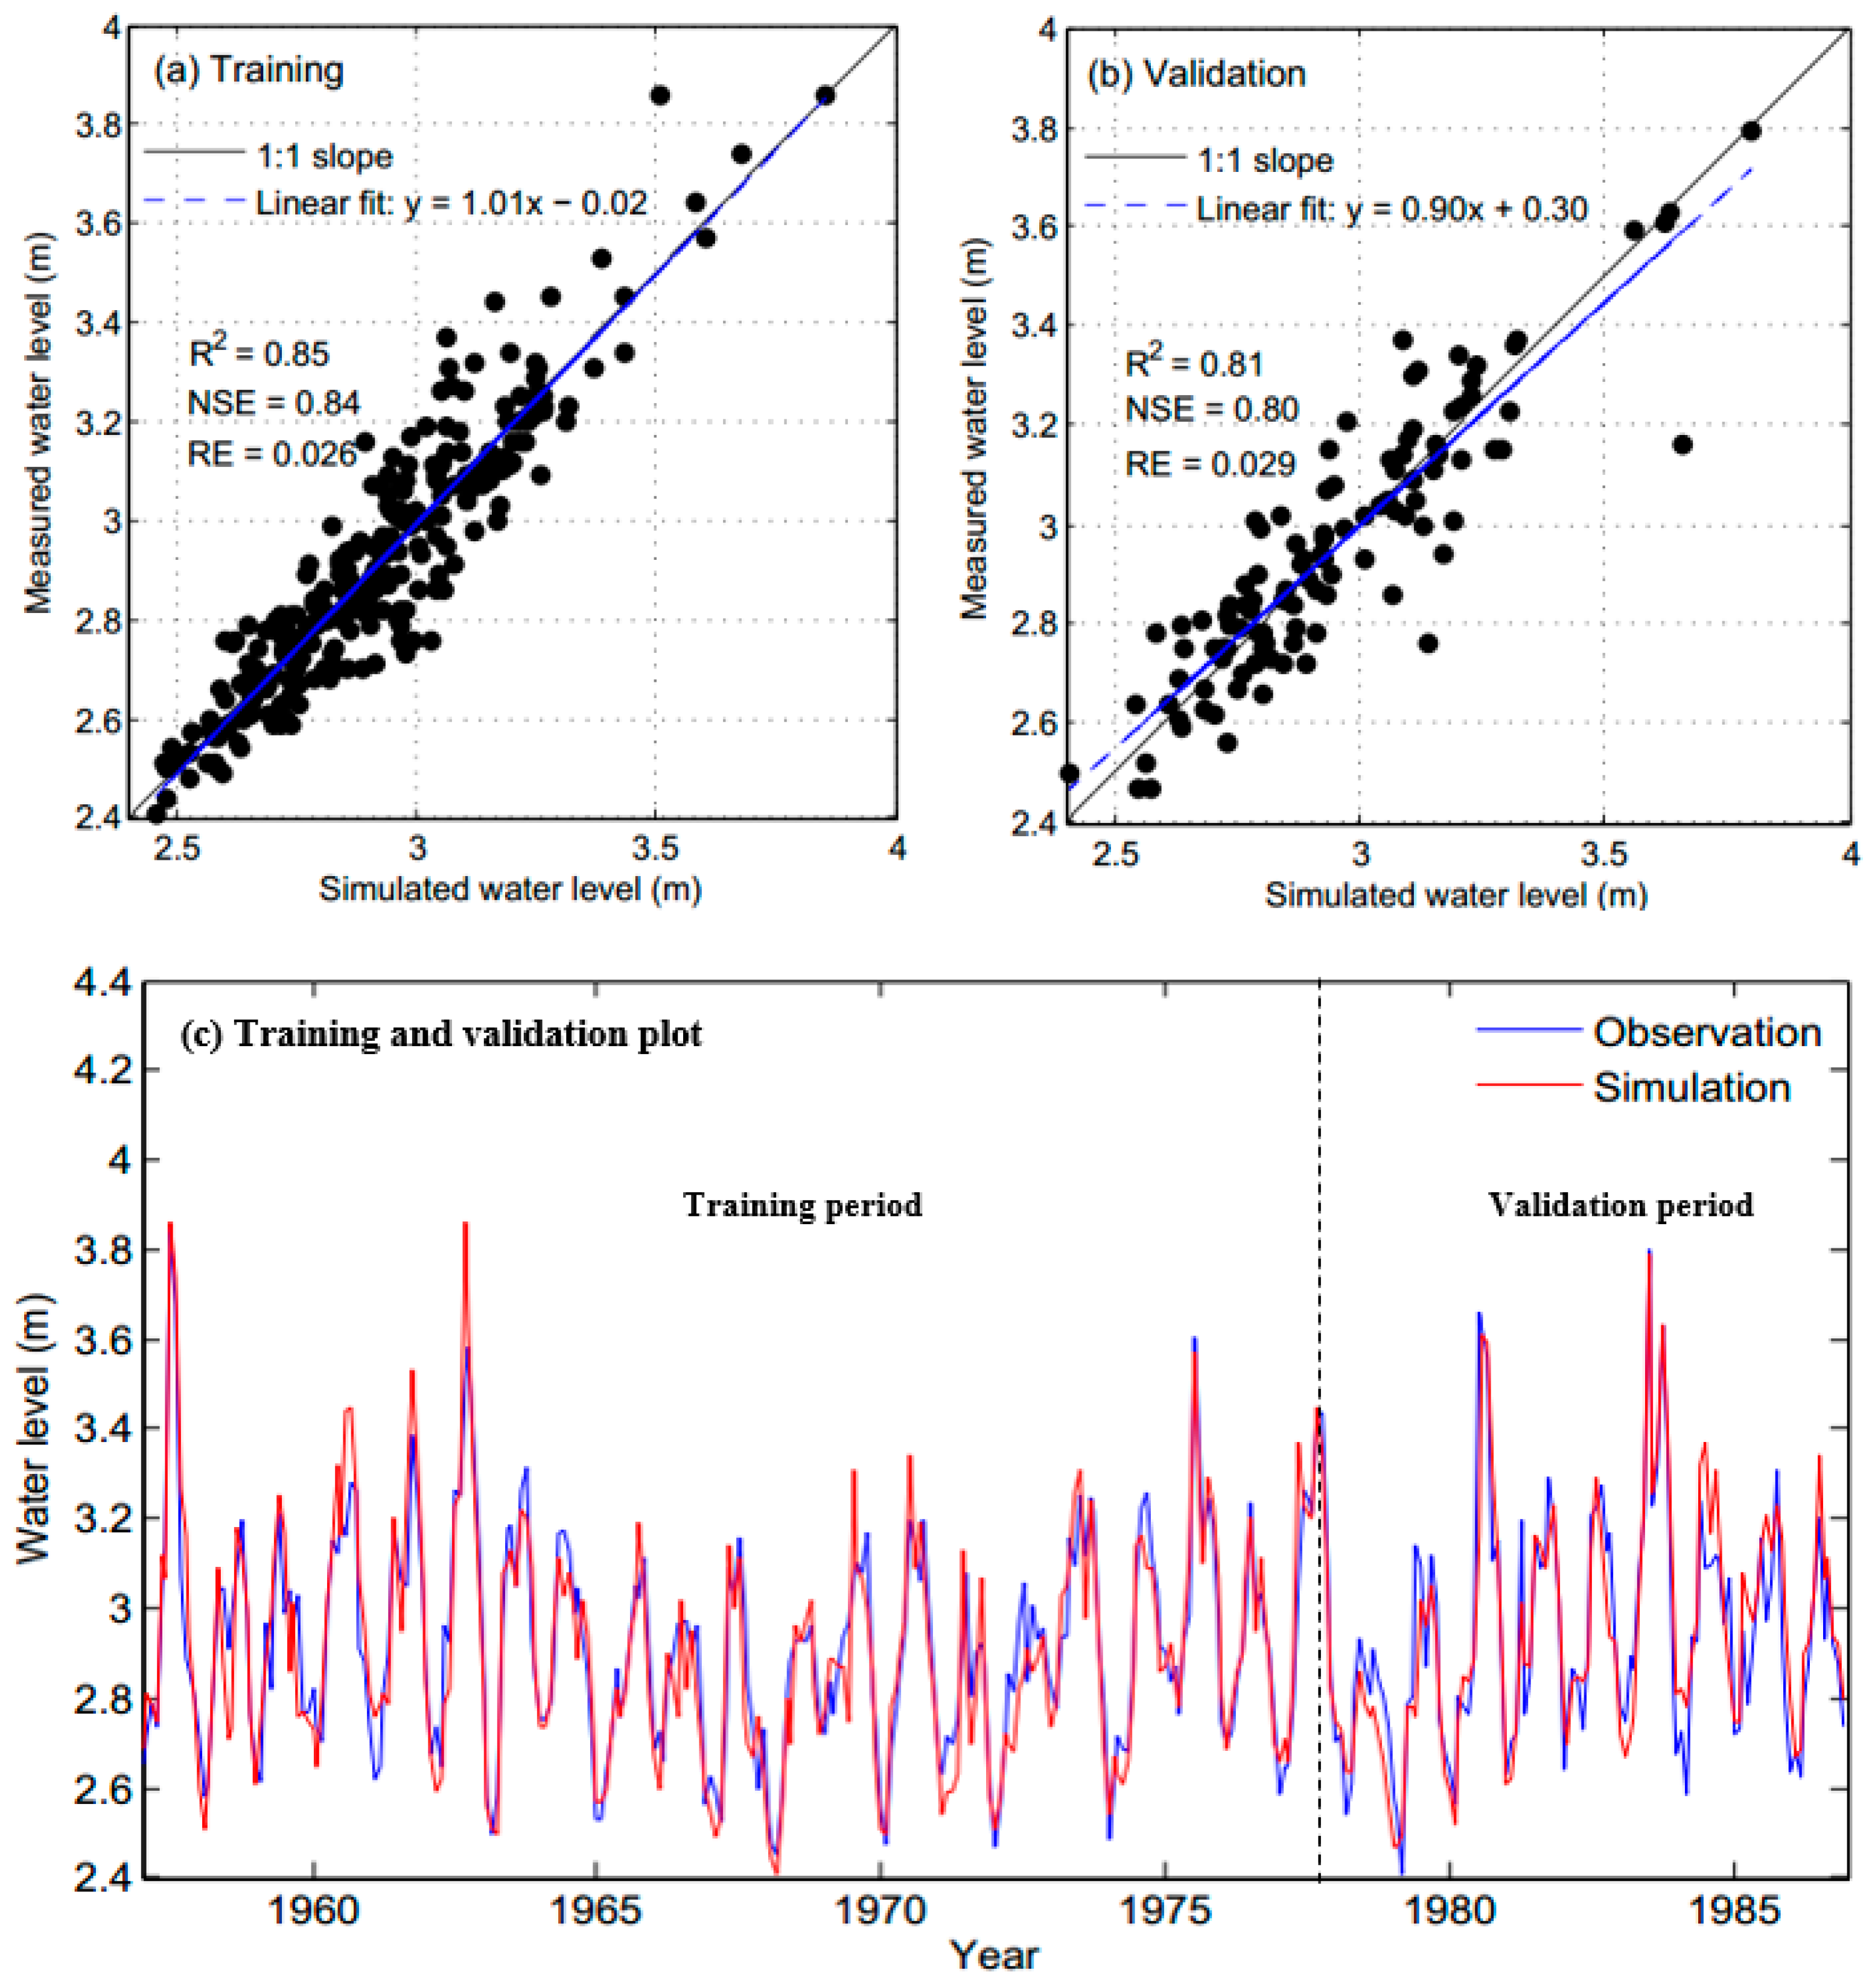
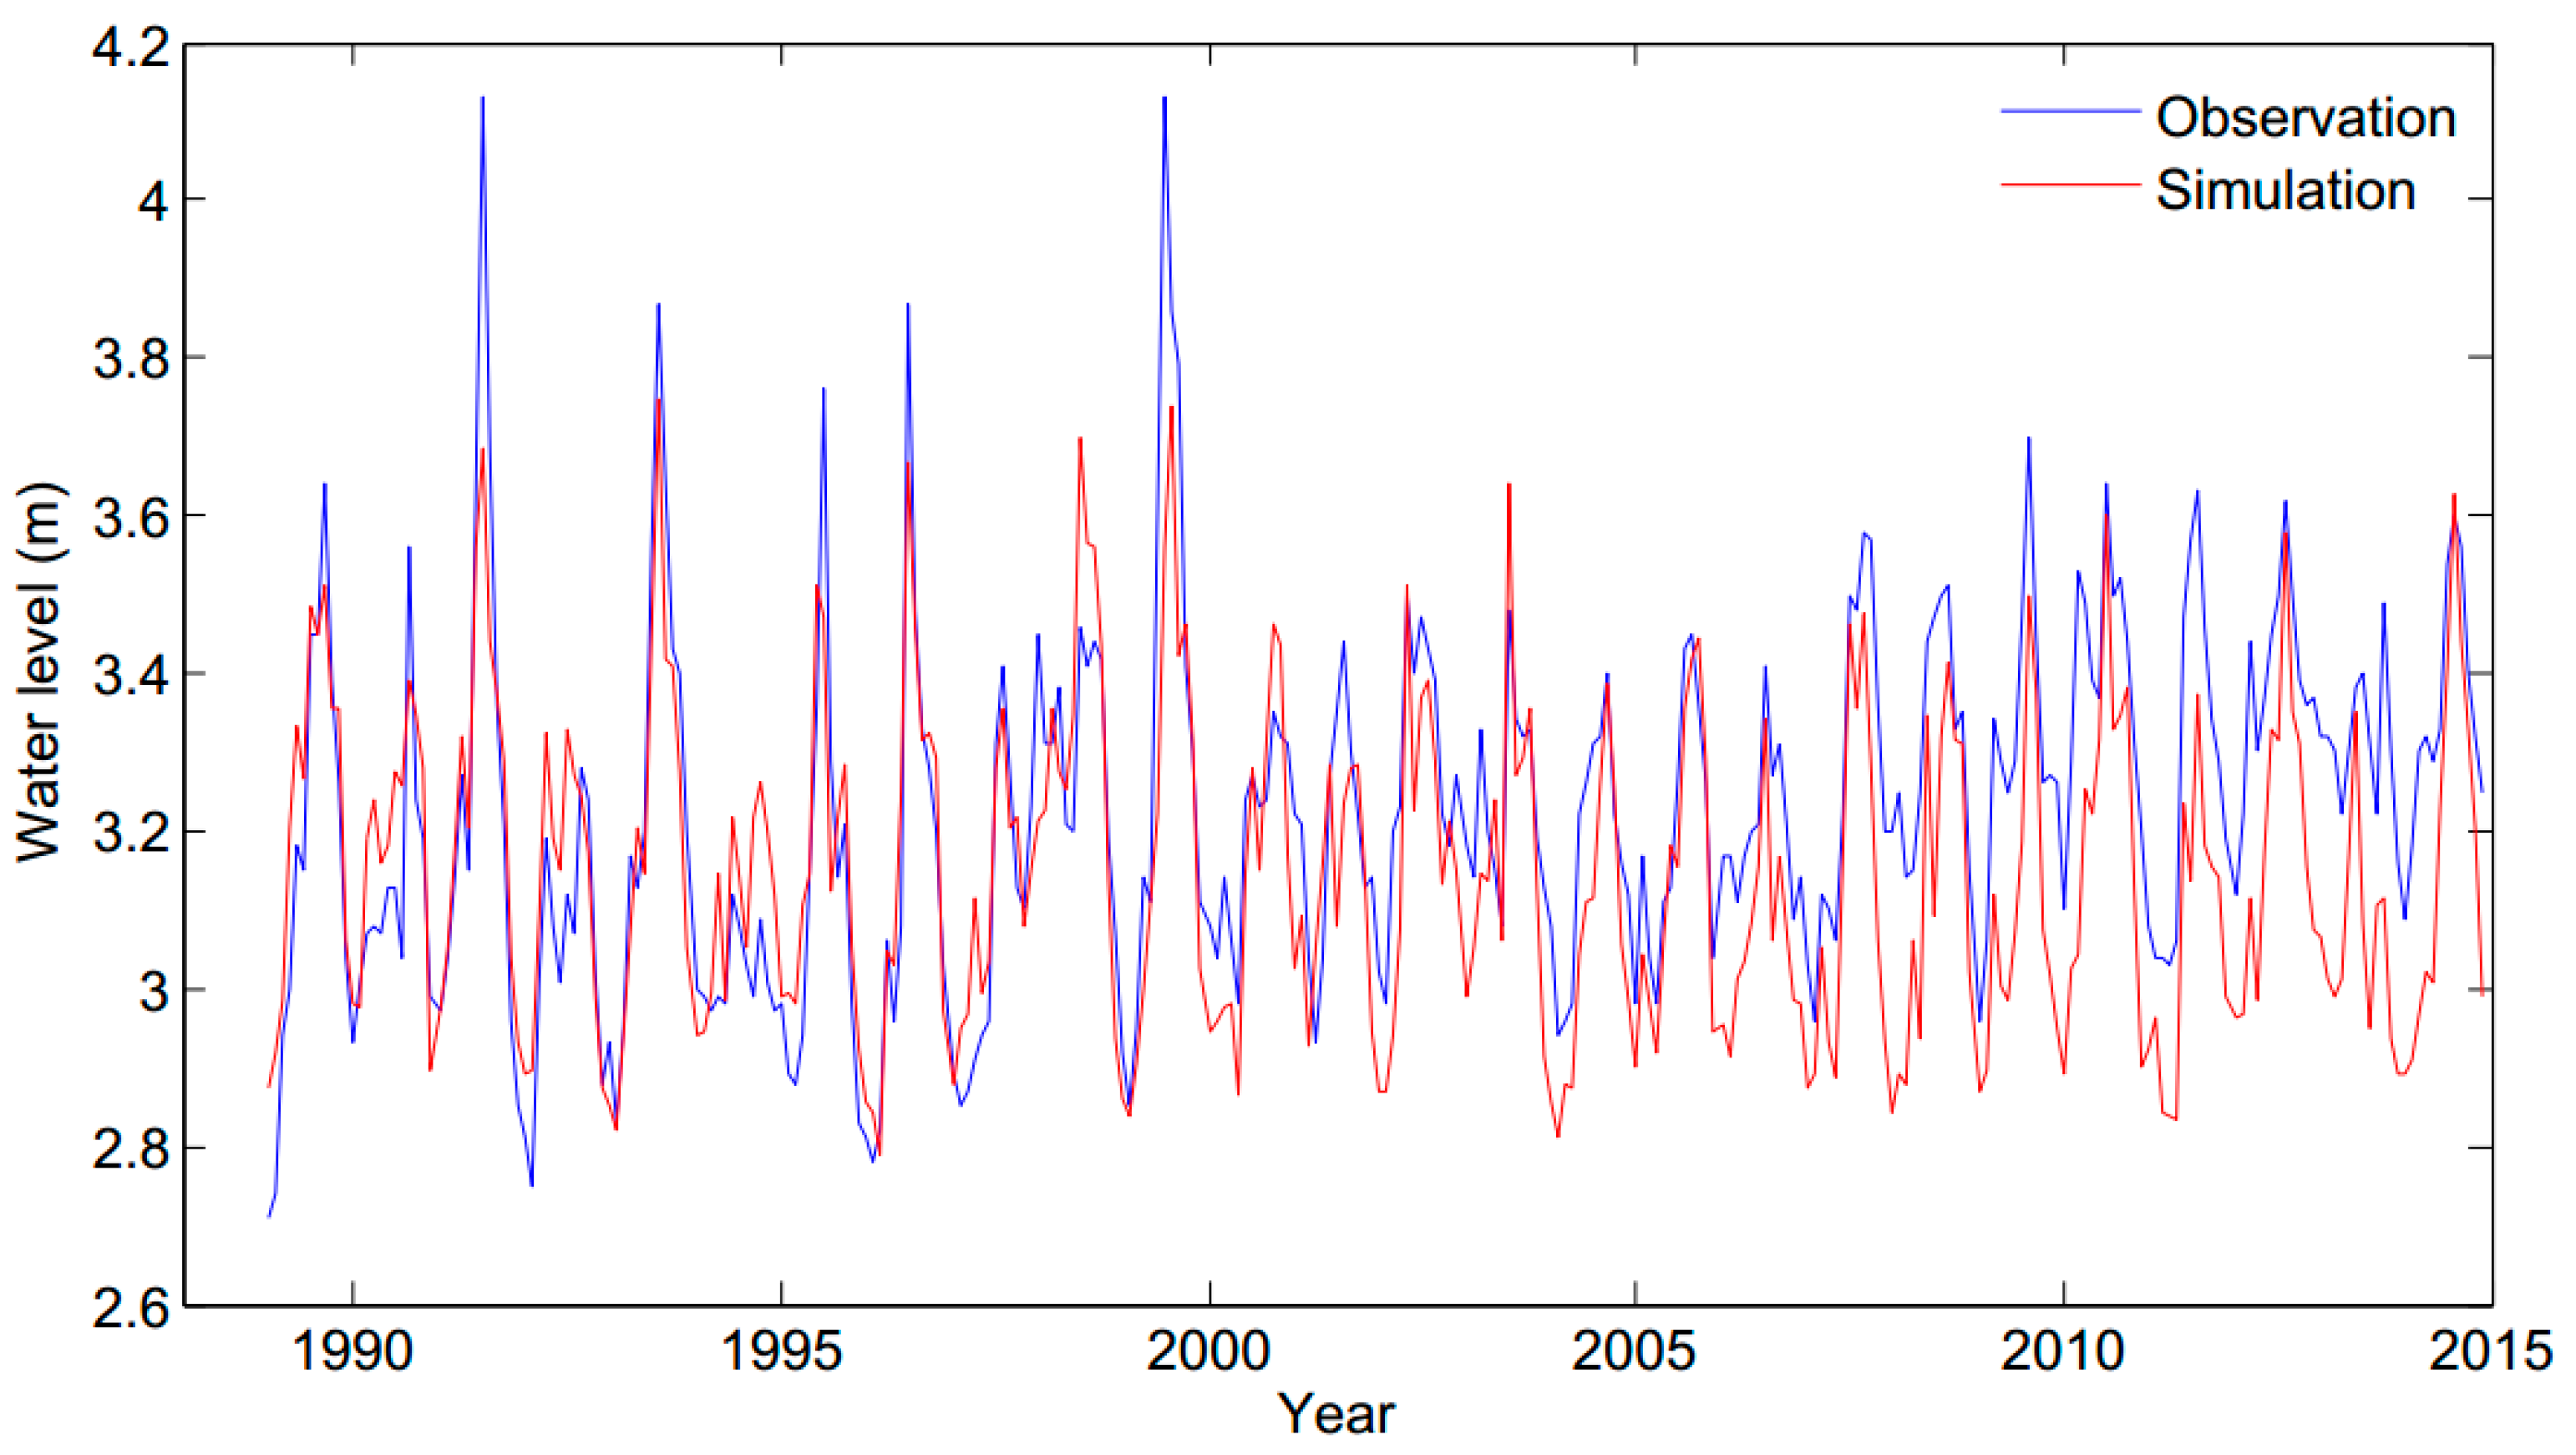
4.2.1. MLP Model Setup

To quantify the relative contribution of climate variability and human activity to water level changes, a monthly scale MLP model was established based on the data in the baseline period. In order to obtain the optimal model, the MLP models with three input combinations were established to estimate monthly water levels (Table 4). Input variables include mean monthly rainfall, evaporation, and tide level. The 70% and 30% of the data in the baseline period were chosen as the training and validation periods of the MLP models, respectively. The optimal number of neurons in the hidden layer is six for all the MLP models. It is evident that the best performed MLP model is the one with all the three variables as input (i.e., MLP3). The MLP3 simulated water level values in both training and validation periods have generally a good consistency with observations. The R2, NSE, and relative error (RE) values are 0.85, 0.84, and 0.026 for the MLP3 for the training period and 0.81, 0.80, and 0.029 for the validation period, respectively (Figure 3). Hence, the validated MLP3 model was selected for the subsequent contribution analysis.

4.2.2. Contribution Analysis to Water Level Changes

Based on the validated MLP3 model, the climate-induced water level series in the evaluation period was simulated. The simulated and observed water level in the evaluation period is exhibited in Figure 4. Comparing the two-time series, there is a high consistency for the peak values, while the low water level is underestimated by the MLP3 model. The difference in low water level during the 2000s is significantly larger than that during the 1990s. The contribution of climate variability and human activities to water level changes is presented in Table 5. Regarding the evaluation period, the contributions of climate variability and human activities to annual water level changes are 69% and 31%, respectively. For each season, the contribution of climate variability is also higher than that of human activities. The contribution of climate variability is beyond 80% for summer and autumn. Thus, it indicates that climate variables play dominant roles in water level variations during the whole evaluation period.
To further investigate the potential influence of climate variability and human activities on water level changes at a decadal scale, the evaluation period was divided into two shorter periods: sub-period I and II referring to the periods before and after 2000, respectively. The results of the attribution analysis become slightly different when we focus on two shorter periods. As shown in Table 5, the contribution of climate variability during the sub-period I is higher than that during the sub-period II for annual and seasonal water level. In other words, the contribution of human activities in the sub-period II becomes larger than that in the sub-period I. As for annual water level, the contribution of human activities (49%) is almost equal to that of climate variability (51%) during the sub-period II. As for each season in the sub-period II, the contribution of human activities during MAM (73%) and DJF (53%) is even beyond that of climate variability. Similar results also can be found in Figure 4 that the observed water level in MAM and DJF is larger than the simulated water level, especially after 2000. Overall, although climate variability plays dominant roles in water level variations, human activities also have an increasing impact in recent years, especially for MAM and DJF.

4.3. Discussion

4.3.1. Impacts of Human Activities on Water Level Changes

In this study, three popular methods were employed to identify change points in annual and seasonal water level across the Taihu Plain. It is clear that abrupt changes of water level occurred in the late 1980s, which are consistent with previous studies using the Mann-Kendall test by Yin et al. [54] and Xu et al. [22]. Although previous studies showed that the increasing anthropogenic perturbations have significant effects on water level alteration since the 1980s in the Taihu Plain, few studies have so far investigated their relative quantitative contribution. In our study, a validated MLP-based model was used to investigate the individual impact of climatic and anthropogenic factors on water level changes during the evaluation period (1988–2014). The evaluation period was also divided into two shorter periods (1990s and 2010s) in order to investigate the contribution of recent human activities to water level variation.
Due to urban development, intensive human activities have taken place within the Taihu Plain since the late 1980s, including hydraulic construction, land use change, and river reduction [9,35,55]. For the sake of managing water resources and flood, a large number of hydraulic structures (pump, sluices, and dikes) have been constructed along the rivers after devastating floods in 1991 and 1999 [56,57,58]. The increasing trend of hydraulic structure construction since the 1980s can be seen in Figure 5. The total number of hydraulic structures has reached 2468 in the 2000s. The capacity of water abstraction for water management across the entire region has been enhanced significantly after 1989, which is almost consistent with the identified change point in the water level series. The alteration of the hydrological regime in the Taihu Plain due to these hydraulic structures has been shown by several studies [25,39]. The water abstraction from the Yangtze River to the Taihu Plain through pumping stations has been mainly concentrated during the dry season (from September to April) since 2000 [59,60]. Besides, it is worthy of noting that many polders are distributed across the Taihu Plain, and most of them are set up with high-power pumping stations and sluices since the devastating flood in 1991 [39]. A large number of abstracted water from the Yangtze River is first stored in the river network of the Taihu Plain and then pumped into polders according to their individual demand in the dry season. Although a part of water resources is abstracted into polders for agricultural irrigation and water quality improvement, a high water level is kept in the river network. Thus, we can conclude that engineering operation plays an important role in water level changes during the dry season. The same results are confirmed by our contribution analysis showing a larger contribution of human activities during MAM and DJF.
In addition to the hydraulic structure construction, the land use of the Taihu Plain has also altered dramatically due to the rapid urbanization. The general trend of land use in this region was characterized mainly by a reduced cultivated land and increased urbanized land, causing a significant increase in the effective impervious area and thereby a larger runoff coefficient [35]. As shown in Figure 6, the proportion of the urbanized land increased by 1751 km2 with an annual growth rate of 56.48 km2 per year, while that of paddy land decreased from 74% in 1990 to 42% in 2010. It should be noted that the increase rate of urbanized land from 2000 to 2010 is much higher than that from 1990 to 2000, which might have accelerated the rainfall-runoff process in the 2000s compared with the 1990s [61,62]. In addition, the reduction of river and lake also has an influence on hydrological regimes to some extent. Urbanization has accelerated the disappearance of lakes and river networks, which reduces river storage capacity [63,64,65]. The river density and water surface ratio decreased by 17% and 19% over the past 50 years, respectively [24]. The reduction of rivers and lakes could lead to excess runoff, exceeding the present channel capacity, and increase the possibility of flood disasters.
Overall, the impact of these human activities on the water level changes is coexistent and complicated. However, it can be inferred from the results that the construction of hydraulic structures is the most important driving factor in recent years, which can cause dramatic changes in water level. Especially, land use change and river reduction are gradual processes whose impacts on water level can accumulate gradually. Therefore, scientific considerations of engineering operations, land development, and river protection are very necessary for future basin management practices.

4.3.2. Limitations and Recommendations for Future Research

In this study, the sub-series before the identified change point was used as the baseline period to analyze the relative impacts of climate variability and human activity in the evaluation period, which is because the intensity of human activity is relatively small in the baseline period. Some uncertainties exist in the attribution analysis when separating the impacts of climate variability and human activity on water level changes. Firstly, due to limited long-term observation data in the Taihu Plain, the performance of attribution analysis depends on the water level of the baseline period, with no effect of human activity on the model’s calibration. In reality, some human disturbances, such as agricultural irrigation, land use changes, and river regulations, still existed during the baseline period. Hence, the contribution of human activities can be slightly overestimated, although the calibrated ANN model well reflects the water level evolution during the baseline period. Secondly, the employed attribution analysis method assumes that climate and human activity are independent of each other, while climate and human activity interact with each other especially in a catchment scale [66]. In addition, the ANN-based attribution analysis highly depends on the quality of rainfall, tide, and evaporation measurements and estimates. The tide (evaporation) data from Jiangyin (Dongshan) station in the study area might not be representative of the entire region. The possible influences of the assumptions and data error on the attribution results are yet to be investigated in future research.

5. Conclusions

In this study, the relative impacts of climate variability and human activities on water level changes across the Taihu Plain were investigated based on statistical analysis and modeling approach. Several popular methods were used to detect change points in annual and seasonal water level time series to determine the baseline period, and then a monthly scale MLP model was established and used for the attribution analysis.
Significant upward trends were detected for annual and seasonal water level. The abrupt change of water level mainly occurred in the late 1980s, which corresponds to the beginning of intensive human activities in this region. For the whole evaluation period, climate variability is the dominant driver for water level changes, accounting for a 69% contribution to annual water level changes versus a 31% contribution of human activities. However, further attribution analysis for two sub-periods of the evaluation period reveals that the contribution of human activities to water level changes in the 2000s is higher than that in the 1990s. Especially for the dry season (MAM and DJF), human activities have become the dominant factors during the 2000s.
The present study focused on evaluating individual impacts of climatic and anthropogenic factors on long-term water level variations. Compared with previous studies, this study provided some new insights on the impact of human activities on annual and seasonal water level variations and proposed the use of nonlinear ANN models for attribution analyses. Although different kinds of human activities are interconnected across the Taihu Plain, yet abrupt changes in water level are basically synchronized with the time of hydraulic construction, with more noticeable effects of engineering operations during the dry season (MAM and DJF). Moreover, the individual impact of each driving force could be more informative for designing countermeasures compared to the combined impacts. Such information is helpful for water resources managers for risk mitigation planning for flood and drought disasters. Additionally, considering the impacts of multiple human activities on the water level, further studies are needed to analyze the contribution of individual anthropogenic activities on water level changes based on coupling hydrological and hydraulic models. Such studies will be beneficial to identify the most important driver for water level changes in order to achieve sustainable watershed management under climate change and extensive human activities.

Author Contributions

Y.W. preformed results analysis and wrote the paper. H.T. advised on the methodologies and corrected the manuscript. Y.X. (Youpeng Xu), Y.X. (Yu Xu) and Q.W. gave comments and improved the manuscript.

Funding

This work was funded by the National Key Technology Support Program (No. 2018YFC1508201), the National Natural Science Foundation of China (No. 41771032), the Water Conservancy Science and Technology Foundation of Jiangsu Province (No. 2015003), and the Program of China Scholarship Council (2016); the Program B for Outstanding PhD candidate of Nanjing University (201702B066).

Acknowledgments

The authors would like to thank the Taihu Basin Authority of China for providing the observed water level and rainfall data. Besides, our cordial gratitude should be extended to the editor, Vanessa Sun, and three anonymous reviewers for their professional comments and suggestions which were greatly helpful for the quality improvement of this manuscript.

Conflicts of Interest

The authors declare no conflict of interest.

References

  1. Milly, P.; Wetherald, R.; Dunne, K.; Delworth, T. Increasing risk of great floods in a changing climate. Nature 2002, 415, 514–517. [Google Scholar] [CrossRef]
  2. Seyoum, W.; Milewski, A.; Durham, M. Understanding the relative impacts of natural processes and human activities on the hydrology of the central rift valley lakes, east Africa. Hydrol. Process. 2015, 29, 4312–4324. [Google Scholar] [CrossRef]
  3. Dey, P.; Mishra, A. Separating the impacts of climate change and human activities on streamflow: A review of methodologies and critical assumptions. J. Hydrol. 2017, 548, 278–290. [Google Scholar] [CrossRef]
  4. Li, C.; Wang, L.; Wang, W.; Qi, J.; Yang, L.; Zhang, Y.; Wu, L.; Cui, X.; Wang, P. An analytical approach to separate climate and human contributions to basin streamflow variability. J. Hydrol. 2018, 559, 30–42. [Google Scholar] [CrossRef]
  5. Hannaford, J.; Buys, G.; Stahl, K.; Tallaksen, L.M. The influence of decadal-scale variability on trends in long European streamflow records. Hydrol. Earth Syst. Sci. 2013, 17, 2717–2733. [Google Scholar] [CrossRef] [Green Version]
  6. Wang, Y.; Chen, X.; Ying, C.; Liu, M.; Gao, L. Flood/drought event identification using an effective indicator based on the correlations between multiple time scales of the standardized precipitation index and river discharge. Theor. Appl. Climatol. 2017, 128, 159–168. [Google Scholar] [CrossRef]
  7. Wang, Y.; Xu, Y.; Lei, C.; Li, G.; Han, L.; Song, S.; Yang, L.; Deng, X. Spatio-temporal characteristics of precipitation and dryness/wetness in Yangtze River Delta, eastern China, during 1960–2012. Atmos. Res. 2016, 173, 196–205. [Google Scholar] [CrossRef]
  8. Lai, X.; Jiang, J.; Yang, G.; Lu, X.X. Should the Three Gorges Dam be blamed for the extremely low water levels in the middle-lower Yangtze River? Hydrol. Process. 2014, 28, 150–160. [Google Scholar] [CrossRef]
  9. Song, S.; Xu, Y.P.; Zhang, J.X.; Li, G.; Wang, Y.F. The long-term water level dynamics during urbanization in plain catchment in Yangtze River Delta. Agric. Water Manag. 2016, 174, 93–102. [Google Scholar] [CrossRef]
  10. Das, M.; Ghosh, S.K.; Chowdary, V.M.; Saikrishnaveni, A.; Sharma, R.K. A probabilistic nonlinear model for forecasting daily water level in reservoir. Water Resour. Manag. 2016, 30, 3107–3122. [Google Scholar] [CrossRef]
  11. Chen, Y.D.; Zhang, Q.; Xu, C.-Y.; Yang, T.; Chen, X.; Jiang, T. Change-point alterations of extreme water levels and underlying causes in the Pearl River Delta, China. River Res. Appl. 2009, 25, 1153–1168. [Google Scholar] [CrossRef]
  12. Seo, Y.; Kim, S.; Kisi, O.; Singh, V.P. Daily water level forecasting using wavelet decomposition and artificial intelligence techniques. J. Hydrol. 2015, 520, 224–243. [Google Scholar] [CrossRef]
  13. Doell, P.; Zhang, J. Impact of climate change on freshwater ecosystems: A global-scale analysis of ecologically relevant river flow alterations. Hydrol. Earth Syst. Sci. 2010, 14, 783–799. [Google Scholar] [CrossRef]
  14. Ye, X.; Xu, C.Y.; Zhang, Q.; Yao, J.; Li, X. Quantifying the human induced water level decline of China’s largest freshwater lake from the changing underlying surface in the lake region. Water Resour. Manag. 2018, 32, 1467–1482. [Google Scholar] [CrossRef]
  15. Yamazaki, D.; Lee, H.; Alsdorf, D.E.; Dutra, E.; Kim, H.; Kanae, S.; Oki, T. Analysis of the water level dynamics simulated by a global river model: A case study in the Amazon River. Water Resour. Res. 2012, 48. [Google Scholar] [CrossRef] [Green Version]
  16. Assani, A.; Landry, R.; Biron, S.; Frenette, J. Analysis of the interannual variability of annual daily extreme water levels in the St Lawrence River and Lake Ontario from 1918 to 2010. Hydrol. Process. 2014, 28, 4011–4022. [Google Scholar] [CrossRef]
  17. Zhao, Y.; Zou, X.; Gao, J.; Xu, X.; Wang, C.; Tang, D.; Wang, T.; Wu, X. Quantifying the anthropogenic and climatic contributions to changes in water discharge and sediment load into the sea: A case study of the Yangtze River, China. Sci. Total Environ. 2015, 536, 803–812. [Google Scholar] [CrossRef] [PubMed]
  18. Yuan, Y.; Zeng, G.; Liang, J.; Huang, L.; Hua, S.; Li, F.; Zhu, Y.; Wu, H.; Liu, J.; He, X.; et al. Variation of water level in Dongting Lake over a 50-year period: Implications for the impacts of anthropogenic and climatic factors. J. Hydrol. 2015, 525, 450–456. [Google Scholar] [CrossRef]
  19. Shao, G.; Guan, Y.; Zhang, D.; Yu, B.; Zhu, J. The impacts of climate variability and land use change on streamflow in the Hailiutu river basin. Water 2018, 10, 814. [Google Scholar] [CrossRef]
  20. Tian, L.; Jin, J.; Wu, P.; Niu, G. Quantifying the impact of climate change and human activities on streamflow in a semi-arid watershed with the budyko equation incorporating dynamic vegetation information. Water 2018, 10, 1781. [Google Scholar] [CrossRef]
  21. Zhang, W.; Yan, Y.; Zheng, J.; Li, L.; Dong, X.; Cai, H. Temporal and spatial variability of annual extreme water level in the Pearl River Delta region, China. Glob. Planet. Chang. 2009, 69, 35–47. [Google Scholar] [CrossRef]
  22. Xu, G.; Xu, Y.; Luo, X.; Xu, H.; Xu, X.; Hu, C. Temporal and spatial variation of water level in urbanizing plain river network region. Water Sci. Technol. 2014, 69, 2191–2199. [Google Scholar] [CrossRef] [PubMed]
  23. Cochrane, T.A.; Arias, M.E.; Piman, T. Historical impact of water infrastructure on water levels of the Mekong River and the Tonle Sap system. Hydrol. Earth Syst. Sci. 2014, 18, 4529–4541. [Google Scholar] [CrossRef]
  24. Deng, X.; Xu, Y.; Han, L.; Yang, M.; Yang, L.; Song, S.; Li, G.; Wang, Y. Spatial-temporal evolution of the distribution pattern of river systems in the plain river network region of the Taihu Basin, China. Quat. Int. 2016, 392, 178–186. [Google Scholar] [CrossRef]
  25. Liu, L.; Xu, Z.; Reynard, N.; Hu, C.; Jones, R. Hydrological analysis for water level projections in Taihu Lake, China. J. Flood Risk Manag. 2013, 6, 14–22. [Google Scholar] [CrossRef]
  26. Wang, L.; Cai, Y.; Chen, H.; Daler, D.; Zhao, J.; Yang, J. Flood disaster in Taihu Basin, China: Causal chain and policy option analyses. Environ. Earth Sci. 2010, 63, 1119–1124. [Google Scholar] [CrossRef]
  27. Wang, Y.; Song, H.; Chao, Y.; Chang, H. The flood risk and flood alleviation benefit of land use management in Taihu Basin. J. Hydraul. Eng. 2013, 44, 327–335. (In Chinese) [Google Scholar]
  28. Govindaraju, R.S.; Rao, A.R. Artificial Neural Networks in Hydrology; Springer Science & Business Media: Berlin, Germany, 2013. [Google Scholar]
  29. Singh, A.; Imtiyaz, M.; Isaac, R.K.; Denis, D.M. Comparison of soil and water assessment tool (SWAT) and multilayer perceptron (MLP) artificial neural network for predicting sediment yield in the Nagwa agricultural watershed in Jharkhand, India. Agric. Water Manag. 2012, 104, 113–120. [Google Scholar] [CrossRef]
  30. Tabari, H.; Talaee, P.H. Multilayer perceptron for reference evapotranspiration estimation in a semiarid region. Neural Comput. Appl. 2013, 23, 341–348. [Google Scholar] [CrossRef]
  31. Moghim, S.; Bras, R. Bias correction of climate modeled temperature and precipitation using artificial neural networks. J. Hydrometeorol. 2017, 18, 1867–1884. [Google Scholar] [CrossRef]
  32. Kisi, O.; Yaseen, Z.M. The potential of hybrid evolutionary fuzzy intelligence model for suspended sediment concentration prediction. Catena 2019, 174, 11–23. [Google Scholar] [CrossRef]
  33. Yang, M.; Xu, Y.; Pan, G.; Han, L. Impacts of urbanization on precipitation in Taihu Lake Basin, China. J. Hydrol. Eng. 2014, 19, 739–746. [Google Scholar] [CrossRef]
  34. Yuan, J.; Xu, Y.; Wu, L.; Wang, J.; Wang, Y.; Xu, Y.; Dai, X. Variability of precipitation extremes over the Yangtze River Delta, eastern China, during 1960–2016. Theor. Appl. Climatol. 2019, 1–15. [Google Scholar] [CrossRef]
  35. Ning, J.; Liu, G.; Liu, Q.; Xie, C. Land use change and ecological environment evolution in Taihu Lake basin. In Proceedings of the 18th International Conference on Geoinformatics, Beijing, China, 18–20 June 2010. [Google Scholar]
  36. National Bureau of Statistics of Jiangsu. Jiangsu Statistical Yearbook 2015; China Statistics Press: Beijing, China, 2015. (In Chinese)
  37. Chen, Z.; Wang, Z. Yangtze Delta, China: Taihu lake-level variation since the 1950s, response to sea-level rise and human impact. Environ. Geol. 1999, 37, 333–339. [Google Scholar] [CrossRef]
  38. Wei, W.; Tang, Z.; Dai, Z.; Lin, Y.; Ge, Z.; Gao, J. Variations in tidal flats of the Changjiang (Yangtze) estuary during 1950s–2010s: Future crisis and policy implication. Ocean Coast. Manag. 2015, 108, 89–96. [Google Scholar] [CrossRef]
  39. Cheng, X.; Evans, E.; Wu, H.; Thorne, C.; Han, S.; Simm, J.; Hall, J. A framework for long-term scenario analysis in the Taihu Basin, China. J. Flood Risk Manag. 2013, 6, 3–13. [Google Scholar] [CrossRef]
  40. Pettitt, A.N. A non-parametric approach to the change-point problem. Appl. Stat. 1979, 28, 126–135. [Google Scholar] [CrossRef]
  41. Sneyers, R. On the Statistical Analysis of Series of Observations; World Meteorological Organization: Geneva, Switzerland, 1990. [Google Scholar]
  42. Mann, H. Nonparametric tests against trend. Econometrica 1945, 13, 245–259. [Google Scholar] [CrossRef]
  43. Kendall, M.G. Rank Correlation Methods; Charles Griffin Book Series; Oxford University Press: Oxford, UK, 1975. [Google Scholar]
  44. Shifteh Some’e, B.; Ezani, A.; Tabari, H. Spatiotemporal trends and change point of precipitation in Iran. Atmos. Res. 2012, 113, 1–12. [Google Scholar] [CrossRef]
  45. Tabari, H.; Taye, M.; Willems, P. Statistical assessment of precipitation trends in the upper Blue Nile River basin. Stoch. Environ. Res. Risk Assess 2015, 29, 1751–1761. [Google Scholar] [CrossRef]
  46. Milad, N.; Mohammad, B. Spatiotemporal changes in aridity index and reference evapotranspiration over semi-arid and humid regions of Iran: Trend, cause, and sensitivity analyses. Theor. Appl. Climatol. 2018, 1–12. [Google Scholar] [CrossRef]
  47. Wang, G.; Zhang, J.; He, R.; Jiang, N.; Jing, X. Runoff reduction due to environmental changes in the Sanchuanhe river basin. Int. J. Sediment Res. 2008, 23, 174–180. [Google Scholar] [CrossRef]
  48. Tabari, H.; Marofi, S.; Sabziparvar, A. Estimation of daily pan evaporation using artificial neural network and multivariate non-linear regression. Irrig. Sci. 2010, 28, 399–406. [Google Scholar] [CrossRef]
  49. Rezaeianzadeh, M.; Stein, A.; Tabari, H.; Abghari, H.; Jalalkamali, N.; Zia Hosseinipour, E.; Singh, V.P. Comparative assessment of a conceptual hydrological model and artificial neural networks for daily outflows forecasting. Int. J. Environ. Sci. Technol. 2013, 10, 1181–1192. [Google Scholar] [CrossRef]
  50. Mukherjee, A.; Ramachandran, P. Prediction of GWL with the help of GRACE TWS for unevenly spaced time series data in India.: Analysis of Comparative Performances of SVR, ANN and LRM. J. Hydrol. 2018, 147, 4463. [Google Scholar] [CrossRef]
  51. Sajikumar, N.; Thandaveswara, B.S. A non-linear rainfall runoff model using artificial neural network. J. Hydrol. 1999, 216, 32–55. [Google Scholar] [CrossRef]
  52. Tsoukalas, L.H.; Uhrig, R.E. Fuzzy and Neural Approaches in Engineering; Wiley InterScience: New York, NY, USA, 1997. [Google Scholar]
  53. Luk, K.; Ball, J.; Sharma, A. A study of optimal model lag and spatial inputs to artificial neural network for rainfall forecasting. J. Hydrol. 2000, 227, 56–65. [Google Scholar] [CrossRef]
  54. Yin, Y.; Xu, Y.; Chen, Y. Maximum water level of Taihu Lake and its relation to the climate change ang human activities. Resour. Environ. Yangtze Basin 2009, 18, 609–614. (In Chinese) [Google Scholar]
  55. Xu, Y.; Xu, J.; Ding, J.; Chen, Y.; Yin, Y.; Zhang, X. Impacts of urbanization on hydrology in the Yangtze River Delta, China. Water Sci. Technol. 2010, 62, 1221–1229. [Google Scholar] [CrossRef]
  56. Penning-Rowsell, E.; Yanyan, W.; Watkinson, A.; Jiang, J.; Thorne, C. Socioeconomic scenarios and flood damage assessment methodologies for the Taihu Basin, China. J. Flood Risk Manag. 2013, 6, 23–32. [Google Scholar] [CrossRef]
  57. Lin, H.; Cheng, A.; Mei, Q.; Xu, J. Studies on warning water level of Taihu Lake. China Water Resour. 2014, 745, 55–57. (In Chinses) [Google Scholar]
  58. Wang, Y.; Tabari, H.; Xu, Y.; Willems, P. Atmospheric and human induced impacts on temporal variability of water level extremes in the Taihu Basin, China. J. Flood Risk Manag. 2019, 1–14. [Google Scholar] [CrossRef]
  59. Zhang, E.; Savenije, H.; Chen, S.; Chen, J. Water abstraction along the lower Yangtze River, China, and its impact on water discharge into the estuary. Phys. Chem. Earth 2012, 47–48, 76–85. [Google Scholar] [CrossRef]
  60. Liu, W. Water Abstraction along the Yangtze River Downstream from Datong to Estuary and Its Impact on Water Discharge into Estuary. Master’s Thesis, East China Normal University, Shanghai, China, 2016. (In Chinese). [Google Scholar]
  61. Hao, L.; Sun, G.; Liu, Y.; Wan, J.; Qin, M.; Qian, H.; Liu, C.; Zheng, J.; John, R.; Fan, P.; et al. Urbanization dramatically altered the water balances of a paddy field-dominated basin in southern China. Hydrol. Earth Syst. Sci. 2015, 19, 3319–3331. [Google Scholar] [CrossRef] [Green Version]
  62. Wu, J.; Miao, C.; Wang, Y.; Duan, Q.; Zhang, X. Contribution analysis of the long-term changes in seasonal runoff on the Loess Plateau, China using eight Budyko-based methods. J. Hydrol. 2017, 545, 263–275. [Google Scholar] [CrossRef]
  63. Yin, Y.; Xu, Y.; Chen, Y. Relationship between changes of river-lake networks and water levels in typical regions of Taihu Lake Basin, China. Chin. Geogr. Sci. 2012, 22, 673–682. [Google Scholar] [CrossRef]
  64. Yang, L.; Xu, Y.; Han, L.; Song, S.; Deng, X.; Wang, Y. River networks system changes and its impact on storage and flood control capacity under rapid urbanization. Hydrol. Process. 2016, 30, 2401–2412. [Google Scholar] [CrossRef]
  65. Wang, J.; Xu, Y.; Wang, Y.; Yuan, J.; Wang, Q.; Xiang, J. Non-stationarity analysis of extreme water level in response to climate change and urbanization in the Taihu Basin, China. Stoch. Environ. Res. Risk Assess. 2019, 1–14. [Google Scholar] [CrossRef]
  66. Zheng, H.; Zhang, L.; Zhu, R.; Liu, C.; Sato, Y.; Fukushima, Y. Responses of streamflow to climate and land surface change in the headwaters of the Yellow River Basin. Water Resour. Res. 2009, 45. [Google Scholar] [CrossRef] [Green Version]
Figure 1. Location of the study area and the considered gauge stations along with the digital elevation model.
Water 11 00720 g001
Figure 2. Evolution of regional annual and seasonal water level and rainfall in the Taihu Plain from 1954 to 2014. Trendlines were fitted separately to the time series before and after the identified change points (baseline and evaluation periods).
Water 11 00720 g002
Figure 3. Comparison of the observed and the MLP3 simulated monthly water level for training and validation phases for the baseline period (1954–1987). MLP: multilayer perceptron.
Water 11 00720 g003
Figure 4. Comparison between the observed and the MLP3 simulated monthly water level during the evaluation period (1988–2014). MLP: multilayer perceptron.
Water 11 00720 g004
Figure 5. (a) Changes in hydraulic construction and (b) water abstraction capacity in the Taihu Plain.
Water 11 00720 g005
Figure 6. Land use changes across the Taihu Plain from 1990 to 2010.
Water 11 00720 g006
Table 1. Selected stations and their basic properties of annual data.
Station NameMeasuring VariableLongitude (°E)Latitude (°N)Mean Value 1CVPeriod of Record
ChangshuRainfall120.7531.631063.90.201954–2014
Changzhou119.9831.761100.90.201954–2014
Chenshu120.5331.661062.50.191954–2014
Liuhezha121.2731.501099.50.191954–2014
Pingwang120.2731.001129.60.201954–2014
Suzhou120.6331.311113.50.201954–2014
Wuxi120.2831.551112.10.191954–2014
Xiangcheng120.7431.471066.60.191954–2014
Zhangjiagang120.5331.951077.40.211962–2014
Zhouxiang120.9731.401094.20.191954–2014
ChangshuWater level120.7531.643.00.061954–2014
Changzhou119.9831.773.30.061954–2014
Chenmu120.8831.182.60.071962–2014
Pingwang120.6331.002.90.061954–2014
Qingyang120.2531.753.20.081954–2014
Suzhou120.6431.292.90.071954–2014
Wuxi120.3131.573.10.071954–2014
Xiangcheng120.7331.483.00.061954–2014
JiangyinTide level120.3431.963.20.121954–2014
DongshanEvaporation120.5031.17848.30.111954–2014
1 Rainfall and evaporation are in mm/year, and water and tide levels in m. CV: coefficient of variation.
Table 2. Results of change point detection using the Pettit, Mann-Kendall, and Sequential Cluster tests.
Pettitt Mann-Kendall Sequential Cluster
Change PointH0 Change PointH0 Change PointH0
Annual1988R 1990R 1988R
MAM1986R 1987R 1986R
JJA1986R 1988R 1989R
SON1986R 1987R 1986R
DJF1988R 1989R 1988R
Table 3. Shift change test using the Mann-Whitney test, and statistics summary before and after the identified change point for annual and seasonal water level.
Mann–Whitney TestBaseline PeriodEvaluation Period
n1n2ZcMean (m)SD (m)CVMean (m)SD (m)CV
Annual3526−5.95 *2.940.130.0183.230.100.011
MAM3328−6.20 *2.820.130.0183.130.140.020
JJA3328−4.58 *3.120.250.0663.390.190.037
SON3328−4.26 *3.080.220.0473.310.120.015
DJF3526−6.28 *2.710.120.0163.070.140.020
* indicates significant changes at the 95% level. Zc represent Mann-Whitney test statistic. CV and SD represent the coefficient of variation and standard deviation, respectively.
Table 4. Best MLP architecture and performance criteria for proposed models.
ModelInputsOutputModel Architecture *1Training Validation
R2NSE R2NSE
MLP1R(t), E(t)W(t)2-6-10.480.51 0.460.49
MLP2R(t), T(t)W(t)2-6-10.710.68 0.690.70
MLP3R(t), E(t), T(t)W(t)3-7-10.850.84 0.810.80
R: monthly rainfall (mm/month), E: evaporation (mm/month), T: tide (m), W: water level (m). *1 Number of nodes, respectively, in the input, hidden, and output layers is shown. MLP: multilayer perceptron, NSE: Nash-Sutcliffe efficiency, R2: coefficient of determination.
Table 5. Contributions of climate variability and human activities to water level changes in the Taihu Plain.
PeriodR
(mm)
E
(mm)
T
(m)
W
(m)
ηcηh
AnnualBaseline period1037.7801.43.22.9
Evaluation period1115.9883.63.23.269.0%31.0%
Evaluation sub-period I1141.6827.93.23.295.8%4.2%
Evaluation sub-period II1093.9931.43.23.851.3%48.7%
MAMBaseline period277.8195.33.02.8
Evaluation period253.6241.73.13.161.3%38.7%
Evaluation sub-period I275.8215.63.13.187.0%13.0%
Evaluation sub-period II234.6264.13.13.227.0%73.0%
JJABaseline period420.2321.83.83.1
Evaluation period509.9342.73.83.489.7%10.3%
Evaluation sub-period I521.3321.13.83.4092.6%7.4%
Evaluation sub-period II500.0361.23.83.471.9%28.1%
SONBaseline period232.6185.43.43.1
Evaluation period182.3204.53.43.381.0%19.0%
Evaluation sub-period I186.1198.53.53.384.2%15.8%
Evaluation sub-period II179.1209.63.43.354.8%45.2%
DJFBaseline period118.597.02.52.7
Evaluation period170.494.72.63.160.6%39.4%
Evaluation sub-period I158.492.72.53.080.8%19.2%
Evaluation sub-period II180.296.52.63.147.5%52.5%
R: monthly rainfall; E: evaporation; T: tide; W: water level. ηc and ηh are the contributions of climate and human activity to the water level change, respectively. Baseline and evaluation periods cover 1954–1987 and 1988–2014, respectively. Evaluation sub-period I and II cover the 1990s (1988–1999) and the 2000s (2000–2014), respectively. MAM: March-April-May; JJA: June-July-August; SON: September-October-November; DJF: December-January-February.

