Abstract
When chemical disinfection is performed before or after desalination, a number of harmful compounds are formed. Thus, efforts have been directed toward developing alternative methods for water disinfection. In this study, seven nanoparticles (NPs) were evaluated for disinfecting water produced from reverse osmosis and multi-stage flash desalination plants. The tested NPs were silver, copper, silver-copper, zinc oxide, magnesium oxide, silicon dioxide, and carbon nanotubes. The antimicrobial activity of the NPs was investigated by batch studies in desalinated water samples spiked with E. coli, Enterobacter, Salmonella, and Enterococci. The Chick-Watson model was fitted to the inactivation data to evaluate the kinetic constant for each combination of NPs, water type, and indicator bacteria. The results indicated that silver and silver-copper NPs have the highest disinfection efficiency among the tested NPs. Among the bacteria, Enterobacter (strain TPC129) appears to be the most inactivated, while Enterococci (strain NCTC775) seems to be the least influenced by the NPs. Variations in the chemical characteristics of the tested water samples appeared to cause noticeable differences in the antibacterial efficacies of copper and magnesium oxide NPs, but not in those of the other NPs.
1. Introduction
The safety of drinking water is one of the primary requisites for maintaining an acceptable level of public health and well-being in any jurisdiction. Nevertheless, many countries still suffer from poor access to safe drinking water, which has put millions of people at risk of contracting waterborne diseases []. Many of these diseases are related to pathogenic microorganisms living in the drinking water, which find their way into human bodies by ingestion. Disinfection is the process of inactivating these microorganisms prior to human consumption. There are typically two categories of disinfection processes: (1) chemical disinfection, in which a chemical agent is added to the water at a particular concentration and given sufficient time to inactivate most of the microorganisms in the water; and (2) physical disinfection, which relies on either removing microorganisms by size exclusion or adsorption, or subjecting the microorganisms to a light of a certain wavelength and intensity for a duration sufficient to irreversibly alter their structure and render them non-viable.
Chemical disinfection processes have gained considerable popularity in the past century, primarily due to their fast action and relatively inexpensive cost. However, in the past few decades, numerous studies have shown evidence of byproducts produced from these chemical processes that could be considered a health threat to consumers. Some of these disinfection byproducts (DBPs) have been marked as suspect mutagens and carcinogens [,]. This health concern has given renewed attention to physical processes, such as ultraviolet (UV) disinfection and removal by filtration. As more alternative disinfection processes appeared in the water industry, a need to set the criteria for an ideal disinfection process emerged. Scientists and water treatment professionals envisioned that an ideal disinfectant would have the following properties: (1) strong, fast, and consistent inactivation of microorganisms (i.e., requiring a reasonable residence time and dose); (2) inexpensive when compared to the current state-of-the-art agent; (3) non-toxic and incapable of producing health-threatening DBPs; (4) effective inactivation against a range of microorganisms (protozoa, bacteria, and viruses) under reasonable operating conditions (pH and temperature); and preferably (5) can be incorporated into existing treatment plants without significant alterations to the treatment train [].
The search for the ideal disinfection process has prompted researchers around the globe to investigate the use of different materials in the inactivation of microorganisms. Nanoparticles (NPs) have been given particular attention in the past decade. These NPs are synthesized to be of a size small enough to give them a high specific surface area and magnetic properties []. Several studies have synthesized and characterized NPs, and tested them for their application in water disinfection [,,,,,,]. NPs can be made of metals, metal oxides, carbon nanotubes, zeolites, and other materials. The exact mechanisms of action of different NPs for microorganism inactivation vary depending on the type of NP and the target microorganism. However, these mechanisms fall into two main categories: (1) direct interaction with the microbial cells and physical disruption of the cell membrane; or (2) generation of products such as reactive oxygen species (ROS) or dissolved metal ions that cause cell damage [].
To meet their water demand, several countries have become increasingly dependent on seawater desalination as the major source of drinking water. The commonly used desalination techniques nowadays are multistage flash distillation (MSF) and reverse osmosis (RO) desalination. The produced desalinated water is usually disinfected by chlorination before distribution to consumers. However, the occurrence of DBPs in desalinated water has been studied by several investigators, and tangible levels of bromoform and trace levels of haloacetic acids have been found after chlorination [,,,]. Even though there have been several studies on the use of NPs for disinfecting drinking water, none of these studies have focused on desalinated water. As the chemical composition of desalinated water may be different from those of fresh surface or ground water, there is a need to investigate the use of NPs as disinfection agents for desalinated water.
The overall goal of this study was to evaluate the usage of NPs for disinfecting RO and MSF desalinated water. Specifically, the objectives were: (1) to evaluate the capability of seven types of NPs in disinfecting four major microbes, namely, E. coli, Enterobacter, Salmonella, and Enterococci; and (2) to analyze the kinetics of the NPs inactivation of pathogens to assess the impact of NP dosages and contact time on the disinfection efficiency. The approach used to carry on the antimicrobial assessment in this study was based on application of the NPs in a batch suspension mode for the two water types. Because of the potential health risk associated with the presence of NPs in drinking water [,], the adopted approach in this study was solely intended for evaluation purposes. From an application perspective, NPs could be dosed in the water at a concentration that does not pose a health concern or they could be impregnated on supporting materials, such as graphene oxide [], activated carbon [,], polyvinyl chitosan hydrogel [], or others.
2. Materials and Methods
2.1. Synthesis of NPs
In this study, a chemical co-precipitation method was used to synthesize the NPs. The particles were stabilized by adding a stabilizing agent to prevent the NPs from aggregation. The size of the NPs was controlled by varying the pH, synthesis temperature, solvent type, and type of reducing agent [,]. The following seven types of NPs were selected: silver, silver-copper, copper, silicon dioxide, magnesium oxide, zinc oxide NPs, and carbon nanotubes. The Sonicafier 450 (Branson Ultrasonic Corporation, Danbury, CT, USA) was used for the sonication step in many of the prepared NPs. Sufficient quantities of the investigated NPs were prepared once and utilized in the conducted experiments. The preparation of these particles is described below.
Silver (Ag) NPs were synthesized by heating 0.1 M silver nitrate solution to 90 °C. During heating, the solution was sonicated and 8 M sodium hydroxide was added dropwise until a brown-black precipitate of silver NPs was obtained. The solution was centrifuged at 4078 g (Centrifuge 4515D, Eppendorf, Hamburg, Germany) for 15 min, then the precipitate was washed five times with deionized water. The obtained NPs were freeze-dried. To obtain a suspension of Ag-NPs, the required amount of silver NPs was sonicated in deionized water containing a small amount of 1% citric acid.
Silver-copper (Ag-Cu) (70:30) NPs were prepared by mixing 70 mL of 0.1 M silver nitrate solution with 30 mL of 0.1 M copper sulfate solution. The solution was heated to 90 °C under sonication followed by dropwise addition of 2 M sodium hydroxide until a brown-black precipitate of Ag-Cu (70:30) NPs was obtained. The same steps used to prepare the silver NPs were then followed.
Copper (Cu) NPs were prepared by heating a 50 mL solution of 0.2 M CuCl2 to 80 °C in an oil bath with magnetic stirring. Following that, 50 mL of 0.6 M l-ascorbic acid solution was added dropwise into the flask while stirring. The mixture was kept at 80 °C until a dark solution was obtained. The resulting dispersion was centrifuged at 4078 g for 15 min. l-ascorbic acid acted both as a reducing and a capping agent.
To prepare the zinc oxide (ZnO) NPs, 1.48 g of zinc acetate dihydrate (Zn(OAC)2·2H2O) was dissolved in 62.5 mL of methanol and heated to 60 °C while stirring. To this solution, 0.74 g of KOH dissolved in 32.5 mL of methanol was added. After 4 h, the reaction was stopped, and the final product of a white precipitate was collected, washed twice using acetone (Sigma-Aldrich, St. Louis, MO, USA), and dried at room temperature.
Magnesium oxide (MgO) NPs were prepared by dissolving 12.30 g of Mg(NO3)2·6H2O (Mallinckrodt Baker Inc., ACS, Phillipsburg, NJ, USA) in 25 mL of 99% ethylene glycol solution (BDH Inc., Conestoga, PA, USA). To this, 12.5 mL of 2 M Na2CO3 solution was added under sonication. After sonication for 15 min, the obtained solution was kept at rest for about 5 h. Then, it was filtered and washed using deionized water and dried at 50 °C. Finally, MgO NPs were obtained under calcination.
Silicon oxide (SiO2) NPs were prepared by sonicating ethanol (99.99%, Aldrich) for 10 min, after which a known volume of tetraethyl orthosilicate (99.99%, Aldrich) was added while sonicating. After 20 min, ammonium hydroxide (28%, Wako Pure Chemical Industries Ltd., Osaka, Japan) was added as a catalyst to promote the condensation reaction. Sonication was continued for an additional 60 min to obtain a turbid white suspension. SiO2 NPs were then obtained by drying the solution in the oven.
Carbon nanotubes (CNTs) were purchased from Nanolab Inc., Waltham, MA, USA. The sample was suspended in a mixture of concentrated nitric acid (65%) and sulfuric acid (95–97%) by a volume ratio of 1:3 and boiled at 140 °C for 30 min. The chemically treated nanotubes were washed with deionized water until the supernatant attained a pH around 7 and the sample was dried in a hot air oven at 100 °C.
2.2. Characterization of NPs
The morphological characteristics of the synthesized NPs were tested by transmission electron microscopy (TEM). TEM analysis was performed on a CM10 Philips TEM instrument. The surface charge for the NPs was analyzed using a Zetasizer Nano SZ particle analyzer instrument (Malvern, UK). A small drop of suspended NPs was diluted in 10 mL deionized water. The diluted solution was then transferred to a 1.0 mL cell and inserted into the instrument to measure the surface charge of the particles. Particle size was also determined using the Zetasizer Nano SZ analyzer, which measures particles as low as 0.3 nm in diameter.
2.3. Characterization of Tested Water
Samples of the MSF distillate and RO permeate were collected from two desalination plants located in the United Arab Emirates (UAE). The samples were tested for electrical conductivity (EC), major cations, and selected anions. The EC was tested using a Thermo Orion 150 EC meter. The measurement of cations (Ca2+, K+, Na+, and Mg2+) was conducted using a flame photometer (Corning 410). The lower detection limit of the followed analysis was 0.22 mg/L. The instrument was first calibrated using a calibration curve constructed for every tested cation in the range of 1 to 100 mg/L. MSF and RO samples were diluted 1000 times for Na+, Ca2+, and K+ determination, and diluted 250 times for Mg2+ determination. The anions in the different tested water samples were determined using a Dionex ICS-90 isocratic ion chromatography system. The AS9-HC column, which is specific for the analysis of oxyhalides and inorganic anions, was used as the separator column. The suppressor was the Dionex AMMS300, and the carbonate anion was used as an eluent.
Table 1 shows the chemical characteristics of the tested MSF distillate and RO permeate before chlorination. The distillate water has lower levels of almost all ions compared to the permeate water, especially for chloride, sodium, and calcium. The ionic strength of the water samples was estimated based on the relationship between ionic strength and electrical conductivity [].

Table 1.
Chemical characteristics of the MSF distillate and RO permeate.
Water samples collected from the MSF and RO plants after desalination but before chlorination were also analyzed for E. coli, Pseudomonas aeruginosa, Coliform bacilli, Enterococci, and sulfite reducing clostridia. The MSF water contained high levels of Coliform bacilli, while the RO water contained Pseudomonas aeruginosa and Coliform bacilli (Table 2).
Table 2.
Results of bacteriological analyses of the MSF and RO water samples (CFU/100 mL) a.
2.4. Antibacterial Assessment
To test for the inactivation efficiency of the NPs, experiments were conducted on MSF and RO water samples spiked with four types of bacteria: E. coli NCIB 12210, Enterobacter aerogenes TPC129, Salmonella Typhimurium ATCC 14028, and Enterococci faecalis NCTC775. Before spiking with the target bacteria, the two types of water samples were sterilized to ensure that only the target bacteria would be present in the water samples.
For each bacterium, a stock solution was prepared by taking a full loop of colonies from the strain and cultivated in 100 mL nutrient broth for 24 h at 37 °C. Then, 0.8 mL of the stock solution was taken and diluted in a 1-L sterilized water sample. Further dilution was done by taking 0.1 mL from the diluted water and adding it to a 2.7 L of a sterilized water sample. This diluted water sample was shaken well to homogenize the solution, and the content was distributed among nine sterilized beakers. Six of these beakers were filled with 200 mL each. Another three beakers were filled with 300 mL each and served as controls (i.e., without addition of NPs). The six 200-mL beakers were divided into two sets; each set received a different dose of NPs. A schematic diagram of the antibacterial assessment procedure for a certain microorganism, NP, and water type is shown in Figure 1.
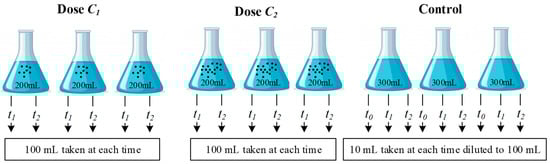
Figure 1.
Schematic of antibacterial assessment procedure for a certain microorganism, nanoparticle type and water type.
The nine beakers were incubated at 37 °C and shaken on a reciprocating shaker (FINEPCR, Model SH30L, Gunpo, Korea) at a motor speed of 60 rpm for different contact times. For each contact time, 100 mL from each beaker containing NPs were filtered using a Millipore filtration device with 0.45 µm type HA filter papers made of mixed-cellulose ester (MilliporeSigma, Burlington, MA, USA). For the control samples, 10 mL were drawn from each beaker at each contact time and were diluted to 100 mL with sterilized de-ionized water before filtration (Figure 1). Then, the filter papers were placed on Petri plates containing a selective agar medium for each bacterium (Table 3). The Petri plates with the filter papers were incubated at 37 °C for 24 h (except for E. coli, which was incubated at 44 °C). The remaining samples were returned to the incubator for the second contact time, and the above steps were repeated for each type of bacterium, NP, and type of water used.
Table 3.
Strains and selective media used for the different microorganisms.
The different NPs concentrations (C) applied to each water sample are listed in Table 4. Furthermore, listed in the table are the different contact times (t). The selection of the contact times and NP doses was based on preliminary experiments conducted on spiked water samples. These values were merely selected to carry on the intended antibacterial assessment and are not meant to serve as guidance for design purposes. It should also be noted that the selected concentration of Cu NPs does not exceed the 2 mg/L standard limit in drinking water, as regulated by the World Health Organization (WHO) []. While the other metals or metal oxides NPs used in this study have not been regulated by the WHO, the WHO recommends a level of Ag less than 0.1 mg/L in drinking water to avoid risk to health [] and a level of Zn of less than 3 mg/L to avoid an undesirable astringent taste [].
Table 4.
Concentrations (C in µg/L) of NPs and contact times (t in min) used with the MSF and RO water samples.
In all the spiked experiments, the initial level of the target bacterium (Nco) ranged between 342 and 484 CFU/100 mL (averaged about 400 CFU/100 mL). The selection of a low level of bacteria in this study is based on: (1) the non-detect levels of E. coli and Enterococci in the RO and MSF water samples (Table 2); and (2) safety considerations in dealing with pathogenic bacteria. The inactivation efficiency at each dose and for each contact time was evaluated for each beaker with reference to the level of microorganisms in the control beaker at that contact time (Nct). This step was necessary to account for the observed microbial die-off in the control beakers. Table 5 shows the average concentration of bacteria in control samples of MSF and RO water at t1 and t2 relative to that at the initial time. Each value in Table 5 was obtained based on 21 samples representing 3 replicates of 7 sets of control beakers. The table shows that E. coli, for example, is reduced on average 15% after 60 min in the control beakers, while the reduction reached 27% after 120 min. After accounting for bacterial die-off in the control beakers, the inactivation efficiency was averaged for each set of beakers tested for a specific contact time and NP dose.
Table 5.
Average (n = 21) concentration of bacteria in control samples of MSF and RO water relative to the concentration at initial time (Nct/Nco). Values in parenthesis represent standard deviation.
2.5. Disinfection Kinetics
To determine the kinetics of the disinfection capabilities of the tested NPs in the MSF and RO water samples, the log-linear Chick–Watson (CW) disinfection model was applied to the log inactivation data, as described previously [,,].
where Nt and Nct are the bacterial concentrations in beakers with and without (control) NPs at time t (minutes), respectively; n is the coefficient of dilution (assumed equal to 1, i.e., time and concentration are equally important since no trend was observed in the inactivation at similar C.t values resulting from different combinations of NPs dosage and contact time); and k is the empirical disinfection rate constant. The concentration of the NPs was assumed to be constant (i.e., no decay) during the exposure to target bacteria. To determine the parameter values for the model (k in the CW Model), Microsoft Excel was used to minimize the error sum of squares (ESS) between the observed and predicted bacteria log inactivation. Although the CW model (Equation (1)) may not be the best for describing the disinfection kinetics of microbial strains for some cases, it was used in this study to merely estimate the k values for the different combinations of NPs and bacteria strains.
3. Results and Discussion
The TEM images of the considered NPs are shown in Figure 2. While several images reflect clear and segregated particles, many others reflect colloidal particles agglomerated at different levels at different times. The shape of particles (classified as spherical, cylindrical, or irregular) was determined by visual inspection. The size, morphology, and surface charge of all NPs are listed in Table 6.

Figure 2.
Transmission electron microscopy (TEM) images of prepared NPs.
Table 6.
Sizes, morphologies, and surface charges of the NPs.
Several factors could influence the antimicrobial activity of NPs. These factors could be grouped into four main categories that are related to the NPs used, the microorganisms being disinfected, the physiochemical characteristics of the solution, and the contact time. Factors related to the NPs include type, concentration, size, and shape. As for the microorganisms, the inactivation efficiency could be influenced by their initial concentration in the solutions and their strains. It should be emphasized that the work carried out in this study does not encompass all the factors that influence NPs’ antimicrobial efficacies. For example, the impact of the initial concentration of microorganisms, which was fixed to about 400 CFU/100 mL in all experiments, was not investigated. Furthermore, the sizes and shapes of each of the NPs were fixed.
3.1. Effects of NPs Concentration and Contact Time
The antimicrobial activity of each of the NPs in the water samples is represented by bacterial inactivation efficiency referenced to control samples (not spiked with NPs). For each type of NP, the antimicrobial test was carried out in triplicate at each concentration and each contact time, and the results were averaged.
The antibacterial activity increased with dose and contact time for nearly all treatments. Nonetheless, the four bacterial species behaved differently upon exposure to the same levels of NPs. It should be indicated that several studies have also reported an increase in antibacterial activity with an increase in NP concentration [,,,,].
Table 7 and Table 8 summarize the results of bacterial inactivation for the spiked MSF and spiked RO water with the synthesized NPs. For all considered cases, increasing the contact time or the applied dose of the NPs resulted in higher inactivation efficiency of the bacterial types. However, there are noticeable variations in the inactivation efficiency for each type of NP and even among the different types of NPs. Since the doses and contact times were not the same for all bacterial species and types of NPs, the comparison of the antimicrobial activity of the NPs was based on the product C.t.
Table 7.
Average log inactivation of spiked MSF water treated by NPs a.
Table 8.
Average log inactivation of spiked RO water treated by NPs a.
Figure 3 and Figure 4 show the inactivation efficiency versus C.t of the different NPs in the spiked RO and MSF water, respectively. Note that three (not four) data points are shown for the inactivation of each microorganism because the C.t value for the first dose and second contact time is the same as that for the second dose and first contact time. For those two data points, an average inactivation efficiency value is shown on the graph.
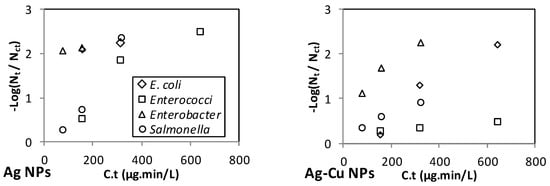
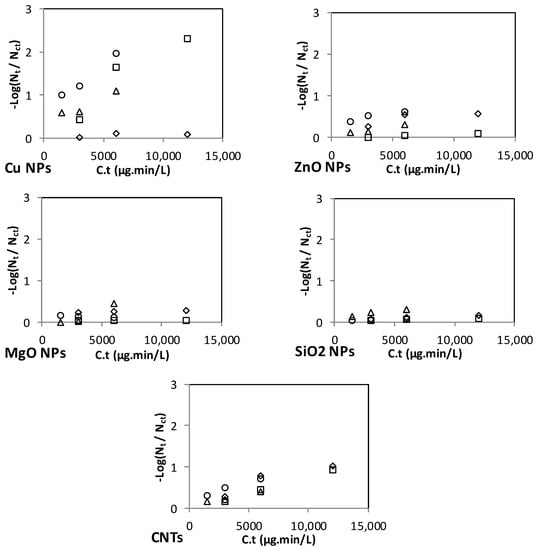
Figure 3.
Effect of C.t on the inactivation of E. coli, Enterococci, Enterobacter, and Salmonella in the spiked RO permeates.
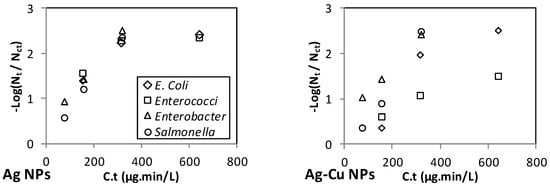
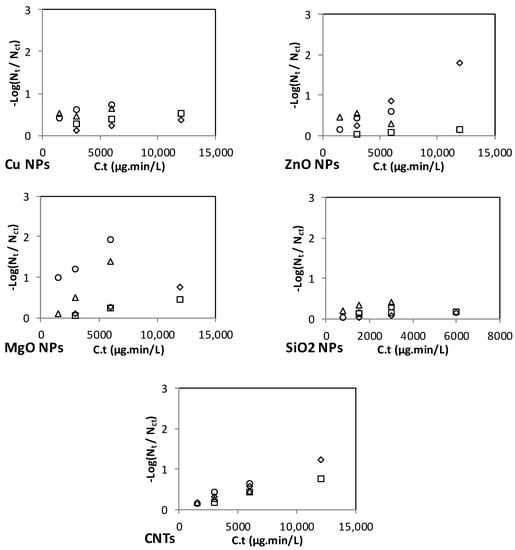
Figure 4.
Effect of C.t on the inactivation of E. coli, Enterococci, Enterobacter, and Salmonella in the spiked MSF distillate.
The range of C.t values varies among the NPs (Figure 3 and Figure 4), with Ag and Ag-Cu having the lowest range (up to 640 μg·min/L), and ZnO, MgO, SiO2, and CNT NPs having the highest range (up to 12,000 μg·min/L). Although the ranges of the C.t values for Ag and Ag-Cu NPs were the lowest, Ag and Ag-Cu NPs were found to be the strongest disinfectants.
3.2. Kinetic Modeling
The values of k and the associated coefficient of determination (R2) for model fitting for all investigated cases are listed in Table 9. The table shows that, for most cases, the R2 value indicates that the CW model fits well, and thus, the model could be utilized to adequately describe the kinetics of the disinfection capabilities of the tested NPs in the MSF and RO water samples. In addition, fitted values of k using the CW model should serve the purpose of comparing the antimicrobial capability of the NPs used in this study.
Table 9.
Values of k (L/mg·min) for all investigated cases.
The inactivation rate constant (k) summarizes the influence of two important factors affecting the performance of NPs as an antibacterial agent, namely, disinfectant concentration and time of contact. It allows for a comparison between the performance of the NPs with the performance of chlorine in E. coli inactivation. The k values for E. coli using Ag NPs with MSF and RO water are 4.63 and 8.32 L/mg·min, respectively. These values are higher than that of chlorine (k = 4 L/mg·min) for E. coli inactivation []. In previous studies on NPs for bacteria inactivation, the study findings were not summarized in the form of a rate constant (k), which makes comparing those findings to the findings of this study particularly difficult.
3.3. Effects of Type of NP
Based on the obtained k value, one could categorize the inactivation efficiency of the NPs used in this study by the following relative terms: very high for k ≥ 10, high for 10 > k ≥ 1, medium 1 > k ≥ 0.1, low 0.1 > k ≥0.01, and very low for 0.01 > k. From this perspective, the inactivation efficiency of Ag and Ag-Cu NPs would be classified as high to very high, with Ag NPs showing a higher efficiency than Ag-Cu NPs in several cases. Cu NPs, on the other hand, are less effective than Ag and Ag-Cu NPs, and would be categorized as having a medium inactivation efficiency. ZnO and CNTs NPs would be categorized as having medium to low inactivation efficiencies, while MgO and SiO2 NPs would be categorized as the least effective disinfectants.
The antimicrobial properties of Ag NPs have been reported by several investigators [,,,]. Furthermore, some studies have showed that Cu NPs have a significant effect as a bactericidal agent [,]. Therefore, Ag-Cu NPs would be expected to result in an intermediate antimicrobial activity compared to the separate Ag and Cu NPs, as was found in this study. Although, in this study, Ag NPs showed higher inactivation efficacy towards the investigated bacteria, other studies have reported that Cu NPs have a superior antibacterial activity when compared to Ag NPs for representative strains of E. coli and B. subtilis [].
As indicated above, the type of the NPs is an important factor that affects microbial inactivation, and for a particular type, the size of the NPs could also be important [,,]. This is because an increase in the specific surface area of NPs with a decrease in particle size increases the potential number of antibacterial reactive groups on the particle surface []. Therefore, the antimicrobial efficacy increases as the size of the NPs decreases. Such behavior has been reported for several types of NPs, including Ag [,] and MgO [,,].
Several mechanisms for Ag NPs’ bactericidal effects have been proposed. However, it is believed that the antibacterial mechanism of Ag NPs is due to an induction of oxidative stress that results from formation of ROS, which may cause the degradation of the membrane of the bacterial cell [,,]. Ruparelia et al. [] speculated a similar mechanism of action for Cu NPs.
The antibacterial mechanism of metal oxide NPs is still not clearly known, but a number of mechanisms have been proposed. For example, it has been suggested that the antibacterial mechanism of MgO could be attributed to the formation of ROS [,,,] lipid peroxidation []. Others, however, suggested a possible electrostatic interaction of NPs with bacteria [,], or an alkaline effect [].
The release of ions from the surface of NPs has also been reported to cause microbial inactivation, as the ions bind to and rupture the cell membrane of the microbe [,]. In fact, some studies claimed that the ions released from NPs are the more active species [,], whereas others assumed that the NPs themselves cause higher toxicity [,].
3.4. Effects of Type of Bacteria
In terms of the categorization of the microbes used in this study based on the k values (Table 9), Enterobacter (strain TPC129) appears to be inactivated the most by each of the NPs. On the other hand, the gram-positive Enterococci (strain NCTC775) seems to be the least influenced by the NPs. Gammoudi et al. [] indicated that the cell wall plays an essential role in the tolerance of bacteria to NPs. Gram-positive cells have a thick layer (20–80 nm) of peptidoglycan, which is attached to teichoic acids that are unique to the gram-positive wall. By contrast, gram-negative cell walls comprise a thin peptidoglycan layer (5–10 nm) and contain lipopolysaccharides, which increase the negative charge of the cell membrane []. Valodkar et al. [] suggested that due to differences in the composition of the cell wall between gram-positive and gram-negative bacteria, disinfection of the former by NPs may require a longer interaction time before the treatment is effective.
Our results are consistent with those of Kim et al. [], who reported a greater biocidal efficiency of Ag NPs against the gram-negative E. coli than the gram-positive S. aureus. However, our results are in conflict with those of Yim et al. [] and Yoon et al. []. Yim et al. [] showed that E. coli has a stronger resistance to MgO NPs than S. aureus, and Yoon et al. [] observed that the gram-positive B. subtilis was more sensitive than E. coli to Ag NPs. This apparent contradiction in the results among different studies could possibly be due to differences in the microbial strains. Species sensitivity is not only related to the structure of the cell wall in gram-negative and gram-positive bacteria. As indicated by Brownheim [], the antibacterial effects highly depend on the particular strain. Ruparelia et al. [] demonstrated that different strains of E. coli have different levels of resistance to Ag and Cu NPs, with some E. coli strains, such as MTCC 739 and MTCC 1687, being more resistant than the S. aureus strains. Ruparelia et al. [] concluded that the bactericidal efficiency of NPs is not solely dependent on the structure of the bacterial membrane. They also found that the gram-positive B. subtilis strain MTCC 441 was more sensitive to the Cu NPs than the Ag NPs.
3.5. Effects of Type of Water
Inactivation of bacteria by NPs could be influenced by the chemical characteristics of the disinfected water. To assess if a difference exists in the inactivation of NPs due to differences in the type of water used, the ratio of log inactivation in MSF water relative to that in RO water at similar C.t values was determined. Table 10 lists the average ratio values for each NP and each bacterial strain along with the 90% confidence limits estimated based on the t-test. A ratio that is statistically greater than 1.0 indicates that inactivation is more favorable in MSF water as compared to that in RO water, while a ratio less than 1.0 indicates that inactivation is more favorable in RO water relative to that in MSF water. The inactivation efficacy in the two types of water will not be significantly different from each other if a ratio of 1.0 falls within the 90% confidence interval.
Table 10.
Average ratio of log inactivation in MSF water relative to that in RO water (n = 4). Values in parentheses represent the 90% confidence limits.
Inspection of Table 10 reveals that the disinfection ability of Ag NPs, ZnO NPs, and CNTs is not influenced by the water type, since the values are not statistically different from 1.0. For the Ag-Cu NPs, slightly higher disinfection is achieved with MSF water than RO water for Enterococci, while the other bacterial strains show almost similar inactivation. The situation appears to be different for the case of Cu NPs, where higher inactivation is achieved in RO than MSF water for Enterobacter, Salmonella, and Enterococci, but higher inactivation is achieved in MSF water for E. coli. For MgO NPs, higher inactivation is achieved with MSF water than RO water for Enterobacter and Salmonella. As for SiO2 NPs, E.coli and Enterococci showed higher inactivation in MSF water than RO water, but Enterobacter and Salmonella did not appear to be influenced by the type of water.
As evident from Table 10, the effect of variation in chemical characteristics of the solution on the disinfection ability of NPs could differ from one type of NP to another and from one type of bacteria to another. Variations in the toxicity level due to changes in the chemical composition of the solution could even occur for the same type of NP if prepared by different methods []. In fact, different chemical parameters could influence the biocidal effect of NPs, including ionic strength and individual concentration of specific elements. For example, Chambers et al. [] found that an increase in the ionic strength and chloride concentration of the solution enhanced Ag NP aggregation and increased the dissolution of Ag species. However, the type of released Ag species in both cases was different. The increase in the ionic strength enhanced the release of Ag+ species, which caused increased inactivation of E. coli, but the increase in the chloride concentration enhanced the release of AgClx(x−1)− species, which appear to have a lower biocidal effect.
The observed variation in the toxicity of Ag NP to E. coli in Chambers et al. [] was evident given the wide range of ionic strength (8 to 150 mM) and chloride concentrations (2.7 to 140 mM) of the tested solutions. In our case, the difference in the ionic strength of MSF water (1.28 mM) and RO water (7.17 mM) and the difference in chloride levels (0.3 mM for MSF water and 2.9 mM for RO water) are probably not high enough for biocidal variations to be observed for the tested bacterial strains. On the other hand, several researchers suggested that Ag toxicity is due to exposure to soluble species of Ag rather than exposure to Ag NPs [,,]. Levard et al. [] suggested that it is the molar ratio of Cl/Ag that dictates the solubility of Ag NPs and the release of Ag+. In our case, the molar ratio of Cl/Ag is high (>10,000) for both types of water, which results in a high dissolution rate of Ag in both water types.
Another factor that could affect the bactericidal properties of NPs is the presence of divalent cations (Ca2+ and Mg2+), which enhance the formation of larger NP aggregates more than monovalent cations [,,]. For example, Zhang [] found that Ag NPs in solutions containing more than 100 mg/L Ca2+ or Mg2+ had a lower antibacterial efficacy than Ag NPs in monovalent solutions having the same concentration. Both the water samples in this study had a very low Mg2+ concentration (<1 mg/L) and also a low Ca2+ concentration (4 mg/L in the MSF sample and 12 mg/L in the RO sample). The higher Ca concentration in the RO water could have caused the formation of NP aggregates that are slightly larger than those formed in MSF water, and generally resulted in a higher inactivation of Enterococci and E. coli in MSF water.
For Cu and MgO NPs, we observed an opposite effect in MSF versus RO water. For Cu NPs, the inactivation appeared more pronounced in RO water, while for MgO NPs, it was more pronounced in MSF water. This could be attributed to changes in the ionic strength or divalent ion content of the two water samples and its effect on NP aggregation and dissolution. Typically, higher ionic strength promotes higher dissolution to reduce the chemical potential of the solution as per the Debye–Huckel law []. However, for Cu NPs, Xiao et al. [] observed that an increase in Ca2+ concentration in the solution causes higher aggregation of the NPs, which results in a reduction in their surface area and a consequent reduction in NP dissolution. These authors suggested that the effect of enhanced aggregation on dissolution of Cu NPs with increasing divalent cation content would likely counteract the effect of a reduced chemical potential on dissolution. Thus, for the water types used in this study, one would expect a slightly higher dissolution and release of Cu2+ with the use of the MSF water. If this is the case, then higher inactivation will occur in the RO water as Cu NPs are more toxic than Cu2+ ions []. For MgO NPs, the slightly higher ionic strength of the RO water promotes higher dissolution. As Mg2+ ions have little or no effect on microbial inactivation [,,], a higher microbial inactivation would occur in the MSF water.
While the above-offered explanation for the effect of water type on the inactivation of the tested microorganism is somewhat speculative, confirmation requires a more comprehensive study of this issue. Thus, additional work should be conducted with a well-designed experimental protocol that involves characterization of the formed NP aggregates, measurement of the released metal concentration, and measurement of possible changes in the chemical characteristics of the solution due to use of the NPs.
4. Conclusions
This study evaluated the efficiencies of seven NPs in disinfecting desalinated drinking water produced by different desalination technologies and spiked by four types of bacteria, i.e., E. coli, Enterobacter, Salmonella, and Enterococci. The investigation was performed for different doses of suspended NPs and different contact times. The inactivation kinetics of the indicator microorganisms was modeled with the CW log-linear model. The kinetic constant (k) indicated that the antimicrobial performance of Ag NPs was the best among all tested NPs and for the tested spiked MSF and RO water samples, followed by Ag-Cu NPs. The results also revealed that Enterobacter (strain TPC129) appeared to be more inactivated than the other three types of bacteria by each of the NPs, while the gram-positive Enterococci (strain NCTC775) seemed to be the least influenced by the NPs. It was also found that the biocidal effects of the Ag, Ag-Cu, ZnO, and CNT NPs were almost the same in MSF and RO spiked water samples, despite some variations in the chemical composition of the two water samples. However, variations in the chemical characteristics of the two water samples appeared to cause noticeable differences in the antibacterial efficacies of Cu and MgO NPs.
Author Contributions
Conceptualization, L.A.-I. and W.E.; data curation, L.A.-I., W.E., and M.A.M.; formal analysis, L.A.-I., W.E., M.A.M., and M.H.; funding acquisition, W.E. and M.A.M.; investigation, L.A.-I. and A.M.S.; methodology, L.A.-I., M.H., and A.M.S.; project administration, W.E. and M.A.M.; resources, M.A.M.; supervision, W.E. and M.A.M.; validation, L.A.-I. and M.H.; visualization, M.A.M., M.H., and A.M.S.; writing—original draft, L.A.-I., W.E., M.A.M., and M.H.; writing—review and editing, M.A.M. and M.H.
Funding
This work was funded by the National Water Center at the UAE University research [grant number 31R007].
Acknowledgments
The authors would like to thank Yousef Hayek at Qatar University for his great assistance in preparing the NPs used in this study and Khalid Tarabely and Mohamed Taha from the Biology Department at the UAE University for their support and advice. The authors would also like to thank Tibor Pal from the College of Medicine and Health Sciences at the UAE University for his cooperation and for providing the Enterobacter bacteria. We also thank the anonymous reviewers for their exceptionally useful comments.
Conflicts of Interest
The authors declare no conflict of interest. The funders had no role in the design of the study; in the collection, analyses, or interpretation of data; in the writing of the manuscript, or in the decision to publish the results.
References
- WHO. Progress on Drinking Water, Sanitation and Hygiene: 2017 Update and SDG Baselines; World Health Organization (WHO); United Nations Children’s Fund (UNICEF): Geneva, Switzerland, 2017. [Google Scholar]
- Chowdhury, S.; Champagne, P.; McLellan, P.J. Uncertainty characterization approaches for risk assessment of DBPs in drinking water: A review. J. Environ. Manag. 2009, 90, 1680–1691. [Google Scholar] [CrossRef] [PubMed]
- Hebert, A.; Forestier, D.; Lenes, D.; Benanou, D.; Jacob, S.; Arfi, C.; Lambolez, L.; Levi, Y. Innovative method for prioritizing emerging disinfection by-products (DBPs) in drinking water on the basis of their potential impact on public health. Water Res. 2010, 44, 3147–3165. [Google Scholar] [CrossRef] [PubMed]
- Hossain, F.; Perales-Perez, O.J.; Hwang, S.; Román, F. Antimicrobial nanomaterials as water disinfectant: Applications, limitations and future perspectives. Sci. Total Environ. 2014, 466–467, 1047–1059. [Google Scholar]
- Ram, M.K.; Andreescu, S.; Ding, H. Nanotechnology for Environmental Decontamination; McGraw-Hill Professional: New York, NY, USA, 2011; ISBN 0-07-170279-2. [Google Scholar]
- Bao, Q.; Zhang, D.; Qi, P. Synthesis and characterization of silver nanoparticle and graphene oxide nanosheet composites as a bactericidal agent for water disinfection. J. Colloid Interface Sci. 2011, 360, 463–470. [Google Scholar] [CrossRef]
- Biswas, P.; Bandyopadhyaya, R. Water disinfection using silver nanoparticle impregnated activated carbon: Escherichia coli cell-killing in batch and continuous packed column operation over a long duration. Water Res. 2016, 100, 105–115. [Google Scholar] [CrossRef] [PubMed]
- Dimapilis, E.A.S.; Hsu, C.-S.; Mendoza, R.M.O.; Lu, M.-C. Zinc oxide nanoparticles for water disinfection. Sustain. Environ. Res. 2018, 28, 47–56. [Google Scholar] [CrossRef]
- Li, Q.; Mahendra, S.; Lyon, D.Y.; Brunet, L.; Liga, M.V.; Li, D.; Alvarez, P.J.J. Antimicrobial nanomaterials for water disinfection and microbial control: Potential applications and implications. Water Res. 2008, 42, 4591–4602. [Google Scholar] [CrossRef]
- Park, S.; Ko, Y.-S.; Jung, H.; Lee, C.; Woo, K.; Ko, G. Disinfection of waterborne viruses using silver nanoparticle-decorated silica hybrid composites in water environments. Sci. Total Environ. 2018, 625, 477–485. [Google Scholar] [CrossRef]
- Quang, D.V.; Sarawade, P.B.; Jeon, S.J.; Kim, S.H.; Kim, J.-K.; Chai, Y.G.; Kim, H.T. Effective water disinfection using silver nanoparticle containing silica beads. Appl. Surf. Sci. 2013, 266, 280–287. [Google Scholar] [CrossRef]
- Reddy, K.H.P.; Shashikala, V.; Anand, N.; Sandeep, C.; Raju, B.D.; Rao, K.S.R. A study on control of microorganisms in drinking water using Ag-Cu/C catalysts. Open Catal. J. 2011, 4, 47–53. [Google Scholar] [CrossRef]
- Elshorbagy, W.; Abdulkarim, M. Chlorination byproducts in drinking water produced from thermal desalination in United Arab Emirates. Environ. Monit. Assess. 2006, 123, 313–331. [Google Scholar] [CrossRef]
- Farre, M.J.; Knight, N. Assessment of Regulated and Emerging Disinfection By-Products in South East Queensland Drinking Water; Technical Report No. 90; Urban Water Security Research Alliance: Australia, 2012. [Google Scholar]
- Latif, N.A.; Al-Awadi, F.M.; Colenutt, B.A. Trihalomethanes (THMs) formation in multi-stage flash (MSF) distillation plants. Desalination 1989, 74, 205–226. [Google Scholar] [CrossRef]
- Tawabini, B.; Khararjian, H.; Fayad, N. Trihalomethanes (THMs) formation in a distillation process. Desalination 1987, 66, 403–414. [Google Scholar] [CrossRef][Green Version]
- Ostiguy, C.; Soucy, B.; Lapointe, G.; Woods, C.; Ménard, L.; Trottier, M. Health Effects of Nanoparticles, 2nd ed.; Institut de recherche Robert-Sauvé en santé et en sécurité du travail IRSST: Montréal, QC, Canada, 2008. [Google Scholar]
- Bundschuh, M.; Filser, J.; Lüderwald, S.; McKee, M.S.; Metreveli, G.; Schaumann, G.E.; Schulz, R.; Wagner, S. Nanoparticles in the environment: Where do we come from, where do we go to? Environ. Sci. Eur. 2018, 30, 6. [Google Scholar] [CrossRef] [PubMed]
- Das, M.R.; Sarma, R.K.; Saikia, R.; Kale, V.S.; Shelke, M.V.; Sengupta, P. Synthesis of silver nanoparticles in an aqueous suspension of graphene oxide sheets and its antimicrobial activity. Colloids Surf. B Biointerfaces 2011, 83, 16–22. [Google Scholar] [CrossRef]
- Park, S.-J.; Jang, Y.-S. Preparation and characterization of activated carbon fibers supported with silver metal for antibacterial behavior. J. Colloid Interface Sci. 2003, 261, 238–243. [Google Scholar] [CrossRef]
- Srinivasan, N.R.; Shankar, P.A.; Bandyopadhyaya, R. Plasma treated activated carbon impregnated with silver nanoparticles for improved antibacterial effect in water disinfection. Carbon 2013, 57, 1–10. [Google Scholar] [CrossRef]
- Nguyen, N.-T.; Liu, J.-H. A green method for in situ synthesis of poly(vinyl alcohol)/chitosan hydrogel thin films with entrapped silver nanoparticles. J. Taiwan Inst. Chem. Eng. 2014, 45, 2827–2833. [Google Scholar] [CrossRef]
- De Kwaadsteniet, M.; Botes, M.; Cloete, T.E. Application of nanotechnology in antimicrobial coatings in the water industry. Nano 2011, 06, 395–407. [Google Scholar] [CrossRef]
- APHA. Standard Methods for the Examination of Water and Wastewater, 23rd ed.; American Public Health Association (APHA), American Water Works Association (AWWA) and Water Environment Federation (WEF): Washington, DC, USA, 2017. [Google Scholar]
- WHO. Guidelines for Drinking-Water Quality: Fourth Edition Incorporating the First Addendum; World Health Organization: Geneva, Switzerland, 2017. [Google Scholar]
- WHO. Silver in Drinking-Water: Background Document for Development of WHO Guidelines for Drinking-Water Quality; World Health Organization: Geneva, Switzerland, 2003. [Google Scholar]
- WHO. Zinc in Drinking-Water: Background Document for Development of WHO Guidelines for Drinking-Water Quality; World Health Organization: Geneva, Switzerland, 2003. [Google Scholar]
- Cho, M.; Chung, H.; Yoon, J. Disinfection of water containing natural organic matter by using ozone-initiated radical reactions. Appl. Environ. Microbiol. 2003, 69, 2284–2291. [Google Scholar] [CrossRef] [PubMed]
- Lim, M.Y.; Kim, J.-M.; Lee, J.E.; Ko, G. Characterization of ozone disinfection of murine norovirus. Appl. Environ. Microbiol. 2010, 76, 1120–1124. [Google Scholar] [CrossRef] [PubMed]
- An, Y.; Zhang, K.; Wang, F.; Lin, L.; Guo, H. Removal of organic matters and bacteria by nano-MgO/GAC system. Desalination 2011, 281, 30–34. [Google Scholar] [CrossRef]
- Jin, T.; He, Y. Antibacterial activities of magnesium oxide (MgO) nanoparticles against foodborne pathogens. J. Nanopart. Res. 2011, 13, 6877–6885. [Google Scholar] [CrossRef]
- Pal, S.; Tak, Y.K.; Song, J.M. Does the antibacterial activity of silver nanoparticles depend on the shape of the nanoparticle? A study of the gram-negative bacterium Escherichia coli. Appl. Environ. Microbiol. 2007, 73, 1712–1720. [Google Scholar] [CrossRef] [PubMed]
- Sawai, J. Quantitative evaluation of antibacterial activities of metallic oxide powders (ZnO, MgO and CaO) by conductimetric assay. J. Microbiol. Methods 2003, 54, 177–182. [Google Scholar] [CrossRef]
- Zhang, X.; Niu, H.; Yan, J.; Cai, Y. Immobilizing silver nanoparticles onto the surface of magnetic silica composite to prepare magnetic disinfectant with enhanced stability and antibacterial activity. Colloids Surf. A Physicochem. Eng. Asp. 2011, 375, 186–192. [Google Scholar] [CrossRef]
- Haas, C.N.; Karra, S.B. Kinetics of microbial inactivation by chlorine—II Kinetics in the presence of chlorine demand. Water Res. 1984, 18, 1451–1454. [Google Scholar] [CrossRef]
- Jain, P.; Pradeep, T. Potential of silver nanoparticle-coated polyurethane foam as an antibacterial water filter. Biotechnol. Bioeng. 2005, 90, 59–63. [Google Scholar] [CrossRef]
- Ruparelia, J.P.; Chatterjee, A.K.; Duttagupta, S.P.; Mukherji, S. Strain specificity in antimicrobial activity of silver and copper nanoparticles. Acta Biomater. 2008, 4, 707–716. [Google Scholar] [CrossRef]
- Cioffi, N.; Torsi, L.; Ditaranto, N.; Tantillo, G.; Ghibelli, L.; Sabbatini, L.; Bleve-Zacheo, T.; D’Alessio, M.; Zambonin, P.G.; Traversa, E. Copper nanoparticle/polymer composites with antifungal and bacteriostatic properties. Chem. Mater. 2005, 17, 5255–5262. [Google Scholar] [CrossRef]
- Yoon, K.-Y.; Hoon Byeon, J.; Park, J.-H.; Hwang, J. Susceptibility constants of Escherichia coli and Bacillus subtilis to silver and copper nanoparticles. Sci. Total Environ. 2007, 373, 572–575. [Google Scholar] [CrossRef]
- Huang, L.; Li, D.; Lin, Y.; Evans, D.G.; Duan, X. Influence of nano-MgO particle size on bactericidal action against Bacillus subtilis var. niger. Chin. Sci. Bull. 2005, 50, 514–519. [Google Scholar]
- Panáček, A.; Kvítek, L.; Prucek, R.; Kolář, M.; Večeřová, R.; Pizúrová, N.; Sharma, V.K.; Nevěčná, T.; Zbořil, R. Silver colloid nanoparticles: Synthesis, characterization, and their antibacterial activity. J. Phys. Chem. B 2006, 110, 16248–16253. [Google Scholar] [CrossRef] [PubMed]
- Nel, A.; Xia, T.; Mädler, L.; Li, N. Toxic potential of materials at the nanolevel. Science 2006, 311, 622–627. [Google Scholar] [CrossRef] [PubMed]
- Makhluf, S.; Dror, R.; Nitzan, Y.; Abramovich, Y.; Jelinek, R.; Gedanken, A. Microwave-assisted synthesis of nanocrystalline MgO and its use as a bacteriocide. Adv. Funct. Mater. 2005, 15, 1708–1715. [Google Scholar] [CrossRef]
- Sundrarajan, M.; Suresh, J.; Gandhi, R.R. A comparative study on antibacterial properties of MgO nanoparticles prepared under different calcination temperature. Dig. J. Nanomater. Biostruct. 2012, 7, 983–989. [Google Scholar]
- Kumar, V.S.; Nagaraja, B.M.; Shashikala, V.; Padmasri, A.H.; Madhavendra, S.S.; Raju, B.D.; Rao, K.S.R. Highly efficient Ag/C catalyst prepared by electro-chemical deposition method in controlling microorganisms in water. J. Mol. Catal. A Chem. 2004, 223, 313–319. [Google Scholar] [CrossRef]
- Sondi, I.; Salopek-Sondi, B. Silver nanoparticles as antimicrobial agent: A case study on E. coli as a model for Gram-negative bacteria. J. Colloid Interface Sci. 2004, 275, 177–182. [Google Scholar]
- Huang, L.; Li, D.-Q.; Lin, Y.-J.; Wei, M.; Evans, D.G.; Duan, X. Controllable preparation of nano-MgO and investigation of its bactericidal properties. J. Inorg. Biochem. 2005, 99, 986–993. [Google Scholar] [CrossRef] [PubMed]
- Krishnamoorthy, K.; Manivannan, G.; Kim, S.J.; Jeyasubramanian, K.; Premanathan, M. Antibacterial activity of MgO nanoparticles based on lipid peroxidation by oxygen vacancy. J. Nanopart. Res. 2012, 14, 1063. [Google Scholar] [CrossRef]
- Yamamoto, O.; Ohira, T.; Alvarez, K.; Fukuda, M. Antibacterial characteristics of CaCO3–MgO composites. Mater. Sci. Eng. B 2010, 173, 208–212. [Google Scholar] [CrossRef]
- Stoimenov, P.K.; Klinger, R.L.; Marchin, G.L.; Klabunde, K.J. Metal oxide nanoparticles as bactericidal agents. Langmuir 2002, 18, 6679–6686. [Google Scholar] [CrossRef]
- Emamifar, A.; Kadivar, M.; Shahedi, M.; Soleimanian-Zad, S. Effect of nanocomposite packaging containing Ag and ZnO on inactivation of Lactobacillus plantarum in orange juice. Food Control 2011, 22, 408–413. [Google Scholar] [CrossRef]
- Kim, J.S.; Kuk, E.; Yu, K.N.; Kim, J.-H.; Park, S.J.; Lee, H.J.; Kim, S.H.; Park, Y.K.; Park, Y.H.; Hwang, C.-Y.; et al. Antimicrobial effects of silver nanoparticles. Nanomed. Nanotechnol. Biol. Med. 2007, 3, 95–101. [Google Scholar] [CrossRef]
- Qu, X.; Alvarez, P.J.J.; Li, Q. Applications of nanotechnology in water and wastewater treatment. Water Res. 2013, 47, 3931–3946. [Google Scholar] [CrossRef]
- Morones, J.R.; Elechiguerra, J.L.; Camacho, A.; Holt, K.; Kouri, J.B.; Ramírez, J.T.; Yacaman, M.J. The bactericidal effect of silver nanoparticles. Nanotechnology 2005, 16, 2346–2353. [Google Scholar] [CrossRef] [PubMed]
- Gammoudi, I.; Faye, N.R.; Morote, F.; Moynet, D.; Grauby-Heywang, C.; Cohen-Bouhacina, T. Characterization of silica nanoparticles in interaction with Escherichia coli bacteria. Int. J. Chem. Mol. Nucl. Mater. Metall. Eng. 2013, 7, 519–526. [Google Scholar]
- Brownheim, S.V. Characterization and In Vitro Toxicity of Copper Nanoparticles (Cu-NPs) in Murine Neuroblastoma (N2A) Cells. Master’s Thesis, US Air Force Institute of Technology, Wright-Patterson Air Force Base, OH, USA, 2011. [Google Scholar]
- Valodkar, M.; Sharma, P.; Kanchan, D.K.; Thakore, S. Conducting and antimicrobial properties of silver nanowire–waxy starch nanocomposites. Int. J. Green Nanotechnol. Phys. Chem. 2010, 2, P10–P19. [Google Scholar] [CrossRef]
- Yim, G.; Wang, H.H.; Davies, J. The truth about antibiotics. Int. J. Med. Microbiol. 2006, 296, 163–170. [Google Scholar] [CrossRef] [PubMed]
- Xiao, Y.; Vijver, M.G.; Peijnenburg, W.J.G.M. Impact of water chemistry on the behavior and fate of copper nanoparticles. Environ. Pollut. 2018, 234, 684–691. [Google Scholar] [CrossRef]
- Chambers, B.A.; Afrooz, A.R.M.N.; Bae, S.; Aich, N.; Katz, L.; Saleh, N.B.; Kirisits, M.J. Effects of chloride and ionic strength on physical morphology, dissolution, and bacterial toxicity of silver nanoparticles. Environ. Sci. Technol. 2014, 48, 761–769. [Google Scholar] [CrossRef]
- Kittler, S.; Greulich, C.; Diendorf, J.; Köller, M.; Epple, M. Toxicity of silver nanoparticles increases during storage because of slow dissolution under release of silver ions. Chem. Mater. 2010, 22, 4548–4554. [Google Scholar] [CrossRef]
- Levard, C.; Mitra, S.; Yang, T.; Jew, A.D.; Badireddy, A.R.; Lowry, G.V.; Brown, G.E. Effect of chloride on the dissolution rate of silver nanoparticles and toxicity to E. coli. Environ. Sci. Technol. 2013, 47, 5738–5745. [Google Scholar] [CrossRef]
- Xiu, Z.; Zhang, Q.; Puppala, H.L.; Colvin, V.L.; Alvarez, P.J.J. Negligible particle-specific antibacterial activity of silver nanoparticles. Nano Lett. 2012, 12, 4271–4275. [Google Scholar] [CrossRef]
- Zhang, Y.; Chen, Y.; Westerhoff, P.; Crittenden, J. Impact of natural organic matter and divalent cations on the stability of aqueous nanoparticles. Water Res. 2009, 43, 4249–4257. [Google Scholar] [CrossRef] [PubMed]
- Van Hoecke, K.; De Schamphelaere, K.A.C.; Van der Meeren, P.; Smagghe, G.; Janssen, C.R. Aggregation and ecotoxicity of CeO2 nanoparticles in synthetic and natural waters with variable pH, organic matter concentration and ionic strength. Environ. Pollut. 2011, 159, 970–976. [Google Scholar] [CrossRef] [PubMed]
- Zhang, H. Application of Silver Nanoparticles in Drinking Water Purification. Ph.D. Thesis, University of Rhode Island, Kingston, RI, USA, 2013. [Google Scholar]
- Lv, Q.; Zhang, B.; Xing, X.; Zhao, Y.; Cai, R.; Wang, W.; Gu, Q. Biosynthesis of copper nanoparticles using Shewanella loihica PV-4 with antibacterial activity: Novel approach and mechanisms investigation. J. Hazard. Mater. 2018, 347, 141–149. [Google Scholar] [CrossRef] [PubMed]
- Sawai, J.; Kojima, H.; Igarashi, H.; Hashimoto, A.; Shoji, S.; Sawaki, T.; Hakoda, A.; Kawada, E.; Kokugan, T.; Shimizu, M. Antibacterial characteristics of magnesium oxide powder. World J. Microbiol. Biotechnol. 2000, 16, 187–194. [Google Scholar] [CrossRef]
- Dong, C.; Cairney, J.; Sun, Q.; Maddan, O.L.; He, G.; Deng, Y. Investigation of Mg(OH)2 nanoparticles as an antibacterial agent. J. Nanopart. Res. 2010, 12, 2101–2109. [Google Scholar] [CrossRef]
© 2019 by the authors. Licensee MDPI, Basel, Switzerland. This article is an open access article distributed under the terms and conditions of the Creative Commons Attribution (CC BY) license (http://creativecommons.org/licenses/by/4.0/).