Article

Assessing Temporal and Spatial Inequality of Water Footprint Based on Socioeconomic and Environmental Factors in Jilin Province, China

1
School of Geographical Sciences, Northeast Normal University, Changchun 130024, China
2
School of Natural Resources, University of Missouri, Colombia, MO 65211, USA
*
Author to whom correspondence should be addressed.
Water 2019, 11(3), 521; https://doi.org/10.3390/w11030521
Submission received: 24 December 2018 / Revised: 7 March 2019 / Accepted: 9 March 2019 / Published: 13 March 2019
(This article belongs to the Section Water Resources Management, Policy and Governance)

Abstract

:
Freshwater resources are limited and uneven in their spatiotemporal distribution, and substantial increases in water demand from rapidly developing economies and concentrated populations place pressure on the available water. Research on the inequality of water footprint (WF) could provide countermeasures for the rational use and allocation of water resources. We evaluated the temporal and spatial inequality of WF using the Gini coefficient and imbalance index based on socioeconomic and environmental factors in Jilin Province. The results showed that from 2008 to 2015, the overall inequality of WF in Jilin Province was “relative equality”, and the inequalities between the WF and population, cultivated area were “high equality”; between the WF and gross domestic product (GDP) was “relative equality”; and between the WF and natural water endowment was “high inequality”. With respect to space, the differences of WF inequality were significant. In the west, the WF inequality changed greatly, from “relative equality” to “relative inequality” driven by population, GDP, cultivated area, and natural water endowment. In the middle, the WF inequality showed large internal differences with “high inequality” or “high equality” caused by GDP and natural water endowment. In the east, the WF inequality was relatively stable, at “high equality” or “neutral” affected by natural water endowment and population. The varied impact factors reflected the differences in natural resources and socioeconomic conditions in the various regions, and the results might provide a theoretical basis for guiding the rational allocation of water resources.

1. Introduction

Water is a crucial element to human survival, societal development, and ecologic maintenance [1,2]. However, the global distribution of available water and populations is uneven; therefore, inequality exists in human access to freshwater resources [3]. China accounts for 20% of the world’s population, whereas its water resources only account for approximately 6% of the total water resources in the world, and the per capita occupancy volume is only a quarter of the world average [4]. In addition to the shortage of water resources, the spatiotemporal distribution of water resources is also uneven in China. The rainfall is concentrated in summer and decreases from the southeast coast to the northwest inland area. In addition, a mismatch exists between the water resources and the distribution of the population in many regions in China [5]. For instance, the northern population accounts for 42.1% of the total population, but its water resources account for only 19% of the total water resources in the country. Accelerated urbanization, mass migration, increased population concentration, and the rapid development of socioeconomics have stressed freshwater resources [6]. Therefore, equal allocation of water among different regions is necessary to meet water demands for the society, economy, and ecological environment.
The equality of water use is aimed at meeting the reasonable allocation of water resources and their benefits to all water users [7]. At present, research into inequality is being conducted by increasingly more researchers. They have found that countries facing water inequalities increase the likelihood of water conflicts [8]. Studies have addressed inequality in water supply and water use at the prefecture [9], basin [7,10], and national level [11,12]. Researchers have developed a multi-criteria decision tool [13] and a multi-objective model [14] to mitigate the problem of water allocation. They analyzed how principles of equity and sustainability are being applied to water allocation [15]. Although these studies discussed the equality of physical water use, such as drinking water, domestic water use, water supply, and water allocation, few have paid attention to water footprint (WF) inequality.
The research of WF inequality could provide fresh ideas on the judicious use and allocation of water resources. WF is a multi-dimensional indicator that reflects the amount of water consumed, the type of water source, and the amount of pollution. The WF has three components: blue, green, and grey. The blue WF refers to the consumption of surface water and groundwater; the green WF refers to consumption of the rainwater stored in the soil; and the grey WF indicates water pollution and is defined as the volume of fresh water that is required to assimilate a load of pollutants, given natural background concentrations and existing ambient water quality standards [16,17]. The WF of a geographic area is defined as the total freshwater consumption and pollution within the boundaries of an area plus the virtual water import minus the virtual water export [18]. Virtual water is mostly used in the context of international or interregional trade that is closely linked with economic activities. Some studies have concluded that virtual water transfer is not sufficient to equalize water use among nations, primarily because internal agricultural water use, the main contributor to inequality, dominates national water needs and cannot be completely compensated by current volumes of virtual water transfers [19,20]. However, virtual water trade could redistribute water in space from water-abundant to water-scarce regions to alleviate water inequality in China [21]. Dong et al. found that the water use was at “relative equality” from 1997 to 2011 in a study related to WF inequality, and a consideration of space showed that most provinces belonged to moderately or highly inequitable areas in China [22]. In addition, Sun et al. found that the Gini coefficient was reduced from 0.29 in real water use to 0.22 in the WFs in China, and the main source of WF inequality was from agricultural WFs, followed by industrial, tertiary, and domestic WFs [21].
Most of the previous studies focused on WF inequality at the national level, with less being done at the provincial and municipal levels. Studies concerning WF at relatively fine levels (e.g., provincial and municipal levels) had some successes on accounting method and evaluation [23,24,25,26], but could seldomly answer whether WF matched local water resource distribution, as well as socioeconomic and environmental conditions. Hence, research into WF inequality at provincial and municipal levels could identify specific issues of water shortage and formulate strategies for water resource management. In this paper, we calculated the WFs (blue, green, and grey WFs) of nine prefectures in Jilin Province from 2008 to 2015. The Gini coefficient and imbalance index were implemented to measure the temporal and spatial inequality of the WF in Jilin Province based on socioeconomic and environmental factors including population, gross domestic product (GDP), cultivated area, and natural water endowment. This study aimed to analyze the temporal variation and spatial differentiation of WF inequality among the eastern, middle, and western Jilin Province and to determine the degree of inequality and the key impact factors. Thus, the areas where WFs were unequal in Jilin Province could be identified. The results of this study could provide valuable information for water resource managers and policy makers to guide the rational allocation of water resources and to mitigate water scarcity in Jilin Province.

2. Materials and Methods
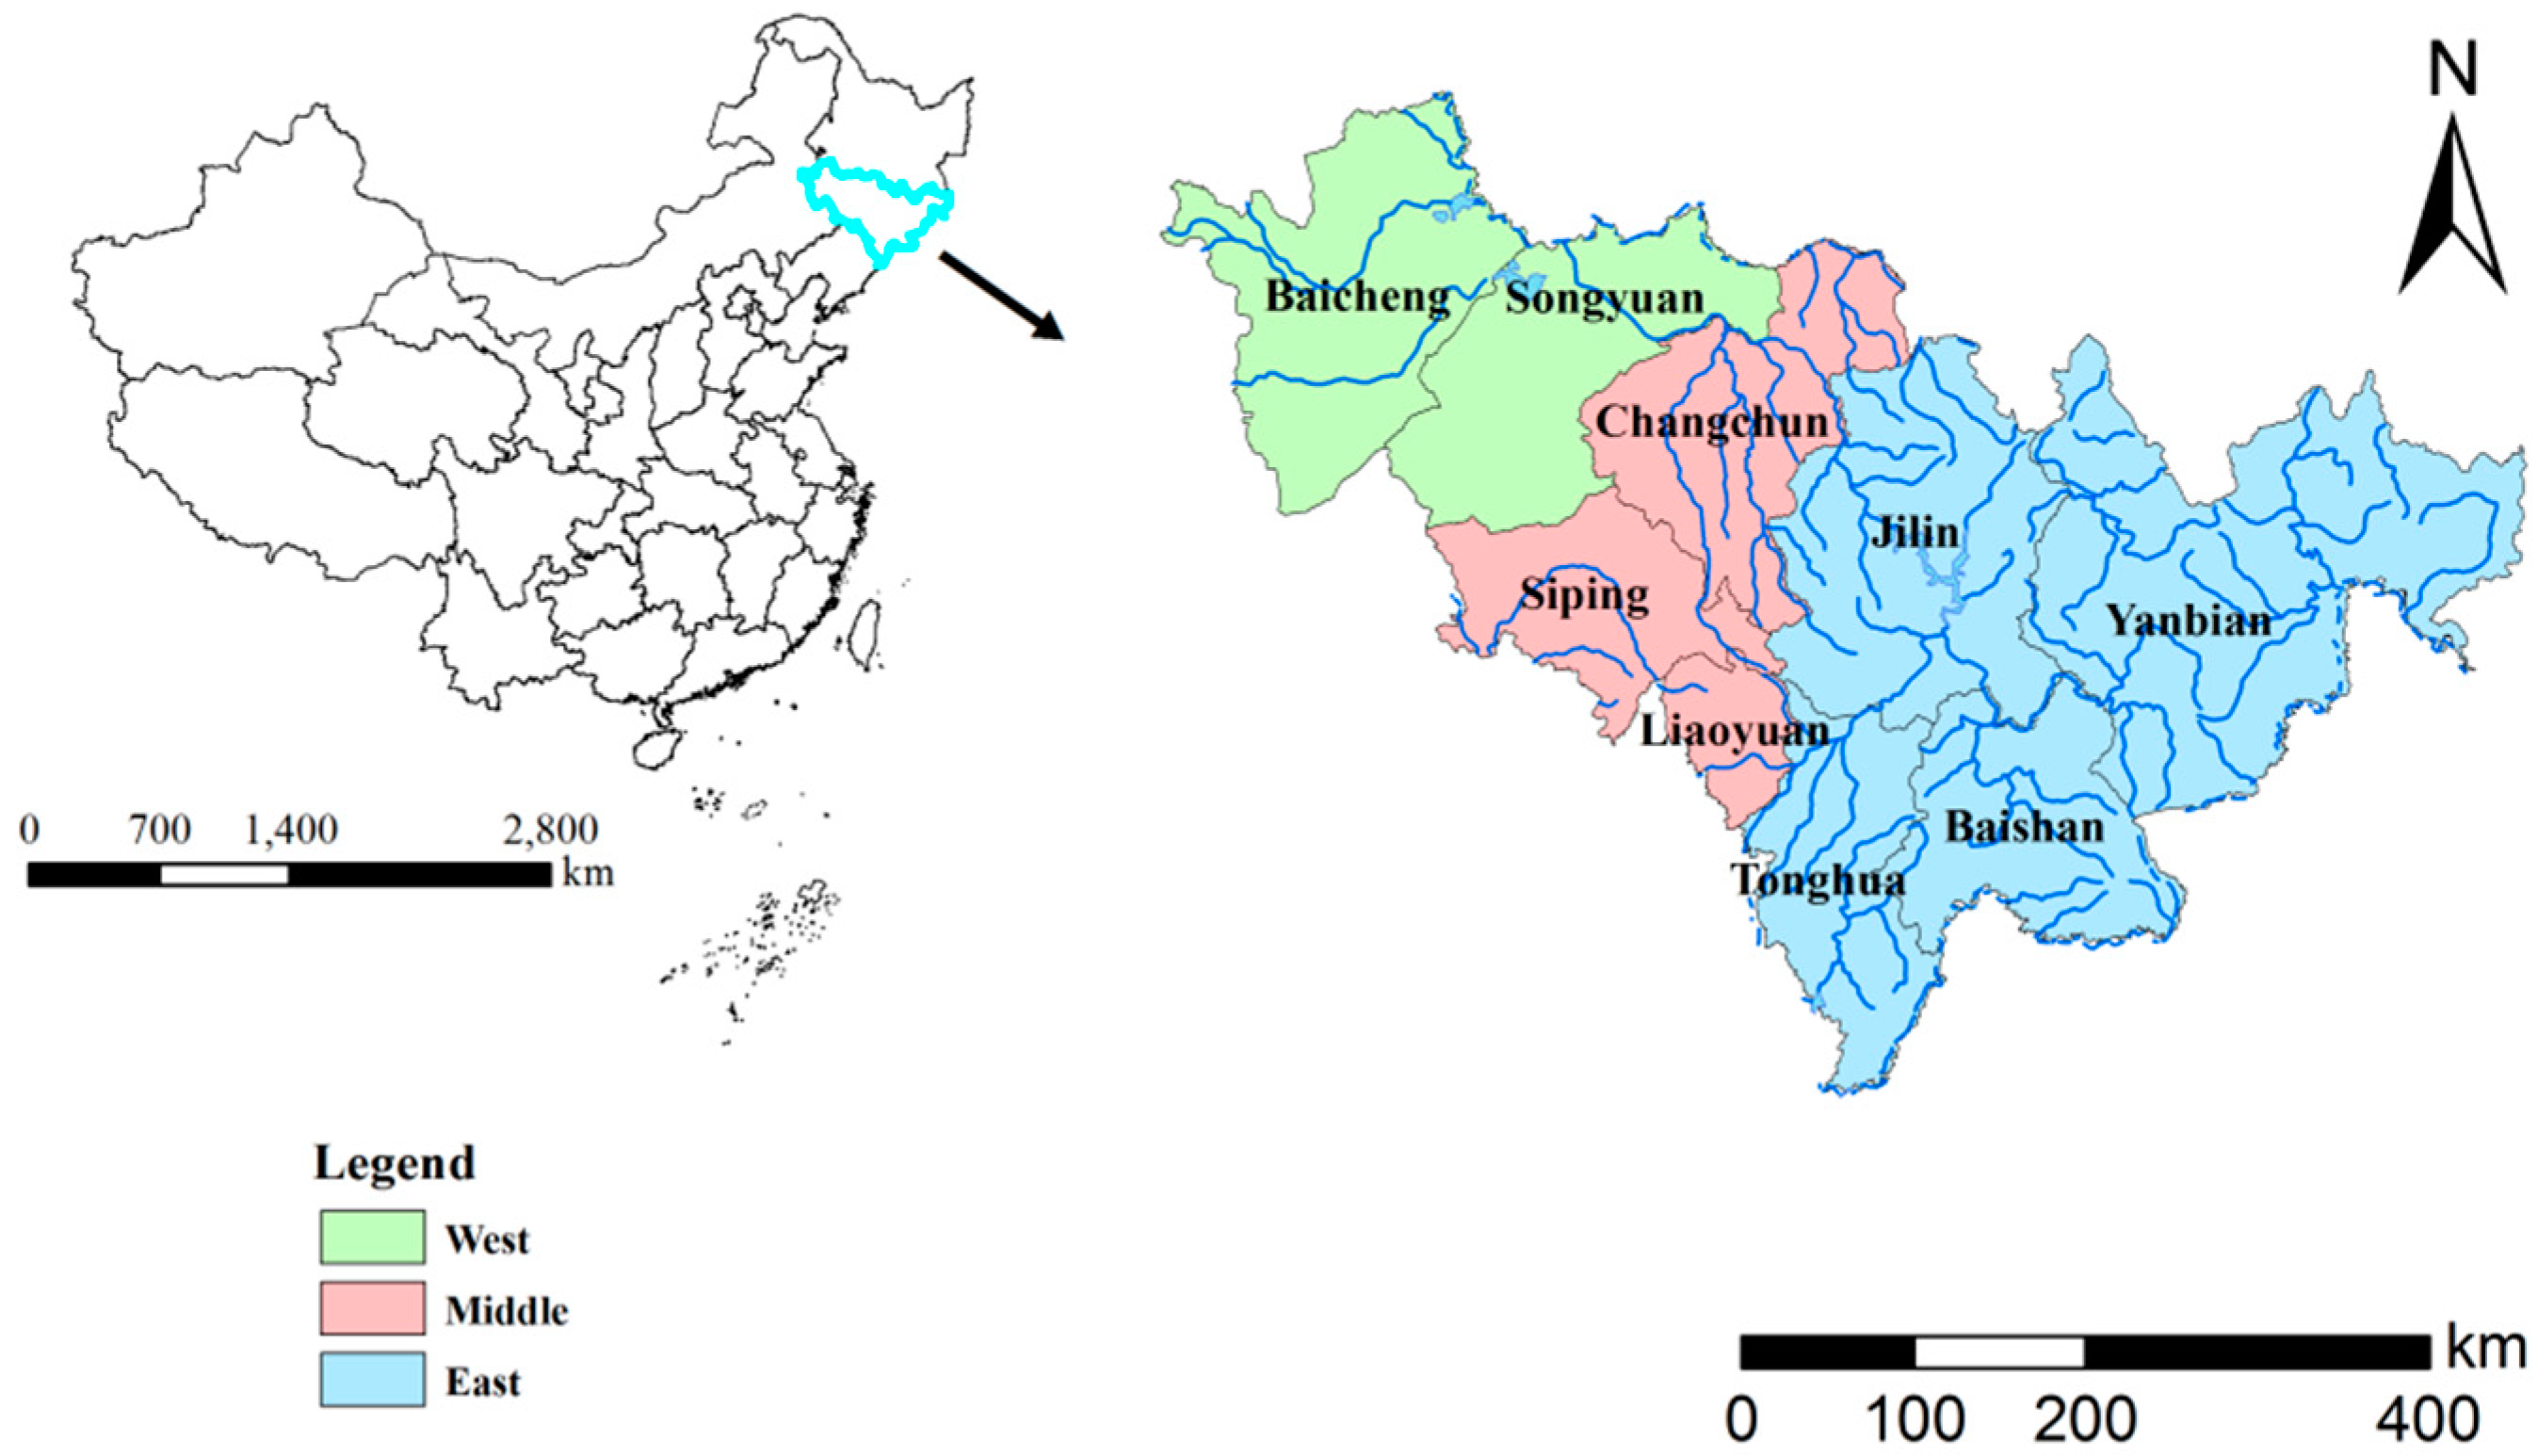
2.1. Study Area

Jilin Province is located in northeastern China (Figure 1), which is a moderately water-deficient area according to international standards [27]. The average annual precipitation in Jilin Province is 609.1 mm, and the precipitation is mostly concentrated in June to September, accounting for 65–85% of the annual precipitation [27,28], and gradually decreases from east to west. Therefore, the spatiotemporal distributions of water resources show notable differences. The average annual surface water resources in the east are 31.0 billion m3, while those in the midwest are only 3.4 billion m3 [27]. Moreover, Jilin Province is one of the major agricultural provinces in China, and the water consumption of agricultural irrigation accounted for the majority of total physical water consumption, which was as much as 62.3% [29].
Jilin Province is usually divided into three partitions of east, middle, and west, according to the geographical location and natural conditions; the east includes the four prefectures of Jilin, Baishan, Tonghua, and Yanbian; the middle includes the three prefectures of Changchun, Siping, and Liaoyuan; and the west includes Baicheng and Songyuan (Figure 1). Topographically, the east is a mountainous region with abundant rainfall and a dense river network, through which the Yalu River and the Tumen River pass. The middle is a plain region with moderate rainfall, where the soil is fertile and vast, and the west is a meadow region with less rainfall, where the soil fertility is lower and more lakes and wetlands are distributed. Natural conditions are more superior in the middle of Jilin Province, with a high population density and high level of economic development. The regional differences of the population, GDP, cultivated area, and natural water endowment in Jilin Province were obvious (Figure 2).

2.2. Data Sources

The meteorological data were acquired from the China Meteorological Data Sharing Service System [30]. The crop water demand was measured by CROPWAT 8.0 software [31]. The statistical data, which included the sown area and yield of every crop, consumption of fertilizer, industrial and domestic wastewater discharges, import and export trade value, population, GDP, and cultivated area, were obtained from Jilin Province Statistical Yearbook (2009–2016) [32]. Water consumption and other water resources data were obtained from the Jilin Province Water Resources Bulletin (2008–2015) [33].

2.3. WF Accounting

The water footprint of the regional consumption (WFcons, m3/year) was calculated as the water footprint within a geographically delineated area (WFarea, m3/year) plus the virtual water import (VWi, m3/year) minus the virtual water export (VWe, m3/year).
W F c o n s = W F a r e a + V W i V W e
WFarea was calculated as the sum of all processes water footprints in the area [18]; the formula is as follows:
W F a r e a = A W F + I W F + D W F + E W F + P W F ,
where AWF refers to the agricultural water footprint (m3/year), IWF refers to the industrial water footprint (m3/year), DWF is the domestic water footprint (m3/year), EWF is the ecological water footprint (m3/year), and PWF is the public water footprint (m3/year).
AWF included the WF for growing crops and for stockbreeding. The total WFs of the rice, maize, soybeans, sunflowers, tobacco, and vegetables were calculated because the sown areas of these six crops accounted for more than 90% of the total sown area in Jilin Province. The WFs of the crops could be computed by the methods in Hoekstra et al. [18] and Duan et al. [34], and then times the total output. The formulas of the crop WF of per unit mass are as follows:
W F c r o p , t o t a l = W F c r o p , g r e e n + W F c r o p , b l u e + W F c r o p , g r e y ,
where WFcrop,total is the WF of crop production (m3/kg), WFcrop,green is the green WF (m3/kg), WFcrop,blue is the blue WF (m3/kg), and WFcrop,grey is the grey WF (m3/kg).
W F c r o p , g r e e n = C W U g r e e n Y = 10 × E T g r e e n Y ,
W F c r o p , b l u e = C W U b l u e Y = 10 × E T b l u e Y ,
where CWUgreen and CWUblue are green and blue water usage (mm), respectively; ETgreen and ETblue are green and blue water evapotranspiration (mm), respectively; Y is the crop yield (kg/hm2); and the factor 10 converts water depths in millimetres into water volumes per land surface in m3/hm2.
W F c r o p , g r e y = ( α × A R ) / ( C max C n a t ) Y ,
where AR is the chemical application rate to the field (kg/hm2); α is the leaching-run-off fraction; Cmax is the maximum acceptable concentration (kg/m3); and Cnat is the natural concentration for the pollutant considered (kg/m3).
The stockbreeding WF could be calculated based on the studies by Chapagain and Hoekstra [35], de Miguel et al. [36], and Hou [37]. IWF was difficult to calculate because of the complexity of industrial processes; it could be simplified as the sum of the industrial water uses (blue water) and industrial grey water. DWF could be obtained from domestic water uses (blue water) plus domestic grey water. EWF approximately equaled the ecological water uses (blue water), and PWF consisted of construction industrial water uses (blue water) and service sectoral water uses (blue water). Industrial and domestic grey water were computed by selecting the chemical oxygen demand (COD) and ammonia nitrogen (NH3-N) in industrial and domestic wastewater as the indicators [38]. The formula is as follows:
W F g r e y = max ( D c S C c , D n S C n ) ,
where Dc and Dn refer to the discharge of COD and NH3-N (kg/year), respectively; and SCc and SCn refer to the maximum allowable discharge concentration of COD and NH3-N (mg/L), respectively. According to Class 2 standards of the Integrated Wastewater Discharge Standard of China (GB8978-1996), the maximum allowable discharge concentrations of COD and NH3-N were 120 mg/L and 25 mg/L, respectively.
Because of the lack of detailed data on import and export trade, it was difficult to calculate VWi and VWe; therefore, this study used the calculation methods in Yu and Han [39].
V W i = T V i / GDP × W F area ,
V W e = T V e / GDP × W F area ,
where TVi is the import trade value (104 yuan/year), TVe is the export trade value (104 yuan/year), and GDP is the gross domestic product (104 yuan/year).

2.4. Inequality Evaluation Methods

The Gini coefficient, a ratio between 0 and 1, was originally proposed by the Italian economist Gini in the early 20th Century to measure the inequality of income through the Lorenz curve [40]. Usually, a Gini coefficient below 0.2 meant “high equality”, 0.2~0.3 meant “relative equality”, 0.3~0.4 meant “neutral”, 0.4~0.5 meant “relative inequality”, and above 0.5 meant “high inequality”. The Gini coefficient was also applicable to evaluating the inequality of the water use affected by spatiotemporal distribution of water resources. The coefficient could be applied to measuring the inequality of WF, and the trapezoidal area method [41] was used to compute the Gini coefficient in this paper.
The Gini coefficient of each single factor is calculated as follows:
G i n i = 1 i = 1 n ( X i X i 1 ) ( Y i + Y i 1 ) ,
where n is the number of prefectures, Xi is the cumulative proportion of each factor up to the ith prefecture in Jilin Province, Xi−1 is the cumulative proportion of each factor up to the (i−1)th prefecture in Jilin Province, Yi is the cumulative proportion of WF up to the ith city in Jilin Province, Yi−1 is the cumulative proportion of WF up to the (i−1)th prefecture in Jilin Province, and (Xi, Yi) is treated as (0, 0) when i = 1.
To highlight the multifactor functioning and the importance of each factor on the equality of WF, the comprehensive Gini coefficient G needed to be calculated, and the formula is as follows:
G = k = 1 n λ k G i n i k       ( k = 1 ,   2 ,   ,   n ) ,
where Ginik is the Gini coefficient of the kth factor, λ is the weight coefficient of the kth factor, and λ1 + λ2 + … + λn = 1. The weight coefficient was determined by the analytic hierarchy process (AHP) method [42,43] and the entropy method [44,45]. The subjective weight vector of the factors determined by AHP was ω = (ω1, ω2, …, ωm)T. A standardized decision matrix Z was obtained by standardizing the factor data, the objective weight vector of the factors determined by the entropy method was μ = (μ1, μ2, …, μm)T. Assume that the comprehensive weights of the factors were λ = (λ1, λ2,…, λn)T. In order to minimize the deviation of decision results, a least squares optimization decision model was established.
{ min H ( λ ) = i = 1 n j = 1 m { [ ( ω j λ j ) z i j ] 2 + [ ( μ j λ j ) z i j ] 2 } j = 1 m λ j = 1 λ j 0 ( j = 1 ,   2 ,   ,   m )
By constructing the Lagrangian function to solve this optimization model, the formula could be written as follows:
λ m 1 = B m m 1 [ C m 1 + 1 e 1 m T B m m 1 C m 1 e 1 m T B m m 1 e m 1 e m 1 ] ,
where λ m 1 = ( λ 1 , λ 2 , , λ m ) T ; B m m = d i a g [ i = 1 n z i 1 2 , i = 1 n z i 2 2 , , i = 1 n z i m 2 ] ; e m 1 = ( 1 , 1 , , 1 ) T ; C m 1 = [ i = 1 n 1 2 ( ω 1 + μ 1 ) z i 1 2 , i = 1 n 1 2 ( ω 2 + μ 2 ) z i 2 2 , , i = 1 n 1 2 ( ω m + μ m ) z i m 2 ] T .
The imbalance index was originally proposed to study the differences in the degree of urbanization [46]. The index was then applied to studying the relationships among water resources, water use, and their influencing factors [4,47]. In this study, the imbalance index was used to reveal the spatial inequality between WF and its influencing factors, which could measure the coordination between WF and impact factors and explain the degree of inequality in the various regions.
The distance between point (pi, qi) and the line y = x was recognized as a regional imbalance index for measuring the coordination between WF and each factor in a certain region. The regional imbalance index of each single factor is calculated as follows:
D = | d | = | 2 ( p i q i ) 2 | ,
where pi is the proportion of WF of ith prefecture in Jilin Province, and qi is the proportion of one factor of the ith prefecture in Jilin Province. When d > 0, the proportion of WF was higher than the proportion of one factor, and d < 0 indicates that the proportion of WF was lower than the proportion of one factor. The smaller D was, the greater the equality between the WF and one factor.
Considering the multifactor functioning and the importance of each factor on the equality of WF, the comprehensive imbalance index Dc needed to be calculated. The formula is as follows:
D c = k = 1 m λ k D k       ( k = 1 ,   2 ,   ,   m ) ,
where Dk is the imbalance index of the kth factor, λk is the weight coefficient of the kth factor, and λ1 + λ2 + … + λm = 1. The weight coefficients were the same as that in calculating the comprehensive Gini coefficient.

2.5. Socioeconomic and Environmental Factors

Population, GDP, cultivated area, and natural water endowment were used to evaluate the inequality of WF while the different aspects that affected the WF were being considered. Human beings were the main body of social development, so the population was bound to be an important factor influencing water use. The varied population would need different water consumption in time and space. GDP could reflect the level of economic development, and the Gini coefficient and imbalance index between WF and GDP could show the differences in the efficiency of water use and reveal the coordination between water use and economic level. The cultivated area could explain the agricultural land use, and the Gini coefficient and imbalance index between WF and cultivated area could highlight the matching situation between the water and agricultural land resources. In addition, the natural water endowment could show the existence of water resources, and the Gini coefficient and imbalance index between WF and natural water endowment could reflect the coordination between water allocation and water resource distribution.

3. Results

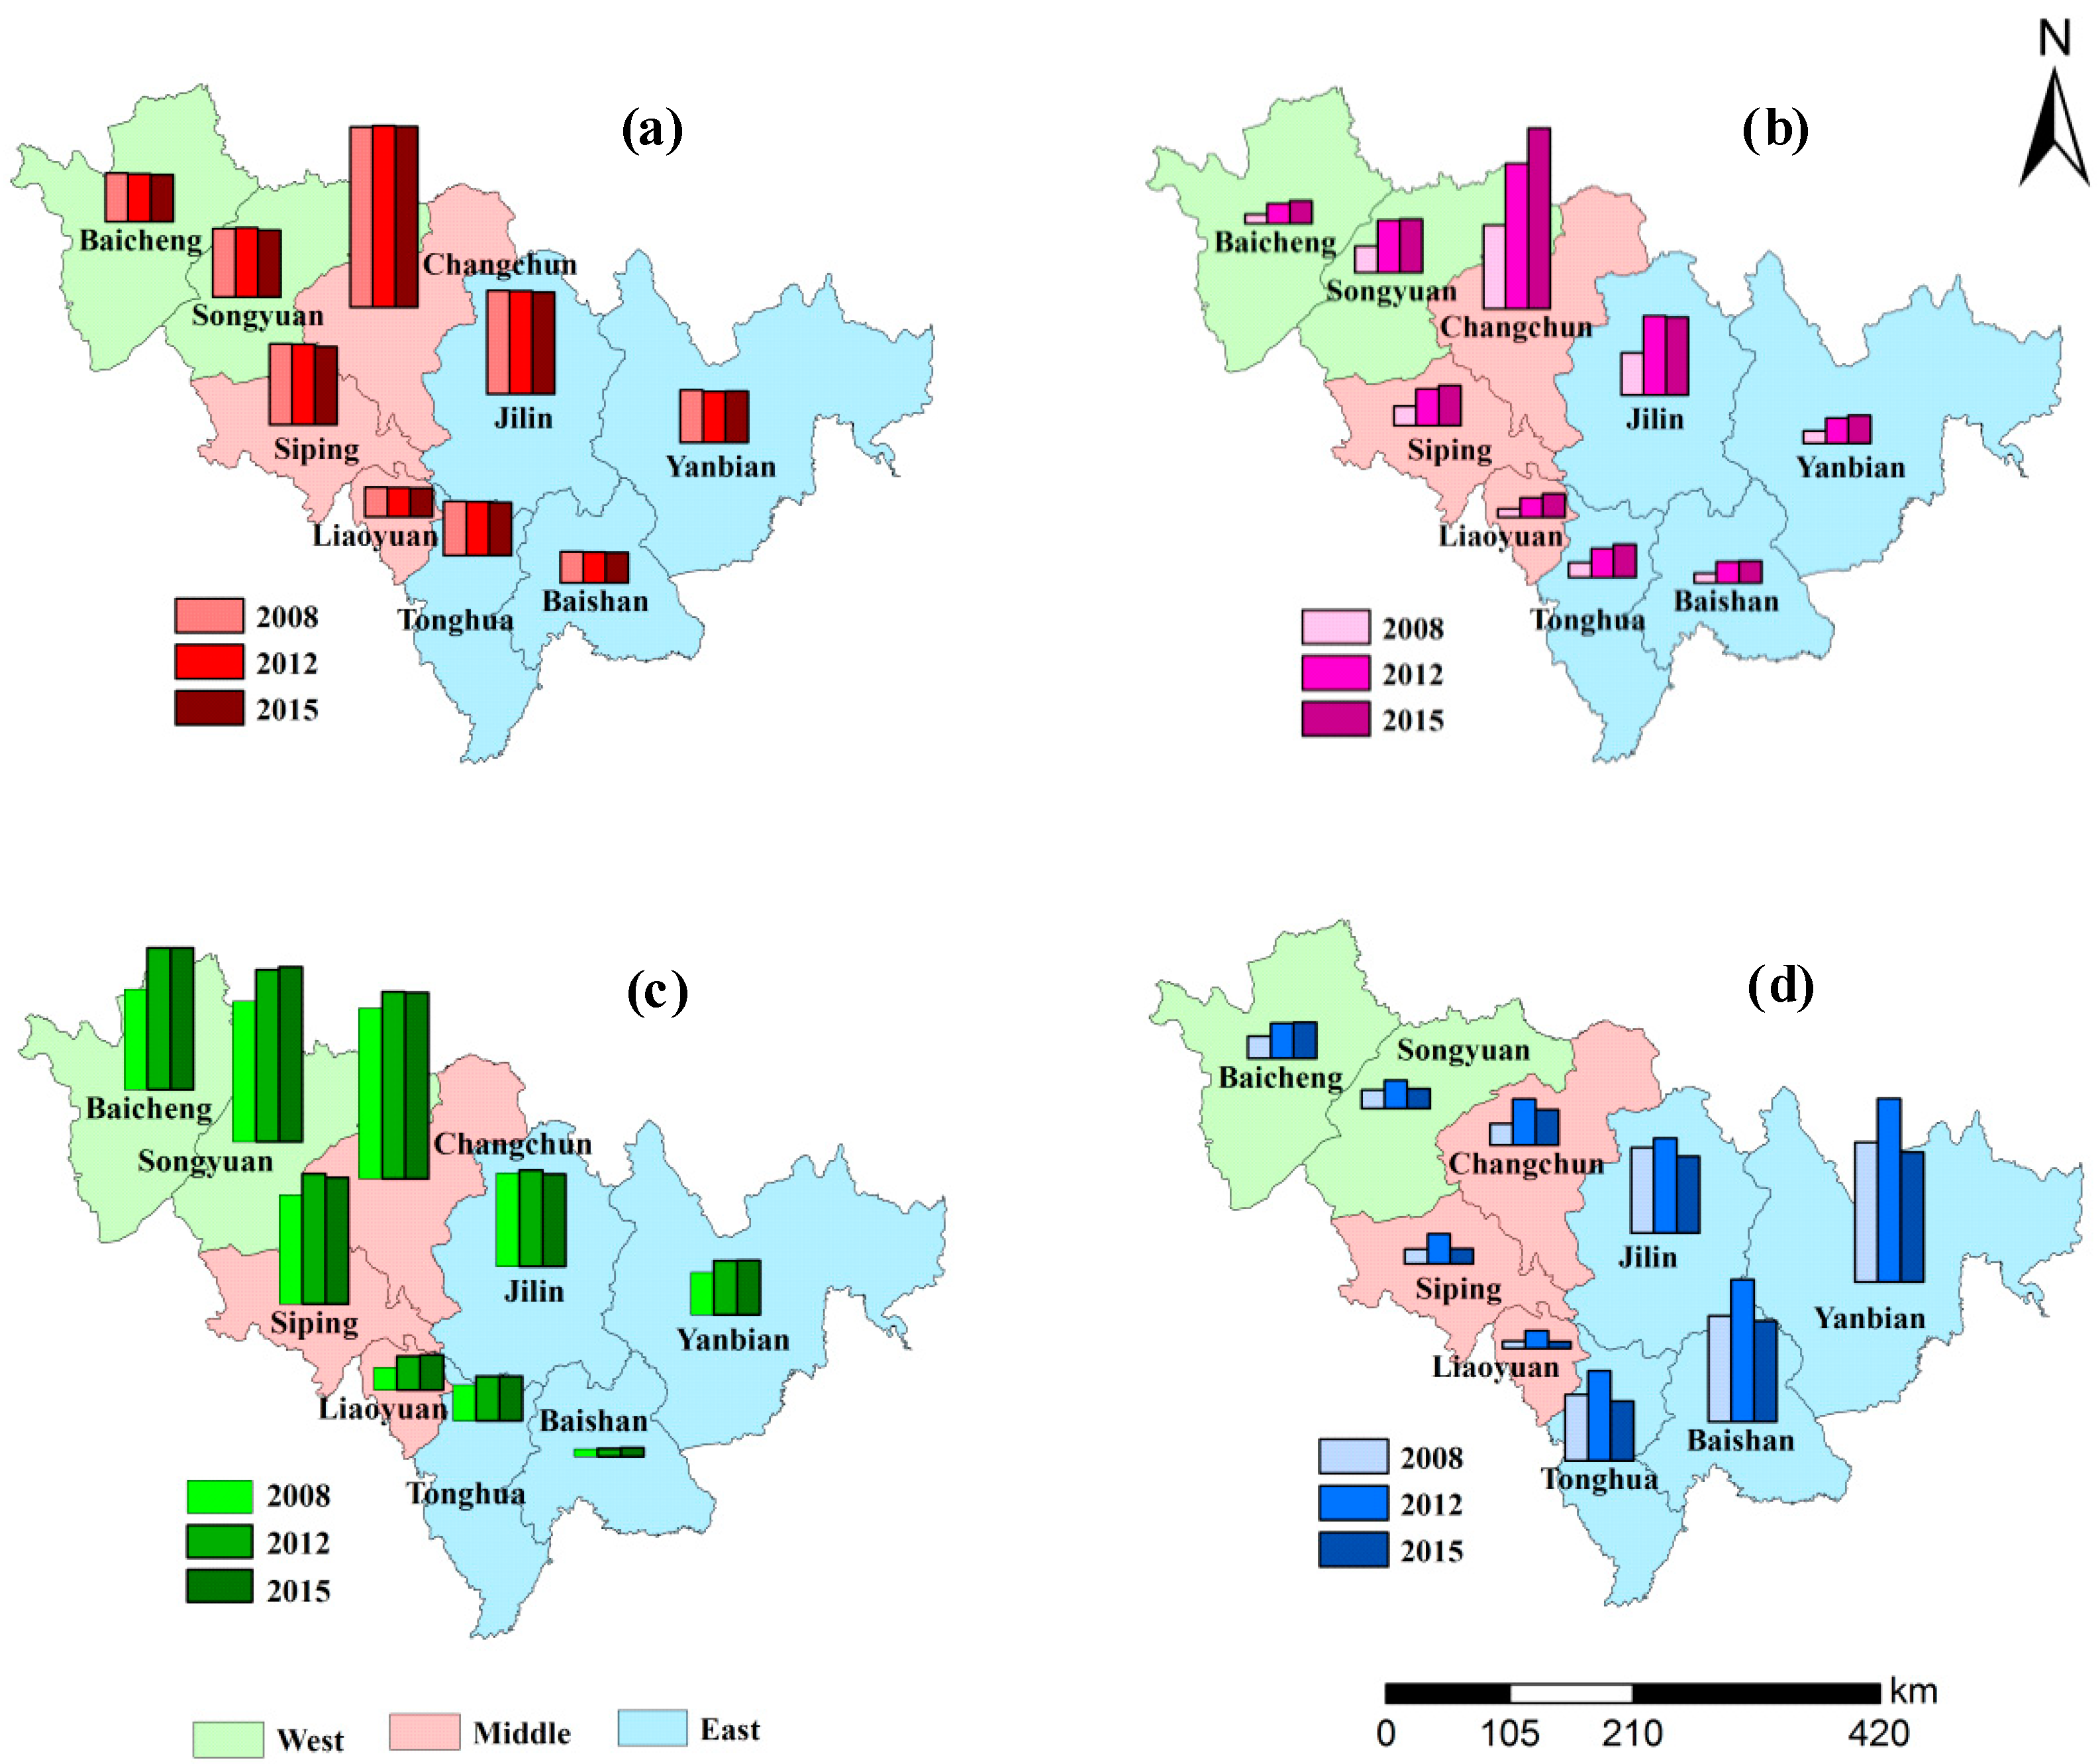
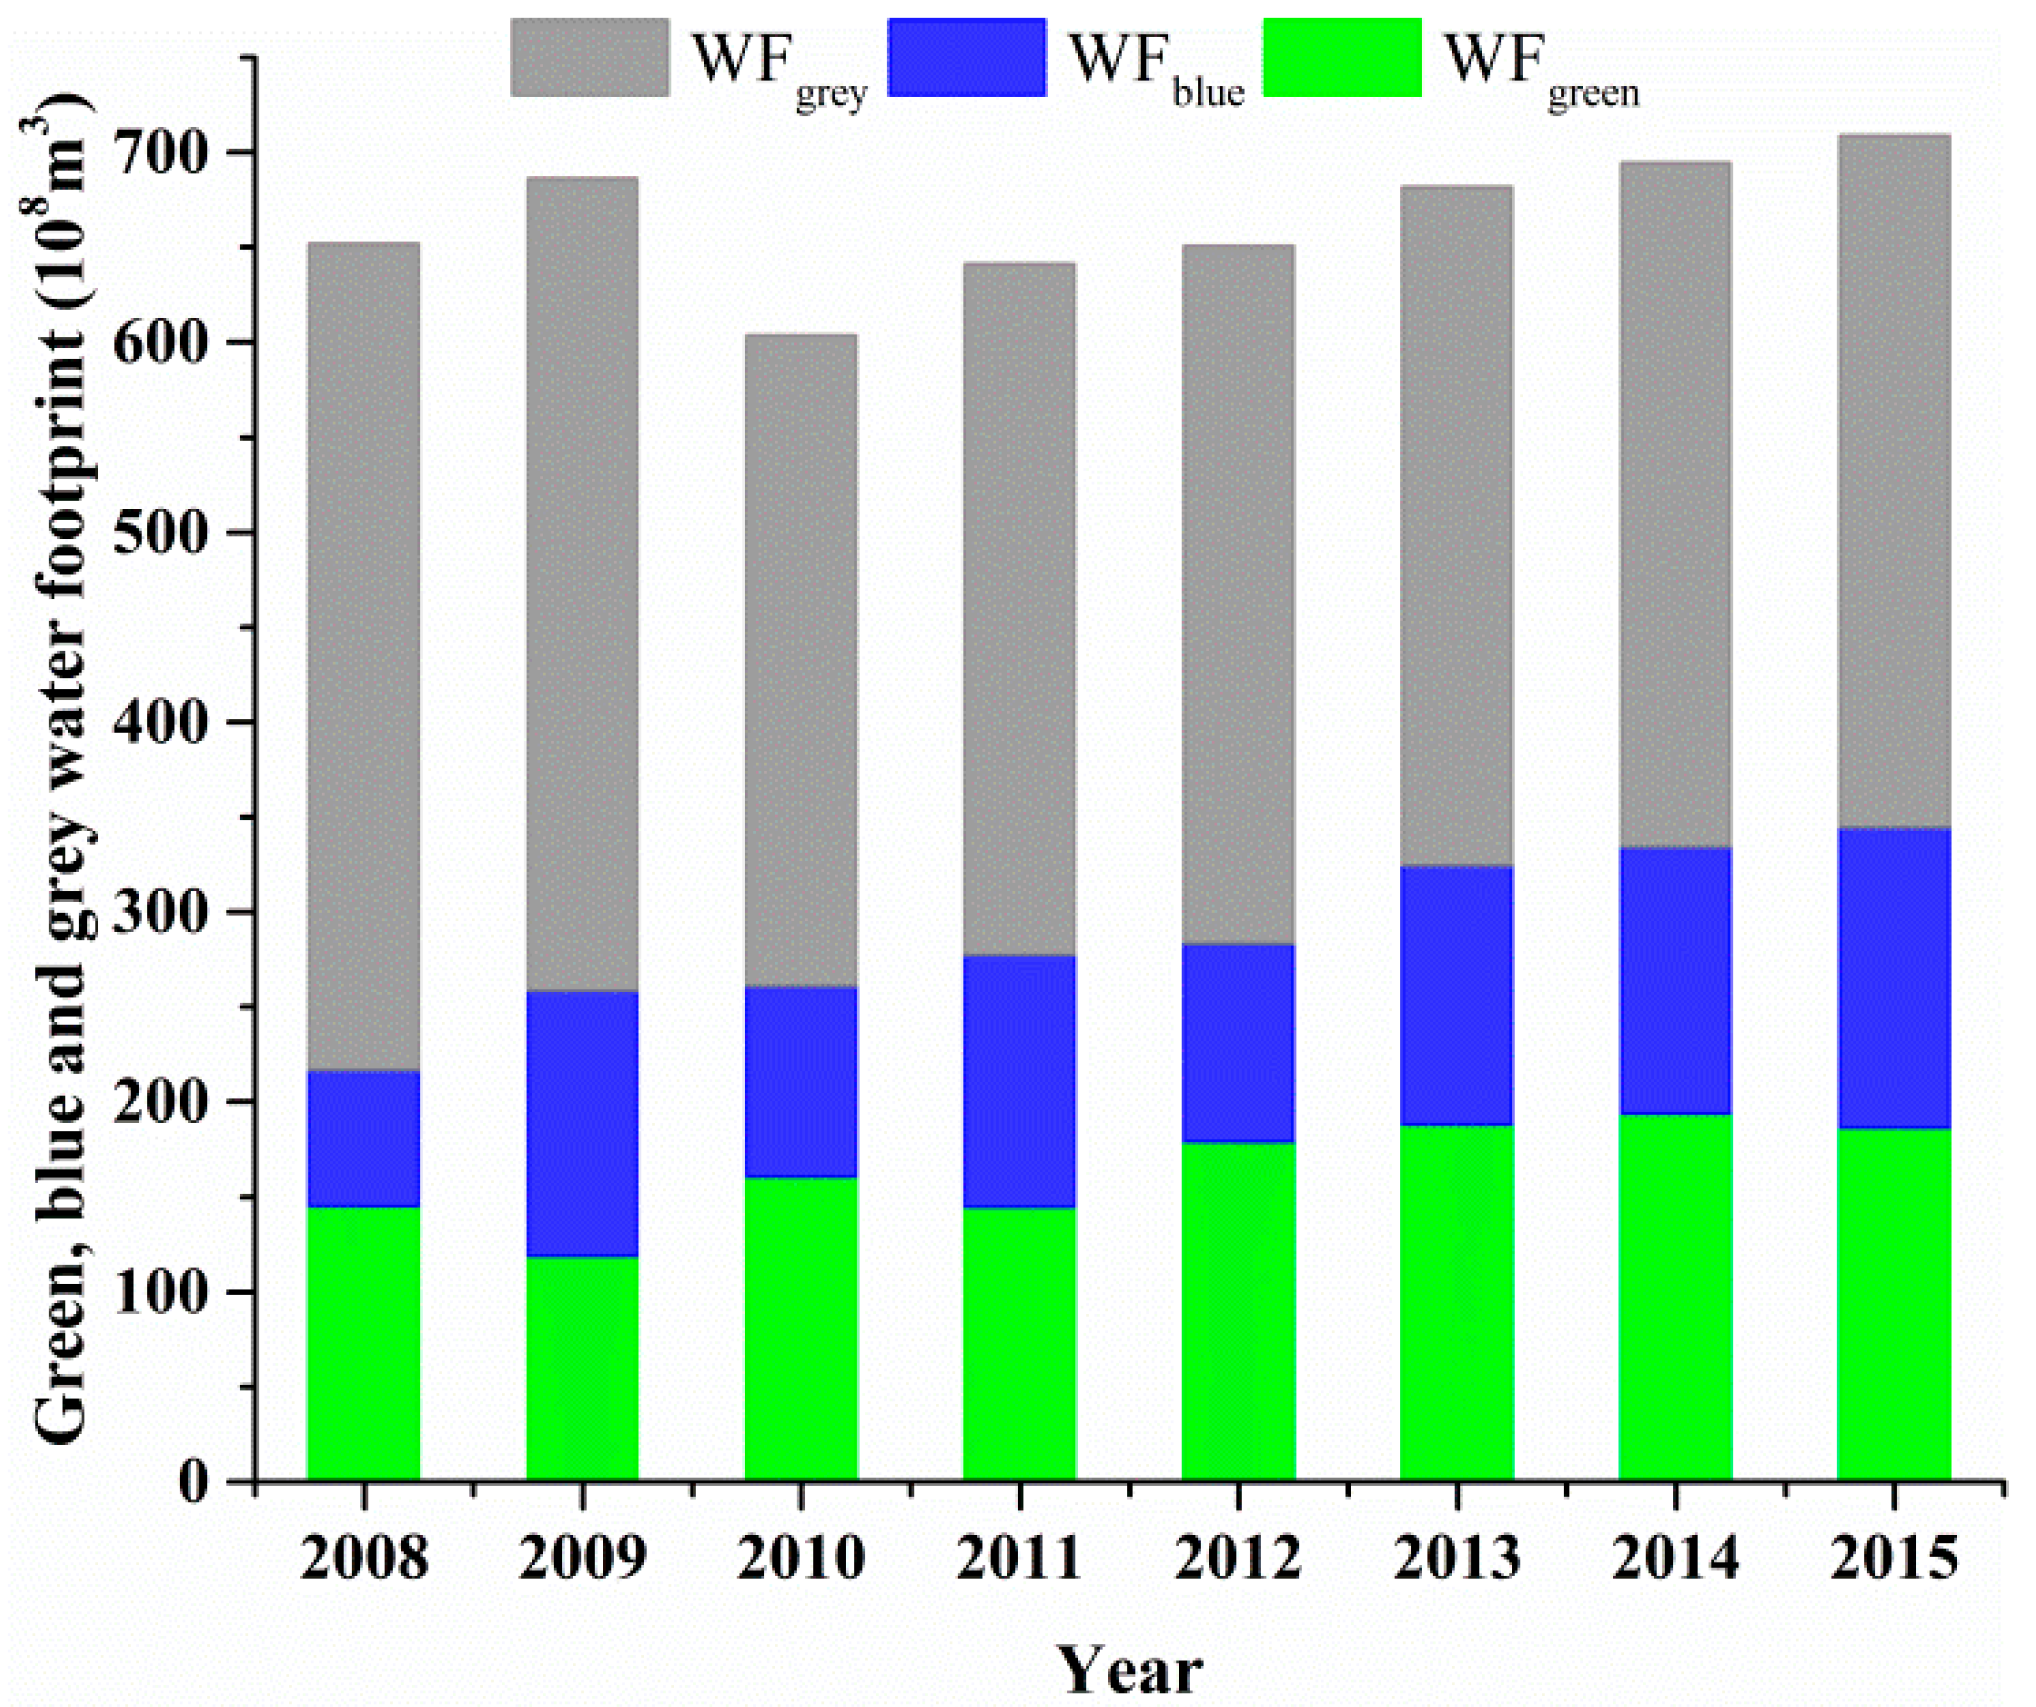
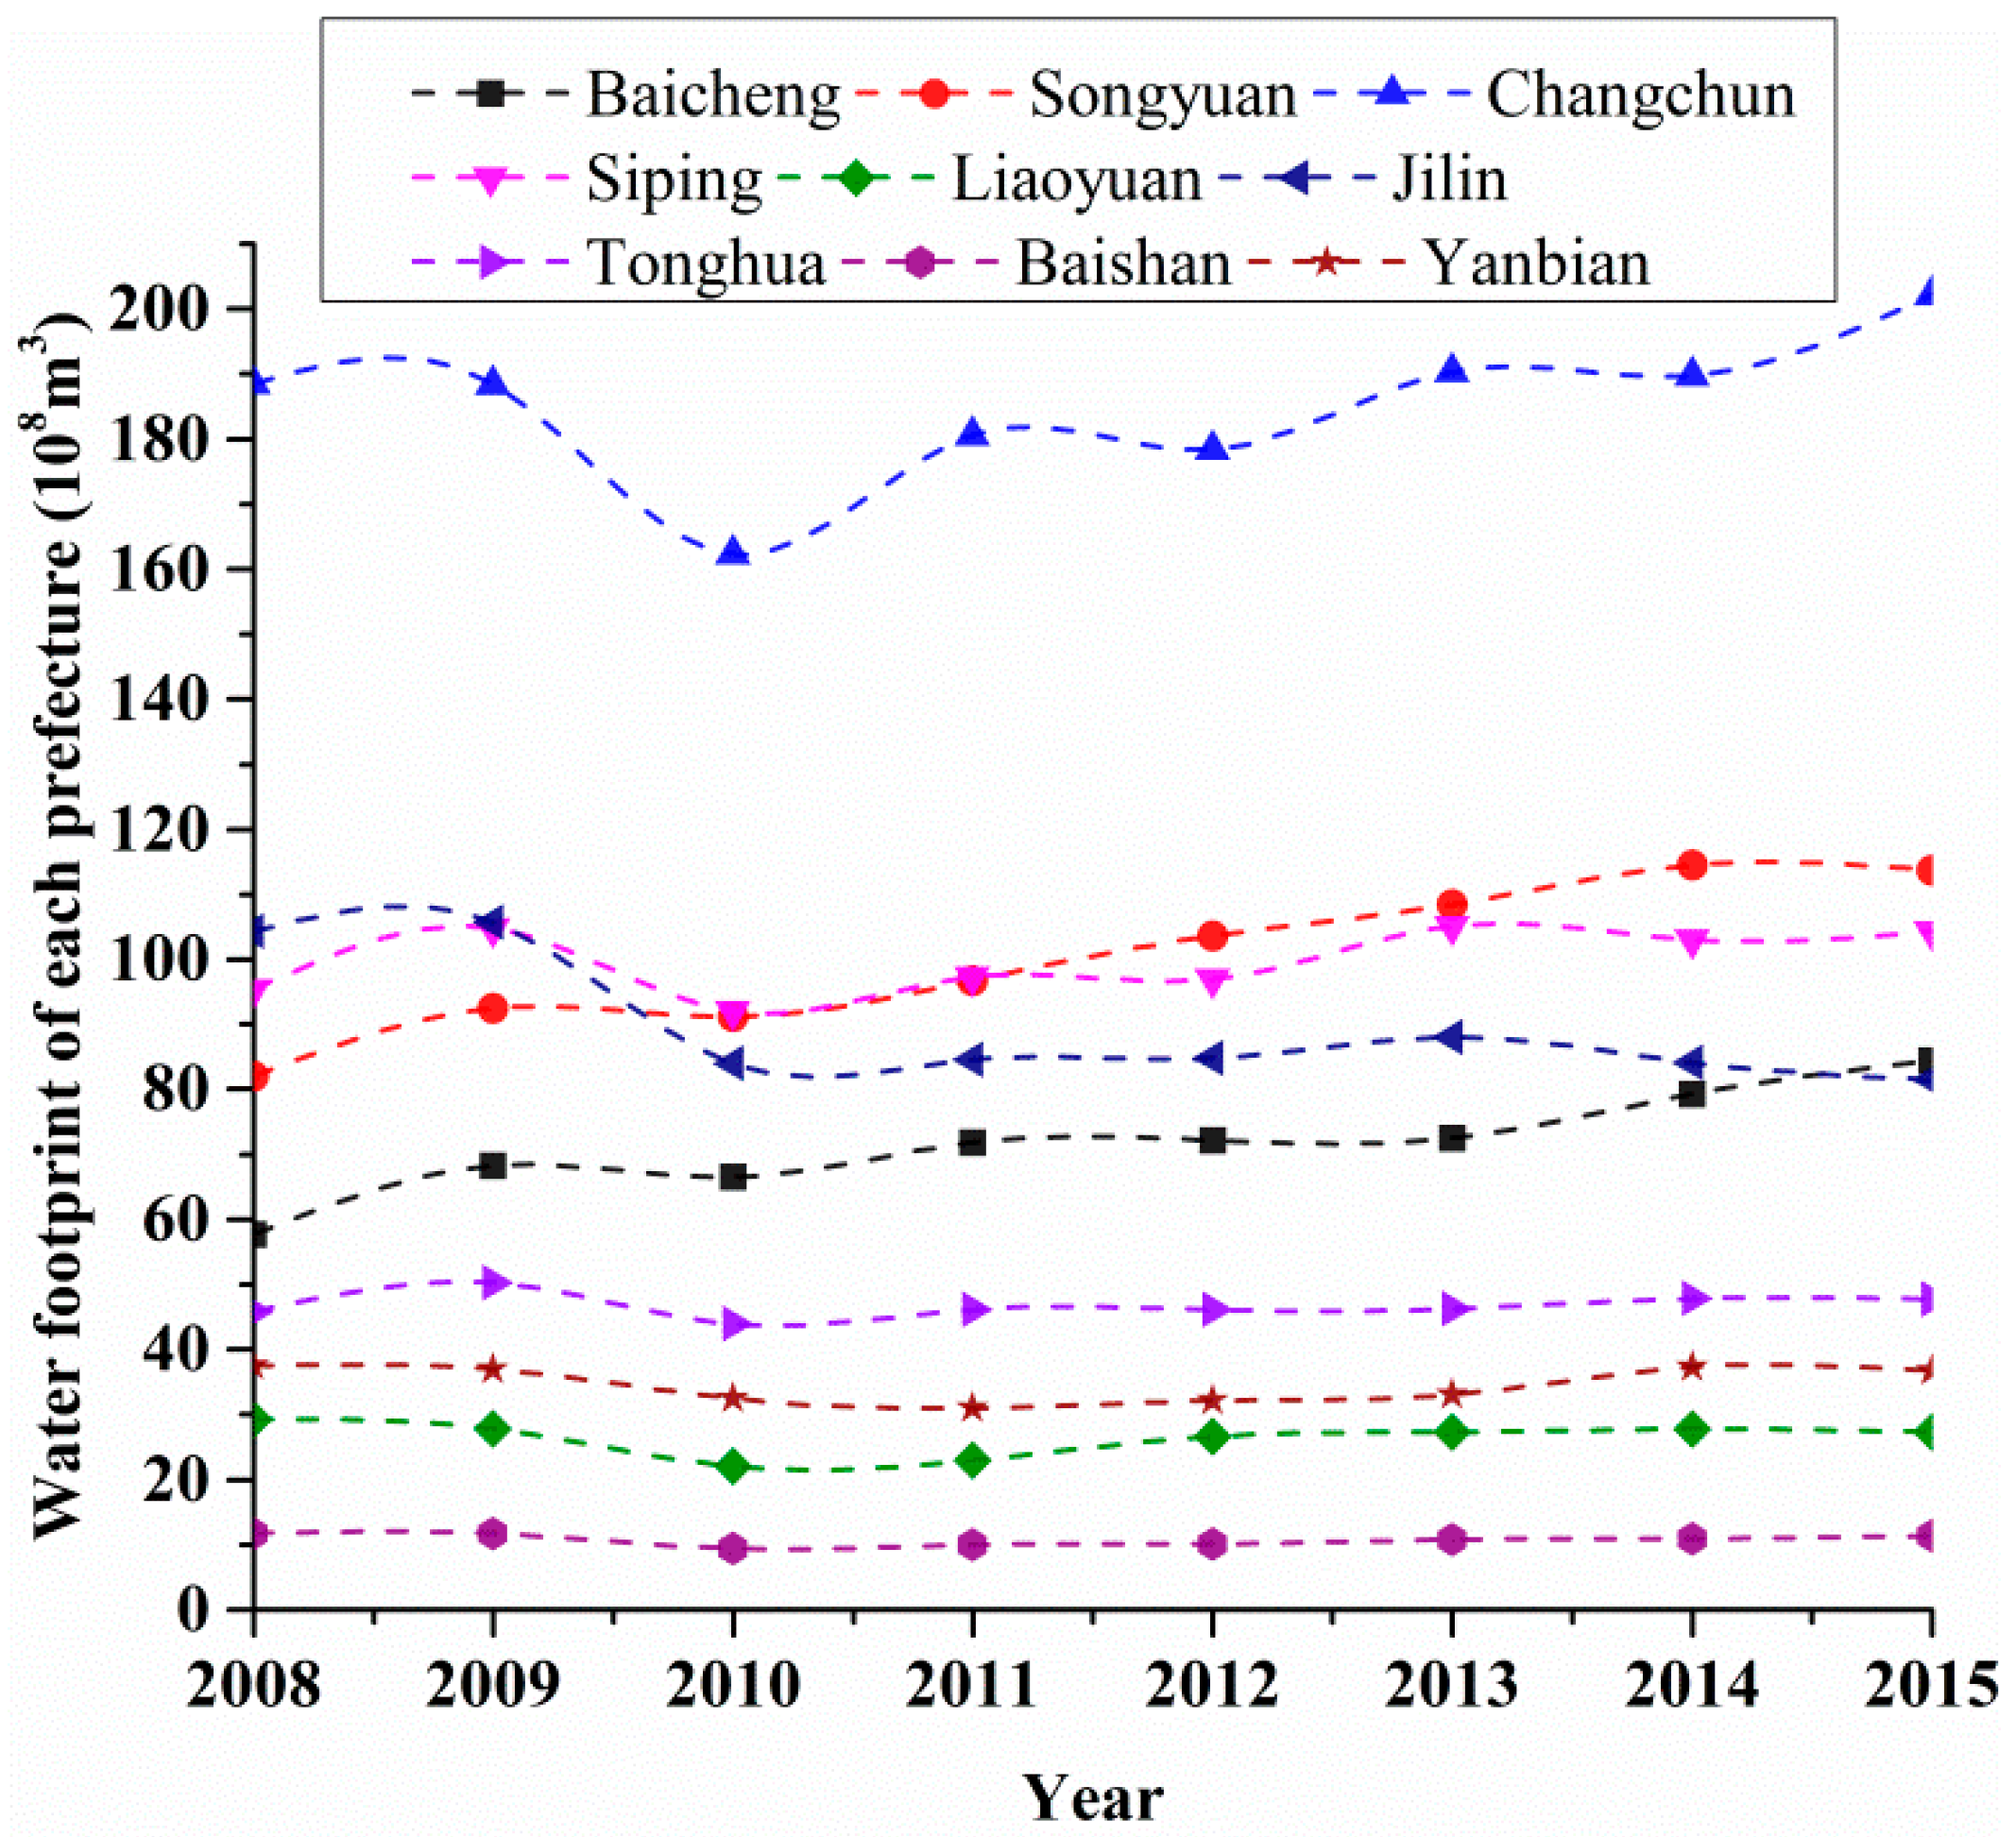
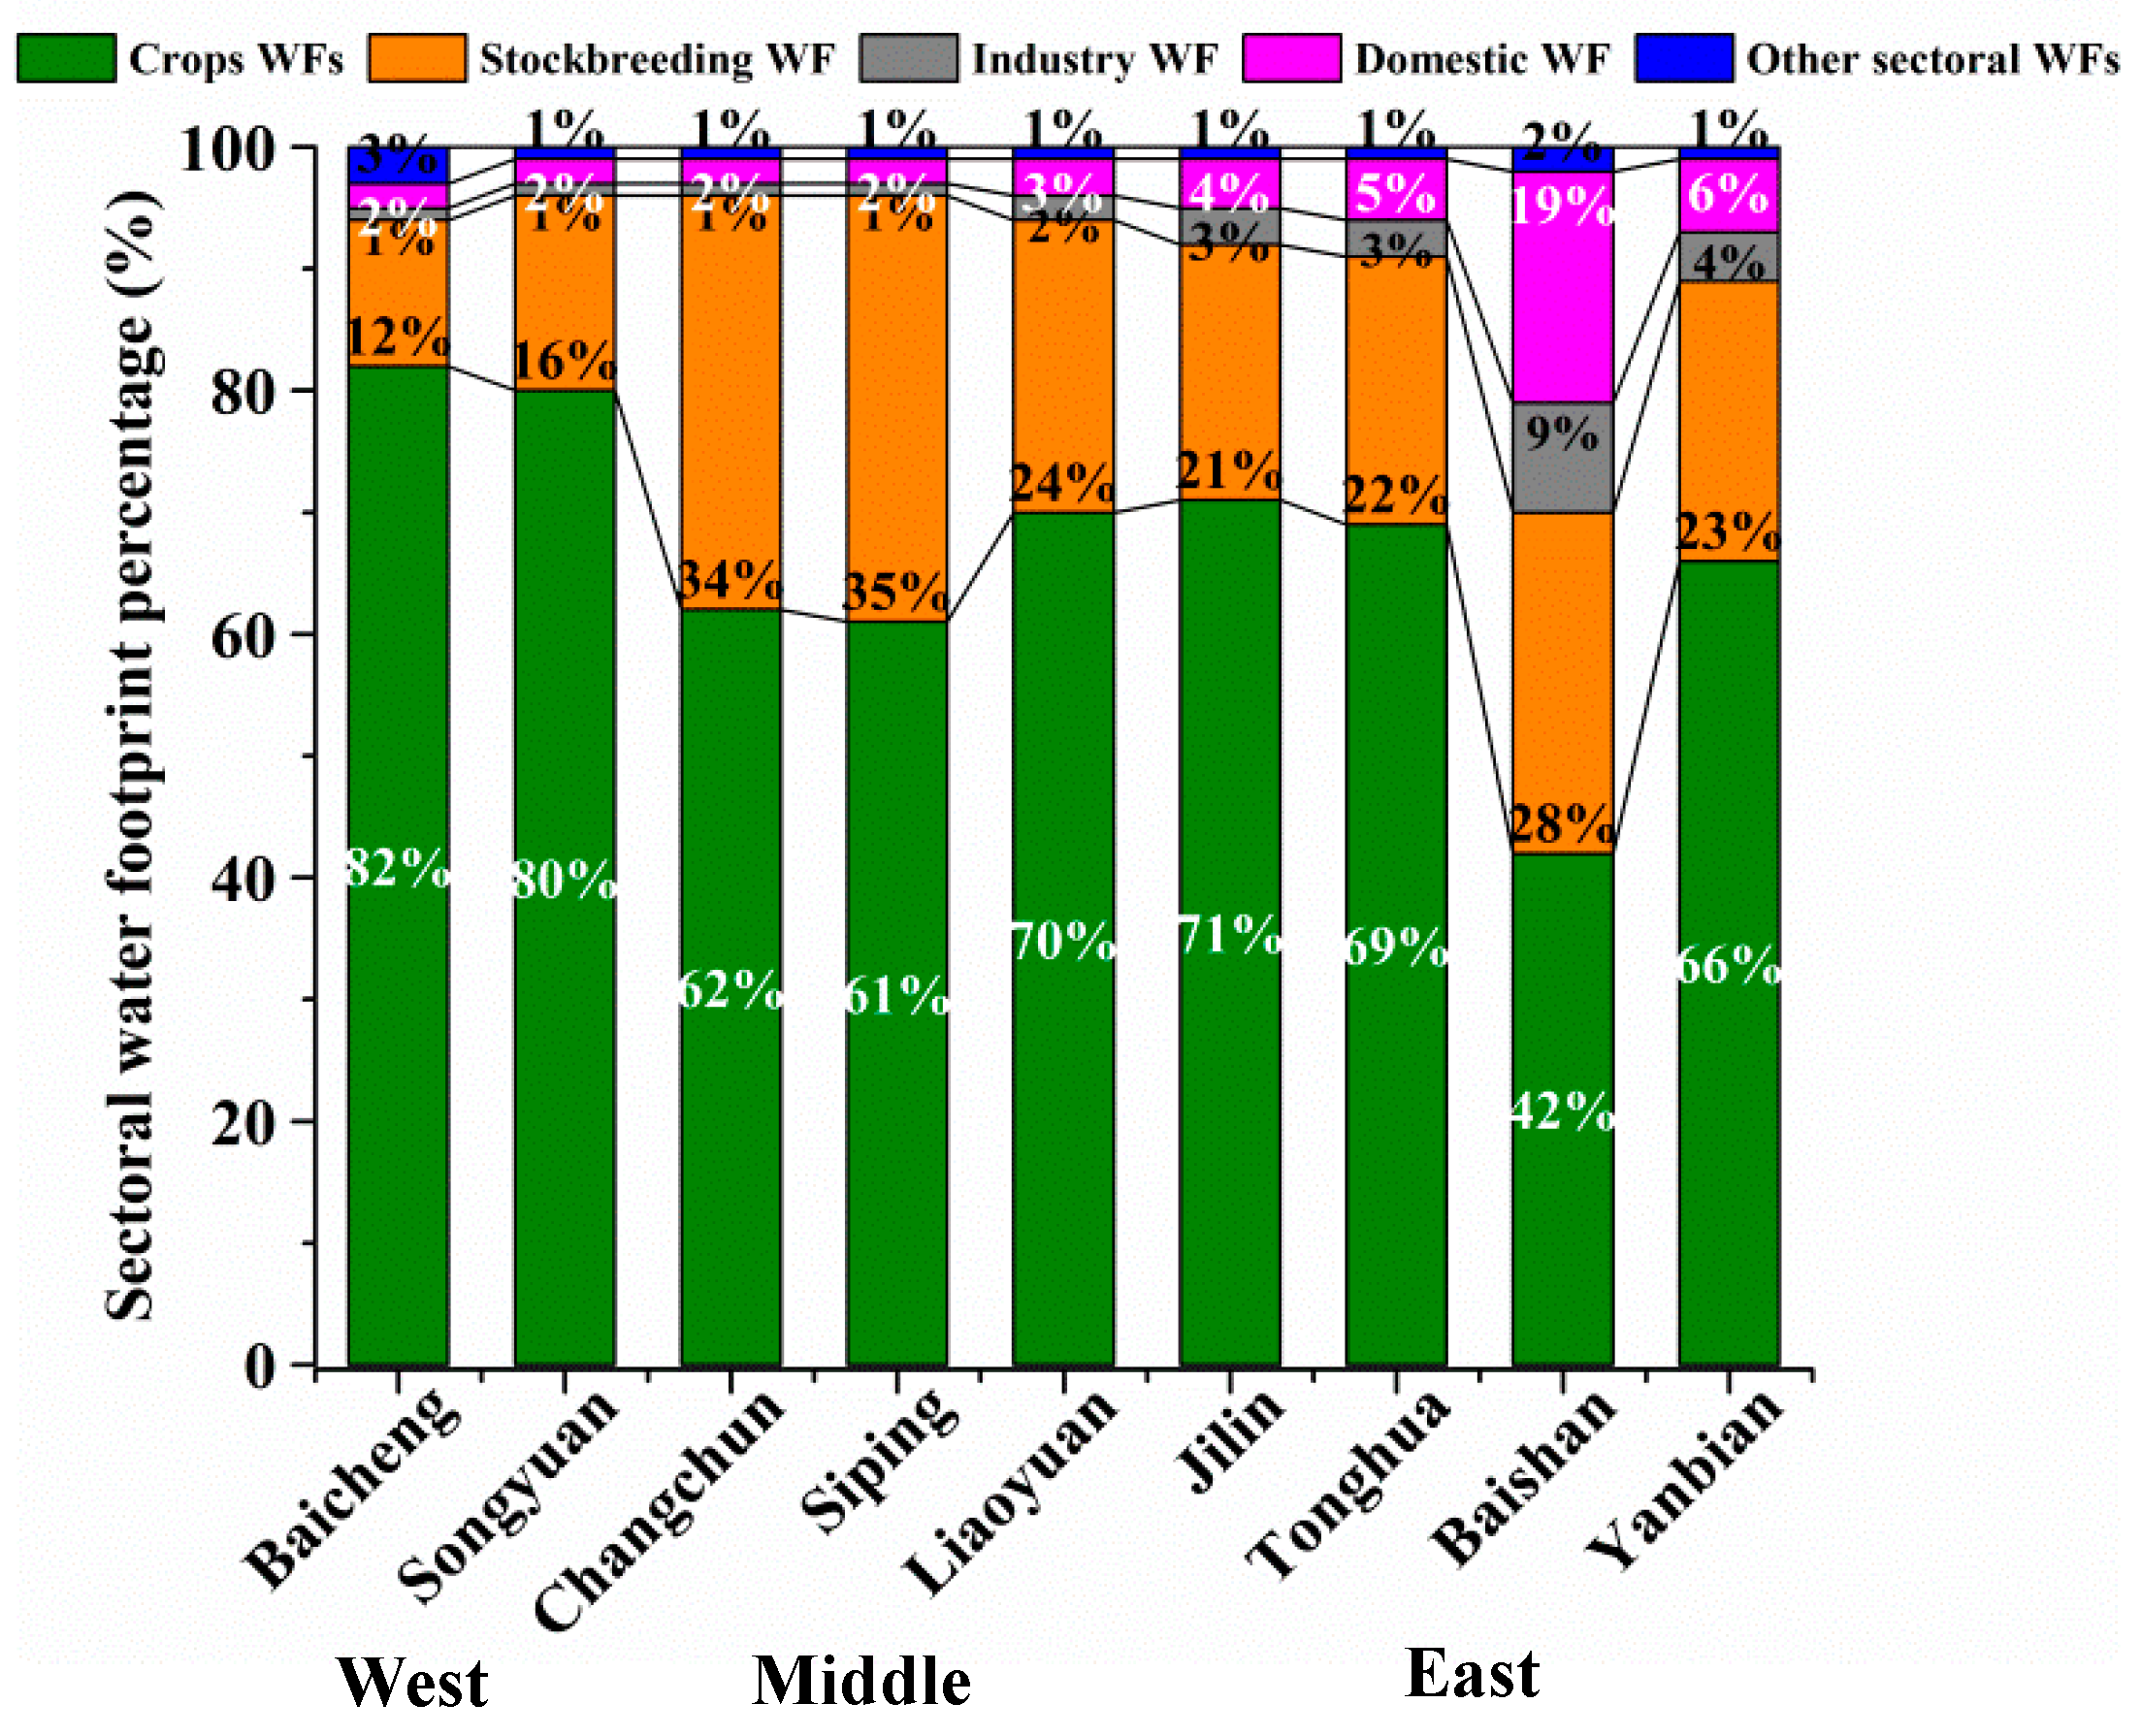
3.1. Characteristics of WF in Jilin Province

The annual average of the total WF was 6.65 × 10¹⁰ m3 in Jilin Province from 2008 to 2015, and the fluctuation of the total WF was inconspicuous (Figure 3). Among these WFs, the lowest value was in 2010, which was mainly attributed to the WF of the stockbreeding decreasing in 2010, after which the values rose steadily. The annual average values of green WF, blue WF, and grey WF from 2008 to 2015 were 1.64 × 10¹⁰ m3, 1.23 × 10¹⁰ m3, and 3.77 × 10¹⁰ m3, respectively. The grey WF was the highest, far more than the green and blue WFs, and the blue WF was the lowest.
The interregional differences of the total WF were quite large (Figure 4). The total WFs of the middle and western prefectures accounted for more than 70% of that of the whole province, and most of them continually increased from 2008 to 2015. Changchun, the largest prefecture in Jilin Province, generated a total WF of 1.85 × 10¹⁰ m3/year, far exceeding the other eight prefectures and accounting for 28% of that of the entire province. Changes in the total WF were not obvious in the eastern prefectures. Among them, Baishan had the lowest total WF, at only 1.07 × 10⁹ m3/year, which was less than 1/10 of Changchun’s WF.
Taking 2015 as an example, the characteristics of the sectoral WFs in Jilin Province are shown in Figure 5. The ratios of the crop WFs to the total WF were more than 60% in all prefectures of Jilin Province, except for Baishan with only 42%. These proportions were even as high as 80% in the western prefectures. Crop planting consumed a large volume of water in the western prefectures, which intensified the water shortage in these areas. The ratios of the crop WFs to the total WF in the middle prefectures were less than those in the western prefectures; however, the proportions of the stockbreeding WFs were higher than those of other prefectures, which would cause an increase in the total WF. Agricultural (crops and stockbreeding) WFs in the eastern prefectures were less than those of other prefectures. Particularly, the proportions of the industrial and domestic WFs in Baishan were greater, being obviously different from other prefectures.

3.2. Temporal Variation of WF Inequality

The WF of a region was affected by social, economic, and natural factors. The Gini coefficients between the WF and factors were calculated to analyze the temporal variation of WF inequality in Jilin Province.

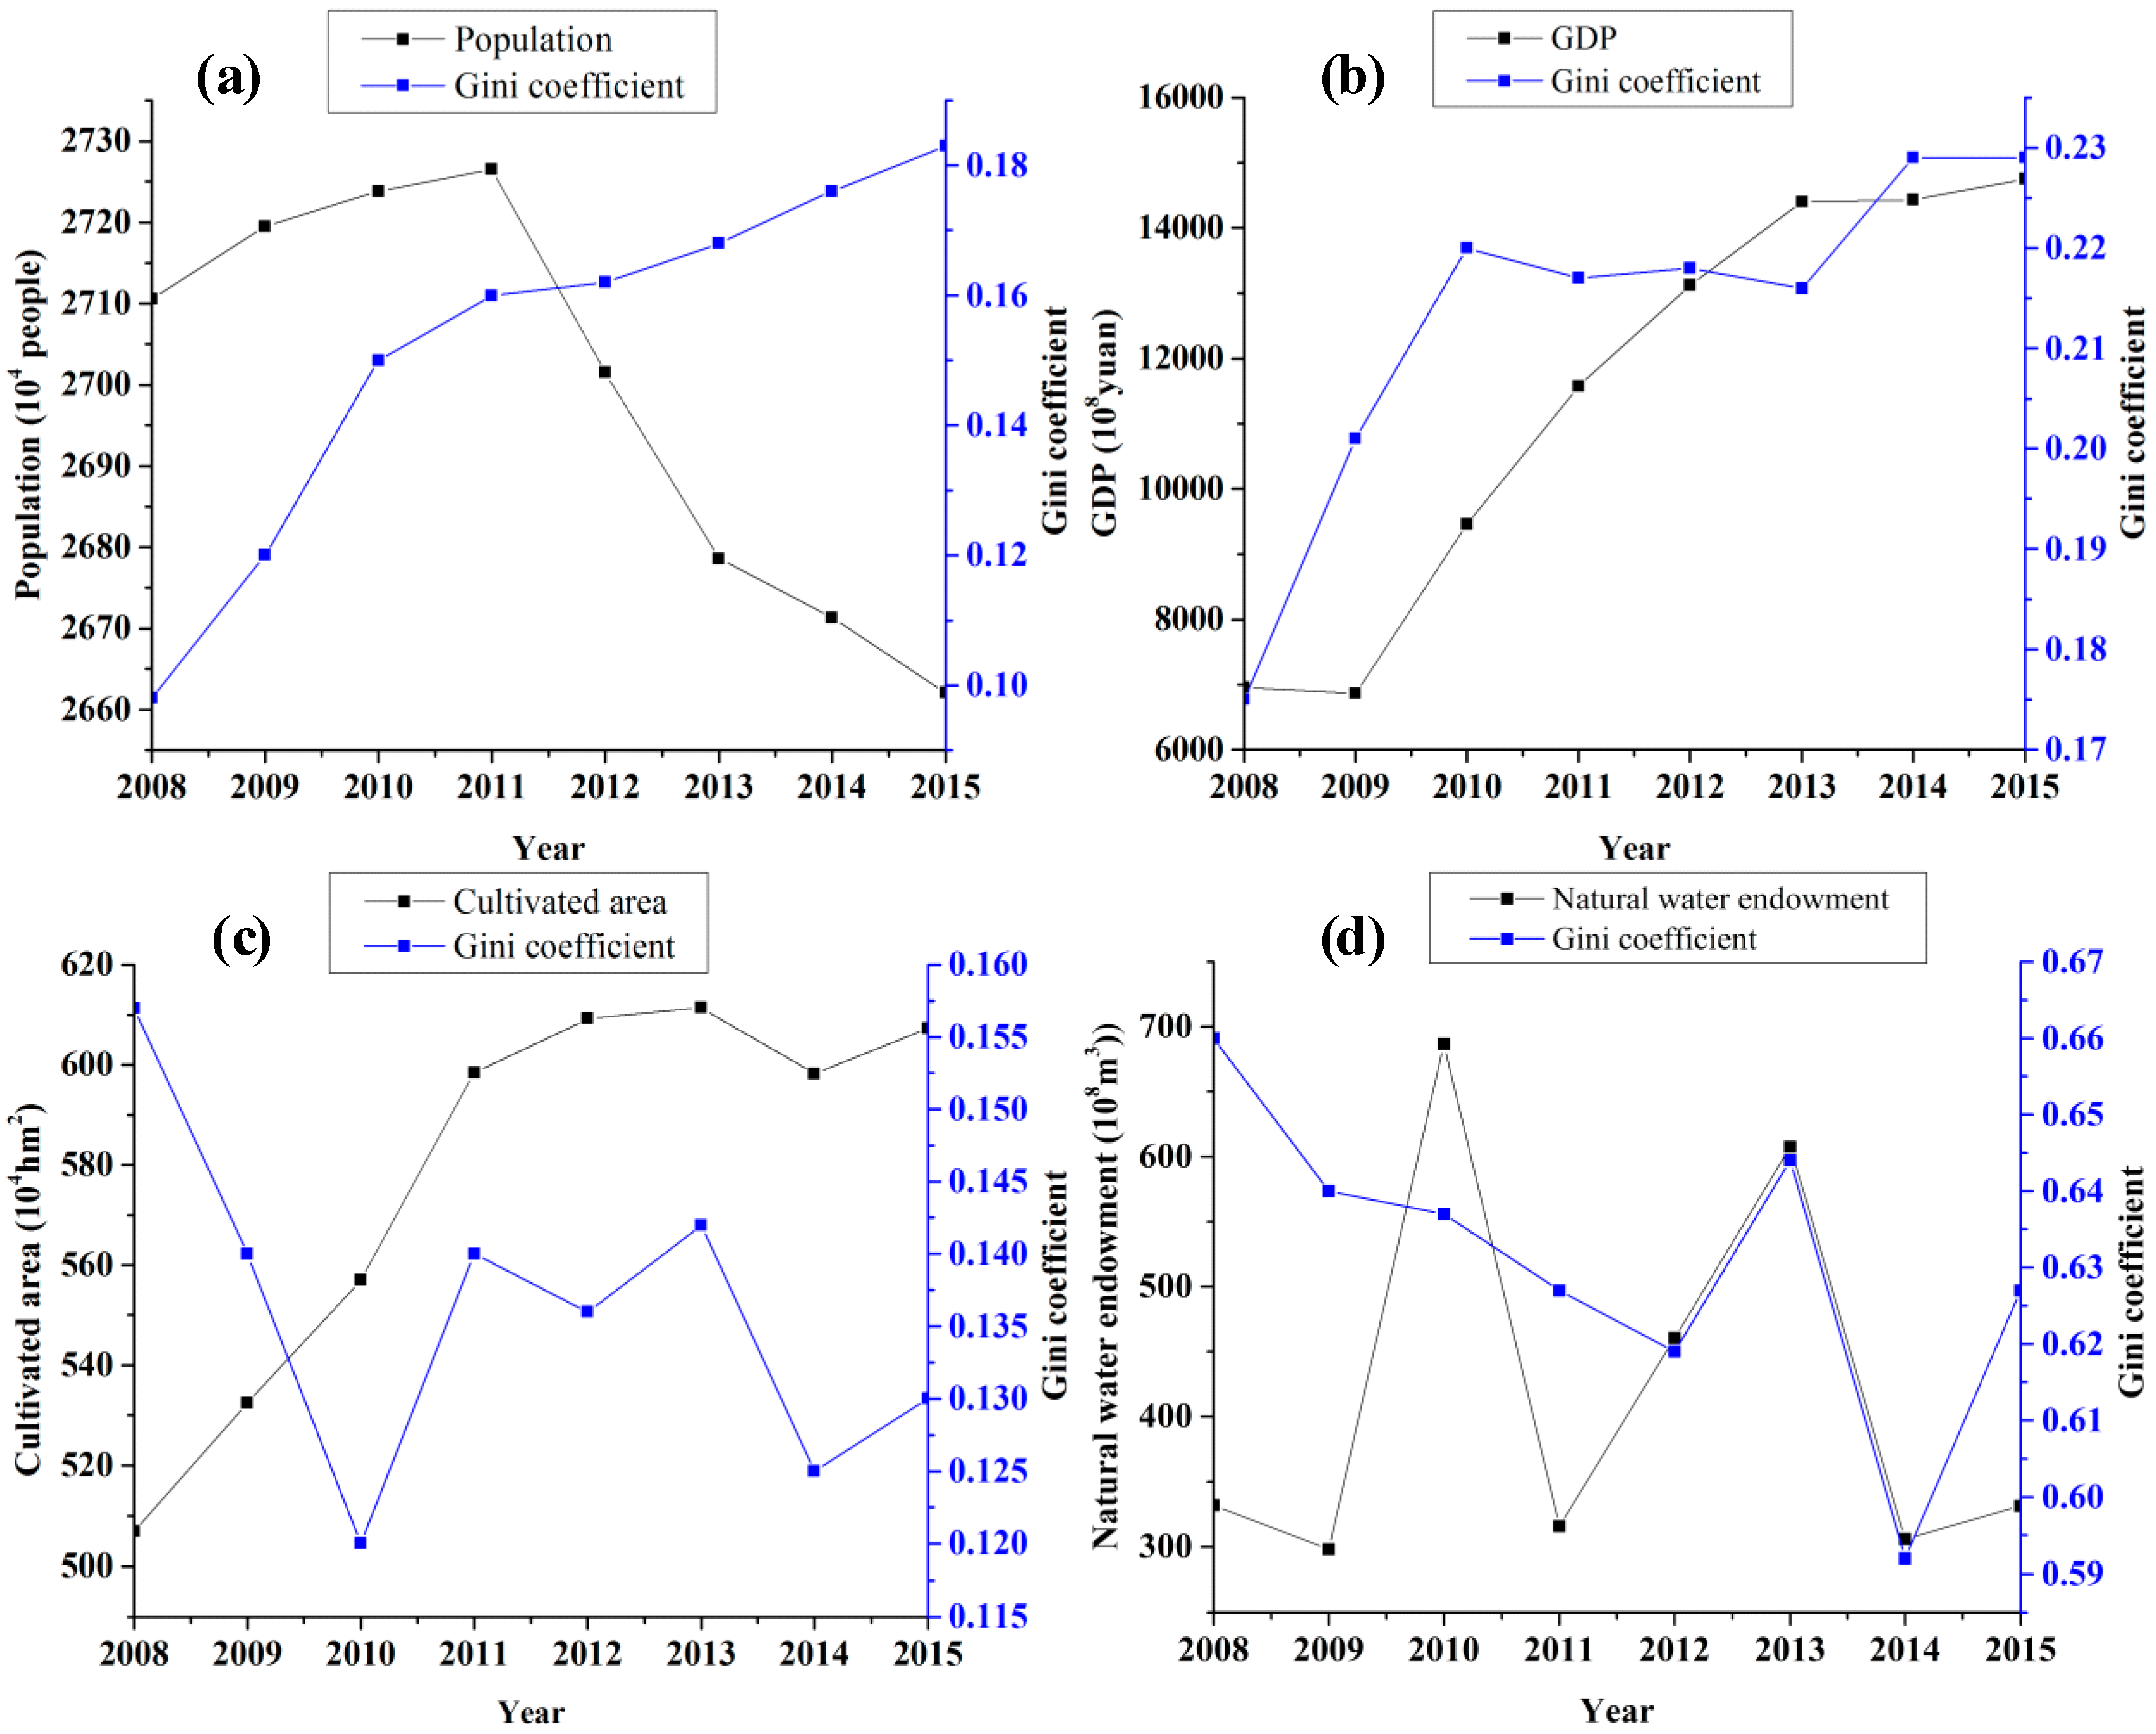
3.2.1. Gini Coefficient between WF and Single Impact Factor

The Gini coefficient between the WF and the population was below 0.2 (Figure 6a), with the WF showing “high equality”. The population of Jilin Province increased from 27.11 million in 2008 to 27.27 million in 2011 (Figure 6a), with an average annual growth rate of 0.2%. While the Gini coefficient increased rapidly from 0.098 in 2008 to 0.160 in 2011, and the average annual growth rate reached 21.1%. After 2011, the population declined sharply; it was 26.62 million by 2015, and the average annual rate of decline was 0.6%. Meanwhile, the average annual growth rate of the Gini coefficient decreased, with an average annual growth rate of only 3.6%. In short, the Gini coefficient increased rapidly as the population increased slowly and increased slowly as the population declined sharply.
The Gini coefficient between WF and GDP nearly reached the 0.2–0.3 level (Figure 6b), which meant the WF exhibited “relative equality”. The Gini coefficient had a trend of rising, falling slightly, and rising again. It rose from 0.175 in 2008 to 0.220 in 2010, fell to 0.216 in 2013, and then reached 0.229 in 2015. In general, the Gini coefficient between the WF and the GDP increased by 30.9%, with an average annual increase of 4.4% from 2008 to 2015. While Jilin Province’s GDP experienced a slight decline in 2008–2009, then rose in 2010–2013, and flattened in 2014–2015 (Figure 6b). First, a period of rapid growth occurred from 2009 to 2013, with the average annual growth rate of the GDP reaching 27.5%. In 2014 and 2015, Jilin Province experienced weak economic growth, with an average annual growth rate of only 1.2%. However, the GDP in 2009 decreased, whereas its Gini coefficient increased, and in 2011, the GDP increased, but its Gini coefficient declined. In general, there was a positive correlation between the Gini coefficient and GDP.
The Gini coefficient between the WF and the cultivated area was less than 0.2 (Figure 6c), which meant “high equality”. The Gini coefficient showed a fluctuating downward trend. On the whole, it declined from 0.157 in 2008 to 0.130 in 2015, exhibiting a relative reduction of 17.2%, with an average annual decline of 2.5%. However, the cultivated area of Jilin Province experienced rapid growth stage and a relatively stable stage (Figure 6c). It grew 18.1% from 2008 to 2011, and the annual average growth exceeded 6%; after 2011, it changed relatively little and maintained about 6 million hectares. In general, there was a negative correlation between the Gini coefficient and cultivated area.
The Gini coefficient between the WF and natural water endowment exceeded 0.5 (Figure 6d), which meant “high inequality”. The Gini coefficient showed a downward trend in general, reducing from 0.660 in 2008 to 0.627 in 2015 and fluctuating sharply from 2012 to 2015. In Jilin Province, the annual precipitation in an area largely determines its water storage in that year. As a result of variability in precipitation, a wet year, dry year, and normal year can occur, and the amount of water resources will change greatly. The water resources fluctuated drastically in Jilin Province from 2008 to 2015 (Figure 6d). In 2010, the water resources were 68.668 billion m3, while they were only 29.804 billion m3 in 2009, less than half of those in 2010. Therefore, there was no good correlation between the Gini coefficient and natural water endowment.

3.2.2. Comprehensive Gini Coefficient

The comprehensive Gini coefficient ranged between 0.2 and 0.3 (Table 1), the WF of Jilin Province was at “relative equality” from 2008 to 2015 under the combined action of four factors. According to the weights of population, GDP, cultivated area, and natural water endowment (0.288, 0.300, 0.210, and 0.202, respetively), the effects of the population and GDP on WF inequality were greater than those of the cultivated area and natural water endowment. Furthermore, the Gini coefficients between the WF and the population and between the WF and the GDP rose steadily, indicating that the impacts of the population and GDP on WF inequality increased from 2008 to 2015. The downtrend in Gini coefficients between the WF and cultivated area and between the WF and natural water endowment indicated that the impacts of the cultivated area and natural water endowment on WF inequality were decreasing. Therefore, the leading roles of human factors were becoming increasingly more obvious, although the natural conditions were still the limiting factors on the allocation of water resources.

3.3. Spatial Distribution of WF Inequality

The Gini coefficient could only analyze the temporal changes of inequality between WF and each factor from a holistic perspective; it could not reflect the spatial characteristics of WF inequality. However, the imbalance index could measure the differences of WF inequality among regions. The regional imbalance indexes and comprehensive imbalance indexes could be calculated by Equations (14) and (15), respectively. According to the calculation results, the imbalance indexes were divided into five grades: 0~0.025 meant “high equality”, 0.026~0.035 meant “relative equality”, 0.036~0.045 meant “neutral”, 0.046~0.055 meant “relative inequality”, and above 0.056 meant “high inequality”. The years of 2008, 2012, and 2015 were selected to examine spatial WF inequality in Jilin Province.

3.3.1. Imbalance Index between WF and Single Impact Factor

There were close connections between the spatial characteristics of the impact factors and those of the WF inequality. The regional differences of the imbalance indexes in 2008, 2012, and 2015 were obvious (Table 2).
The imbalance indexes between the WF and population (dp) in the west increased obviously, from “high equality” to “neutral”. In the middle, the imbalance indexes were below 0.017, which indicated “high equality”. In the east, the dp was negative, and these values varied from “high equality” to “relative equality”. In the middle, the population was the highest in Jilin province (Figure 2a), and the WF was also the largest, thus the population and water consumption was compatible. Especially, water resources were inadequate in Changchun, considerable water resources were occupied and used by Changchun under the influence of a water diversion project, the priority of the resource use and virtual water trade. Although the populations were less in the west and east (Figure 2a), the causes of inequality were different. Water shortages and more water consumption in agriculture occurred in the west, while water resources were rich with less water consumption in the east.
The regional imbalance indexes between WF and GDP (dg) were significant in differences among regions. On the whole, the regional imbalance indexes increased obviously in the west and middle and were larger than those in the east. In the west, the imbalance indexes varied from “relative equality” to “relative inequality”. In the middle, the internal differences were quite significant, Changchun was at “high inequality”, Siping at “neutral”, whereas Liaoyuan was at “high equality”. In the east, the imbalance indexes fluctuated, and the internal differences were also obvious, Jilin was at “neutral”, and other prefectures were at “high equality”. In addition, Changchun and Jilin had negative dg values and higher imbalance indexes, which showed they had higher water use efficiency and could create higher GDP (Figure 2b) when they consumed the same amount of water resources compared with other prefectures in Jilin Province. While the prefectures in the west and Siping in the middle had positive dg values and higher imbalance indexes, their water use efficiencies were lower, and these prefectures urgently needed to improve their economic level to achieve efficient water use and to improve the inequality.
The regional imbalance indexes between the WF and the cultivated area (dc) in the west were greater than those in other regions, except Changchun, because vast and flat arable lands (Figure 2c) and less precipitation were present in the west. However, these indexes showed a downward trend. Baicheng went from “neutral” to “relative equality”, and Songyuan went from “relative inequality” to “relative equality”. Changchun had the largest regional imbalance indexes and positive dc values, which indicated that the matching between water consumption and cultivated area was superior to that of the other prefectures. The regional imbalance indexes in the east and in the other middle prefectures were below 0.025, and the inequality was at “high equality”. Their cultivated areas were less than those of the western prefectures and Changchun (Figure 2c).
The regional imbalance indexes between the WF and natural water endowment (dw) were generally very high for the nine prefectures, and the internal differences were significant (Table 2). In the west, Songyuan was at “high inequality”, and Baicheng reached “neutral”. In the middle, Changchun and Siping were at “high inequality”, whereas Liaoyuan was at “high equality”. In the east, Baishan and Yanbian were at “high inequality”, whereas Tonghua was at “neutral” and Jilin was at “relative equality”. Furthermore, the dw values were positive in the west and middle, which indicated these prefectures belonged to the water-receiving areas. Furthermore, the dw values were negative in the east, to which the water supply areas belonged. The amount of water resources accounted for more than 70% of all provincial water resources in the east (Figure 2d), whereas most of them had not yet been developed and utilized. However, the water resources were overdeveloped, but could still not meet local needs in the middle and west.

3.3.2. Comprehensive Imbalance Index

The comprehensive imbalance index (Dc) was used to reflect the combined influences of population, GDP, cultivated area, and natural water endowment on WF inequality. According to their weights (0.288, 0.300, 0.210, and 0.202, respectively), the comprehensive imbalance index of each prefecture could be obtained. Different grades of comprehensive imbalance indexes signified different distribution patterns of WF inequality in Jilin Province (Figure 7). On the whole, the level of WF inequality was higher in the middle, and the spatiotemporal differences of WF inequality were conspicuous. In the west, the comprehensive imbalance indexes increased steadily, and the WF inequality changed from “relative equality” to “neutral” and then to “relative inequality”, as driven by population, GDP, cultivated area, and natural water endowment. In the middle, the comprehensive imbalance indexes varied dramatically, and the WF inequality showed large internal differences. For instance, Changchun was at “high inequality”, whereas Liaoyuan was at “high equality”. The inequality was caused by the GDP and natural water endowment. In the east, the comprehensive imbalance indexes changed insignificantly, and the WF inequality was relatively stable. Jilin and Tonghua were at “high equality”, and Baishan and Yanbian were at “neutral”, as they were affected by natural water endowment and population.

4. Discussion

4.1. Improvement on the Methods of WF Inequality

In the studies of the equality of water, much of the literature has focused on the inequality of physical water. However, few studies involved the assessment of WF inequality. In the existing studies on WF inequality, most explored blue and green water [20,21,22], whereas the grey WF has received the least focus compared with the green and blue WFs [48]. The present study considered the grey WFs of three sectors (agriculture, industry, and domestic), which accounted for about 57% of the total WF (Figure 8). This indicated the grey WF was the main portion of the WF and should not be ignored. The grey WFs could more directly reflect the impact of human activities on the quality of water resources as well as indirectly affect water use equality across regions. Therefore, it was important to include the grey WF when conducting a water resource assessment.
The Gini coefficient has been widely adopted to evaluate the equality of water use or water supply [7,9,10,11], which could describe the degree of inequality quantitatively, and this approach proved to be simple and feasible. The Gini coefficient could reflect the temporal variation of WF inequality and could represent the overall matching degree between water and each impact factor. In this study, the Gini coefficient explained the overall level of WF inequality and the degree between WF and each impact factor from 2008 to 2015. However, the spatial distribution could not be reflected. The imbalance index method could fill the gap by reflecting the spatial characteristics and coordination between water and each impact factor in each region. In this study, the imbalance index characterized the level of WF equality in each prefecture and accounted for the main influencing factors. Therefore, the distribution and change of WF inequality on space could be revealed, which would be used in identifying areas of WF inequality and the critical impact factors for adopting the measures to reduce WF inequality.
The combination of the Gini coefficient and imbalance index could quantitatively measure the temporal variation and spatial differentiation of WF inequality, improving the research methods of WF inequality. The results provided useful references for decision-making on water resource allocation and management in Jilin Province.

4.2. Response of WF Inequality to Impact Factors

During 2008–2015, the economy of Jilin Province developed rapidly, mainly benefitting from the implementation of the Northeast Revitalization Strategy. The level of urbanization increased, the proportion of the urban population increased from 53.21% in 2008 to 55.31% in 2015, and that of the rural population decreased from 46.79% in 2008 to 44.69% in 2015 in Jilin Province. Furthermore, the population was concentrated in some larger prefectures, which led to more serious and larger differences in water consumption. However, the ability to allocate water resources could not keep pace with the accelerated agglomeration of the population in spatial distribution; the water consumption could not be satisfied by the local water resources. Thus, the degree of WF inequality in terms of population was growing. GDP is an important factor affecting water use and allocation. With continuous economic development, the volume of water utilization increased, and the difference in the water use became greater among regions, with the pace of the WF inequality also increasing.
The population of Jilin Province began to decline after 2011, and the loss of population adversely affected the development of agriculture. In addition, the policies of conversion of cropland to forest and returning farmland to lakes and wetlands were implemented, which contributed to the reduction in the cultivated area. The cultivated area no longer increased significantly and, in some cases, even declined. Meanwhile, water-saving technologies and various methods of irrigation were widely used, and the efficiency of agricultural water use was also enhanced in many regions [49]. Therefore, the degree of equality improved between the WF and the cultivated area.
With technological advances, water diversion projects were implemented across the regions. For example, the project of Carrying Water from Songhua River to Changchun supplied 3.08 × 10⁸ m3 water from Jilin to Changchun, which played an extremely important role in relieving the water supply crisis in Changchun [50]; and the project of Carrying Water from Nen River to Baicheng was a comprehensive water conservancy project, aiming to supply water to 6.2 × 10⁵ urban residents, 6.3 × 10⁴ hm2 irrigation area and Momoge Wetland water supplement [51]. Thus, water demand had been met, and the restriction of local water resources had been gradually reduced. Meanwhile, the problems of water resources and water environment also appeared constantly, including low level of water management, serious over-exploitation of the groundwater, and water pollution aggravation [27]. Then, the consciousness of water conservation and the efficient utilization of water resources were gradually raised, and many efforts in water resources management and protection were made [52]. The decline of the proportion of grey WF (Figure 8) with the economic development could show the effect of water resources protection and pollution prevention. Thus, the degree of WF inequality was reduced in terms of natural water endowment.

4.3. Policy Implications

An analysis of WF inequality could provide valuable policy insights for preparing rational water management strategies, particularly for some areas in which water inequality was more prominent. Factors affecting WF inequality were different in each region, so the corresponding measures adopted were different.
Jilin Province is one of the major agricultural provinces in China; crops’ WF accounted for 42–82% of the total WF (Figure 4). The strategy to reduce WF inequality should put the crops’ WF reduction as the main target, which could be realized through optimizing the planting structure and adopting the advanced technologies. According to the differences of natural, socioeconomic, and environmental conditions, the high-quality corn production bases should be constructed in the middle of Jilin Province; the water-saving and drought-tolerant miscellaneous grains should be vigorously developed in the western Jilin Province; and the high-quality soybeans and cash crops should be concentrated in the eastern Jilin Province [53]. Additionally, water-saving irrigation technology should be adopted in each region, which could reduce the blue WF of crops and ensure that water resources are used fully and efficiently.
Different regions faced different dilemmas on the development and utilization of water resources. In the west, the utilization level of groundwater even reached 88%, exceeding the limit in recent years, and more than 80% groundwater was used for agricultural irrigation, while about 4% was used for industrial water and 5% for domestic water [54], which seriously violated the regular pattern of sustainable use of water resources. The amount of groundwater exploitation should be strictly controlled. Furthermore, the utilization of surface water resources was inadequate in these prefectures [55,56]. Precipitation was mainly concentrated in June–September, and most precipitation events occurred in the form of floods. If the floods were stored in the wetlands and lakes in the west, the rain water could be fully utilized as a resource, and the water use efficiency would be improved, thereby the seasonal water shortage could be alleviated in the west. In the east, the water resources were adequate, but not fully used. First, the efforts to develop water resources should be strengthened in the national border rivers, specifically in the Yalu River and the Tumen River, with their rich water resources. Second, the mineral water resources should be further rationally developed and utilized because of their abundant reserves. In addition, the protection of drinking water sources should be strengthened because these are the source points of major rivers. If full advantage of the water resources could be taken, the water resource endowments could be transformed into economic benefits, and WF inequality would be greatly alleviated in the east.
The water demand was the largest in the middle, however, the water resources were not enough to cover the water supply. The effective measures are water transfer and water saving. In addition, VW trading should be a choice. A proportion of the global population living in water scarce regions benefit from VW trading [55]; it may be possible to develop appropriate trade policies to import water-intensive products for reducing the local WF. If possible, water-intensive industries and a portion of agricultural production should be encouraged to move to water-abundant regions. As an economically developed region, changing consumption habits, such as reducing the consumption of water-intensive products and services and to save water in daily life, might be beneficial to raising people’s environmental awareness and water-saving awareness, although this occupied a very small percentage of the total WF.

5. Conclusions

Inequality of water resources exists as a result of the uneven distribution of water resources in time and space and the differences of economic and social development. This paper calculated the WFs (blue, green, and grey WFs) of nine prefectures in Jilin Province and then evaluated the spatiotemporal inequality of WF by applying the Gini coefficient and imbalance index.
The Gini coefficient reflected the temporal changes of inequality between WF and each factor in Jilin Province from 2008 to 2015. The WF of Jilin Province was at the degree of “relative equality”. In detail, the level of WF inequality showed “high equality” between the WF and the population and cultivated area, “relative equality” in terms of the GDP, and “high inequality” in terms of the natural water endowment. The effects of human factors on WF inequality were increasing, while those of natural factors on WF inequality were decreasing.
The imbalance index measured the differences of WF inequality among regions, and the spatial differences of WF inequality were obvious. The WF inequality in the west changed from “relative equality” to “relative inequality”, as driven by population, GDP, cultivated area, and natural water endowment. In the middle prefectures, the WF inequality showed large internal differences with “high inequality” or “high equality”, led mainly by GDP and natural water endowment. The WF inequality in the east was relatively stable and at the degree of “high equality” or “neutral”, which was affected by the natural water endowment and population.
WF inequality changed with the variation of natural, socioeconomic, and environmental conditions in time and space. The inequality analysis could identify the matching between WF and water allocation, determine the key impact factors, and then find the root of WF inequality. Therefore, research on WF inequality could provide a theoretical basis for water resource managers and policy makers to utilize and allocate water resources rationally and mitigate the inequality of water use.

Author Contributions

J.W. carried out the calculation, J.W. and L.Q. carried out result analysis and drafted the manuscript, and H.H. revised the manuscript. All authors read and approved the final manuscript.

Funding

This work was funded by the National Natural Science Foundation of China (41571526), the National Key Research and Development Project of China (2016YFA0602301), and the Key Project of National Natural Science Foundation of China (41630749).

Conflicts of Interest

The authors declare no conflict of interest.

References

  1. Wang, X.S.; Li, X.N.; Wang, J.W. Urban water conservation evaluation based on multi-grade uncertain comprehensive evaluation method. Water Resour. Manag. 2018, 32, 417–431. [Google Scholar] [CrossRef]
  2. Cao, X.C.; Huang, X.; Huang, H.; Liu, J.; Guo, X.P.; Wang, W.G.; She, D.L. Changes and driving mechanism of water footprint scarcity in crop production: A study of Jiangsu Province, China. Ecol. Indic. 2018, 95, 444–454. [Google Scholar] [CrossRef]
  3. Carr, J.A.; Seekell, D.A.; Odorico, P.D. Inequality or injustice in water use for food? Environ. Res. Lett. 2015, 10, 024013. [Google Scholar] [CrossRef] [Green Version]
  4. Zhang, J.H.; Li, J.; Tang, Y. Analysis of the spatio-temporal matching of water resourceand economic development factors in China. Resour. Sci. 2012, 34, 1546–1555. (In Chinese) [Google Scholar]
  5. Feng, Z.M.; Yang, Y.Z.; You, Z. Research on the water resources restriction on population distribution in China. J. Nat. Resour. 2014, 29, 1637–1648. (In Chinese) [Google Scholar]
  6. Yu, S.; He, L.; Lu, H.W. An environmental fairness based optimisation model for the decision-support of joint control over the water quantity and quality of a river basin. J. Hydrol. 2016, 535, 366–376. [Google Scholar] [CrossRef]
  7. Li, J.F.; Li, X.L.; Wang, S.F. Evaluating the fairness of water use based on the Gini coefficient in inland river basins-A case study on Shiyang River basin. J. Northwest A&F Univ. (Nat. Sci. Ed.) 2010, 38, 217–222. (In Chinese) [Google Scholar]
  8. Gunasekara, N.K.; Kazama, S.; Yamazaki, D.; Oki, T. Water conflict risk due to water resource availability and unequal distribution. Water Resour. Manag. 2014, 28, 169–184. [Google Scholar] [CrossRef]
  9. Liu, D.D.; Chen, X.H. Method for evaluating the fairness of water use in Guangdong province. Adv. Water Sci. 2008, 1, 268–272. (In Chinese) [Google Scholar]
  10. Wang, X.J.; Zhang, J.Y.; Shahid, S.; ElMahdi, A.; He, R.M.; Wang, X.G.; Ali, M. Gini coefficient to assess equity in domestic water supply in the Yellow River. Mitig. Adapt. Strat. Glob. Chang. 2012, 17, 65–75. [Google Scholar] [CrossRef]
  11. Malakar, K.; Mishra, T.; Patwardhan, A. Inequality in water supply in India: An assessment using the Gini and Theil indices. Environ. Dev. Sustain. 2018, 20, 841–864. [Google Scholar] [CrossRef]
  12. Cole, M.J.; Bailey, R.M.; Cullis, J.D.S.; New, M.G. Spatial inequality in water access and water use in South Africa. Water Policy 2018, 20, 37. [Google Scholar] [CrossRef]
  13. Mimi, Z.A.; Sawalhi, B.I. A decision tool for allocating the waters of the Jordan river basin between all Riparian Parties. Water Resour. Manag. 2003, 17, 447–461. [Google Scholar] [CrossRef]
  14. Hu, Z.N.; Wei, C.Y.; Yao, L.M.; Li, L.; Li, C.Z. A multi-objective optimization model with conditional value-at-risk constraints for water allocation equality. J. Hydrol. 2016, 542, 330–342. [Google Scholar] [CrossRef]
  15. Roa-García, M.C.; Brown, S. Assessing equity and sustainability of water allocation in Colombia. Local Environ. 2017, 22, 1080–1104. [Google Scholar] [CrossRef]
  16. Hoekstra, A.Y.; Mekonnen, M.M. The water footprint of humanity. Proc. Natl. Acad. Sci. USA 2012, 109, 3232–3237. [Google Scholar] [CrossRef] [PubMed] [Green Version]
  17. Chouchane, H.; Krol, M.S.; Hoekstra, A.Y. Virtual water trade patterns in relation to environmental and socioeconomic factors: A case study for Tunisia. Sci. Total Environ. 2018, 613–614, 287–297. [Google Scholar] [CrossRef] [PubMed]
  18. Hoekstra, A.Y.; Chapagain, A.K.; Aldaya, M.M.; Mekonnen, M.M. The Water Footprint Assessment Manual: Setting the Global Standard; Earthscan: London, UK, 2011; pp. 40–45. [Google Scholar]
  19. Seekell, D.A. Does the global trade of virtual water reduce inequality in freshwater resource allocation? Soc. Nat. Resour. 2011, 24, 1205–1215. [Google Scholar] [CrossRef]
  20. Seekell, D.A.; Odorico, P.D.; Pace, M.L. Virtual water transfers unlikely to redress inequality in global water use. Environ. Res. Lett. 2011, 6, 024017. [Google Scholar] [CrossRef] [Green Version]
  21. Sun, S.C.; Fang, C.L.; Lv, J.Y. Spatial inequality of water footprint in China: A detailed decomposition of inequality from water use types and drivers. J. Hydrol. 2017, 553, 398–407. [Google Scholar] [CrossRef]
  22. Dong, L.; Sun, C.Z.; Zou, W.; Xi, X. Assessment and spatial-temporal evolutionof water consumption fairness from a water footprint perspective in China. Resour. Sci. 2014, 36, 1799–1809. (In Chinese) [Google Scholar]
  23. Zhang, Z.; Yang, H.; Shi, M. Analyses of water footprint of Beijing in an interregional input-output framework. Ecol. Econ. 2011, 70, 2494–2502. [Google Scholar] [CrossRef]
  24. Navalpotro, J.A.S.; Pérez, M.S.; Quiroga, F.G. Water supply and water footprint in the urban region of Madrid (Spain). Int. J. Bus. Soc. Sci. 2013, 4. [Google Scholar] [CrossRef]
  25. Manzardo, A.; Loss, A.; Fialkiewicz, W.; Rauch, W.; Scipioni, A. Methodological proposal to assess the water footprint accounting of direct water use at an urban level: A case study of the Municipality of Vicenza. Ecol. Indic. 2016, 69, 165–175. [Google Scholar] [CrossRef]
  26. Rushforth, R.R.; Ruddell, B.L. The vulnerability and resilience of a city’s water footprint: The case of Flagstaff, Arizona, USA. Water Resour. Res. 2016, 52, 2698–2714. [Google Scholar] [CrossRef]
  27. Zhang, W.F.; Zhang, H.; Zhao, J.J. The current situation and protection of water resources in Jilin Province. Water Resour. Hydropower Northeast Chin. 2009, 37–39. (In Chinese) [Google Scholar]
  28. Li, H.Y.; Qin, L.J.; He, H.S. Characteristics of the water footprint of rice production under different rainfall years in Jilin Province, China. J. Sci. Food Agric. 2018, 98, 3001–3013. [Google Scholar] [CrossRef]
  29. Ma, X.L.; Ma, Y.J. The spatiotemporal variation analysis of virtual water for agriculture and livestock husbandry: A study for Jilin Province in China. Sci. Total Environ. 2017, 586, 1150–1161. [Google Scholar] [CrossRef]
  30. China Meteorological Data Service Center (CMDC). China Meteorological Data Sharing Service System; CMDC: Beijing, China, 2016. [Google Scholar]
  31. FAO Database. Available online: http://www.fao.org/land-water/databases-and-software/cropwat/en/ (accessed on 21 May 2017).
  32. Jilin Province Statistical Yearbook, 2009–2016. Available online: http://tjj.jl.gov.cn/tjsj/tjnj/ (accessed on 23 June 2017).
  33. Jilin Province Water Resources Bulletin, 2008–2015. Available online: http://slt.jl.gov.cn/zwgk/szygb/ (accessed on 3 July 2017).
  34. Duan, P.L.; Qin, L.J.; Wang, Y.Q.; He, H.S. Spatiotemporal correlations between water footprint and agricultural inputs: A case study of maize production in Northeast China. Water 2015, 7, 4026–4040. [Google Scholar] [CrossRef]
  35. Chapagain, A.K.; Hoekstra, A.Y. Water Footprints of Nations. Value of Water Research Report Series, No.16; UNESCO-IHE: Delft, The Netherlands, 2004; Available online: http://www.waterfootprint.org/Reports/Report16.pdf (accessed on 10 July 2017).
  36. de Miguel, Á.; Hoekstra, A.Y.; García, C.E. Sustainability of the water footprint of the Spanish pork industry. Ecol. Indic. 2015, 57, 465–474. [Google Scholar]
  37. Hou, X. Water Footprint and Influence Factors of Livestock Husbandry in Jilin Province, Master; Northeast Normal University: Changchun, China, 2016. (In Chinese) [Google Scholar]
  38. Sun, C.Z.; Chen, S.; Zhao, L.S. Spatial correlation pattern analysis of water footprint intensity based on ESDA Model at provincial scale in China. J. Nat. Resour. 2013, 28, 571–582. (In Chinese) [Google Scholar]
  39. Yu, H.Z.; Han, M. Spatial-temporal analysis of sustainable water resources utilization in Shandong Province based on water footprint. J. Nat. Resour. 2017, 32, 474–483. (In Chinese) [Google Scholar]
  40. Lochner, K.; Pamuk, E.; Makuc, D.; Kennedy, B.P.; Kawachi, I. State-level income inequality and individual mortality risk: A prospective, multilevel study. Am. J. Public Health 2001, 91, 385–391. [Google Scholar]
  41. Xu, W.P. The algorithm of Gini coefficient. Stat. Decis. 2004, 9, 121–122. (In Chinese) [Google Scholar]
  42. Saaty, T.L. A new macroeconomic forecasting and policy evaluation methodusing the analytic hierarchy process. Math. Modell. 1987, 9, 219–231. [Google Scholar] [CrossRef]
  43. Singh, R.P.; Nachtnebel, H.P. Analytical hierarchy process (AHP) applicationfor reinforcement of hydropower strategy in Nepal. Renew. Sustain. Energy Rev. 2016, 55, 43–58. [Google Scholar] [CrossRef]
  44. Zou, Z.H.; Yun, Y.; Sun, J.N. Entropy method for determination of weight of evaluating indicators in fuzzy synthetic evaluation for water quality assessment. J. Environ. Sci. 2006, 18, 1020–1023. [Google Scholar] [CrossRef]
  45. Sun, C.Z.; Chi, K.X. Establishment and application of the assessmentmodel for water resources safety in Dalian. J. Safe Environ. 2008, 8, 115–118. (In Chinese) [Google Scholar]
  46. Zhou, Y.X. On the regional differences of urbanization in China. City Plan. Rev. 1983, 2, 17–21. (In Chinese) [Google Scholar]
  47. Hong, S.Y.; Song, Z.S.; Cheng, T.; Wang, H.R. Spatial matching analysis of water resources in the intake area of South-North Water Transfer Project based on Gini coefficient. J. Beijing Norm. Univ. (Nat. Sci.) 2017, 53, 175–179. (In Chinese) [Google Scholar]
  48. Gil, R.; Bojacá, C.R.; Schrevens, E. Uncertainty of the agricultural grey water footprint based on high resolution primary data. Water Resour. Manag. 2017, 31, 3389–3400. [Google Scholar] [CrossRef]
  49. Liu, W.Y. Present situation, existing problems and countermeasuresin of water saving agriculture in Jilin Province. Chin. Agric. Inf. 2014, 5, 185. (In Chinese) [Google Scholar]
  50. Chen, D.G.; Lu, X.G.; Zhou, D.M. Water resources evolvement due to the urbanization of Changchun City. J. Arid Land Resour. Environ. 2008, 22, 144–148. (In Chinese) [Google Scholar]
  51. Shi, Y.; Dong, J.P.; Hui, Y.Q. Exerting the irrigation effect of the project Carrying Water from Nen River to Baicheng City to promote the agricultural development in western Jilin. Jilin Agric. 2010, 12, 329. (In Chinese) [Google Scholar]
  52. Liu, W.; Yin, H.; Meng, F.D. The Current Situation and Preventive Measures of Water Environment Pollution in Jilin Province. J. Changchun Norm. Univ. 2010, 29, 79–81. (In Chinese) [Google Scholar]
  53. Sun, J. Analysis of agricultural water use in Jilin Province. Jilin Water Resour. 2008, 11, 52–53. (In Chinese) [Google Scholar]
  54. Liu, J.W.; Li, X.; Zhang, B.L.; Zhang, H.Z. The current water resource situations and strategies of flood utilization in Baicheng City. Jilin Water Resour. 2014, 7, 51–54. (In Chinese) [Google Scholar]
  55. Li, H.W. Present situation and protection of water resources development and utilization in Songyuan City. Jilin Water Resour. 2017, 8, 50–52. (In Chinese) [Google Scholar]
  56. Islam, M.S.; Oki, T.; Kanae, S.K.; Hanasaki, N.; Agata, Y.; Yoshimura, K. A grid-based assessment of global water scarcity including virtual water trading. Water Resour. Manag. 2007, 21, 19–33. [Google Scholar] [CrossRef]
Figure 1. Location of Jilin Province and the names of its nine prefectures.
Water 11 00521 g001
Figure 2. Spatial distributions of population, gross domestic product (GDP), cultivated area, and natural water endowment for nine prefectures in Jilin Province in 2008, 2012, and 2015: (a) population (people); (b) GDP (104 yuan); (c) cultivated area (hm2); and (d) natural water endowment (108 m3).
Water 11 00521 g002
Figure 3. Green, blue, and grey water footprints (WFs) of Jilin Province from 2008 to 2015.
Water 11 00521 g003
Figure 4. WFs of nine prefectures in Jilin Province from 2008 to 2015.
Water 11 00521 g004
Figure 5. Sectoral WF percentage in Jilin Province in 2015 (West includes Baicheng and Songyuan; Middle includes Changchun, Siping and Liaoyuan; East includes Jilin, Tonghua, Baishan and Yanbian).
Water 11 00521 g005
Figure 6. Trends of WF inequality and influencing factors in Jilin Province from 2008 to 2015: (a) population and the Gini coefficient between WF and population; (b) GDP and the Gini coefficient between WF and GDP; (c) cultivated area and the Gini coefficient between WF and cultivated area; (d) natural water endowment and the Gini coefficient between WF and natural water endowment.
Water 11 00521 g006
Figure 7. Spatial variation of WF inequity in Jilin Province.
Water 11 00521 g007
Figure 8. The percentage of green, blue, and grey WFs from 2008 to 2015 in Jilin Province.
Water 11 00521 g008
Table 1. Comprehensive Gini coefficient in Jilin Province from 2008 to 2015.
Year20082009201020112012201320142015
Comprehensive Gini coefficient0.2470.2540.2630.2670.2660.2730.2650.275
Table 2. Non-absolute value of regional imbalance index between water footprint (WF) and single impact factor (dp, dg, dc, dw) for nine prefectures in 2008, 2012, and 2015 in Jilin Province.
BaichengSongyuanChangchunSipingLiaoyuanJilinTonghuaBaishanYanbian
20080.0100.0150.0080.015−0.0000.000−0.010−0.021−0.016
dp20120.0260.037−0.0040.017−0.003−0.021−0.009−0.022−0.021
20150.0320.0390.0010.017−0.005−0.032−0.011−0.022−0.020
20080.0330.007−0.0560.0430.004−0.0190.004−0.0180.002
dg20120.0450.026−0.0460.045−0.004−0.0390.003−0.024−0.006
20150.0510.035−0.0630.045−0.008−0.034−0.000−0.021−0.005
2008−0.036−0.0490.037−0.0030.0090.0220.0140.005−0.001
dc2012−0.037−0.0280.042−0.0010.0010.0140.0140.004−0.009
2015−0.032−0.0300.0490.001−0.0020.0060.0110.004−0.008
20080.0300.0620.1730.0810.021−0.012−0.047−0.143−0.165
dw20120.0410.0830.1450.0730.010−0.009−0.045−0.139−0.159
20150.0300.0850.1490.0820.017−0.032−0.039−0.137−0.155
dp is the non-absolute value of regional imbalance index between WF and population; dg is the non-absolute value of regional imbalance index between WF and gross domestic product (GDP); dc is the non-absolute value of regional imbalance index between WF and cultivated area; dw is the non-absolute value of regional imbalance index between WF and natural water endowment.

