Development of a Novel Climate Adaptation Algorithm for Climate Risk Assessment


Abstract
:1. Introduction
2. Proposed Climate Adaptation Algorithm
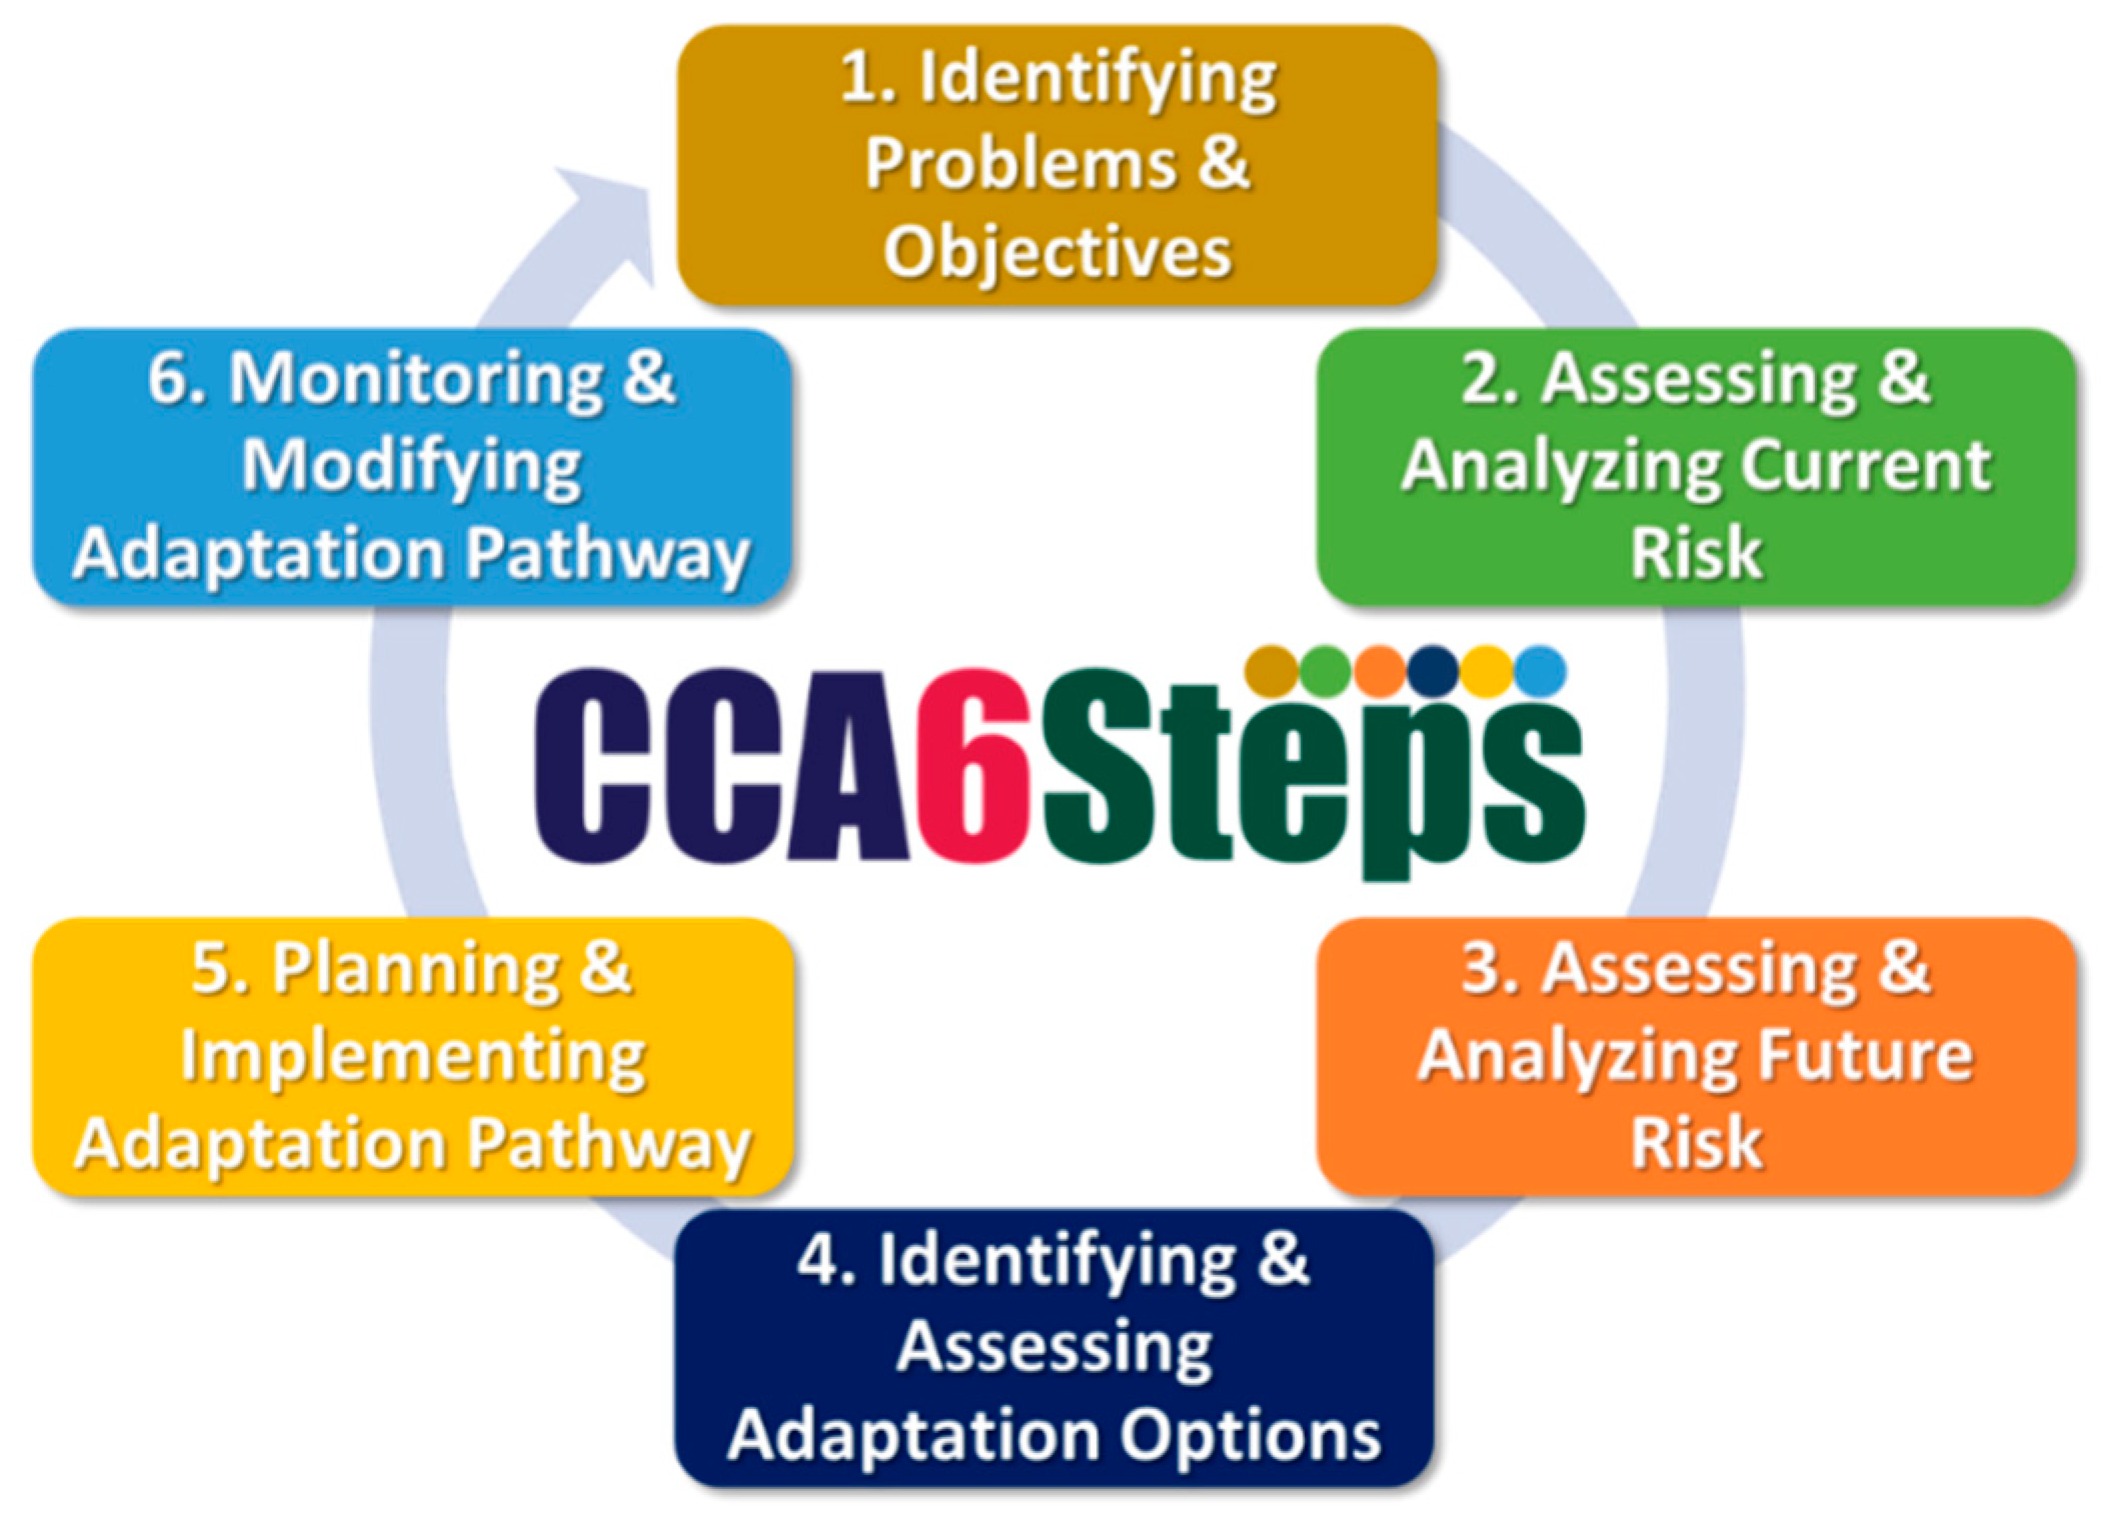
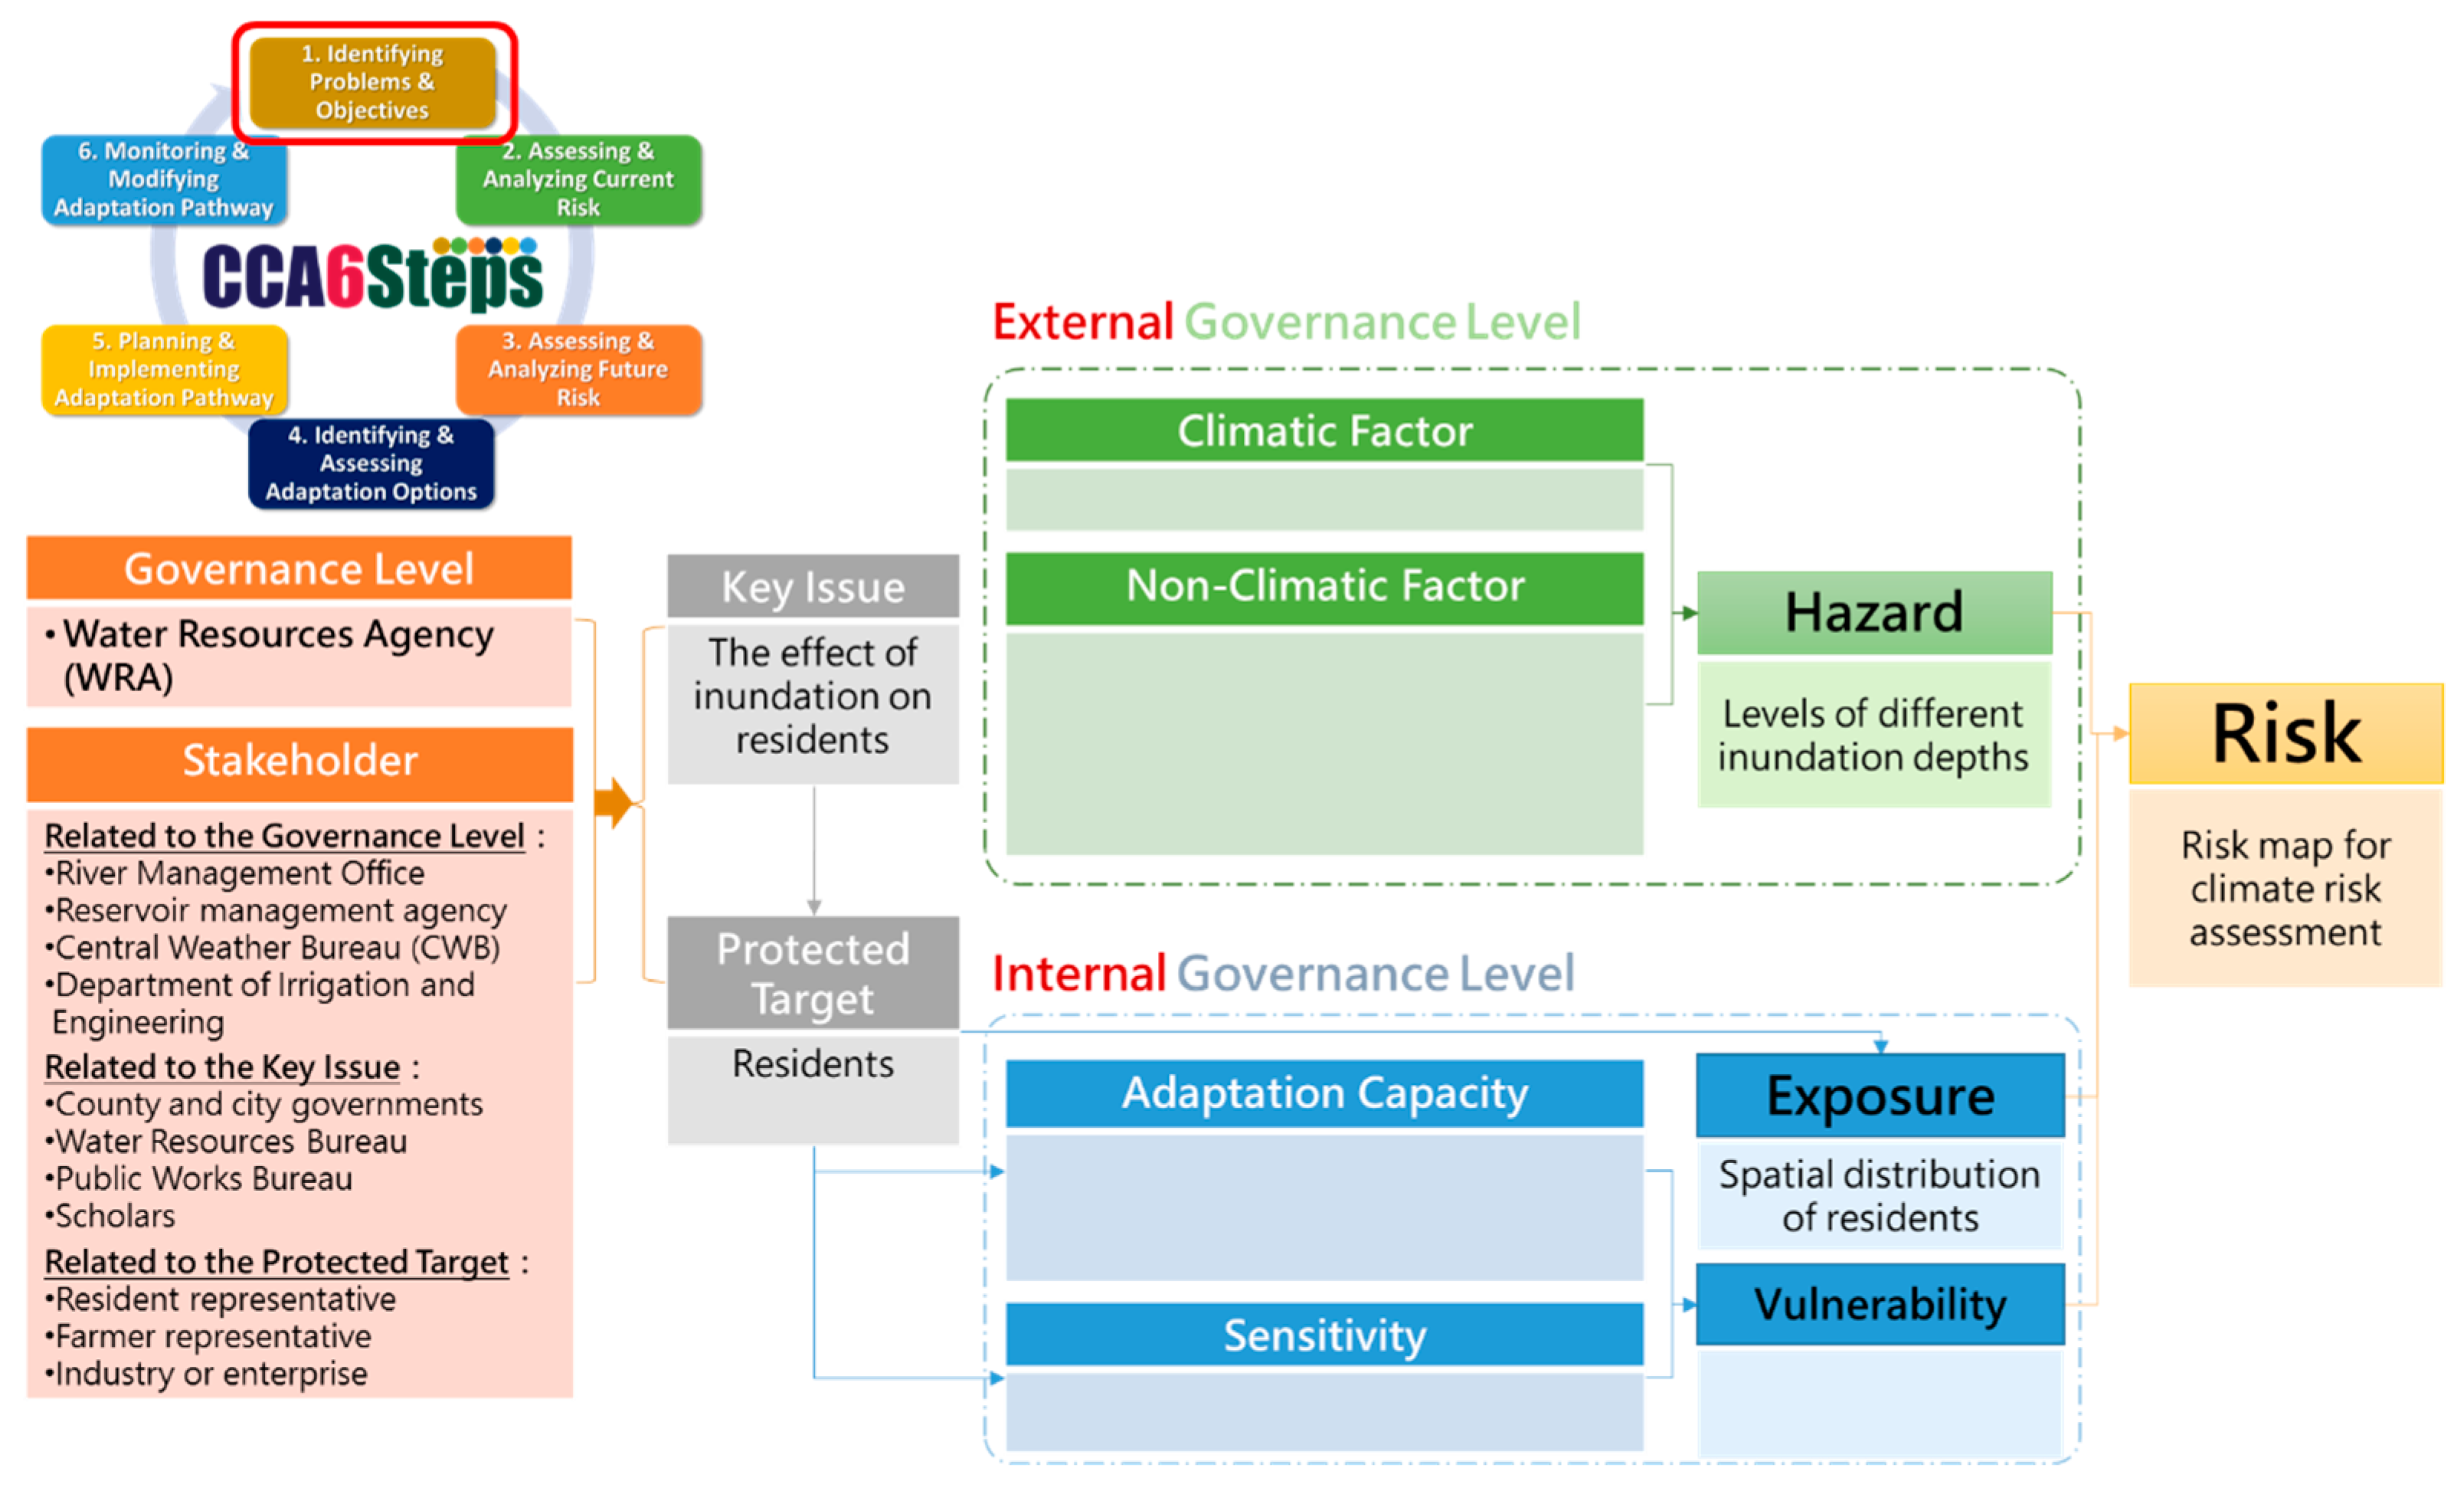
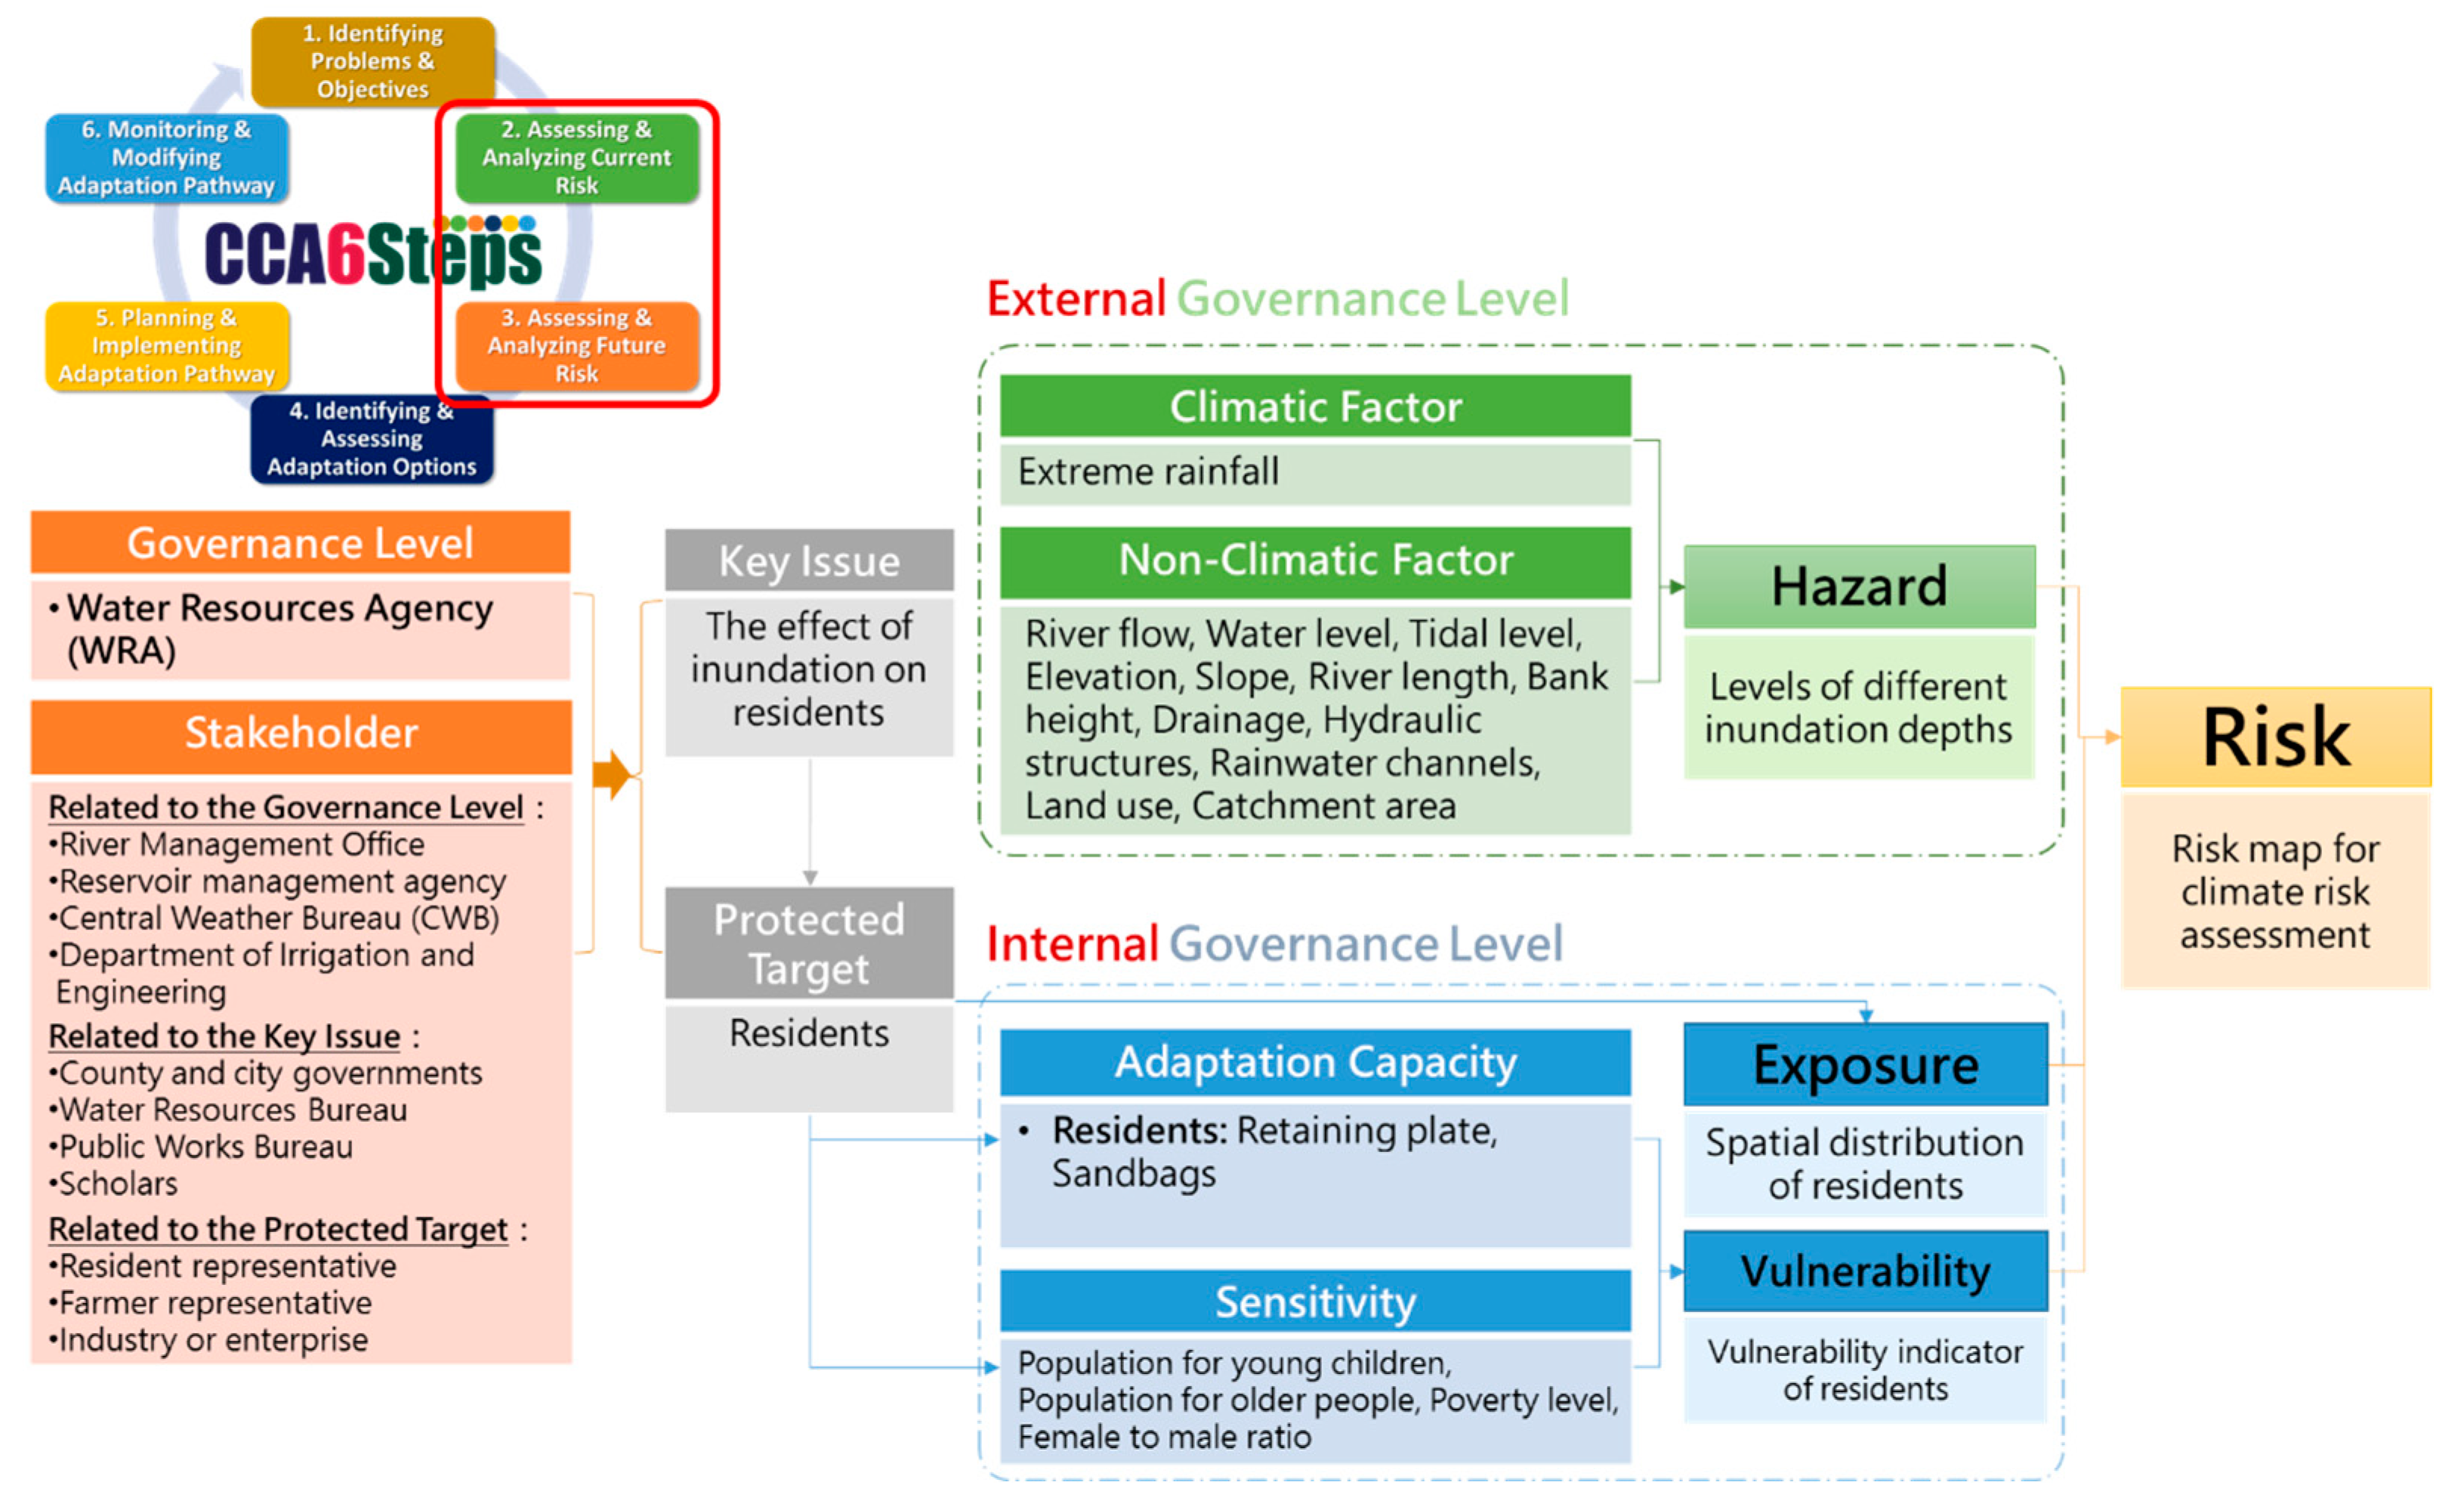
2.1. Climate Change Adaptation Six Steps
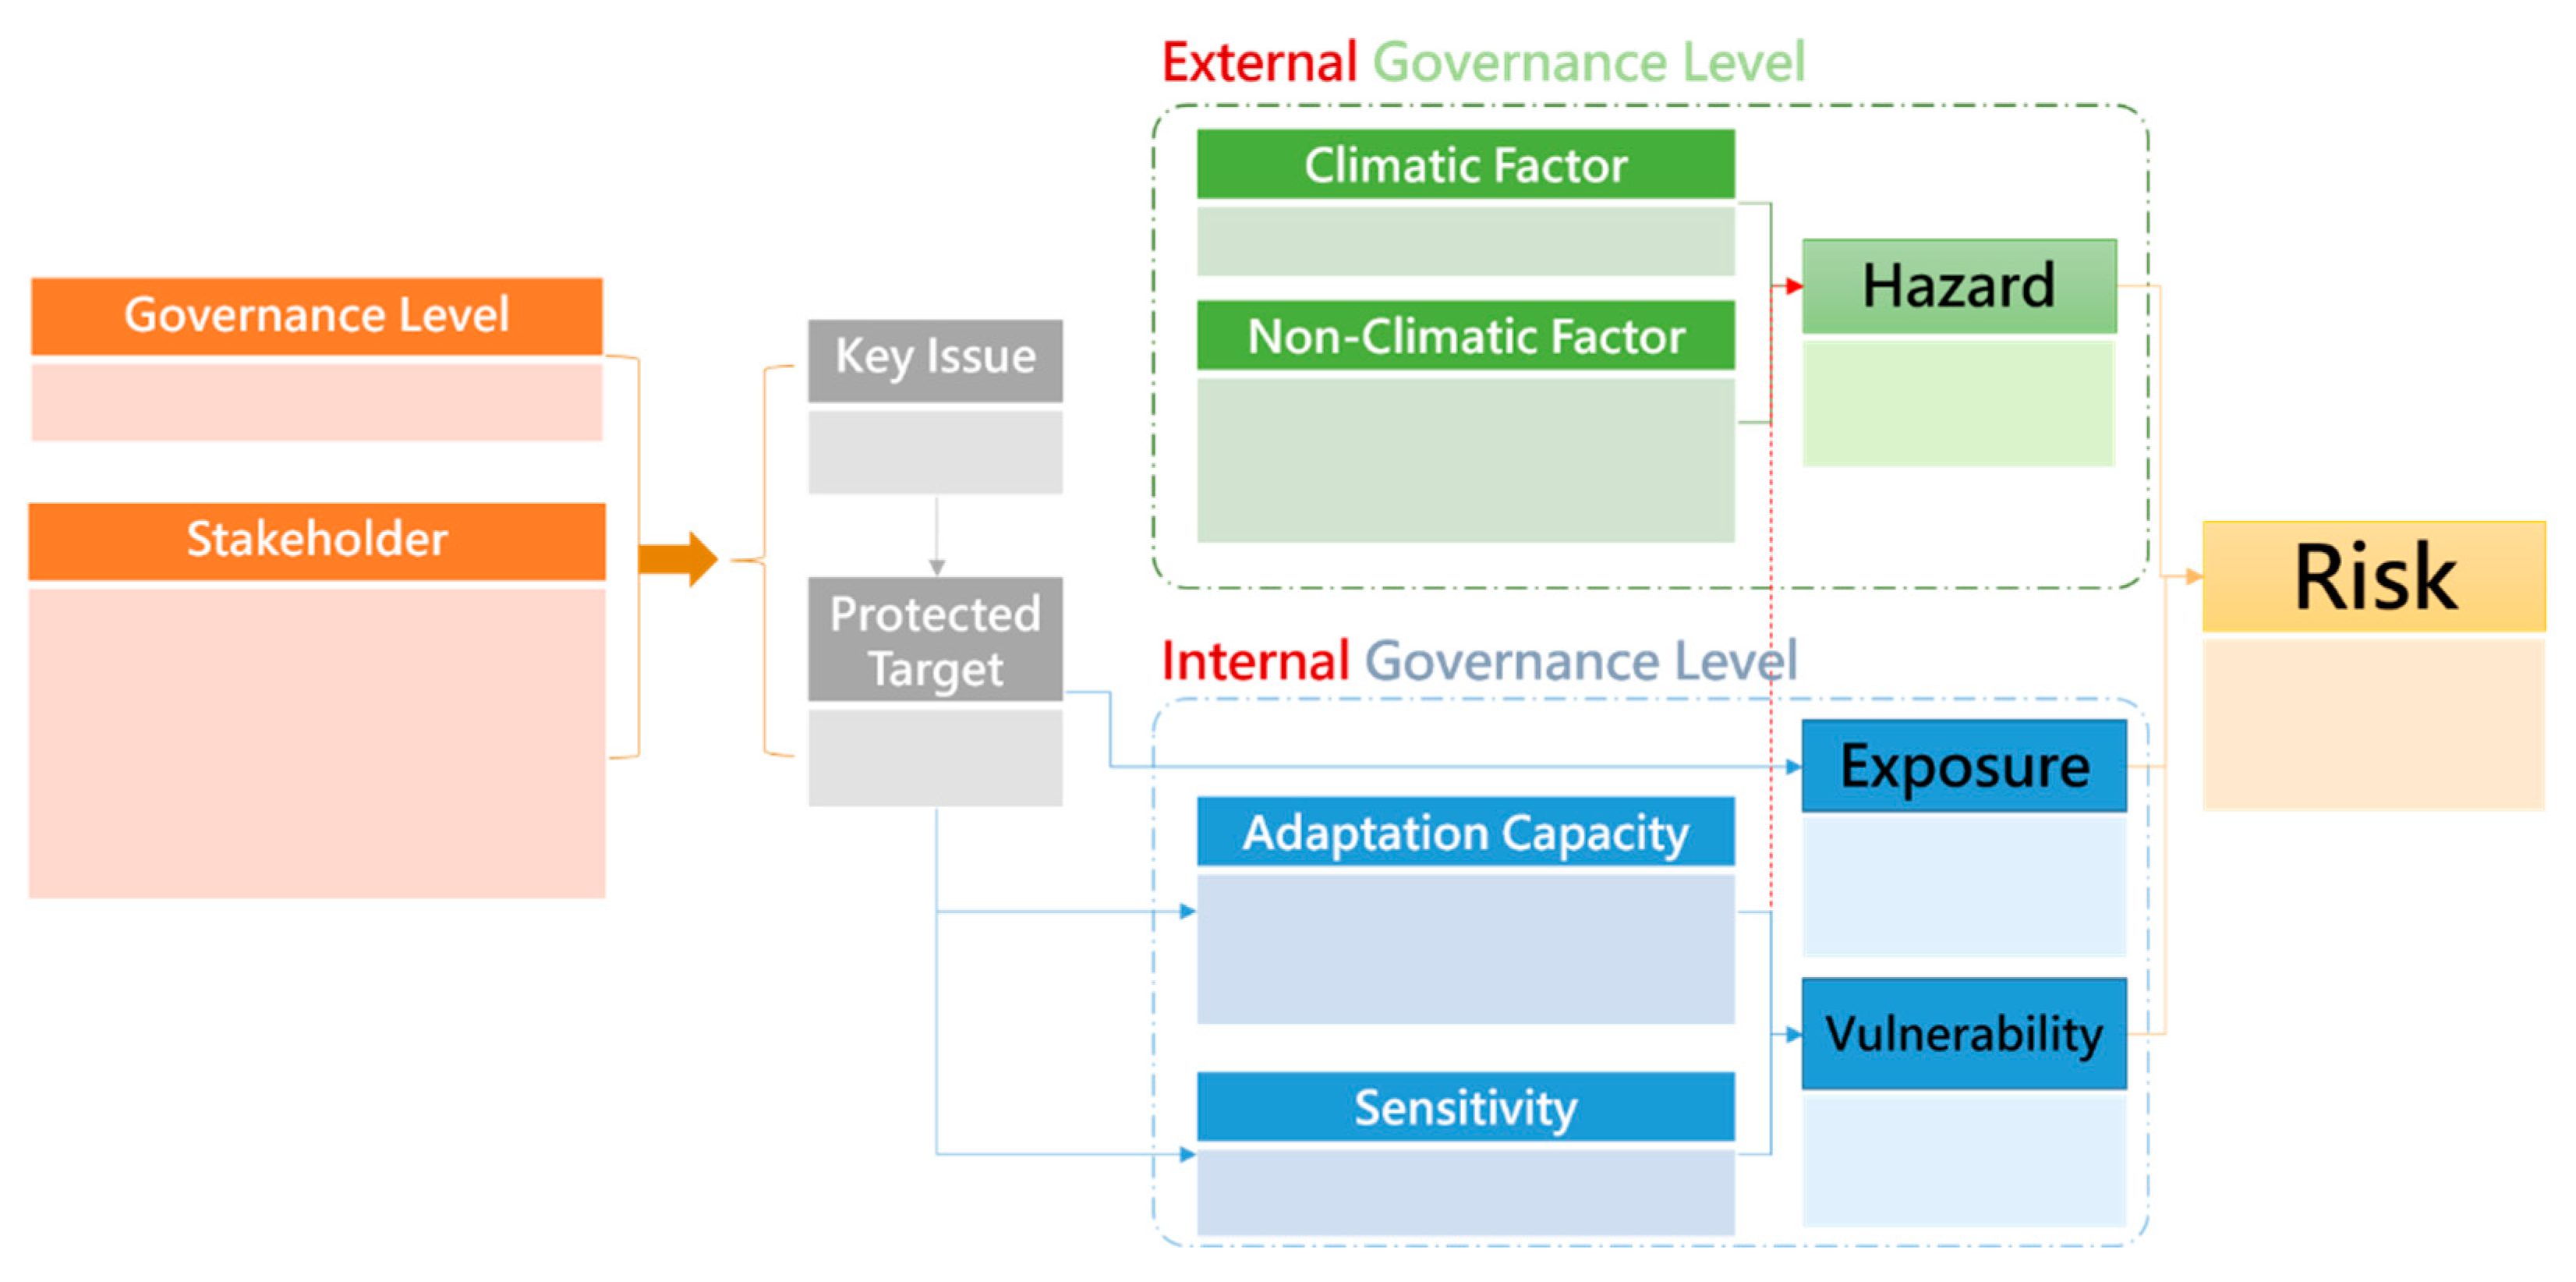
2.2. Climate Risk Template
2.2.1. Key Issue and Protected Target
2.2.2. Governance Level and Stakeholders
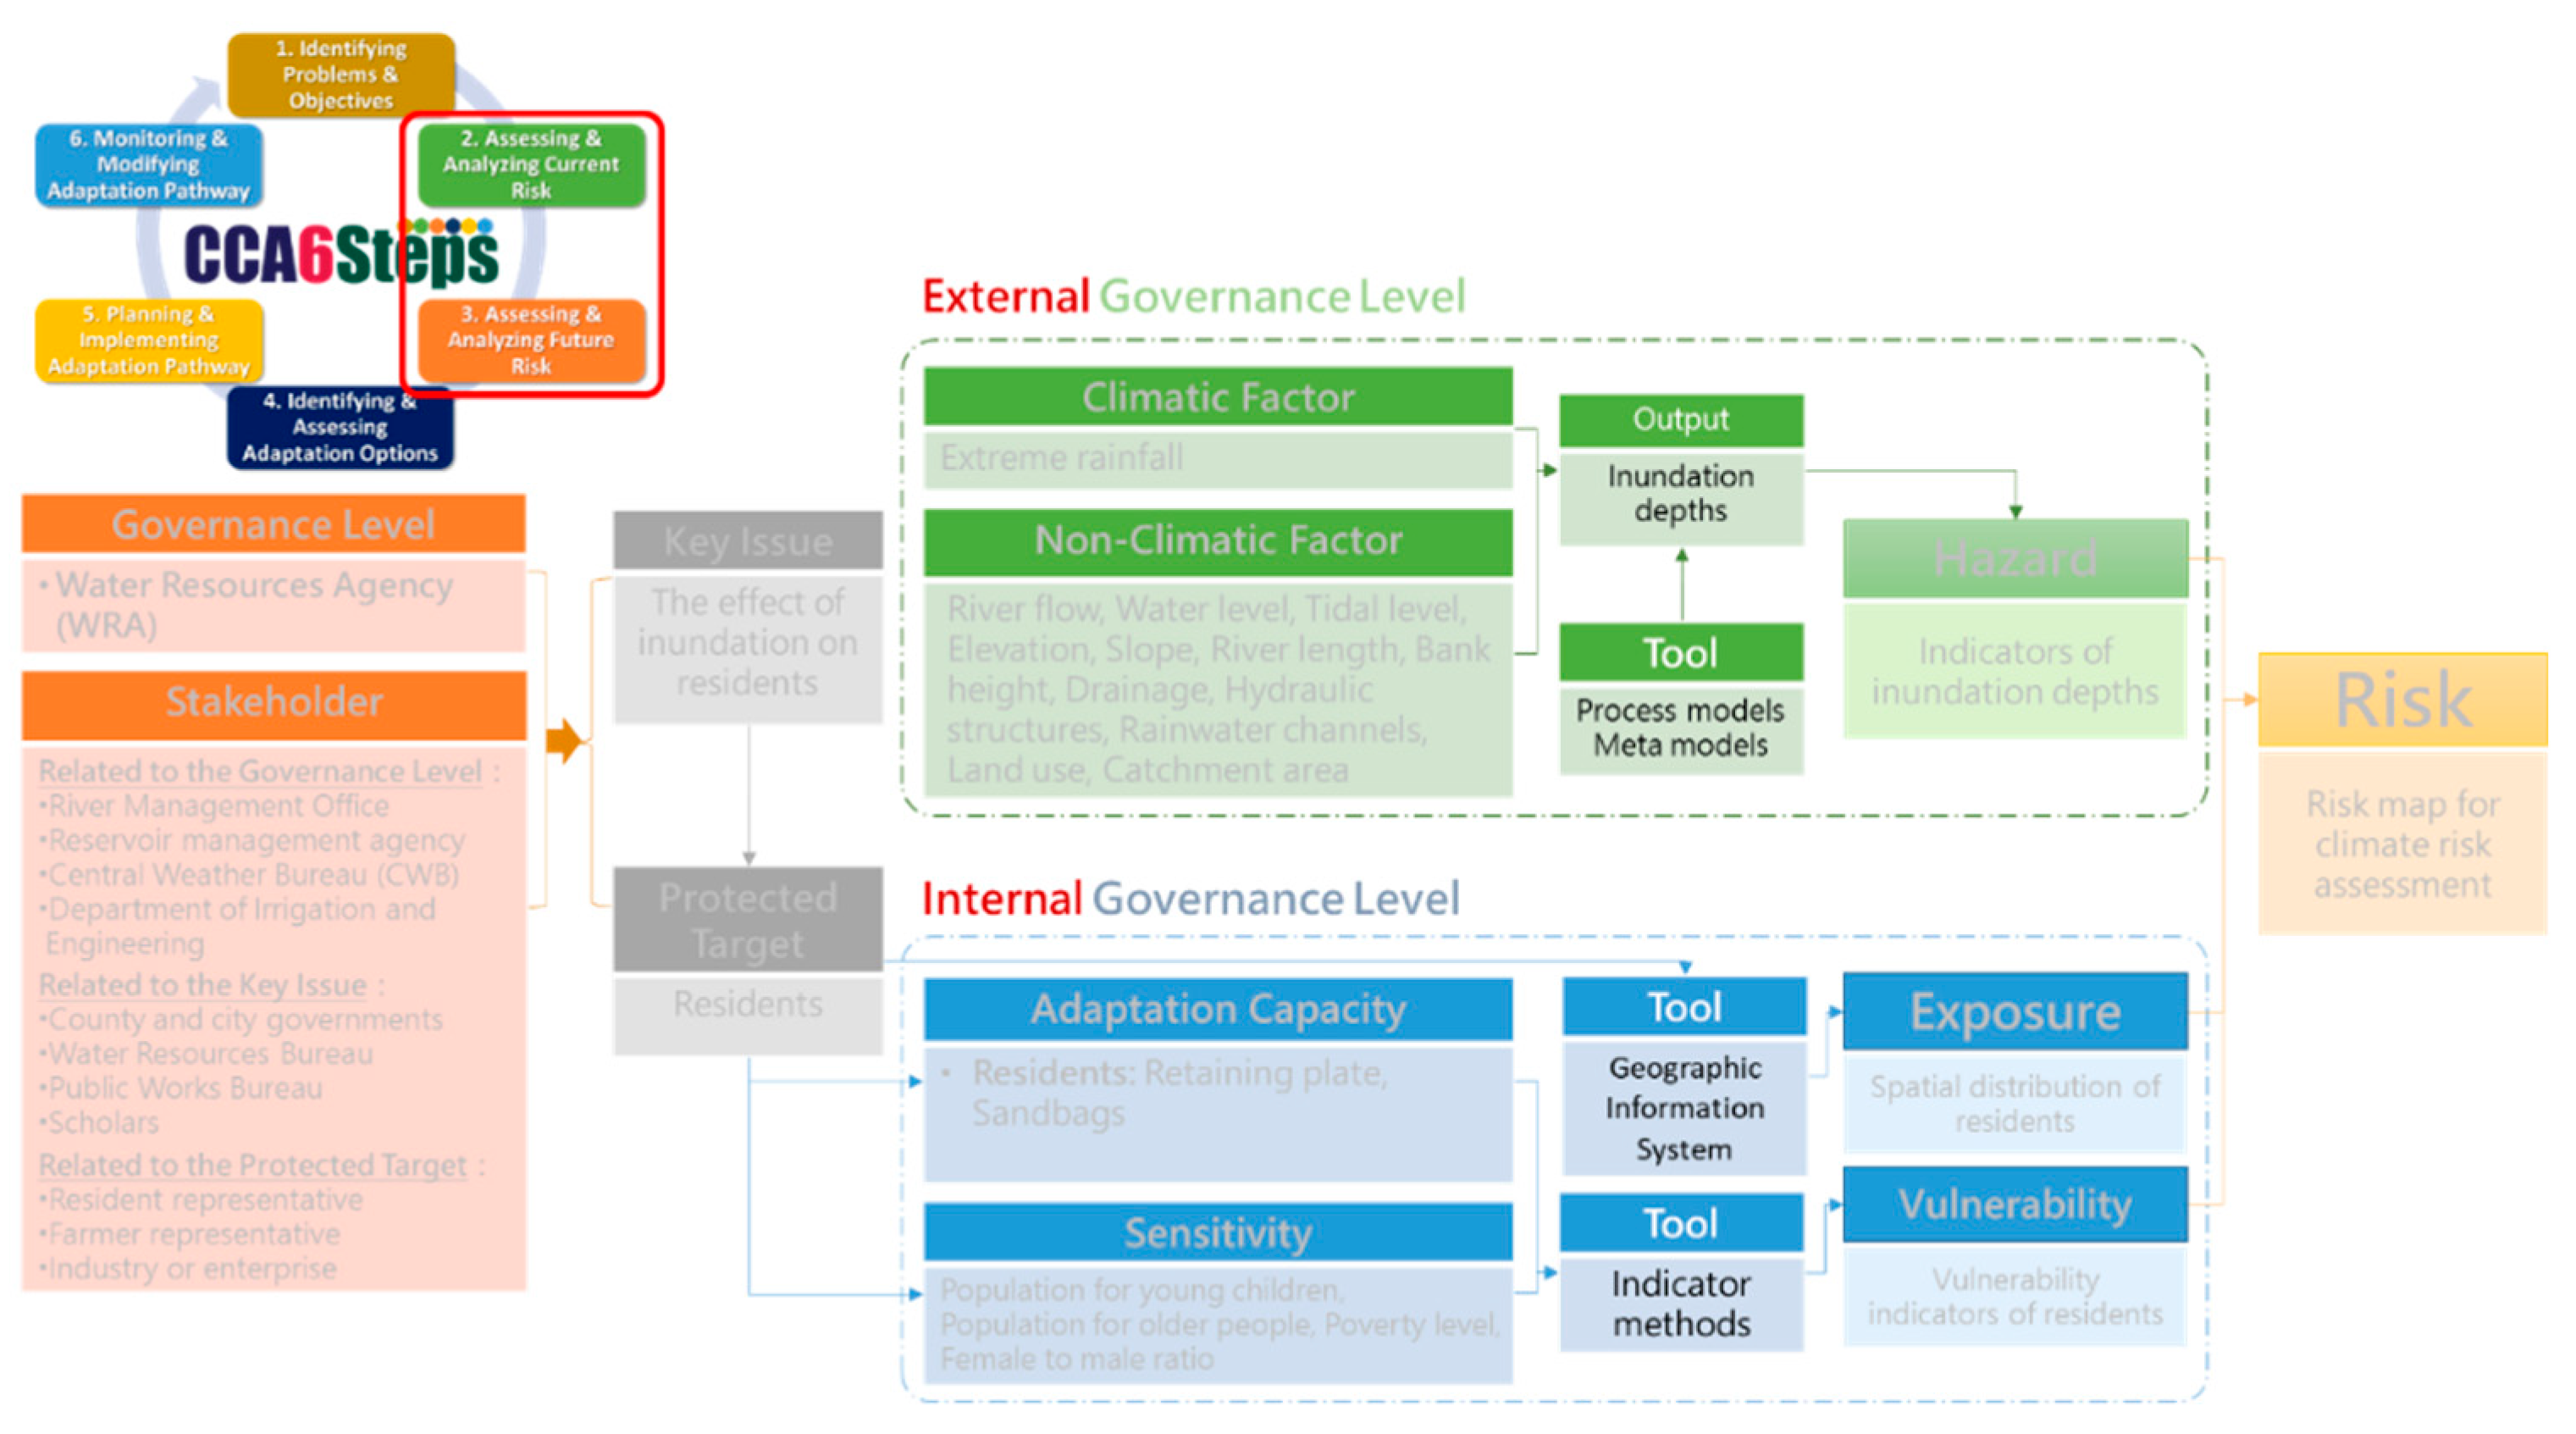
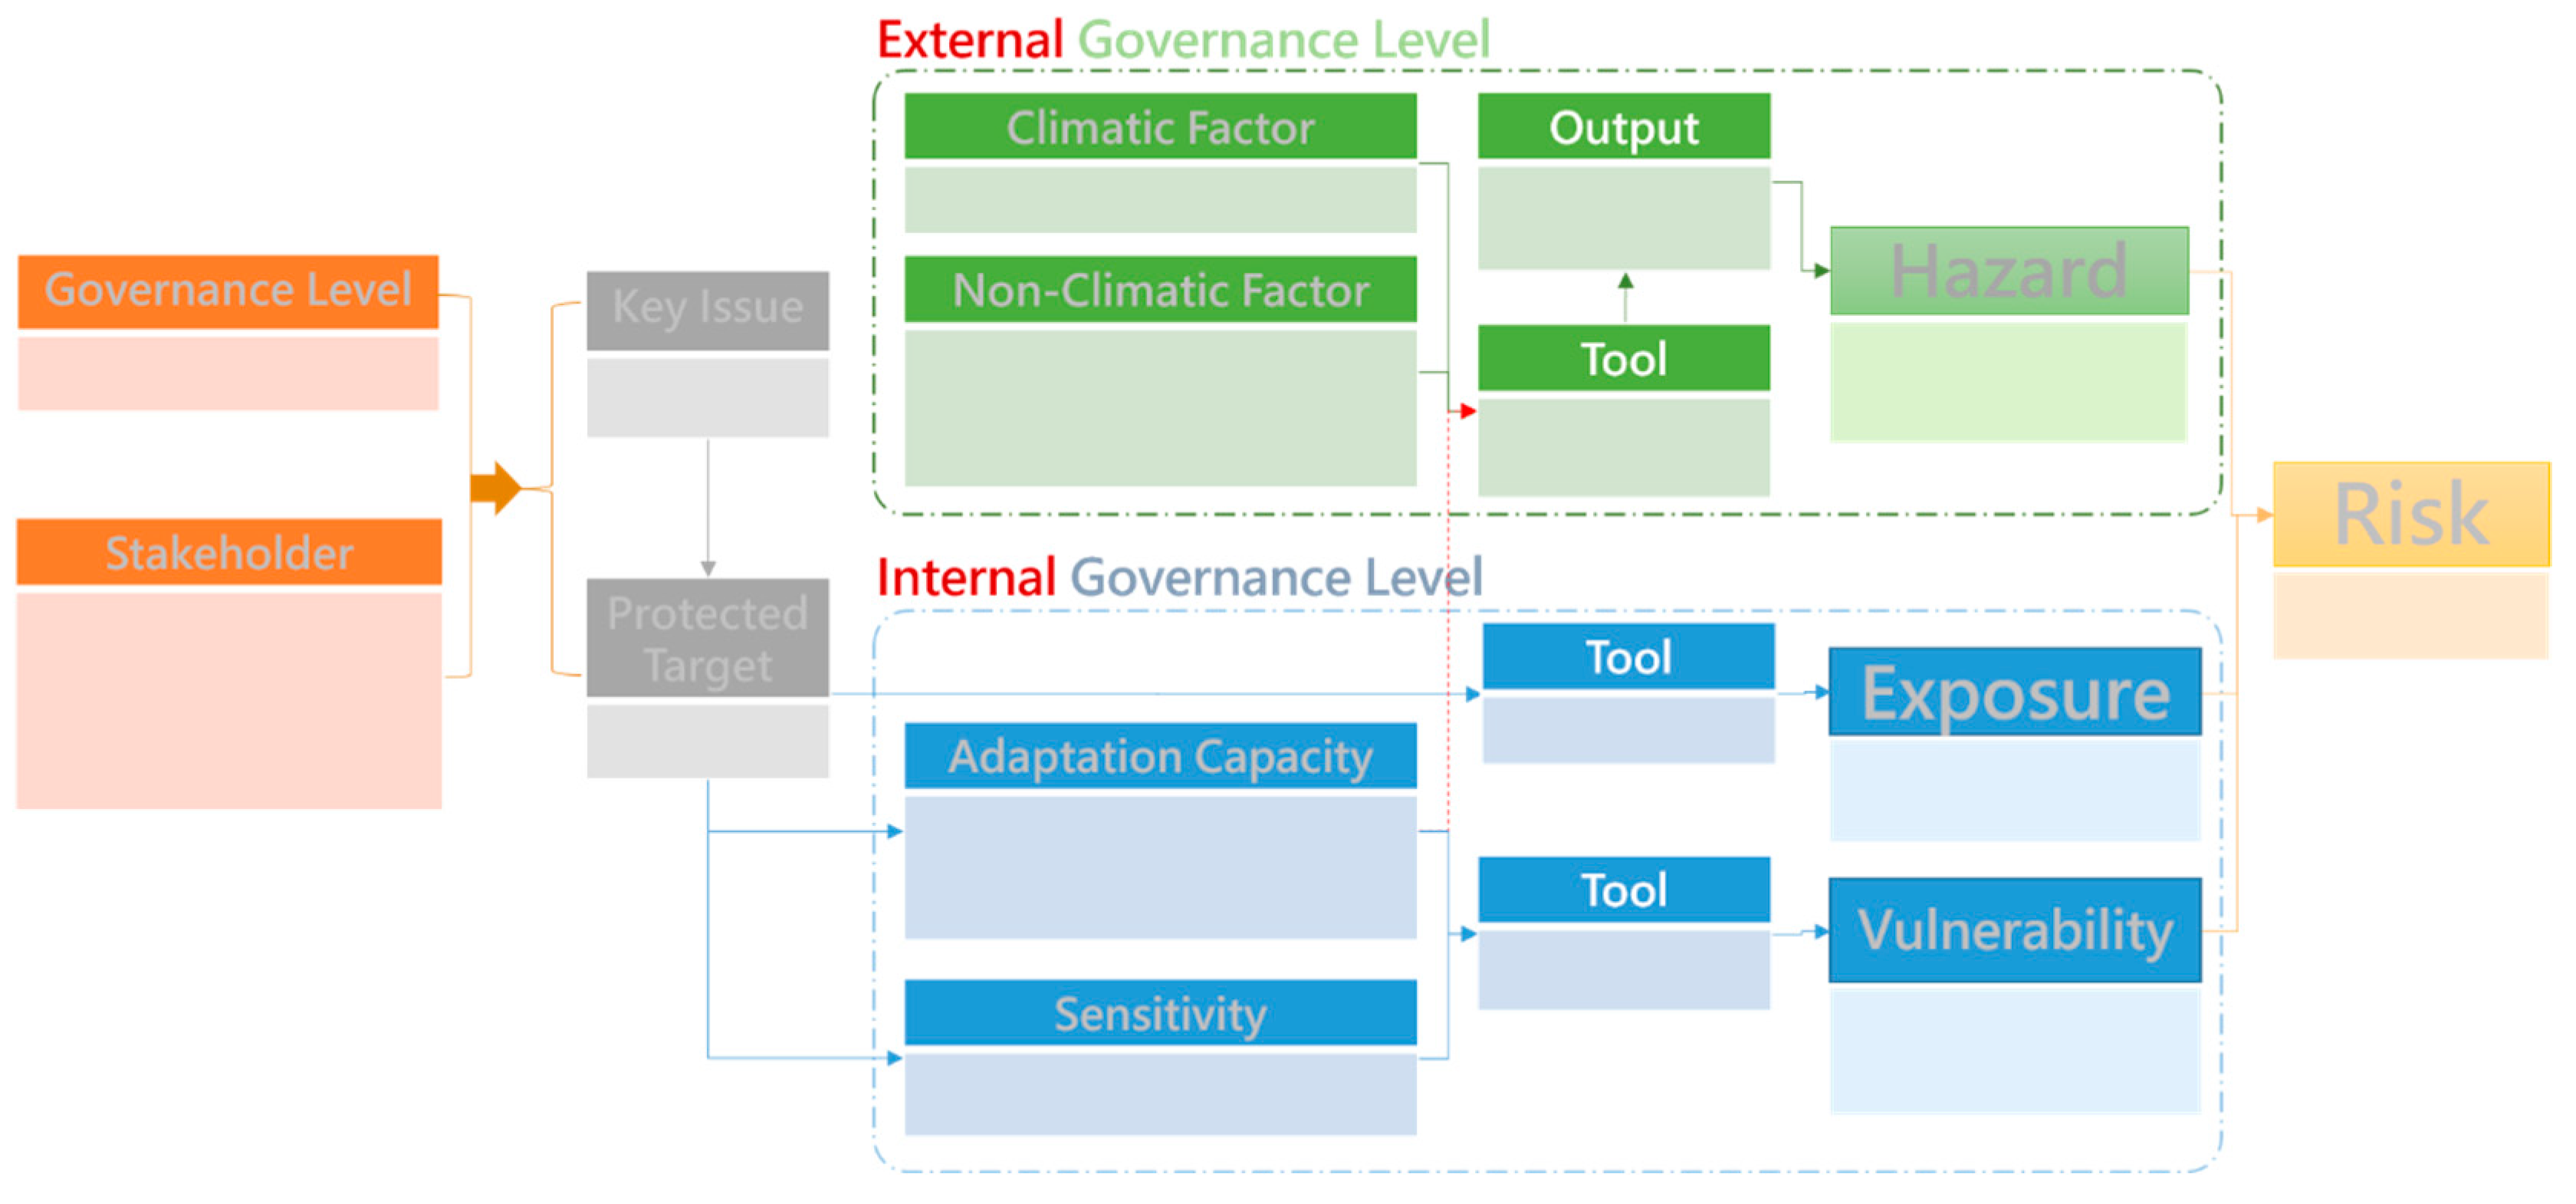
2.2.3. Hazard
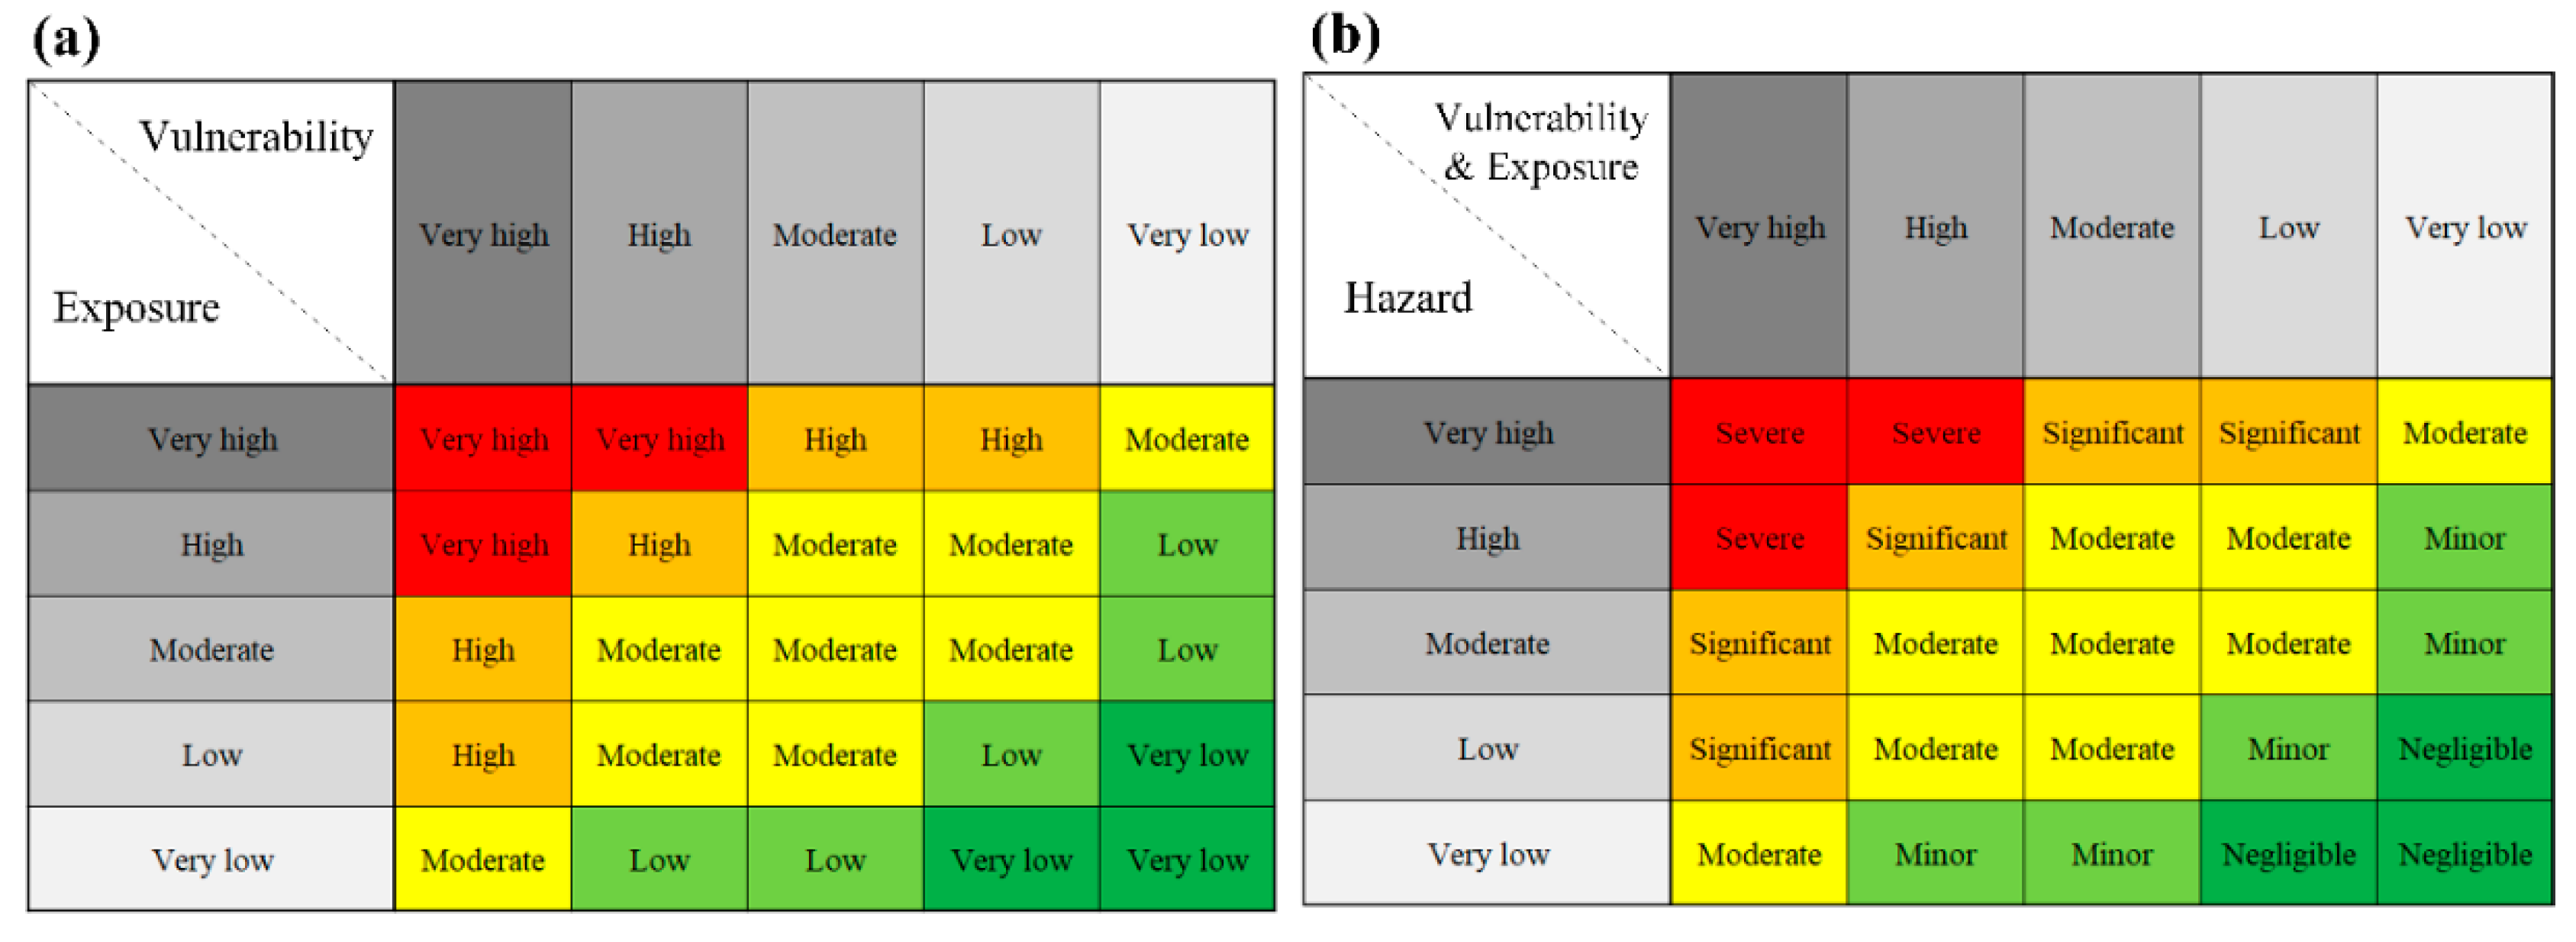
2.2.4. Exposure
2.2.5. Vulnerability
2.3. Procedure of Climate Risk Assessment
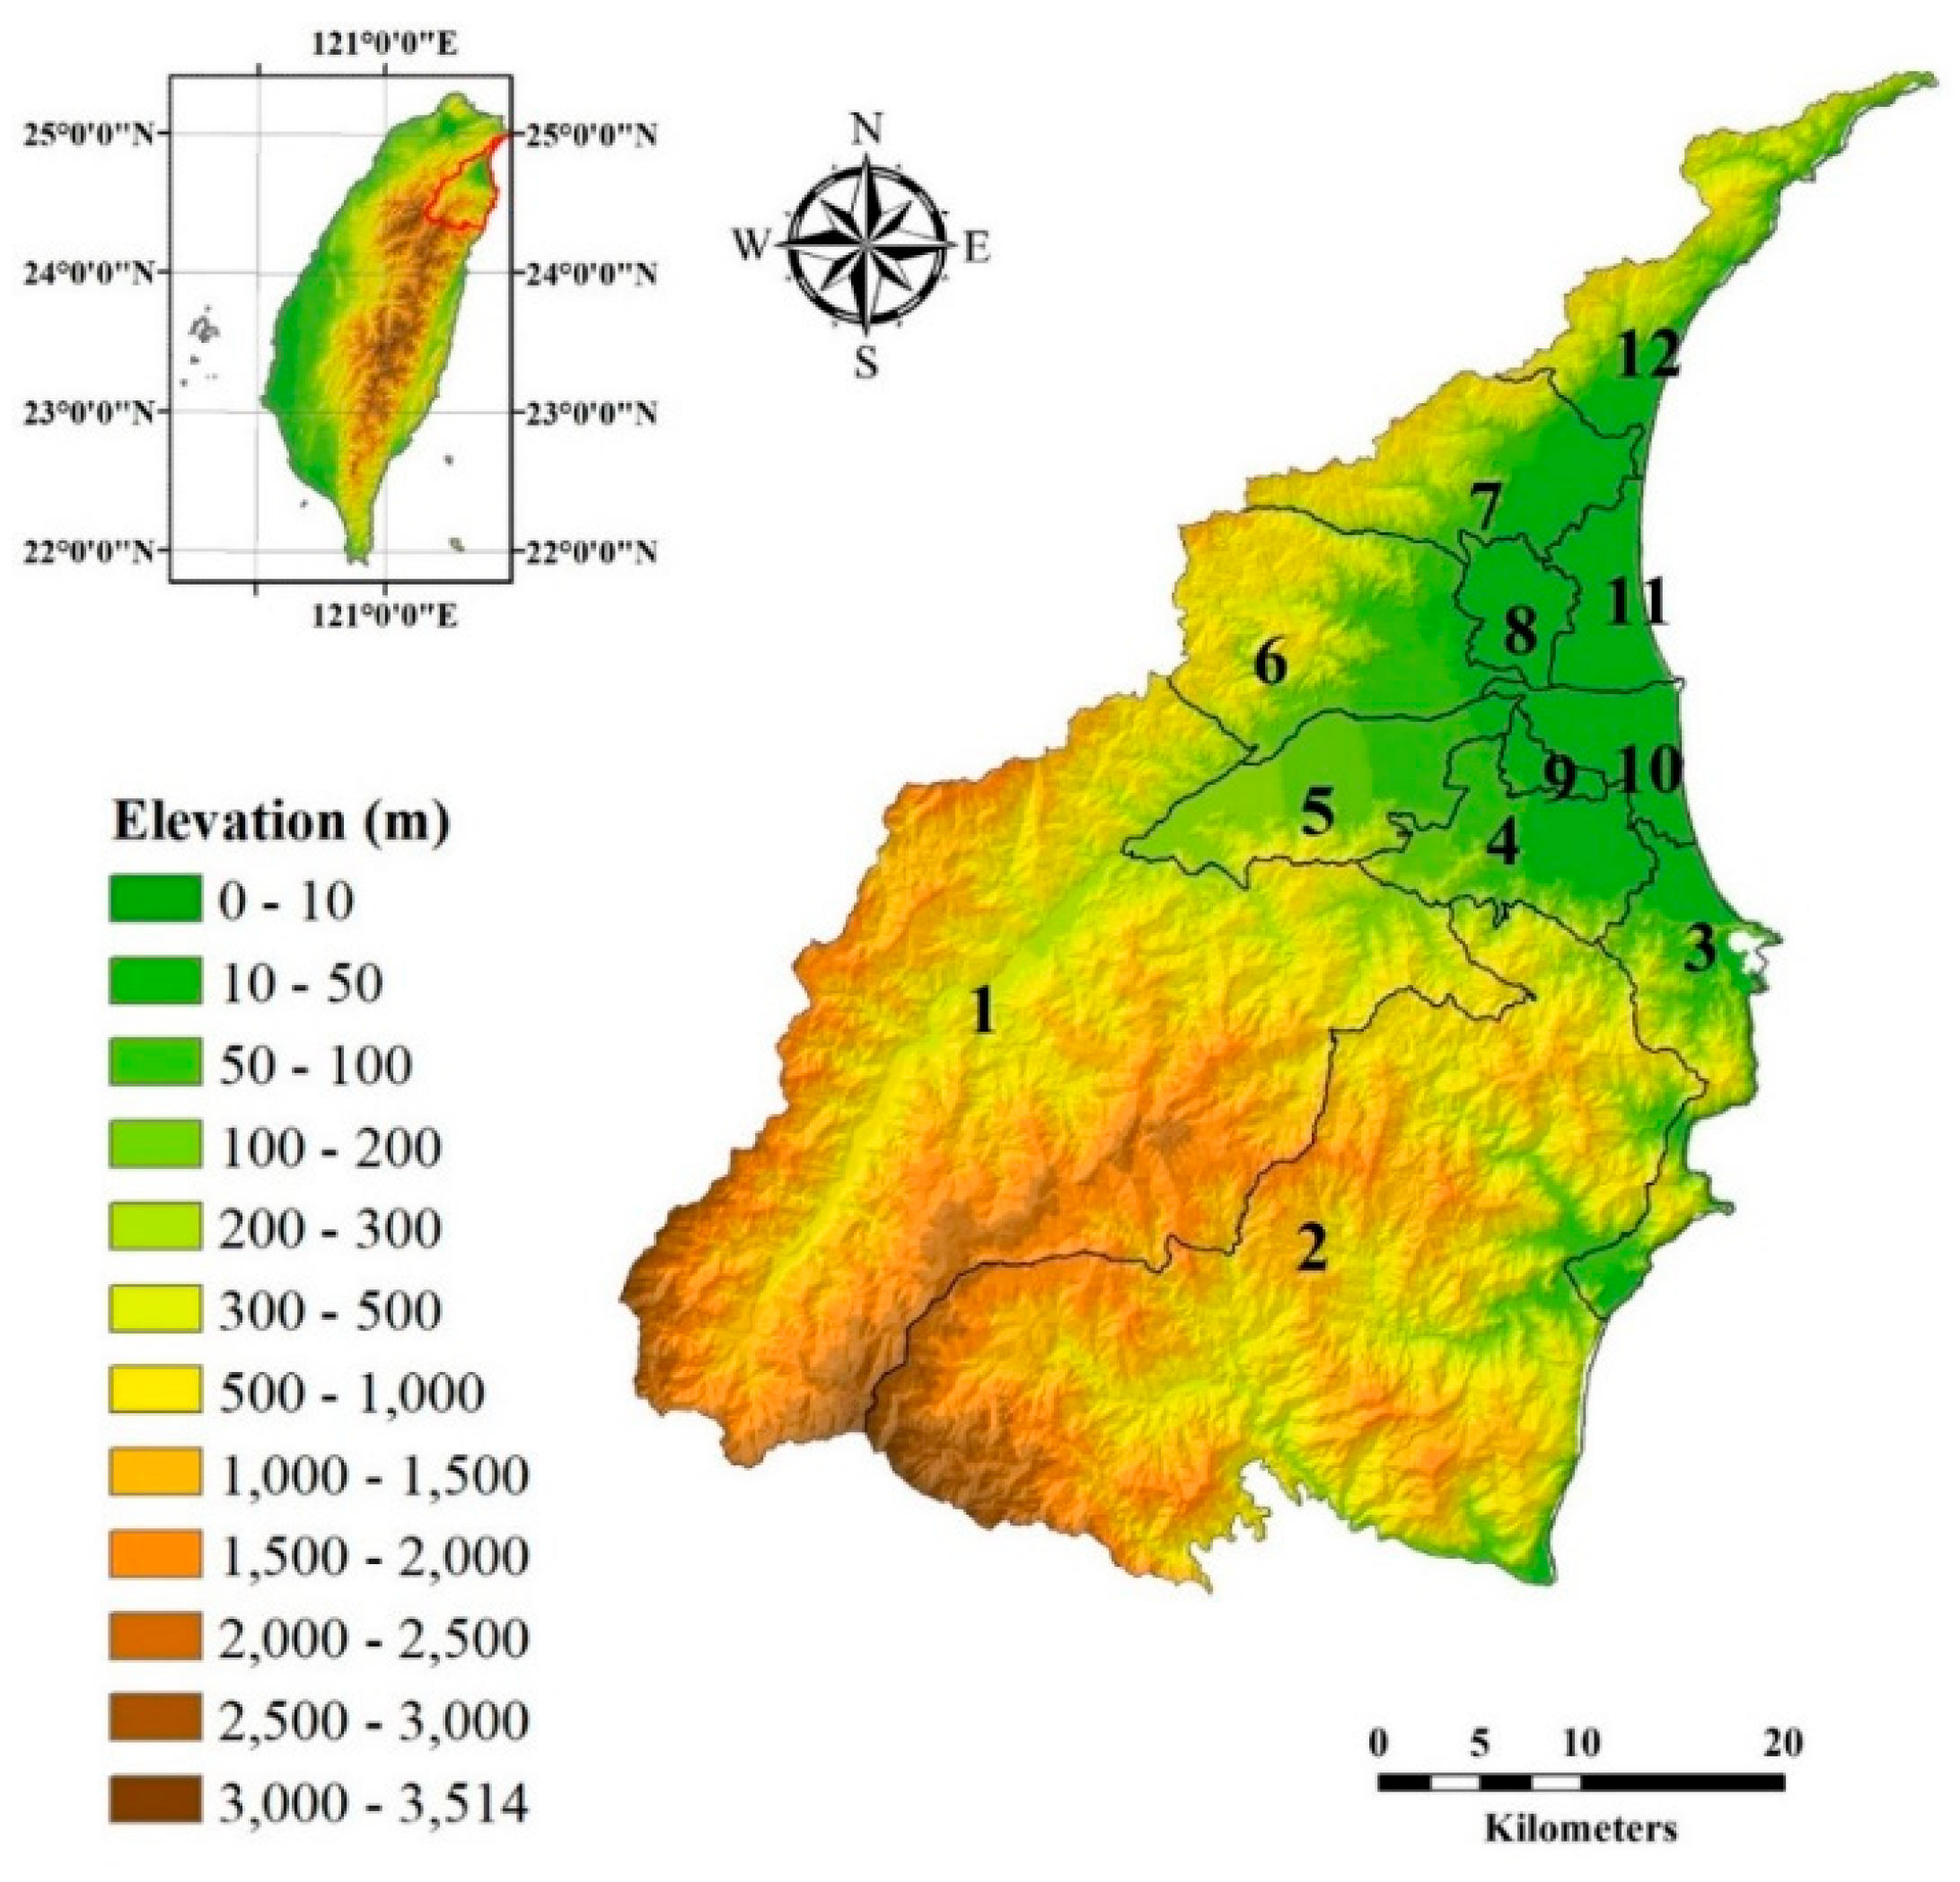
3. Study Area and Data
4. Results
4.1. Identification of the Problems for Inundation Disaster
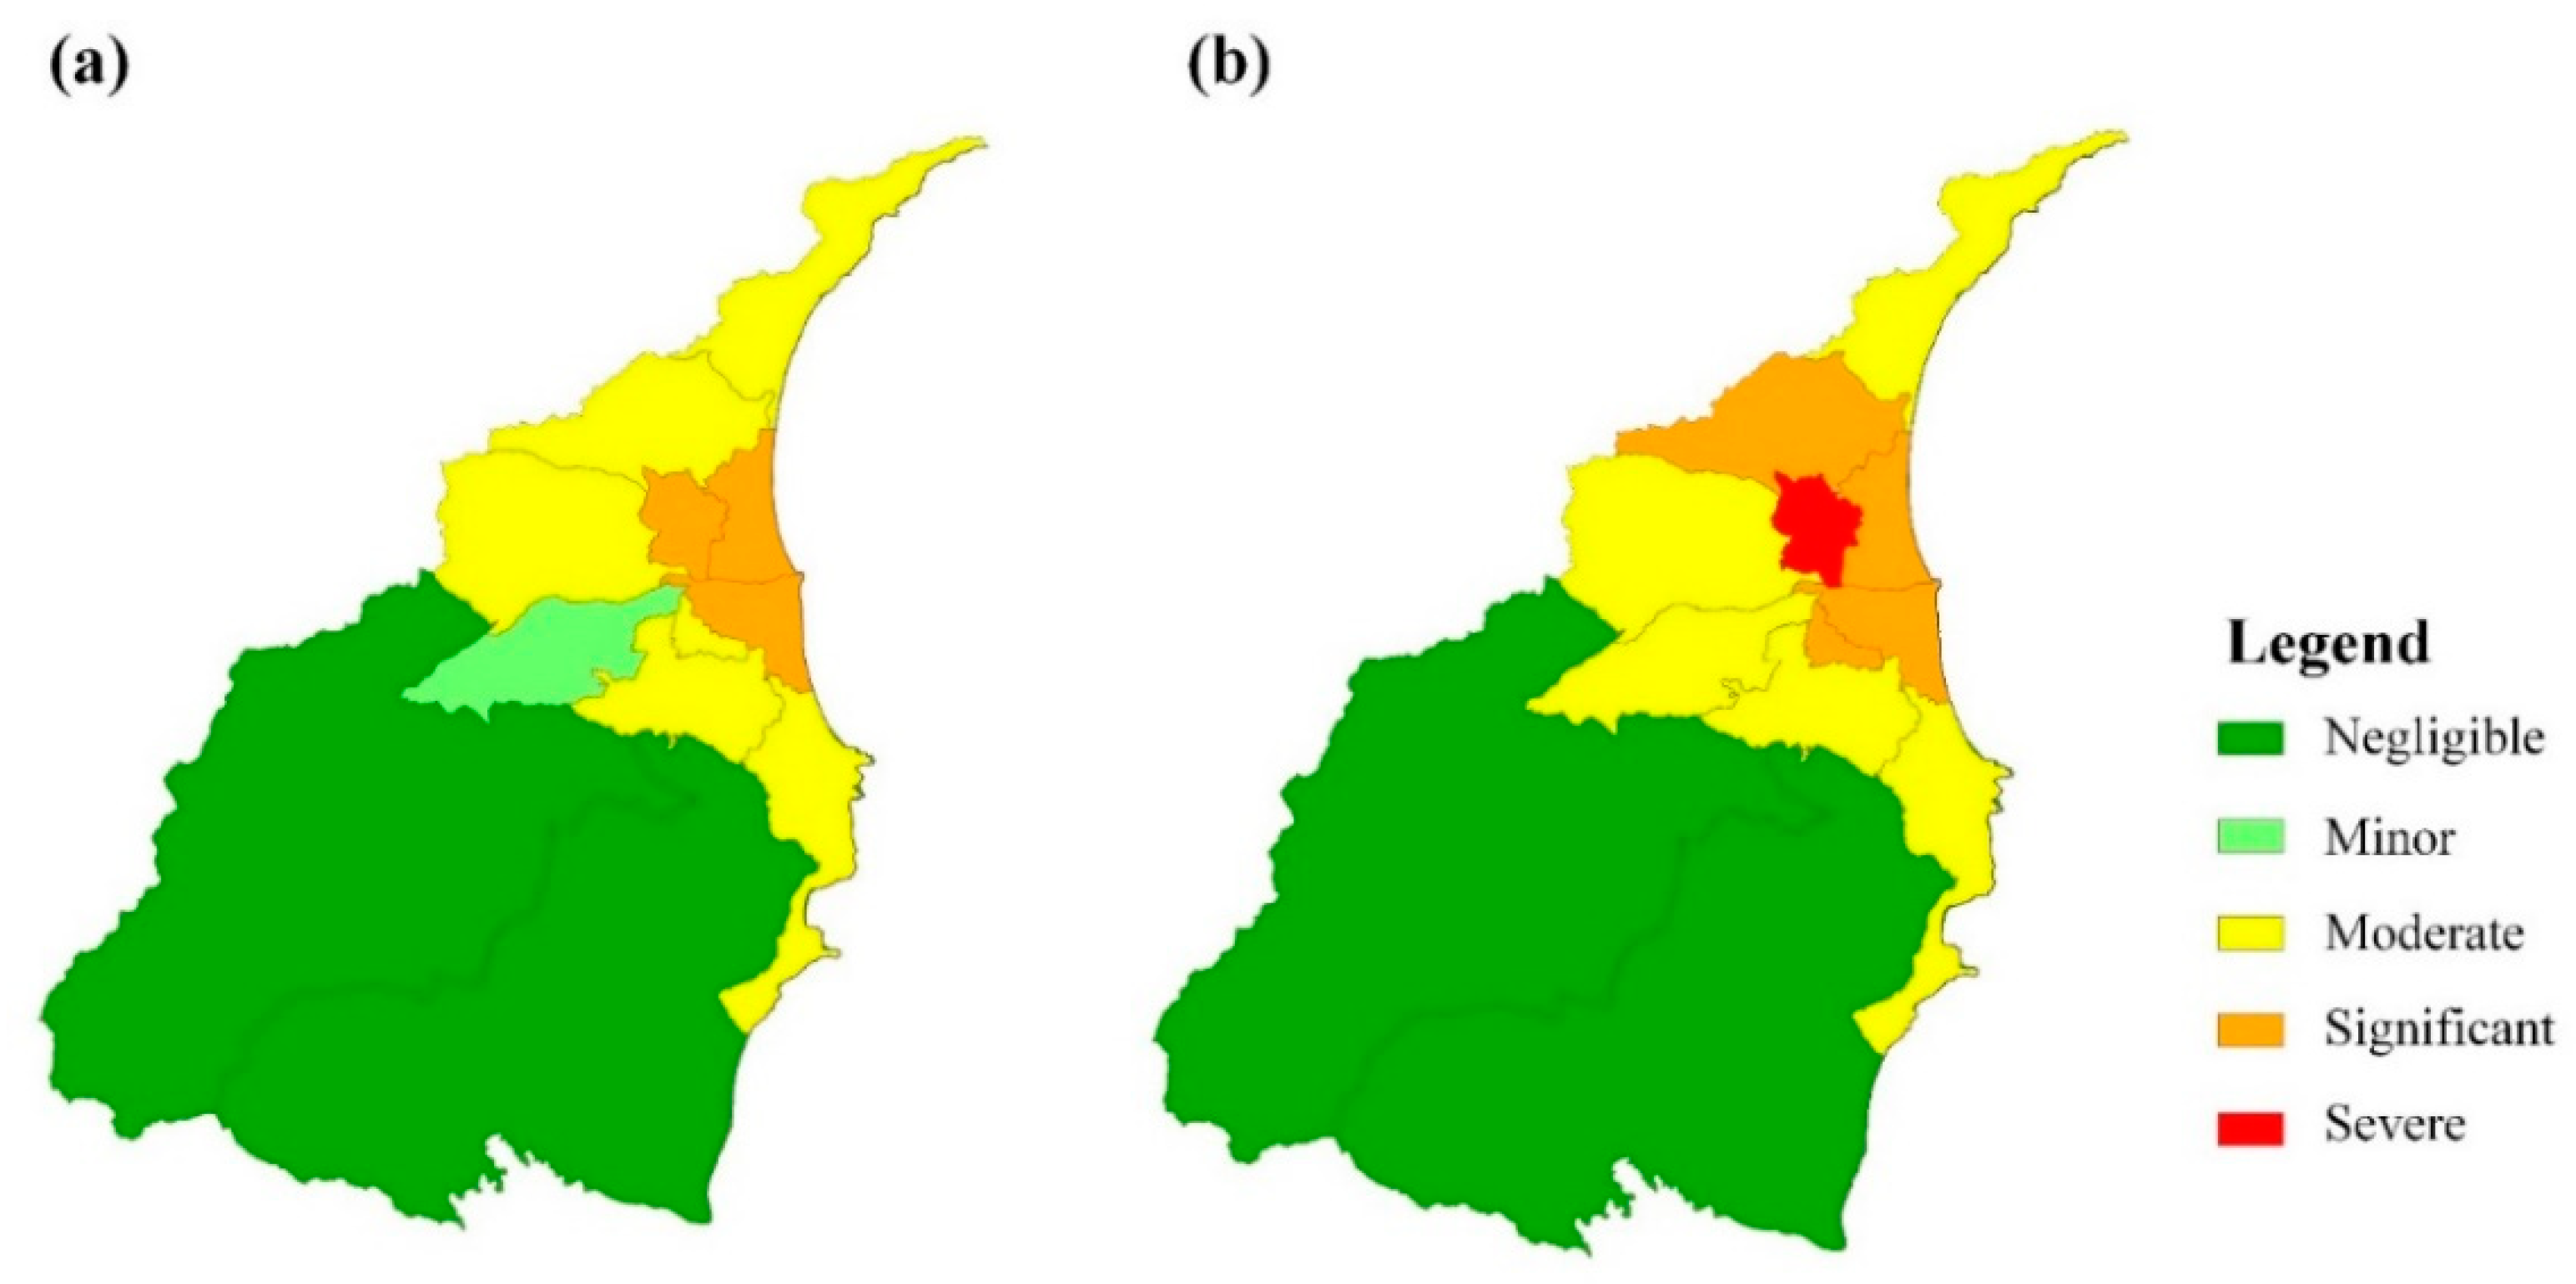
4.2. Current and Future Risk Analysis and the Demonstration of the Spatial Assessment of Climate Risk
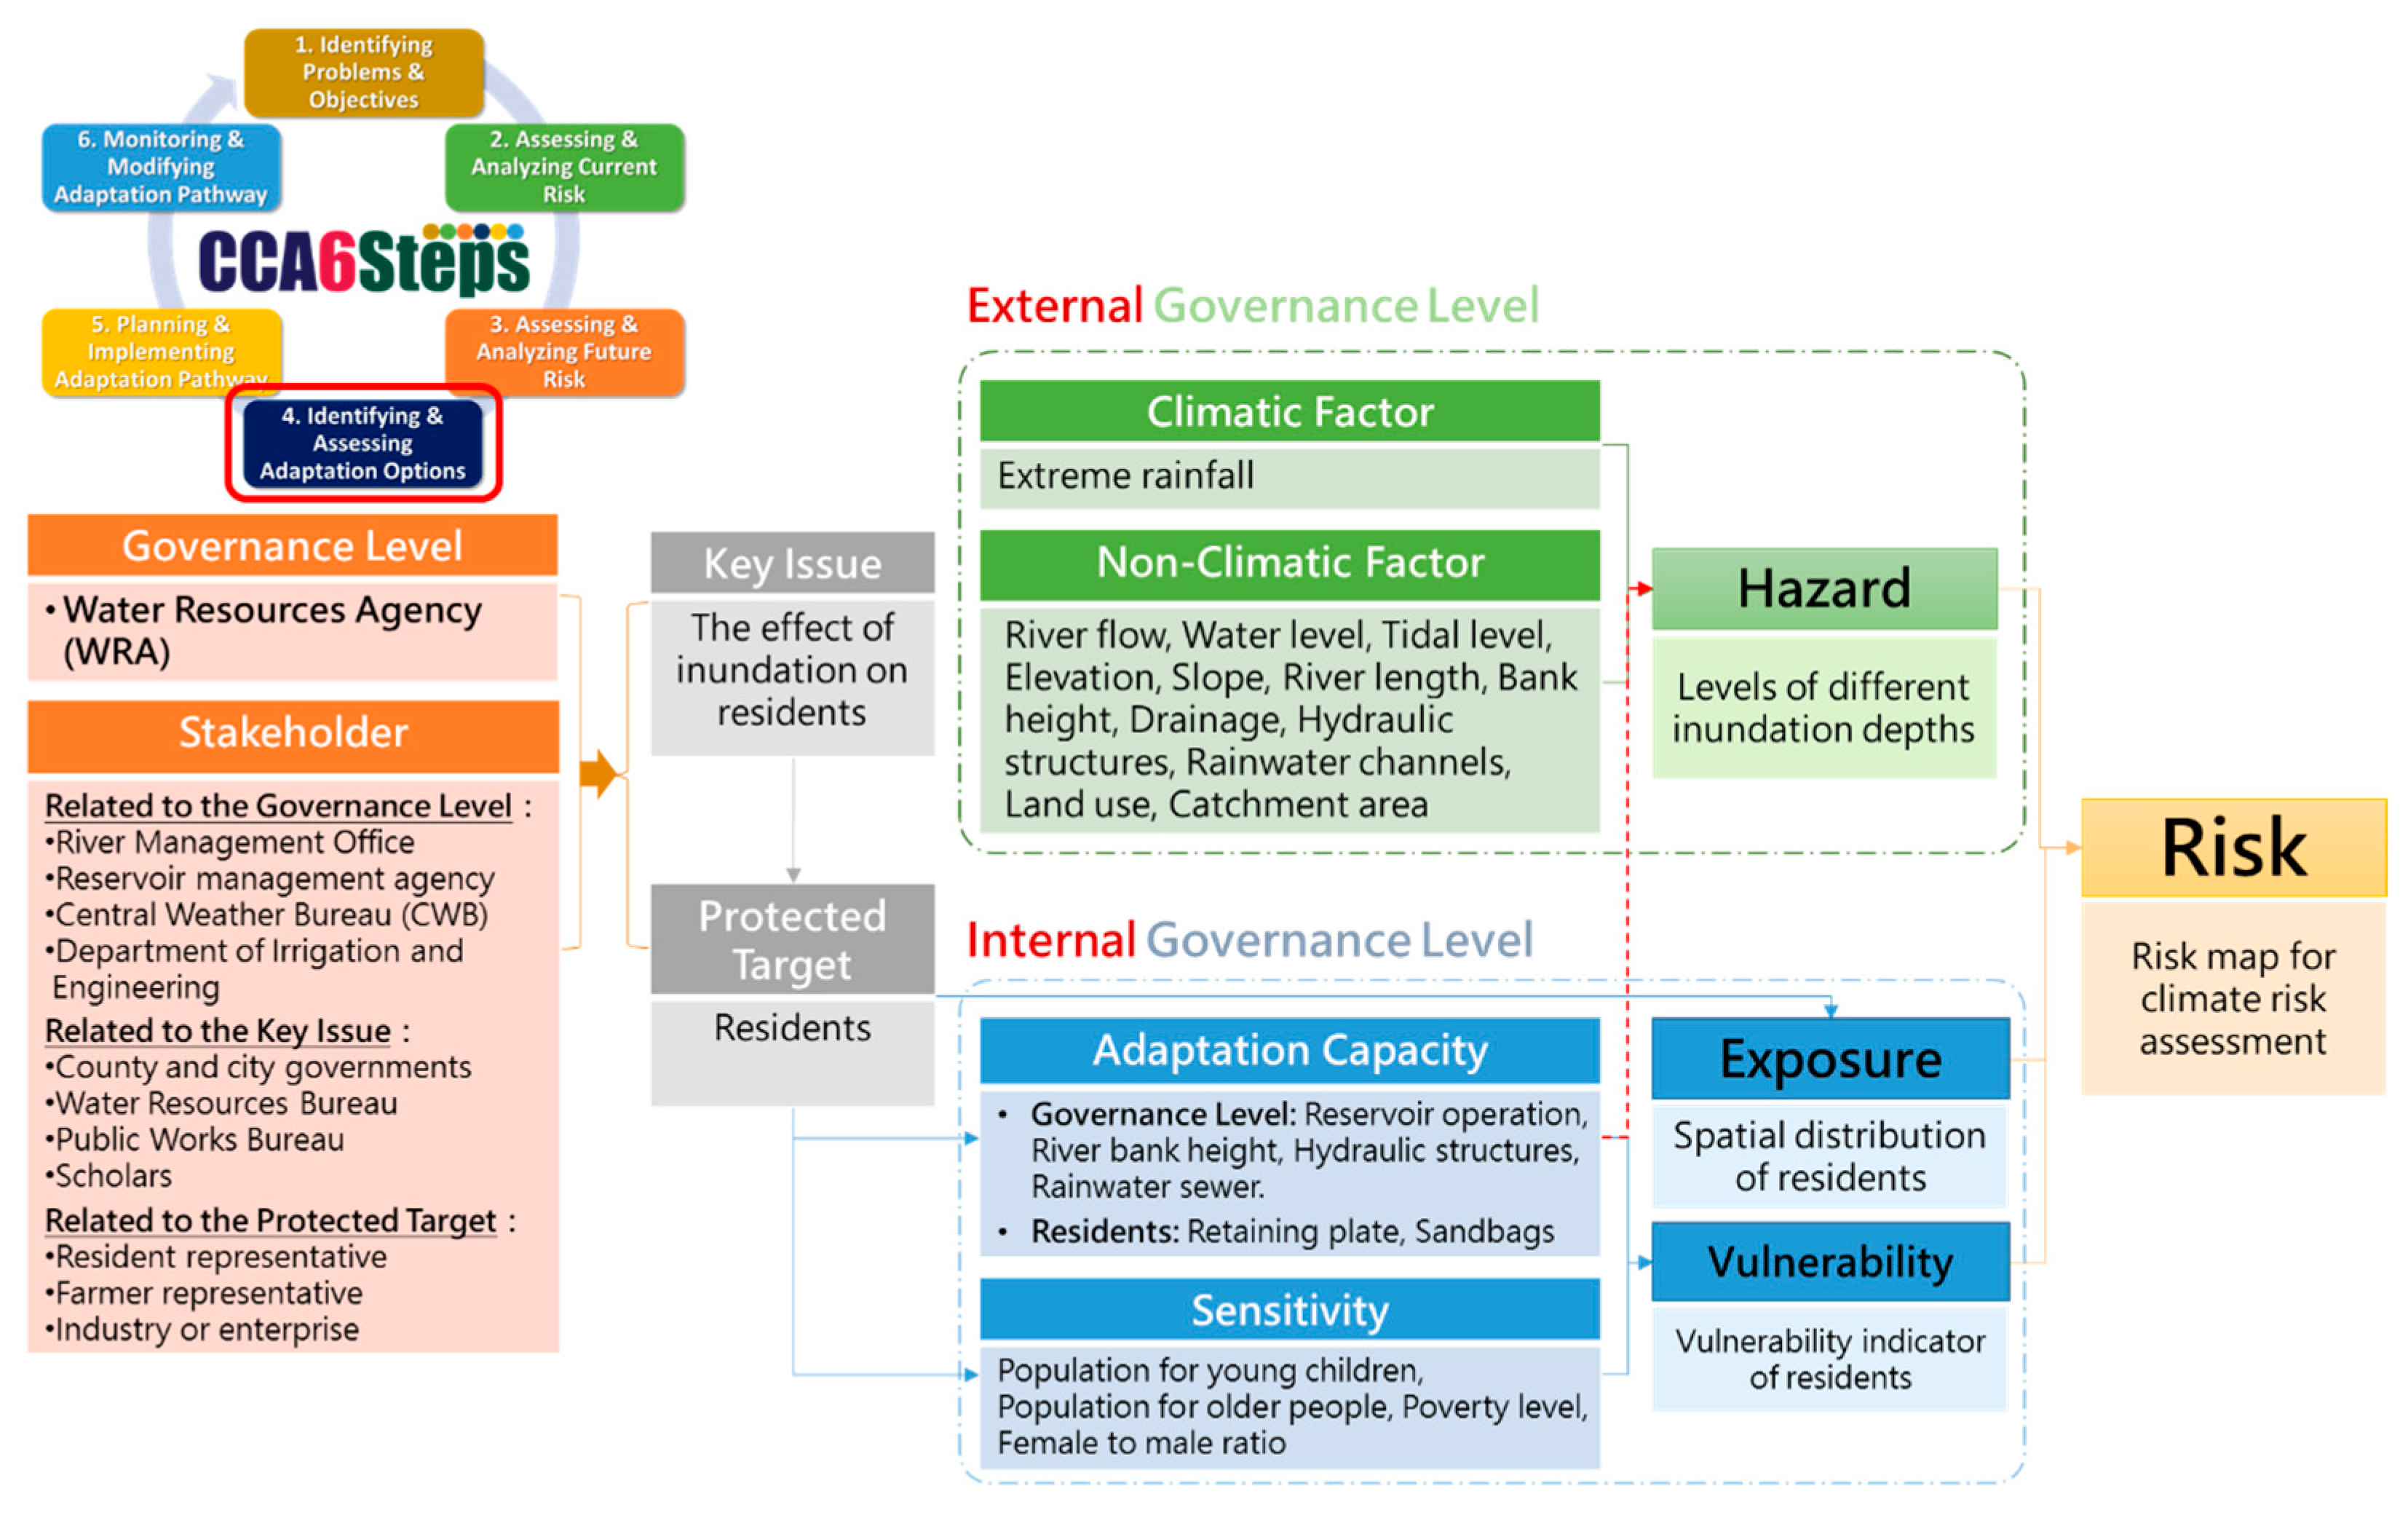
4.3. Investigation of Climate Adaptation Strategies for Decreasing Climate Risk
5. Discussion
6. Conclusions
Author Contributions
Funding
Acknowledgments
Conflicts of Interest
References
- Croce, P.; Formichi, P.; Landi, F.; Castelluccio, R. Use of weather generators to assess impact of climate change: Thermal actions on structures. In Fifth International Conference Advances in Civil, Structural and Mechanical Engineering-CSM 2017; Institute of Research Engineers and Doctors: New York, NY, USA, 2017; pp. 32–36. [Google Scholar]
- Araos, M.; Berrang-Ford, L.; Ford, J.D.; Austin, S.E.; Biesbroek, R.; Lesnikowski, A. Climate change adaptation planning in large cities: A systematic global assessment. Environ. Sci. Policy 2016, 66, 375–382. [Google Scholar] [CrossRef]
- Ayeb-Karlsson, S.; van der Geest, K.; Ahmed, I.; Huq, S.; Warner, K. A people-centred perspective on climate change, environmental stress, and livelihood resilience in Bangladesh. Sustain. Sci. 2016, 11, 679–694. [Google Scholar] [CrossRef] [PubMed]
- McIver, L.; Kim, R.; Woodward, A.; Hales, S.; Spickett, J.; Katscherian, D.; Hashizume, M.; Honda, Y.; Kim, H.; Iddings, S.; et al. Health impacts of climate change in Pacific island countries: A regional assessment of vulnerabilities and adaptation priorities. Environ. Health Perspect. 2015, 124, 1707–1714. [Google Scholar] [CrossRef] [PubMed]
- Mann, M.E.; Rahmstorf, S.; Kornhuber, K.; Steinman, B.A.; Miller, S.K.; Coumou, D. Influence of anthropogenic climate change on planetary wave resonance and extreme weather events. Sci. Rep. 2017, 7, 45242. [Google Scholar] [CrossRef] [PubMed]
- Sisco, M.R.; Bosetti, V.; Weber, E.U. When do extreme weather events generate attention to climate change? Clim. Chang. 2017, 143, 227–241. [Google Scholar] [CrossRef]
- The Intergovernmental Panel on Climate Change (IPCC). Climate Change (IPCC). Climate change 2014: Impacts, adaptation, and vulnerability. Part A: Global and sectoral aspects. In Contribution of Working Group II to the Fifth Assessment Report of the Intergovernmental Panel on Climate Change; Cambridge University Press: Cambridge, UK; New York, NY, USA, 2014. [Google Scholar]
- African Development Bank; Asian Development Bank; Department for International Development, United Kingdom; Ministry of Foreign Affairs-Development Cooperation, The Netherlands; Directorate-General for Development, European Commission; Federal Ministry for Economic Cooperation and Development, Germany; Organization for Economic Cooperation and Development; United Nations Development Programme; United Nations Environment Programme; The World Bank. Poverty and Climate Change: Reducing the Vulnerability of the Poor through Adaptation; World Bank: Washington, DC, USA, 2003.
- The Intergovernmental Panel on Climate Change (IPCC). Climate Change (IPCC). Climate Change 2001: Impacts, Adaptation, and Vulnerability. In Contribution of Working Group II to the Third Assessment Report of the Intergovernmental Panel on Climate Change; Cambridge University Press: Cambridge, UK; New York, NY, USA, 2001. [Google Scholar]
- The Intergovernmental Panel on Climate Change (IPCC). Climate Change (IPCC). Climate Change 2007: Impacts, Adaptation, and Vulnerability. In Working Group II Contribution to the Intergovernmental Panel on Climate Change Fourth Assessment Report; Summary for Policy Makers; Cambridge University Press: New York, NY, USA, 2007. [Google Scholar]
- The United Nations Framework Convention on Climate Change (UNFCCC). Application of methods and tools for assessing impacts and vulnerability, and developing adaptation responses. In Background Paper by the UNFCCC Secretariat; FCCC/SBSTA/2004/INF.13; UNFCCC: Rio de Janeiro, Brazil, 2004. [Google Scholar]
- Hurlimann, A.; Barnett, J.; Fincher, R.; Osbaldiston, N.; Mortreux, C.; Graham, S. Urban planning and sustainable adaptation to sea-level rise. Landsc. Urban Plan. 2014, 126, 84–93. [Google Scholar] [CrossRef]
- Willows, R.I.; Connell, R.K. Climate Adaptation: Risk, Uncertainty and Decision-Making. In UKCIP Technical Report; UKCIP: Oxford, UK, 2003. [Google Scholar]
- Lim, B.; Spanger-Siegfried, E. Adaptation Policy Frameworks for Climate Change: Developing Strategies, Policies and Measures; United Nations Development Programme: New York, NY, USA, 2004. [Google Scholar]
- Creighton, J. How to Conduct a Shared Vision Planning Process; IWR Report 10-R-6; U.S. Army Institute for Water Resources: Alexandria, VA, USA, 2010.
- Palmer, R.N.; Cardwell, H.E.; Lorie, M.A.; Werick, W. Disciplined planning, structured participation, and collaborative modeling—Applying shared vision planning to water resources. J. Am. Water Resour. Assoc. 2013, 49, 614–628. [Google Scholar] [CrossRef]
- Langsdale, S.; Beall, A.; Bourget, E.; Hagen, E.; Kudlas, S.; Palmer, R.; Tate, D.; Werick, W. Collaborative modeling for decision support in water resources: Principles and best practices. J. Am. Water Resour. Assoc. 2013, 49, 629–638. [Google Scholar] [CrossRef]
- Richards, C.; Blackstock, K.L.; Carter, C.E. Practical Approaches to Participation SERG Policy Brief No. 1; Macauley Land Use Research Institute: Aberdeen, UK, 2004. [Google Scholar]
- Reed, M.S.; Fraser, E.D.G.; Dougill, A.J. An adaptive learning process for developing and applying sustainability indicators with local communities. Ecol. Econ. 2006, 59, 406–418. [Google Scholar] [CrossRef]
- Broad, K.; Pfaff, A.; Taddei, R.; Sankarasubramanian, A.; Lall, U.; de Assis de Souza Filho, F. Climate, stream flow prediction and water management in northeast Brazil: Societal trends and forecast value. Clim. Chang. 2007, 84, 217–239. [Google Scholar] [CrossRef]
- Haasnoot, M.; van’t Klooster, S.; van Alphen, J. Designing a monitoring system to detect signals to adapt to uncertain climate change. Glob. Environ. Chang. Hum. Policy Dimens. 2018, 52, 273–285. [Google Scholar] [CrossRef]
- Petley, D. Global patterns of loss of life from landslides. Geology 2012, 40, 927–930. [Google Scholar] [CrossRef]
- Sun, D.Y.; Zhang, D.W.; Cheng, X.T. Framework of National Non-Structural Measures for Flash Flood Disaster Prevention in China. Water 2012, 4, 272–282. [Google Scholar] [CrossRef]
- Datta, S.; Mukherjee, S.K. Developing a risk management matrix for effective project planning—an empirical study. Proj. Manag. J. 2001, 32, 45–57. [Google Scholar] [CrossRef]
- Pan, T.Y.; Chang, L.Y.; Lai, J.S.; Chang, H.K.; Lee, C.S.; Tan, Y.C. Coupling typhoon rainfall forecasting with overlandflow modeling for early warning of inundation. Nat. Hazards 2014, 70, 1763–1793. [Google Scholar] [CrossRef]
- Ballesteros, C.; Jiménez, J.A.; Viavattene, C. A multi-component flood risk assessment in the Maresme coast (NW Mediterranean). Nat. Hazards 2018, 90, 265–292. [Google Scholar] [CrossRef]
- Shahid, S.; Behrawan, H. Drought risk assessment in the western part of Bangladesh. Nat. Hazards 2008, 46, 391–413. [Google Scholar] [CrossRef]
- Ruiter, M.C.D.; Ward, P.J.; Daniell, J.E.; Aerts, J.C. A comparison of flood and earthquake vulnerability assessment indicators. Nat. Hazards Earth Syst. Sci. 2017, 17, 1231–1251. [Google Scholar] [CrossRef]
- Sayers, P.; Penning-Rowsell, E.C.; Horritt, M. Flood vulnerability, risk, and social disadvantage: Current and future patterns in the UK. Reg. Environ. Chang. 2018, 18, 339–352. [Google Scholar] [CrossRef]
- Wang, Y.; Li, Z.; Tang, Z.; Zeng, G. A GIS-based spatial multi-criteria approach for flood risk assessment in the Dongting Lake Region, Hunan, Central China. Water Resour. Manag. 2011, 25, 3465–3484. [Google Scholar] [CrossRef]
- Gordon, D.J.; Johnson, C.A. The orchestration of global urban climate governance: Conducting power in the post-Paris climate regime. Environ. Politics 2017, 26, 694–714. [Google Scholar] [CrossRef]


| Number | Name |
|---|---|
| 1 | Datong Township |
| 2 | Nanao Township |
| 3 | Suao Township |
| 4 | Dongshan Township |
| 5 | Sanxing Township |
| 6 | Yuanshan Township |
| 7 | Jiaoxi Township |
| 8 | Yilan City |
| 9 | Luodong Township |
| 10 | Wujie Township |
| 11 | Zhuangwei Township |
| 12 | Toucheng Township |
| Description | |
|---|---|
| 1. Historical Typhoon Event Data |
|
| 2. Geographical Data |
|
| 3. Drainage System |
|
| 4. Hydraulic Infrastructure |
|
| 5. Flood Model |
|
| 6. Calibration and Verification |
|
| 7. Precipitation Data |
|
| 8. Scenarios |
|
| Target | Components | Categories | Factors | Data Source | Geographic Unit | Specific Year |
|---|---|---|---|---|---|---|
| Risk | Hazard | Climatic Factor | Extreme rainfall | Central Weather Bureau, Water Resources Agency | Point data (station) | 1985–2014 |
| Non-Climatic Factor | River flow | Water Resources Agency | Grid | 2008–2015 | ||
| Water level | Water Resources Agency | Grid | 2008–2015 | |||
| Tidal level | Water Resources Agency | Grid | 2008–2015 | |||
| Elevation | Government open data platform | Grid | 2011–2012 | |||
| Slope | Government open data platform | Grid | 2011–2012 | |||
| River length | Water Resources Agency | Grid | 2015 | |||
| Bank height | Water Resources Agency | Grid | 2015 | |||
| Drainage | Water Resources Agency | Grid | 2015 | |||
| Hydraulic structures | Water Resources Agency | Grid | 2015 | |||
| Rainwater channels | Water Resources Agency | Grid | 2015 | |||
| Land use | National Land Surveying and Mapping Center | Grid | 2015 | |||
| Catchment area | Central Geological Survey | Grid | 2015 | |||
| Vulnerability | Adaptation Capacity | Reservoir operation | Water Resources Agency | Grid | 2015 | |
| River bank height | Water Resources Agency | Grid | 2015 | |||
| Hydraulic structures | Water Resources Agency | Grid | 2015 | |||
| Rainwater sewer | Water Resources Agency | Grid | 2015 | |||
| Sensitivity | Age | Dept. of Household Registration | Administrative district | 2018 | ||
| Gender | Dept. of Household Registration | Administrative district | 2018 | |||
| Exposure | Population density | Dept. of Household Registration | Administrative district | 2018 |
© 2019 by the authors. Licensee MDPI, Basel, Switzerland. This article is an open access article distributed under the terms and conditions of the Creative Commons Attribution (CC BY) license (http://creativecommons.org/licenses/by/4.0/).
Share and Cite
Tung, C.-P.; Tsao, J.-H.; Tien, Y.-C.; Lin, C.-Y.; Jhong, B.-C. Development of a Novel Climate Adaptation Algorithm for Climate Risk Assessment. Water 2019, 11, 497. https://doi.org/10.3390/w11030497
Tung C-P, Tsao J-H, Tien Y-C, Lin C-Y, Jhong B-C. Development of a Novel Climate Adaptation Algorithm for Climate Risk Assessment. Water. 2019; 11(3):497. https://doi.org/10.3390/w11030497
Chicago/Turabian StyleTung, Ching-Pin, Jung-Hsuan Tsao, Yu-Chuan Tien, Chung-Yi Lin, and Bing-Chen Jhong. 2019. "Development of a Novel Climate Adaptation Algorithm for Climate Risk Assessment" Water 11, no. 3: 497. https://doi.org/10.3390/w11030497
APA StyleTung, C.-P., Tsao, J.-H., Tien, Y.-C., Lin, C.-Y., & Jhong, B.-C. (2019). Development of a Novel Climate Adaptation Algorithm for Climate Risk Assessment. Water, 11(3), 497. https://doi.org/10.3390/w11030497