Uncertainty in Estimated Trends Using Gridded Rainfall Data: A Case Study of Bangladesh


Abstract
1. Introduction
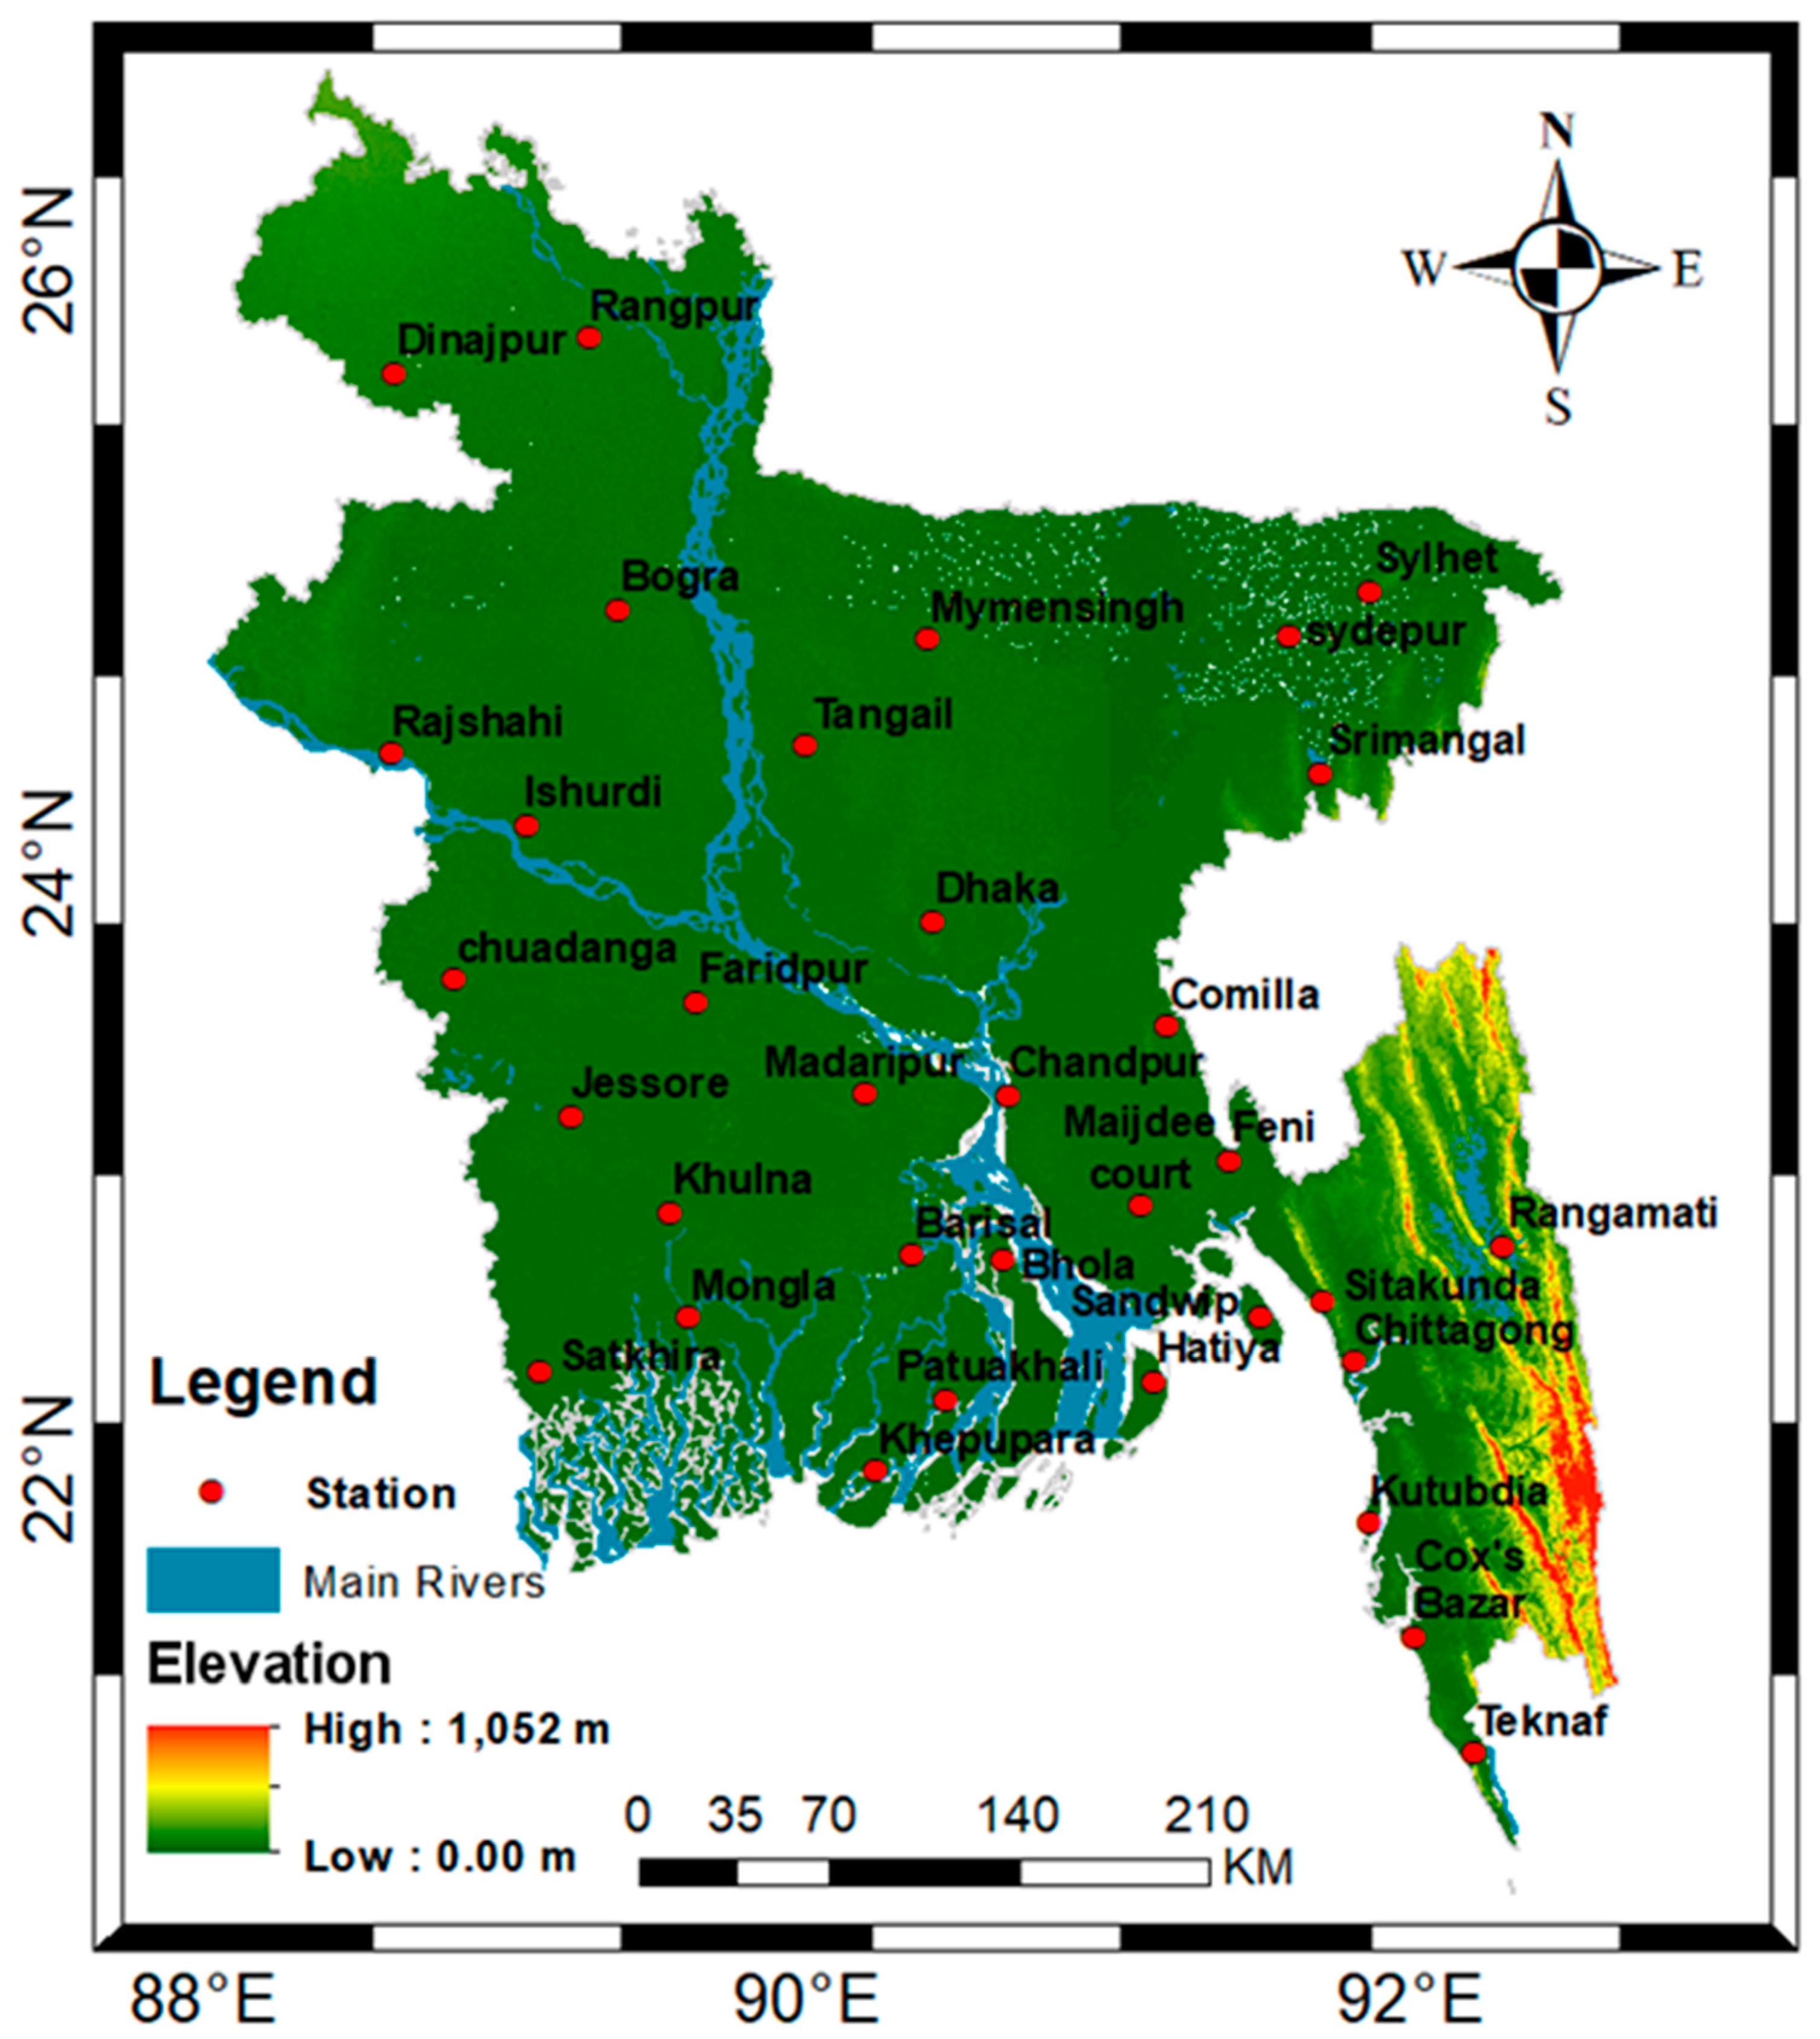
2. Climate of Bangladesh
3. Data and Sources
3.1. Observed Data
3.2. Gridded Datasets
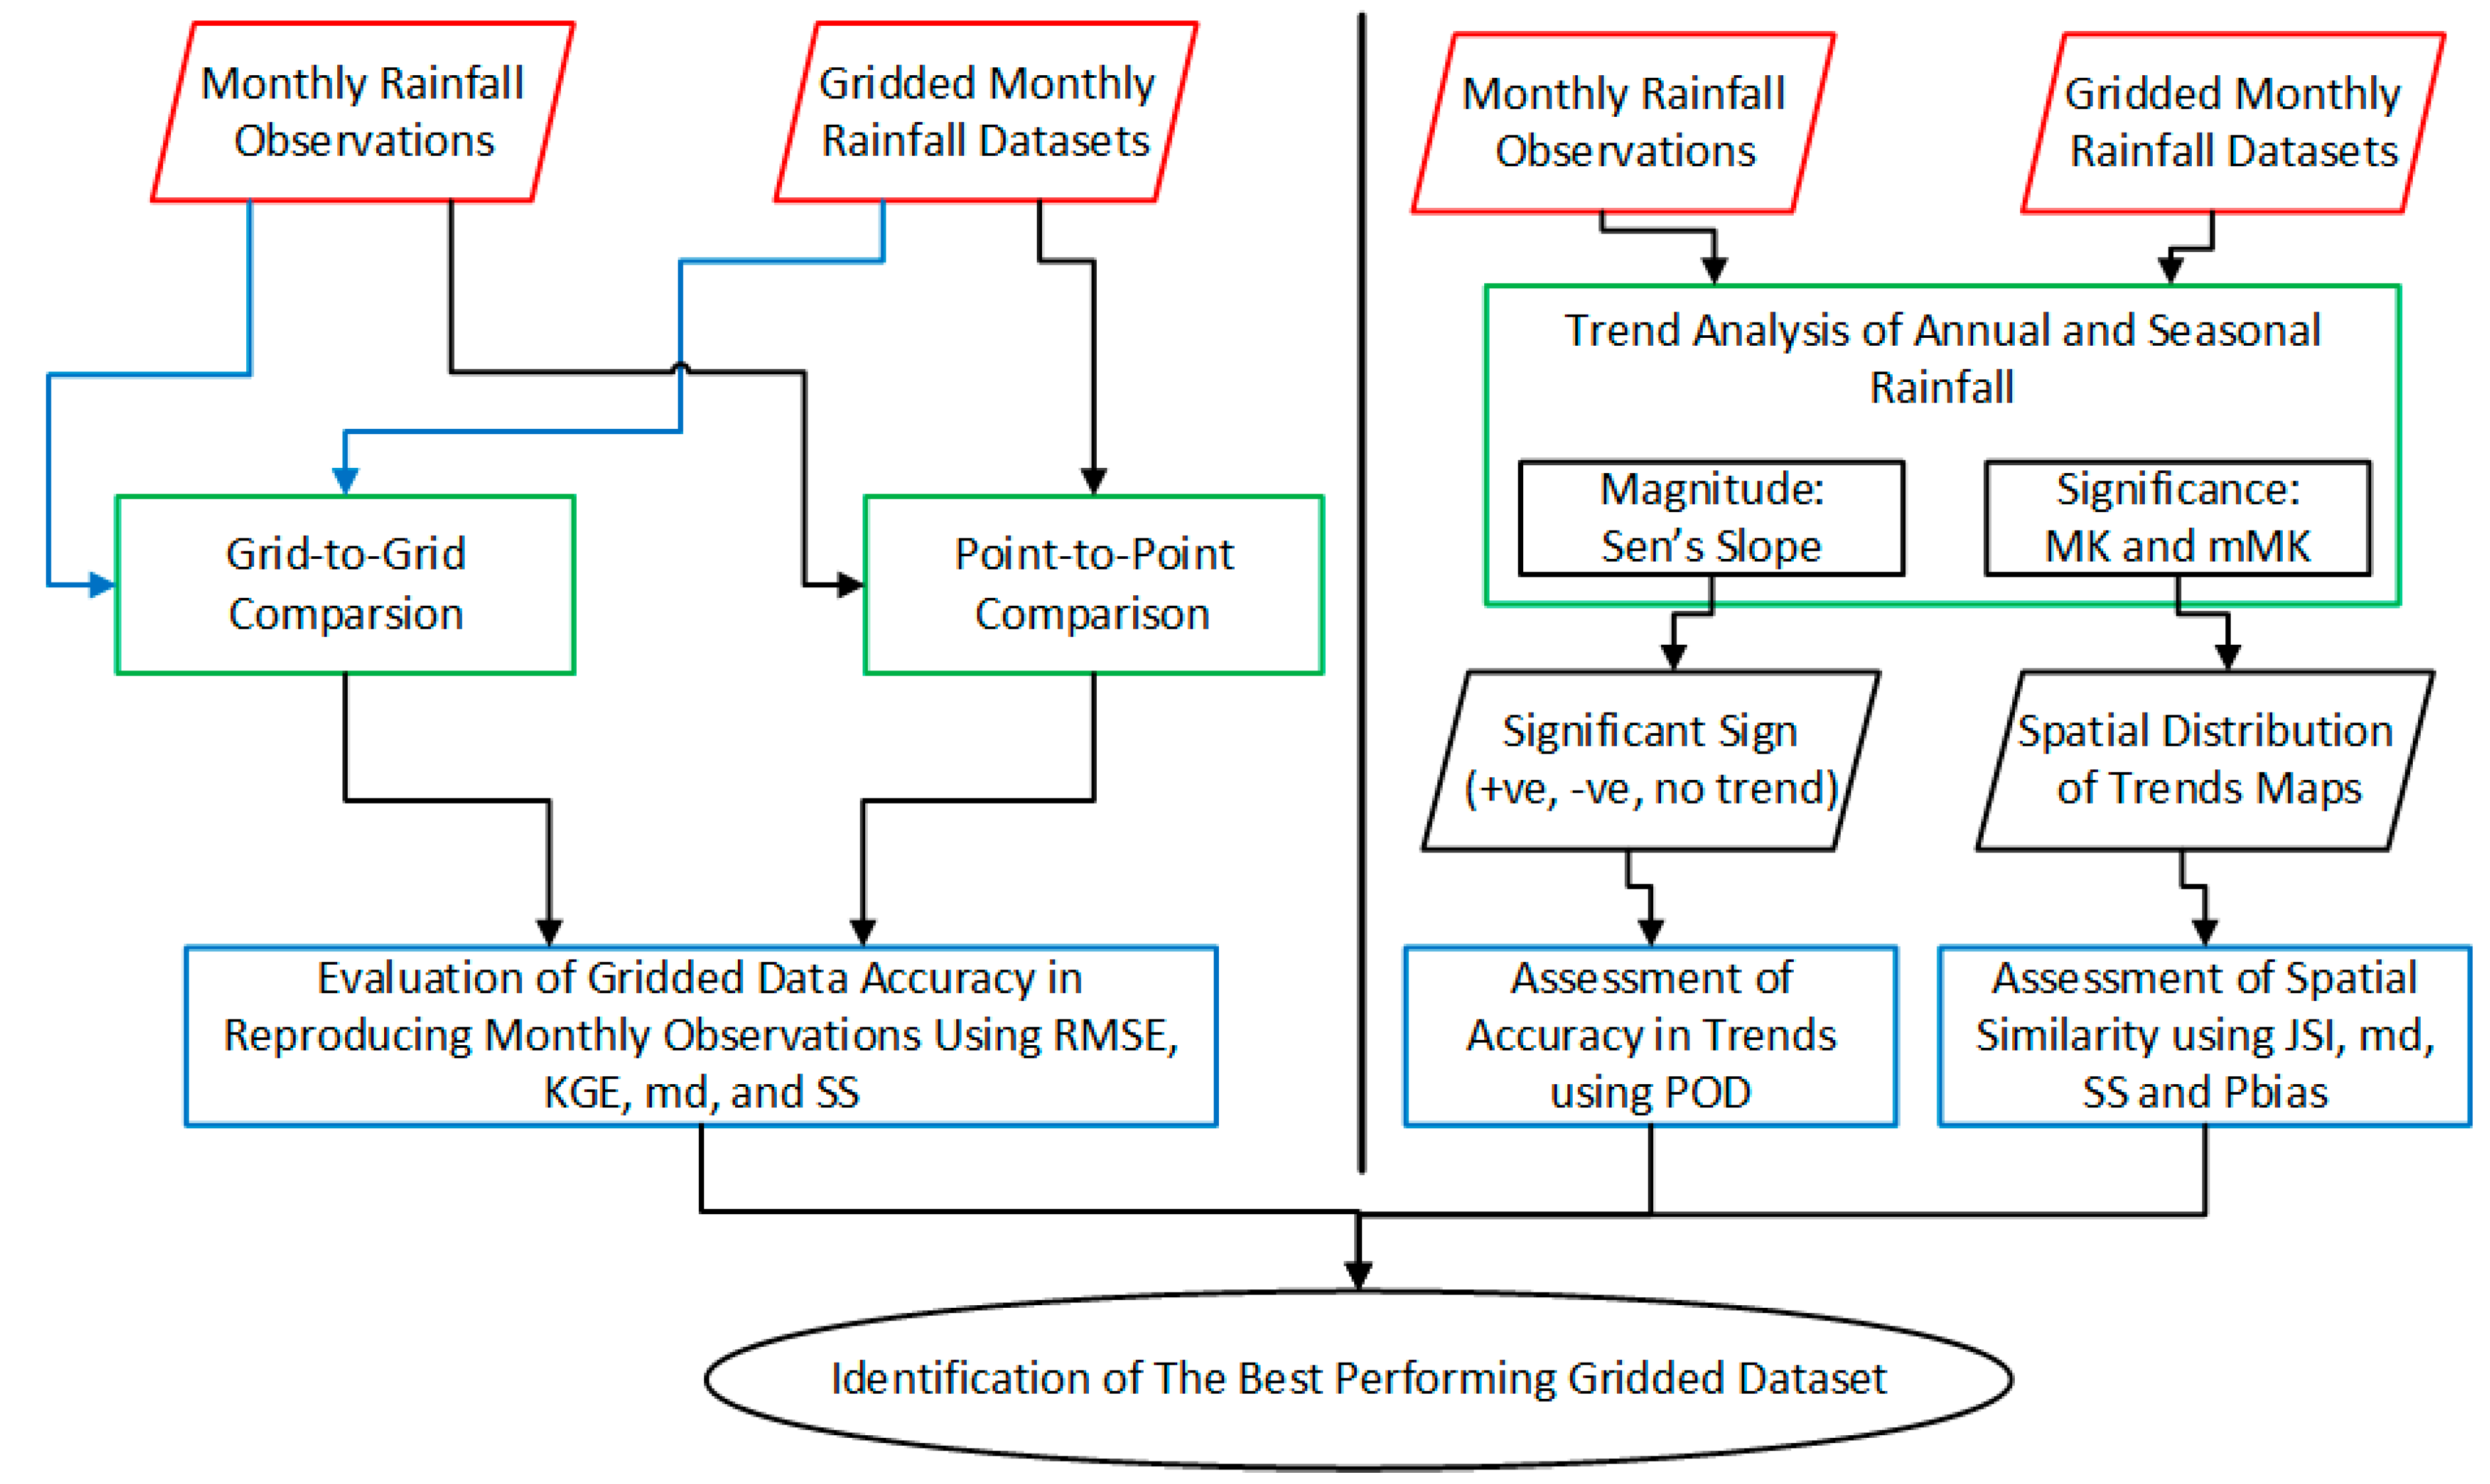
4. Methodology
4.1. Evaluation of Gridded Datasets
4.2. Trend Analysis
4.3. Assessment of Spatial Similarity
4.4. Assessment of Accuracy in Trends
5. Results
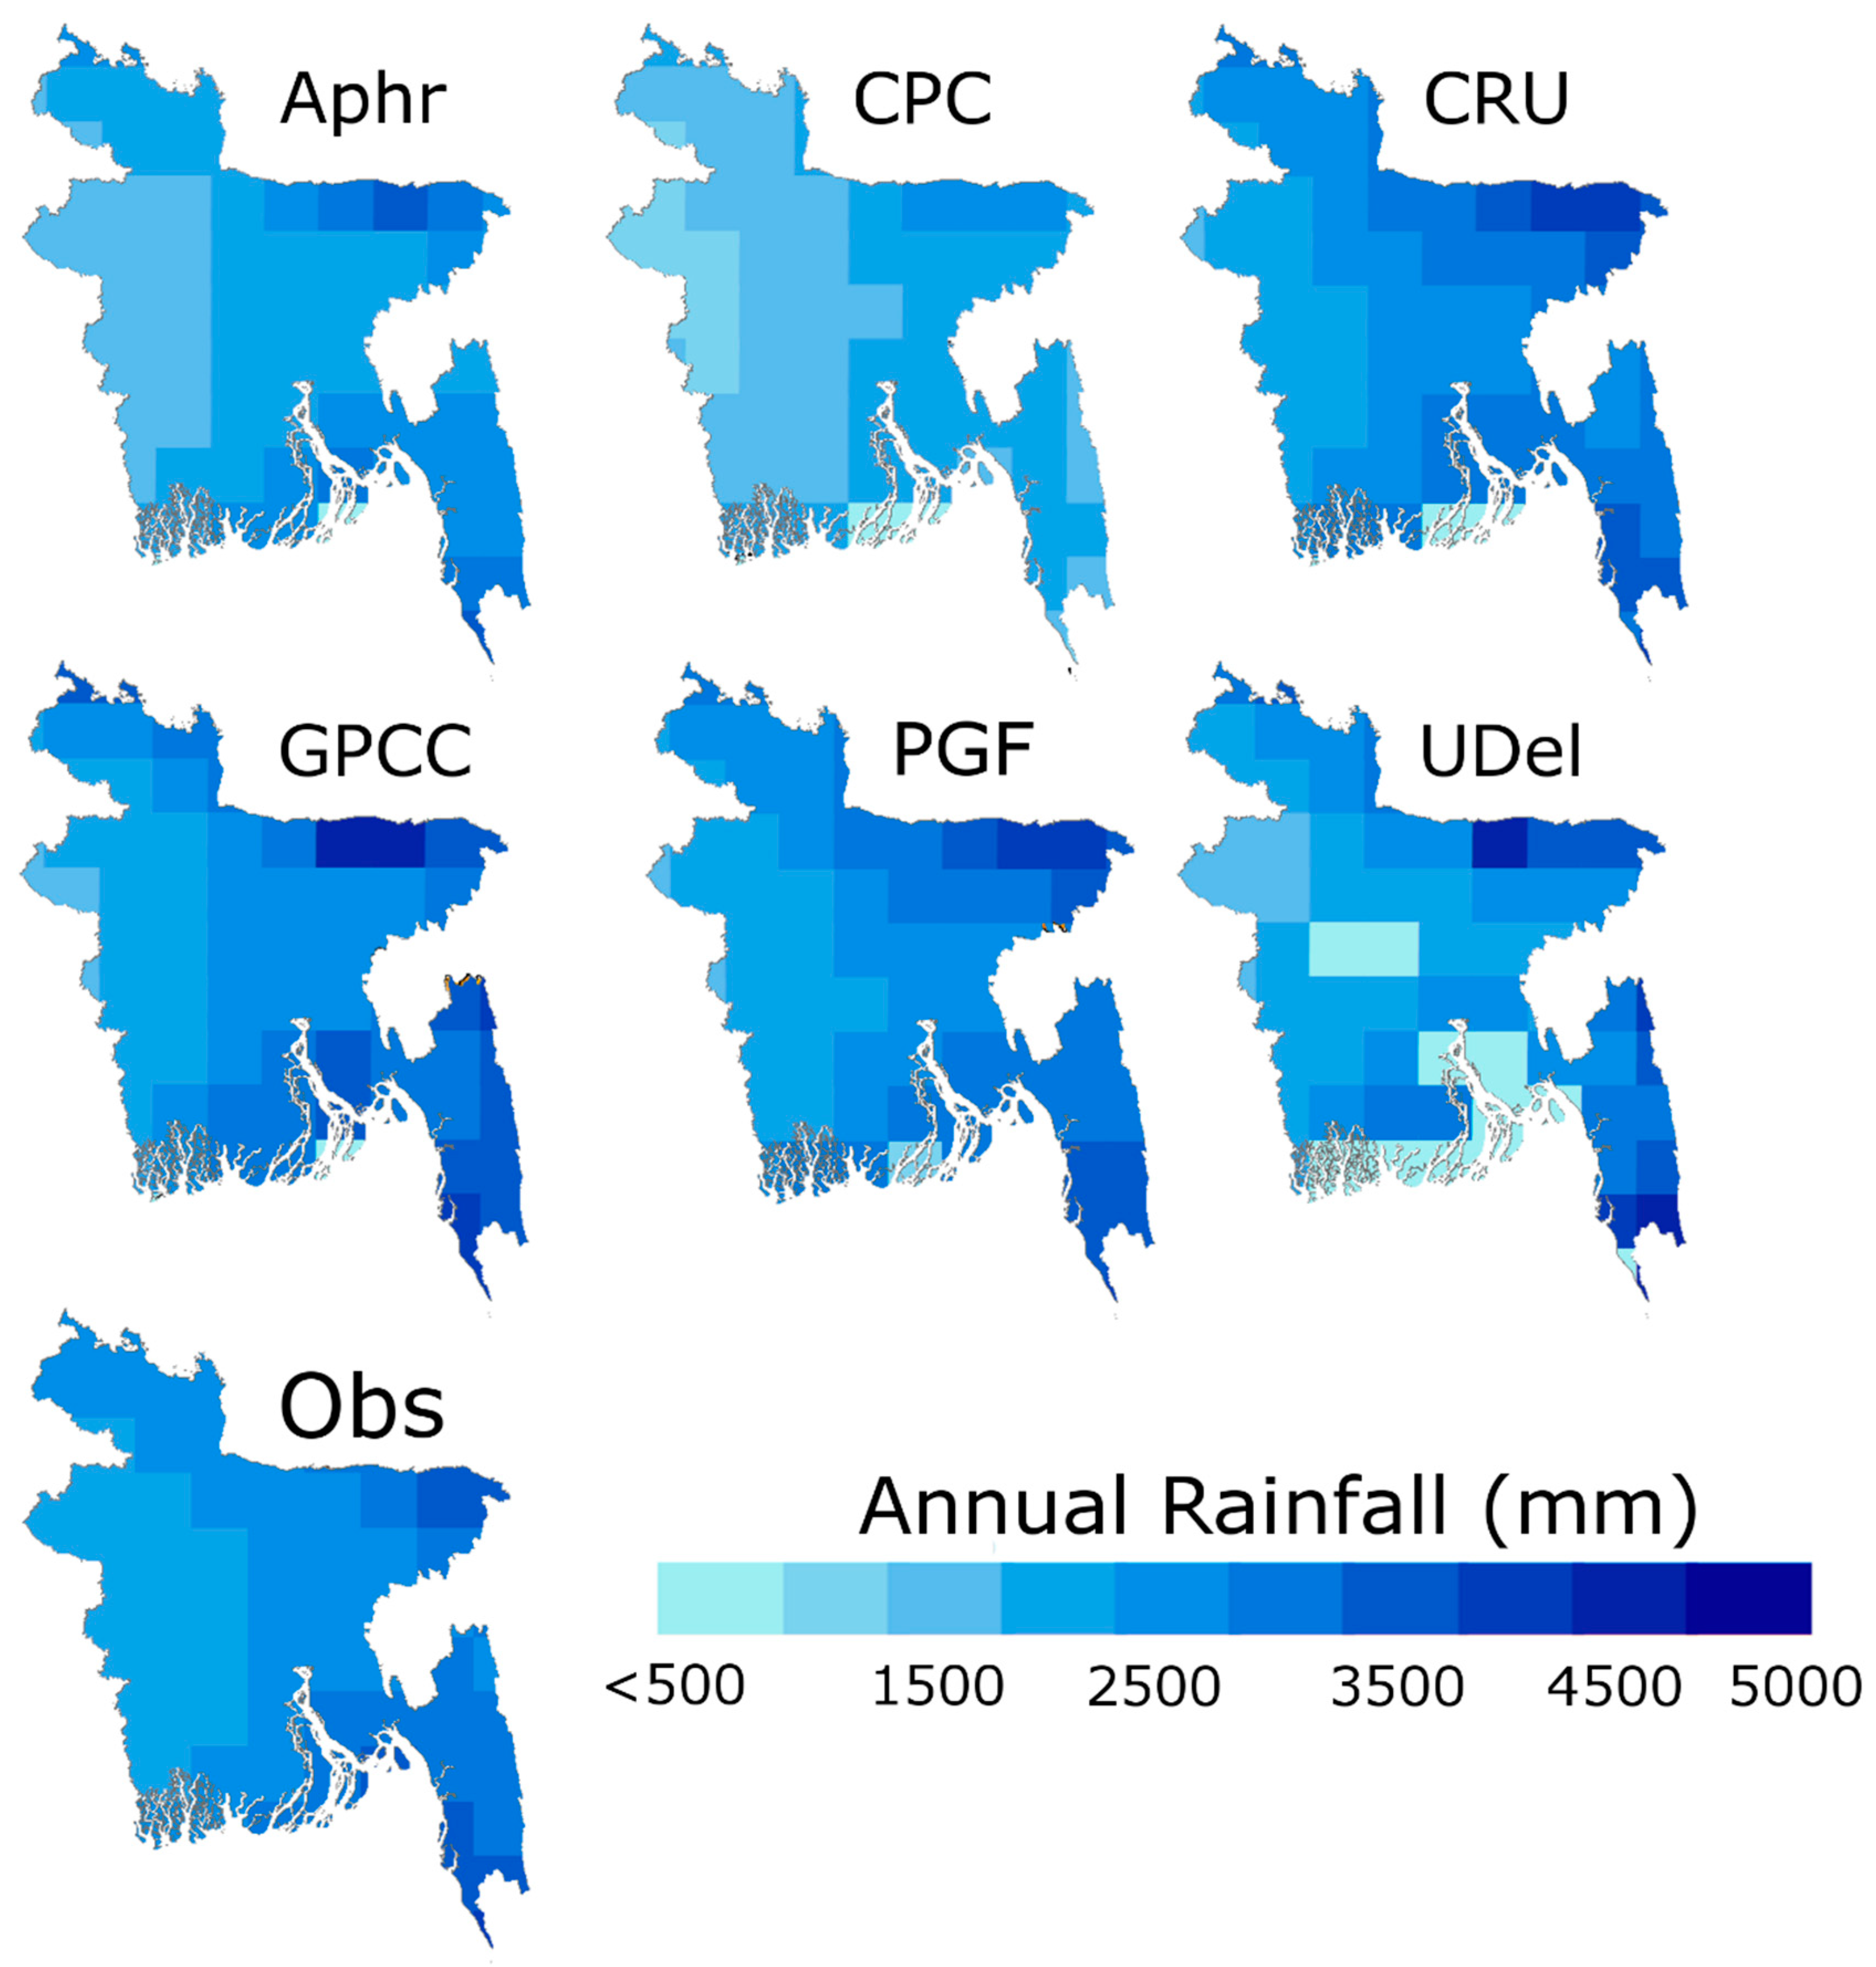
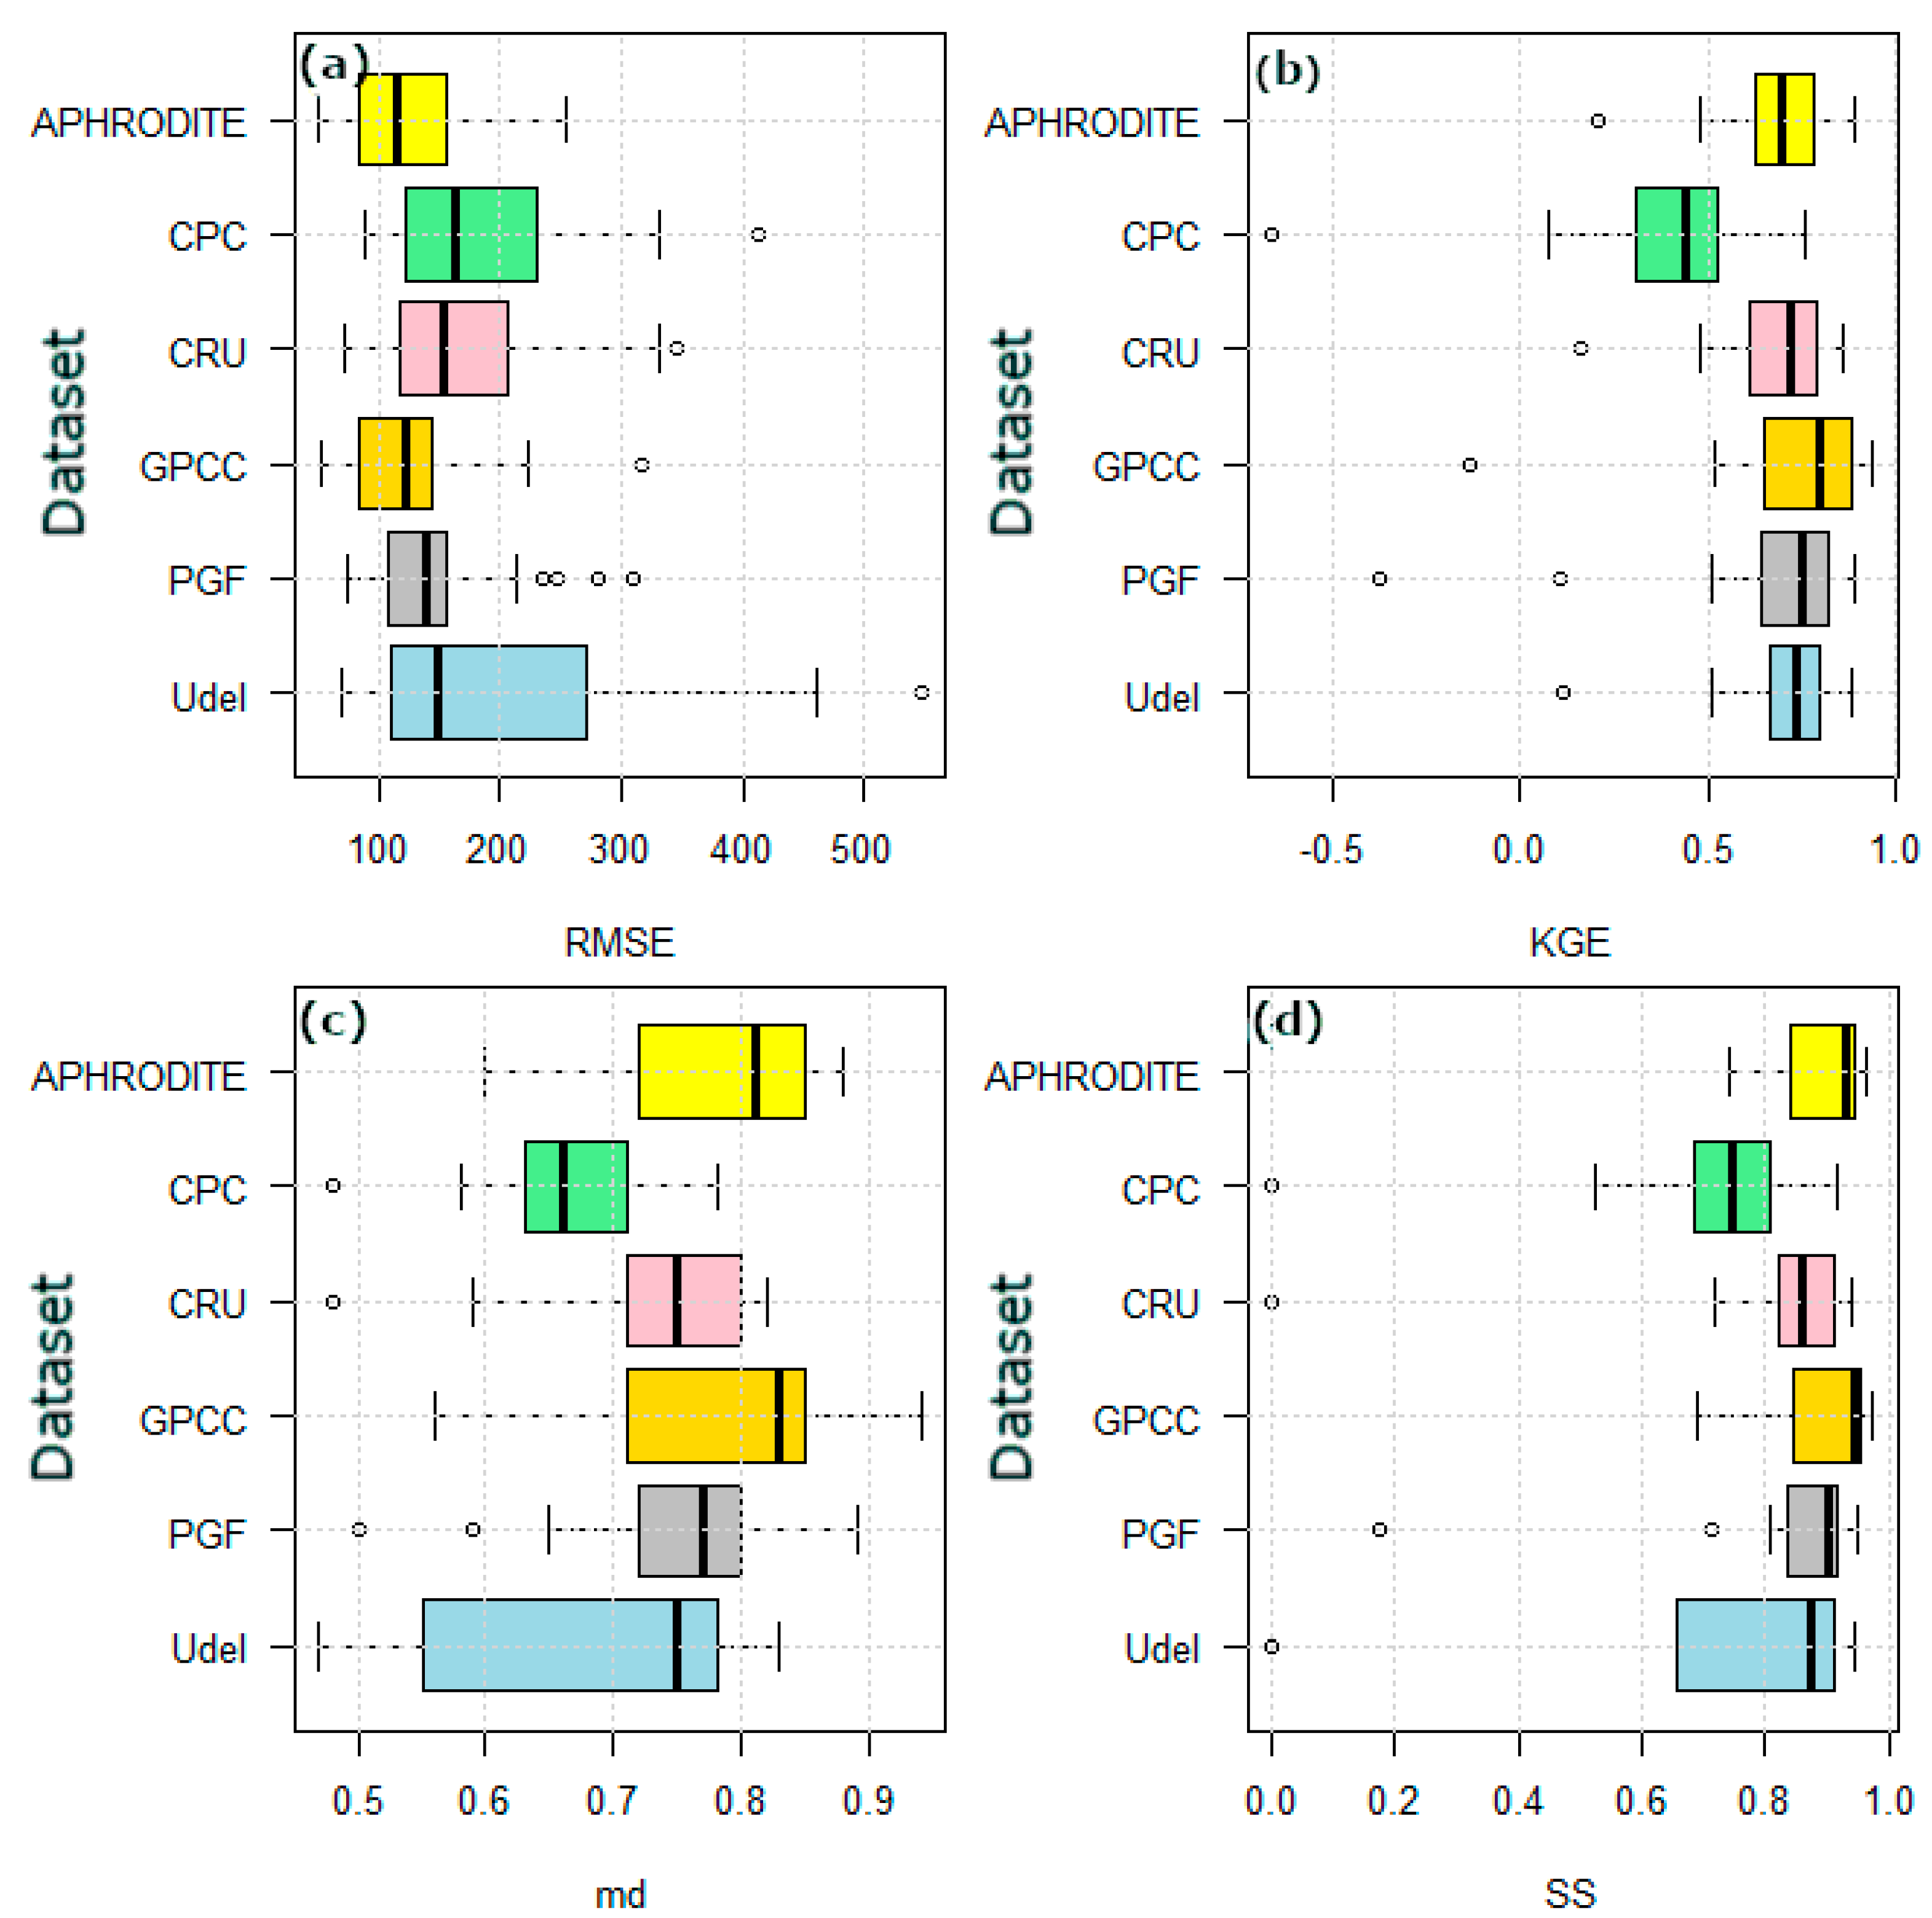
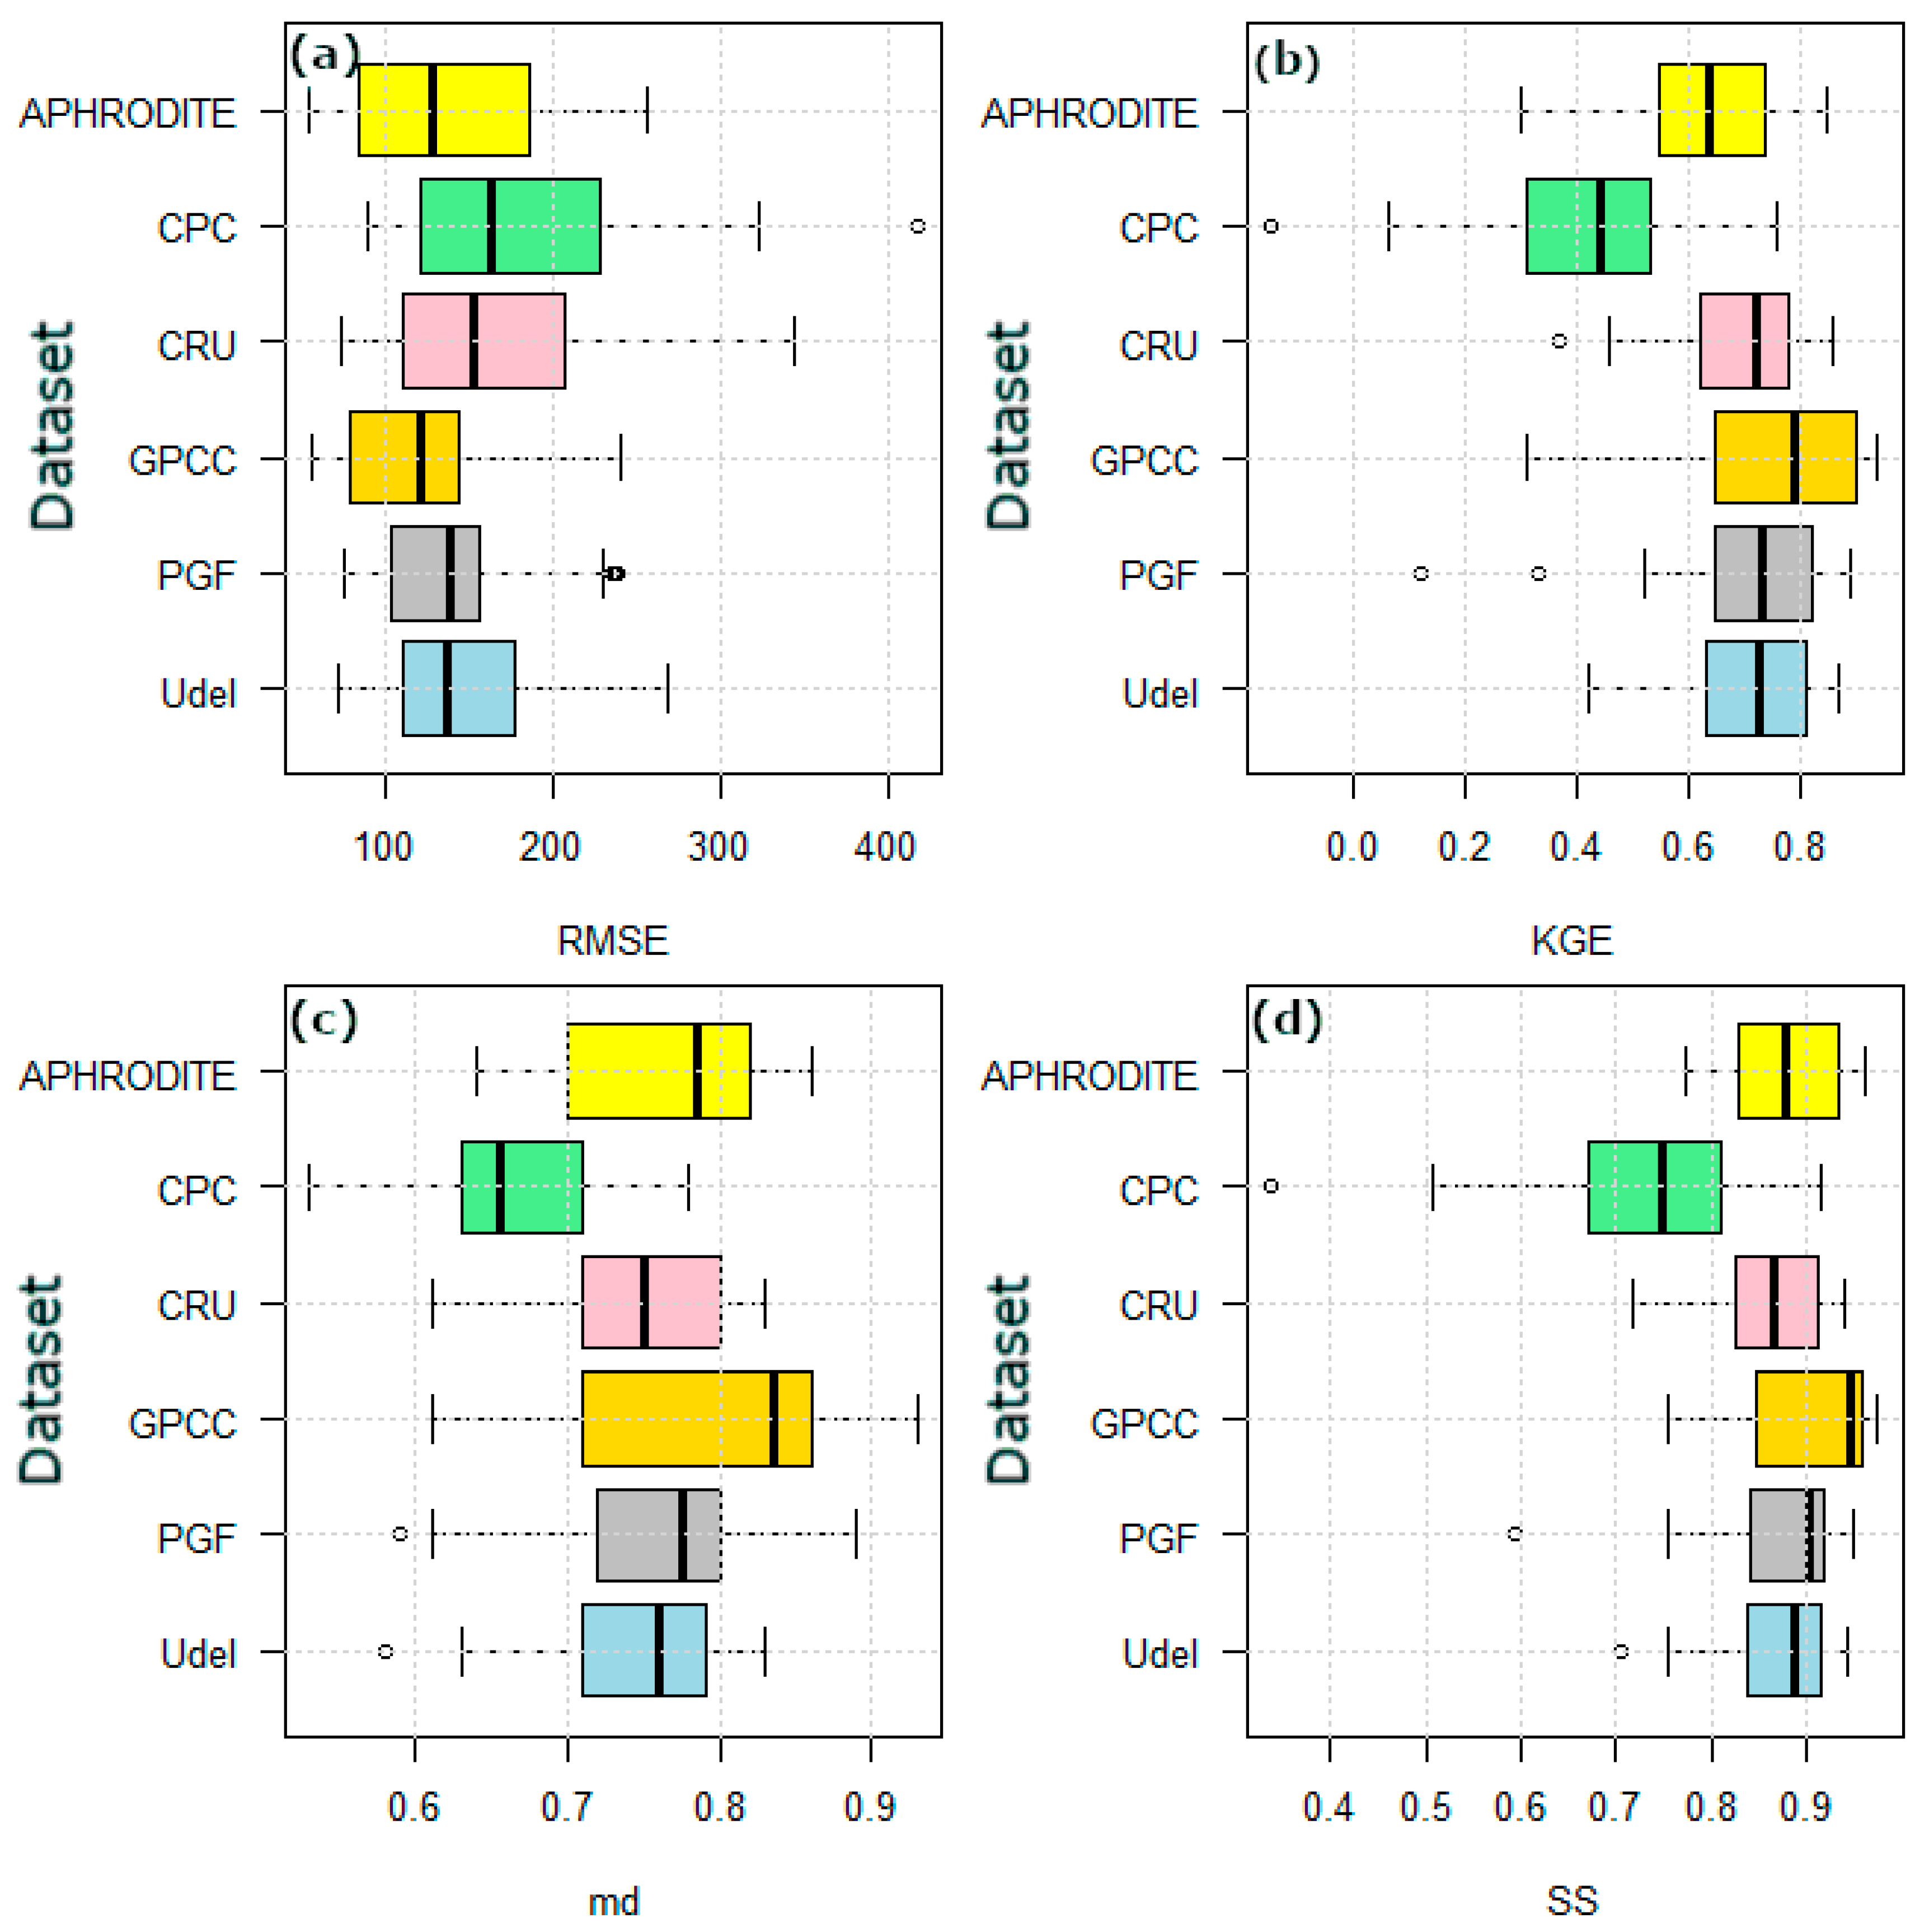
5.1. Evaluation of Gridded Datasets
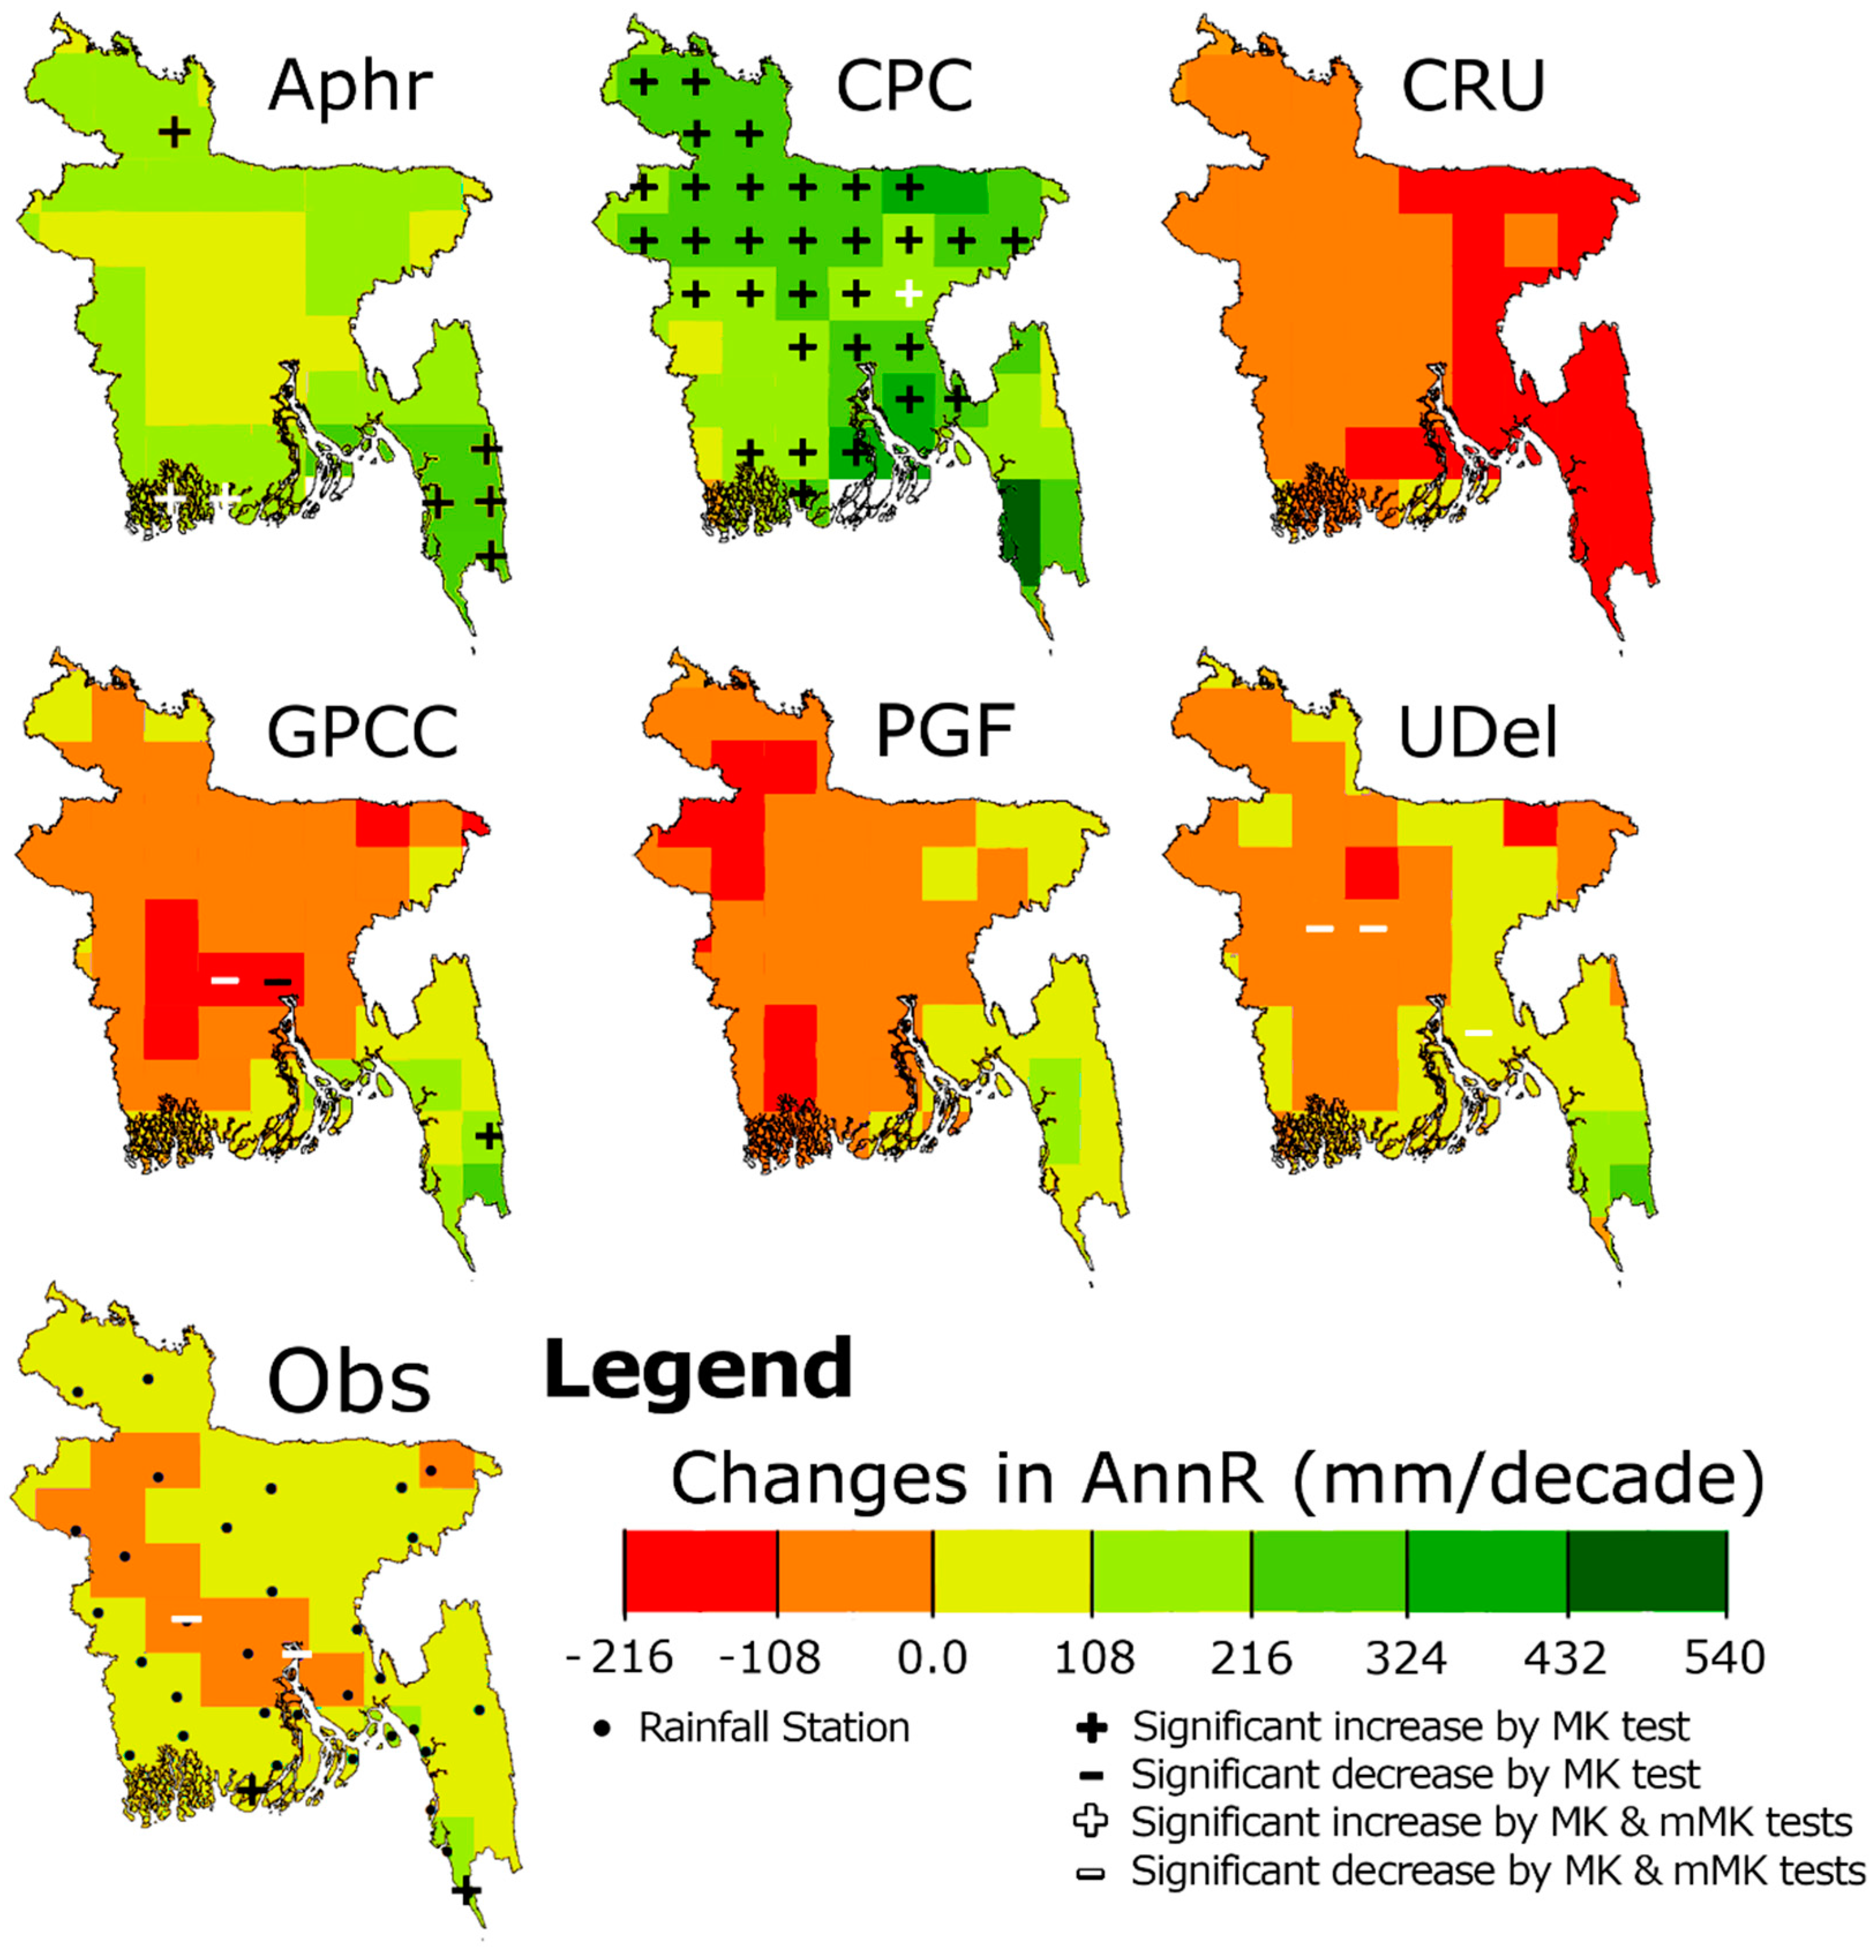
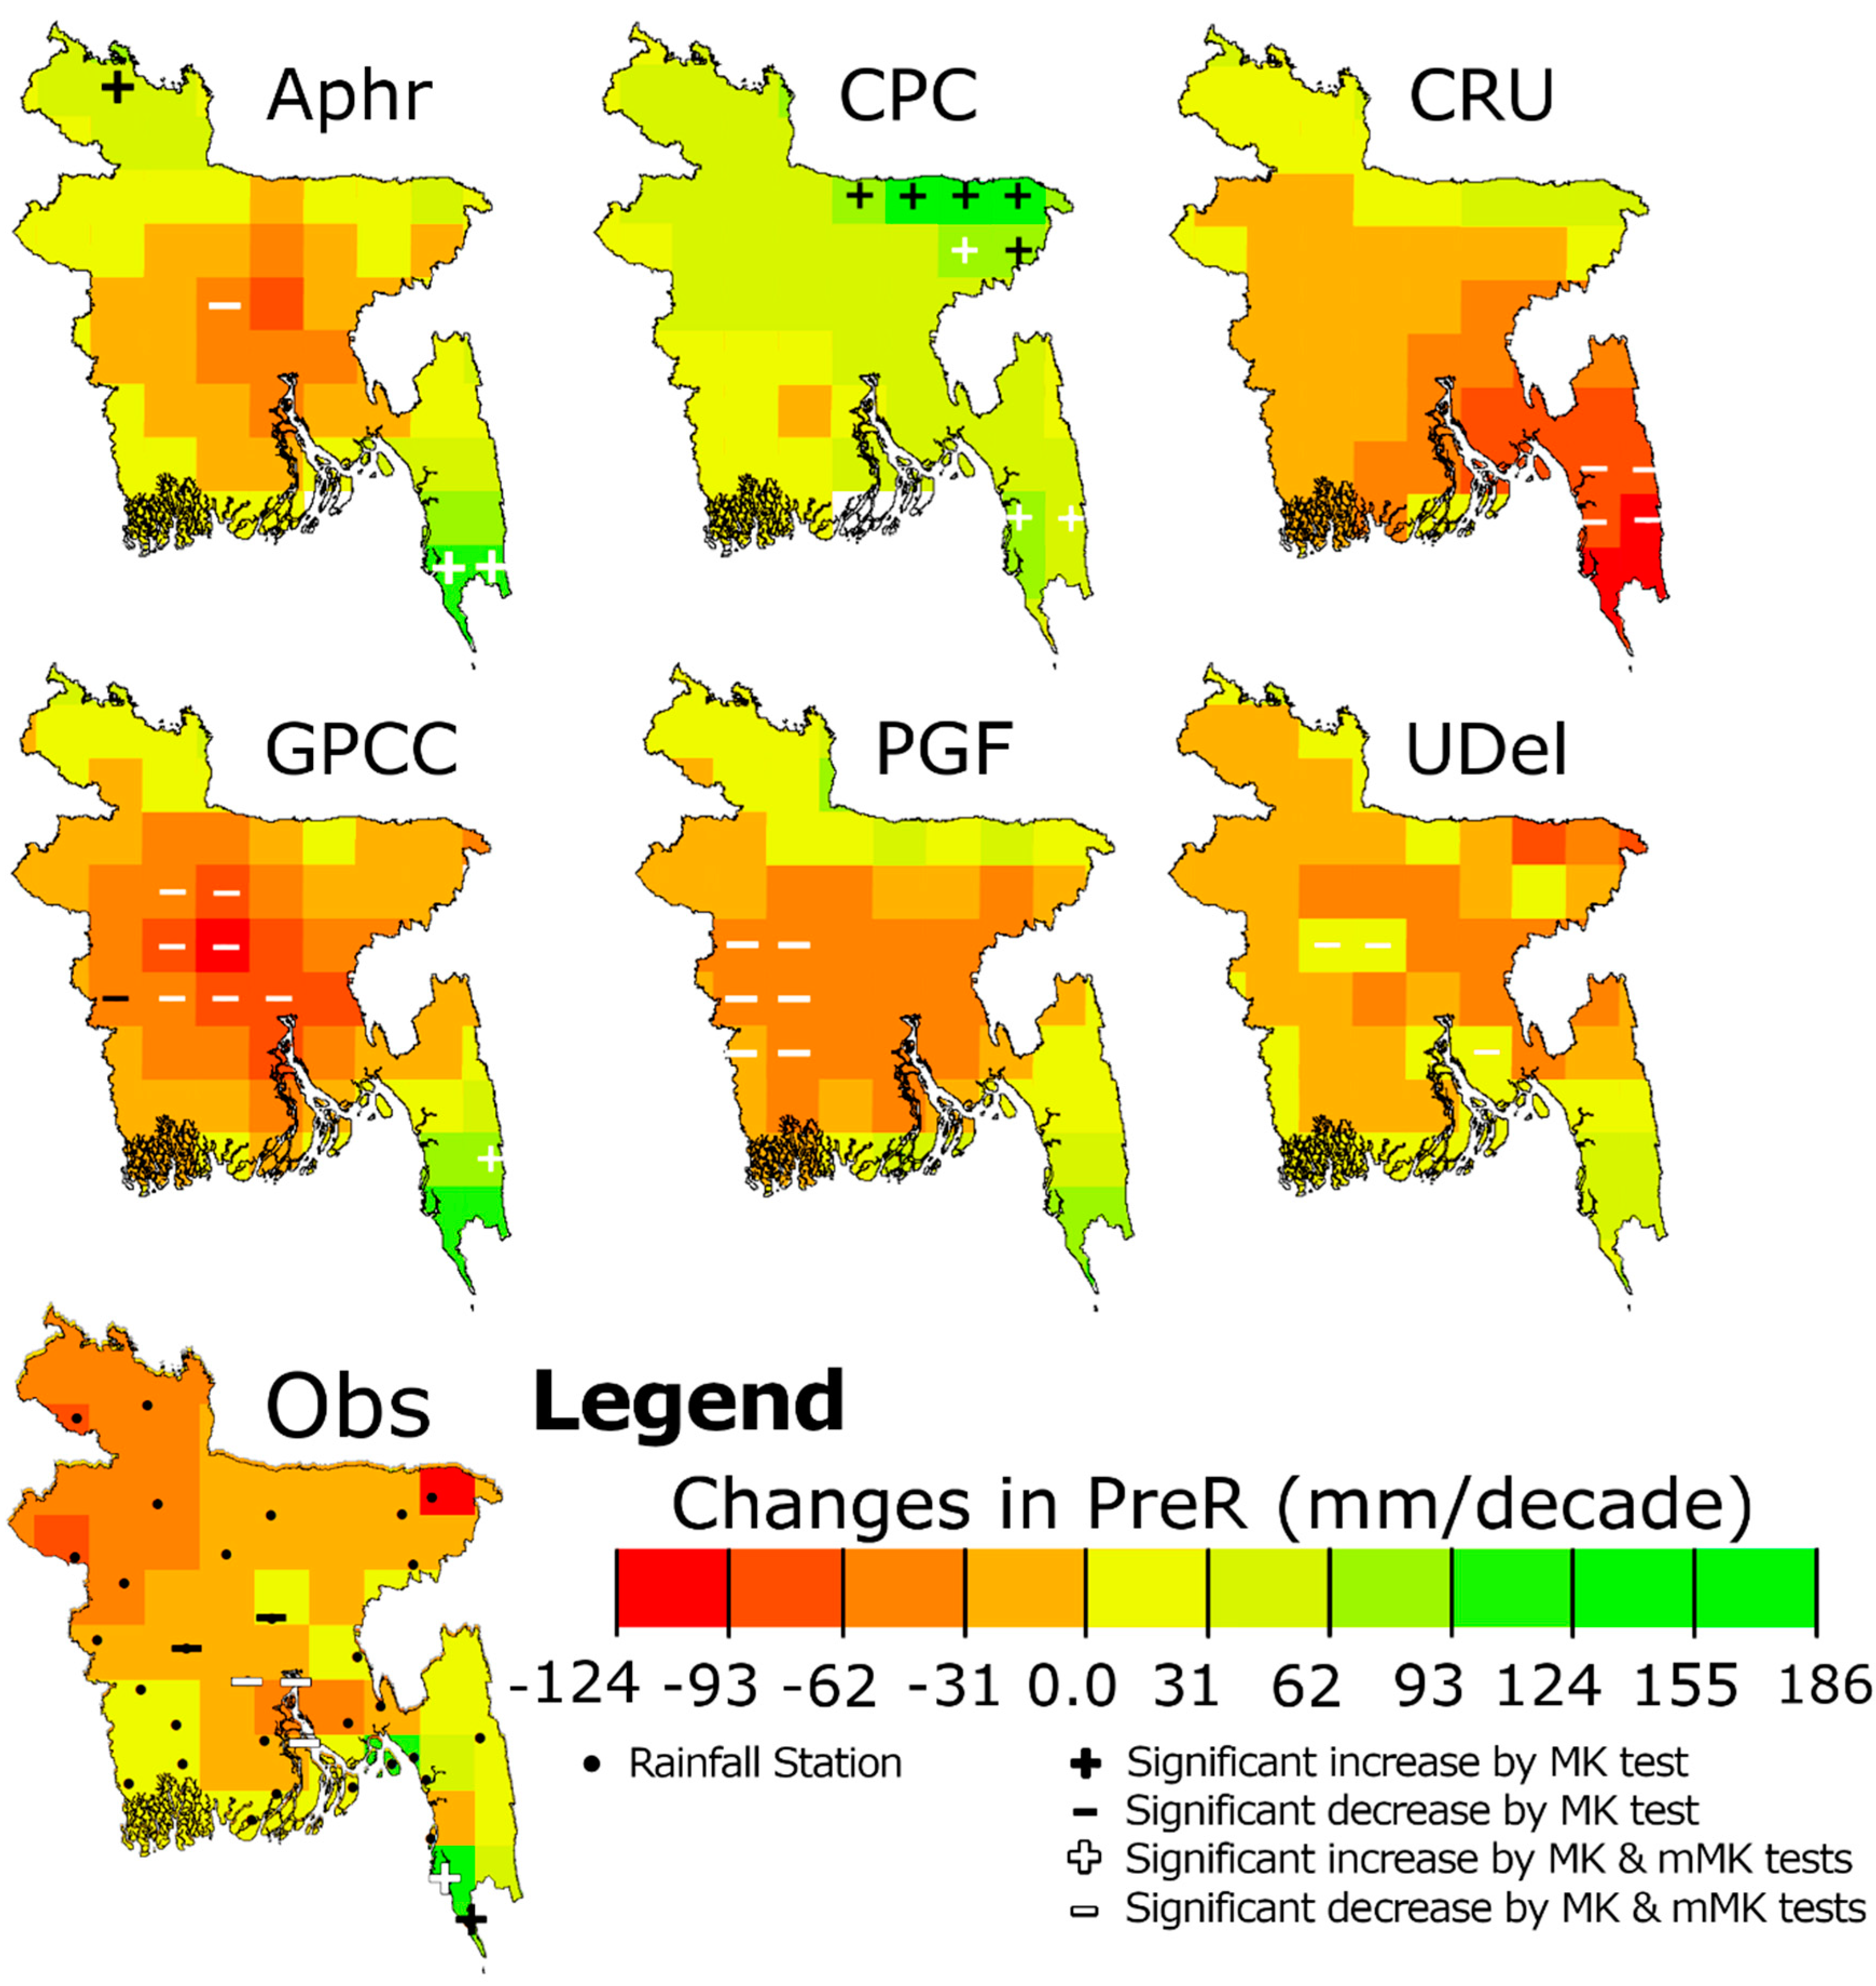
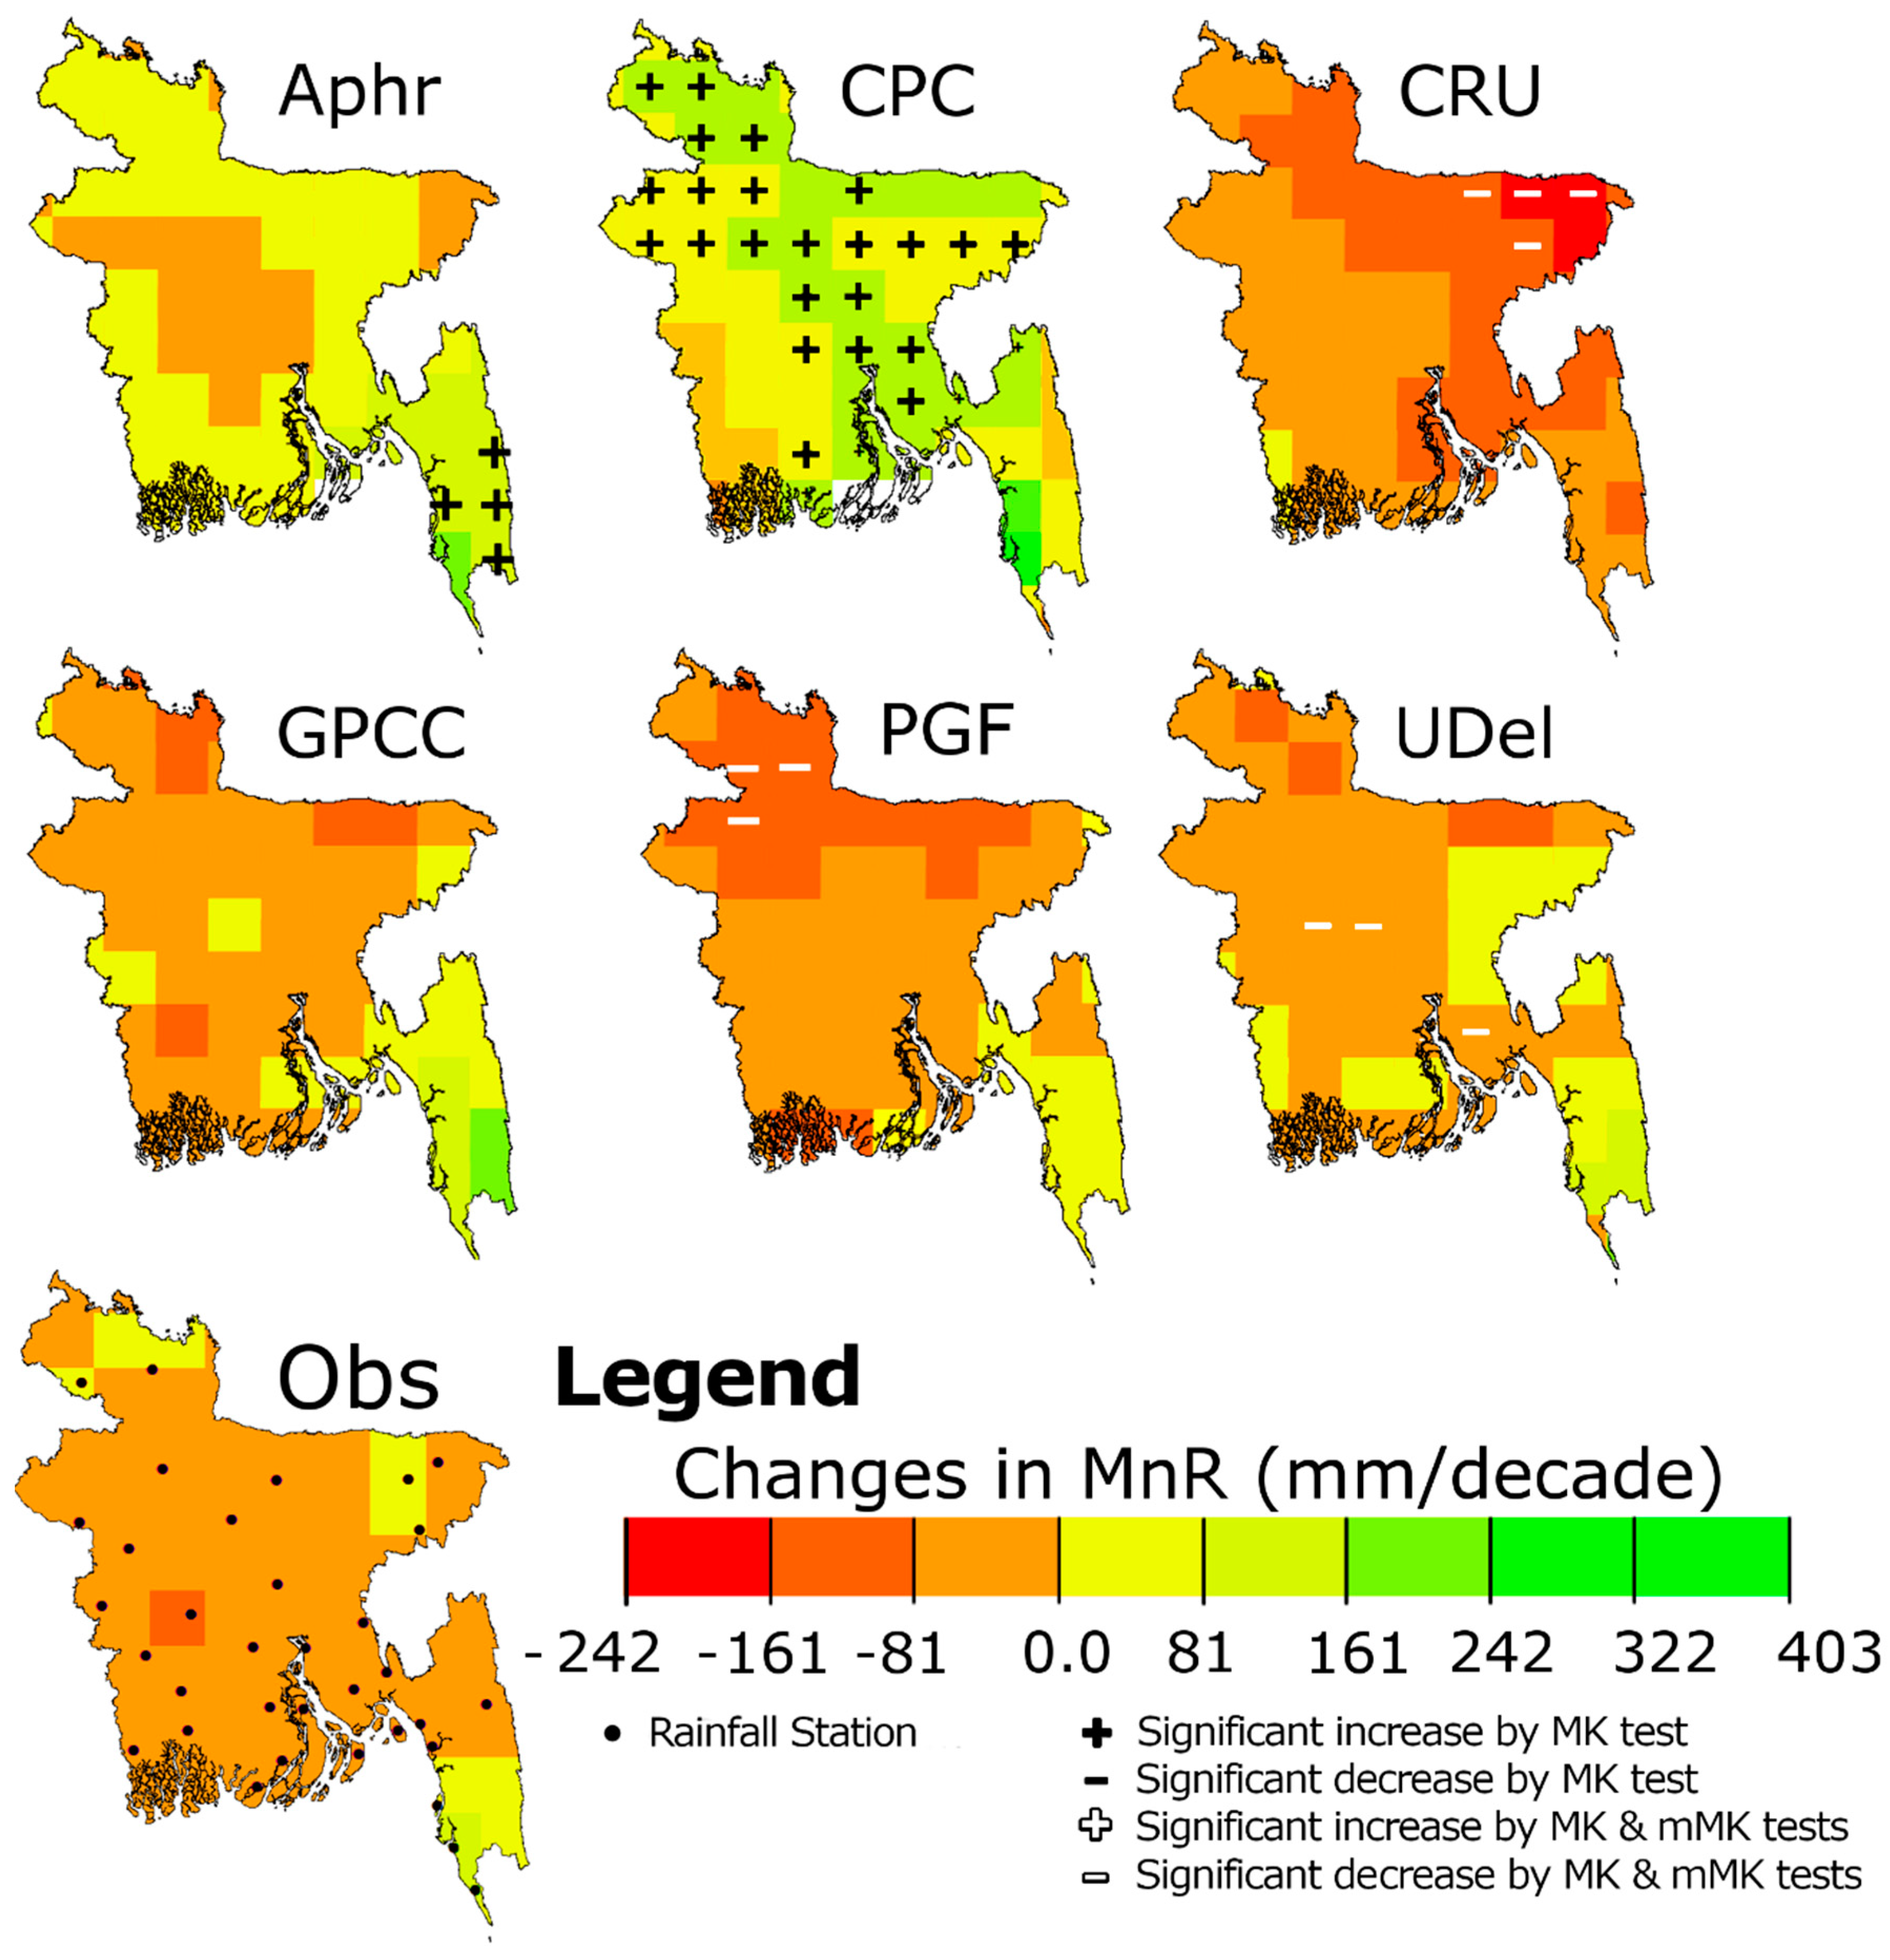
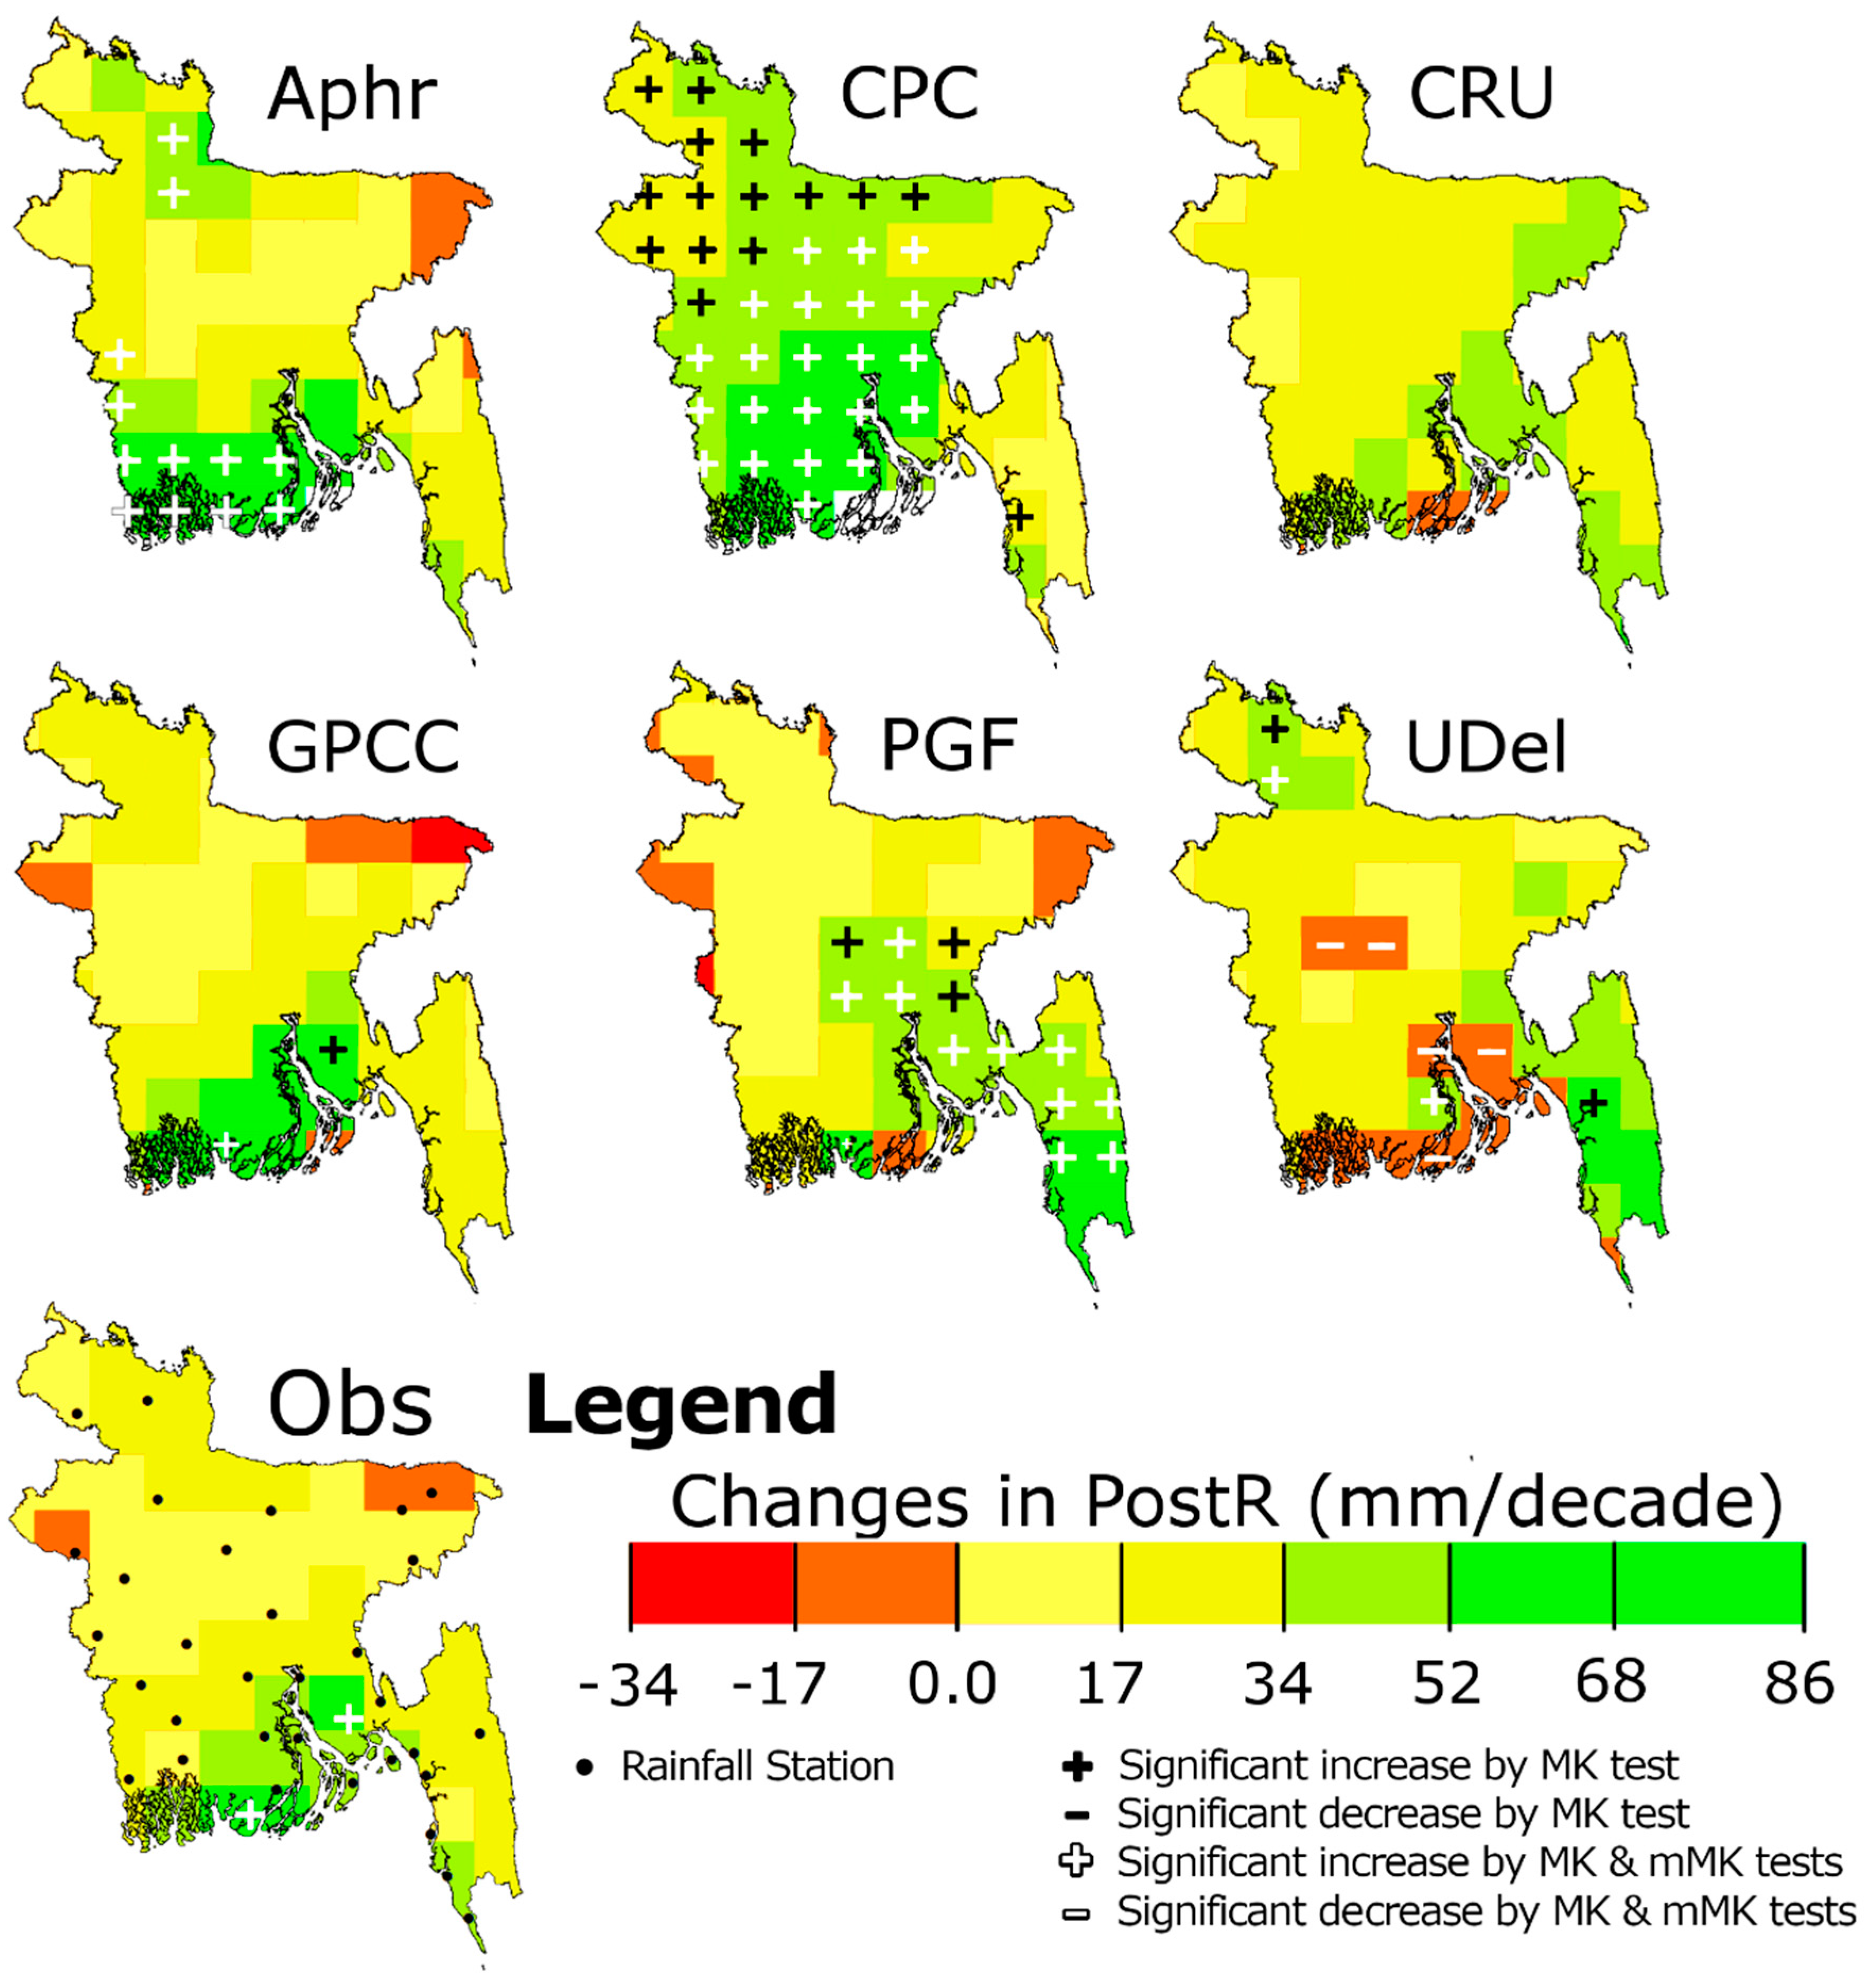
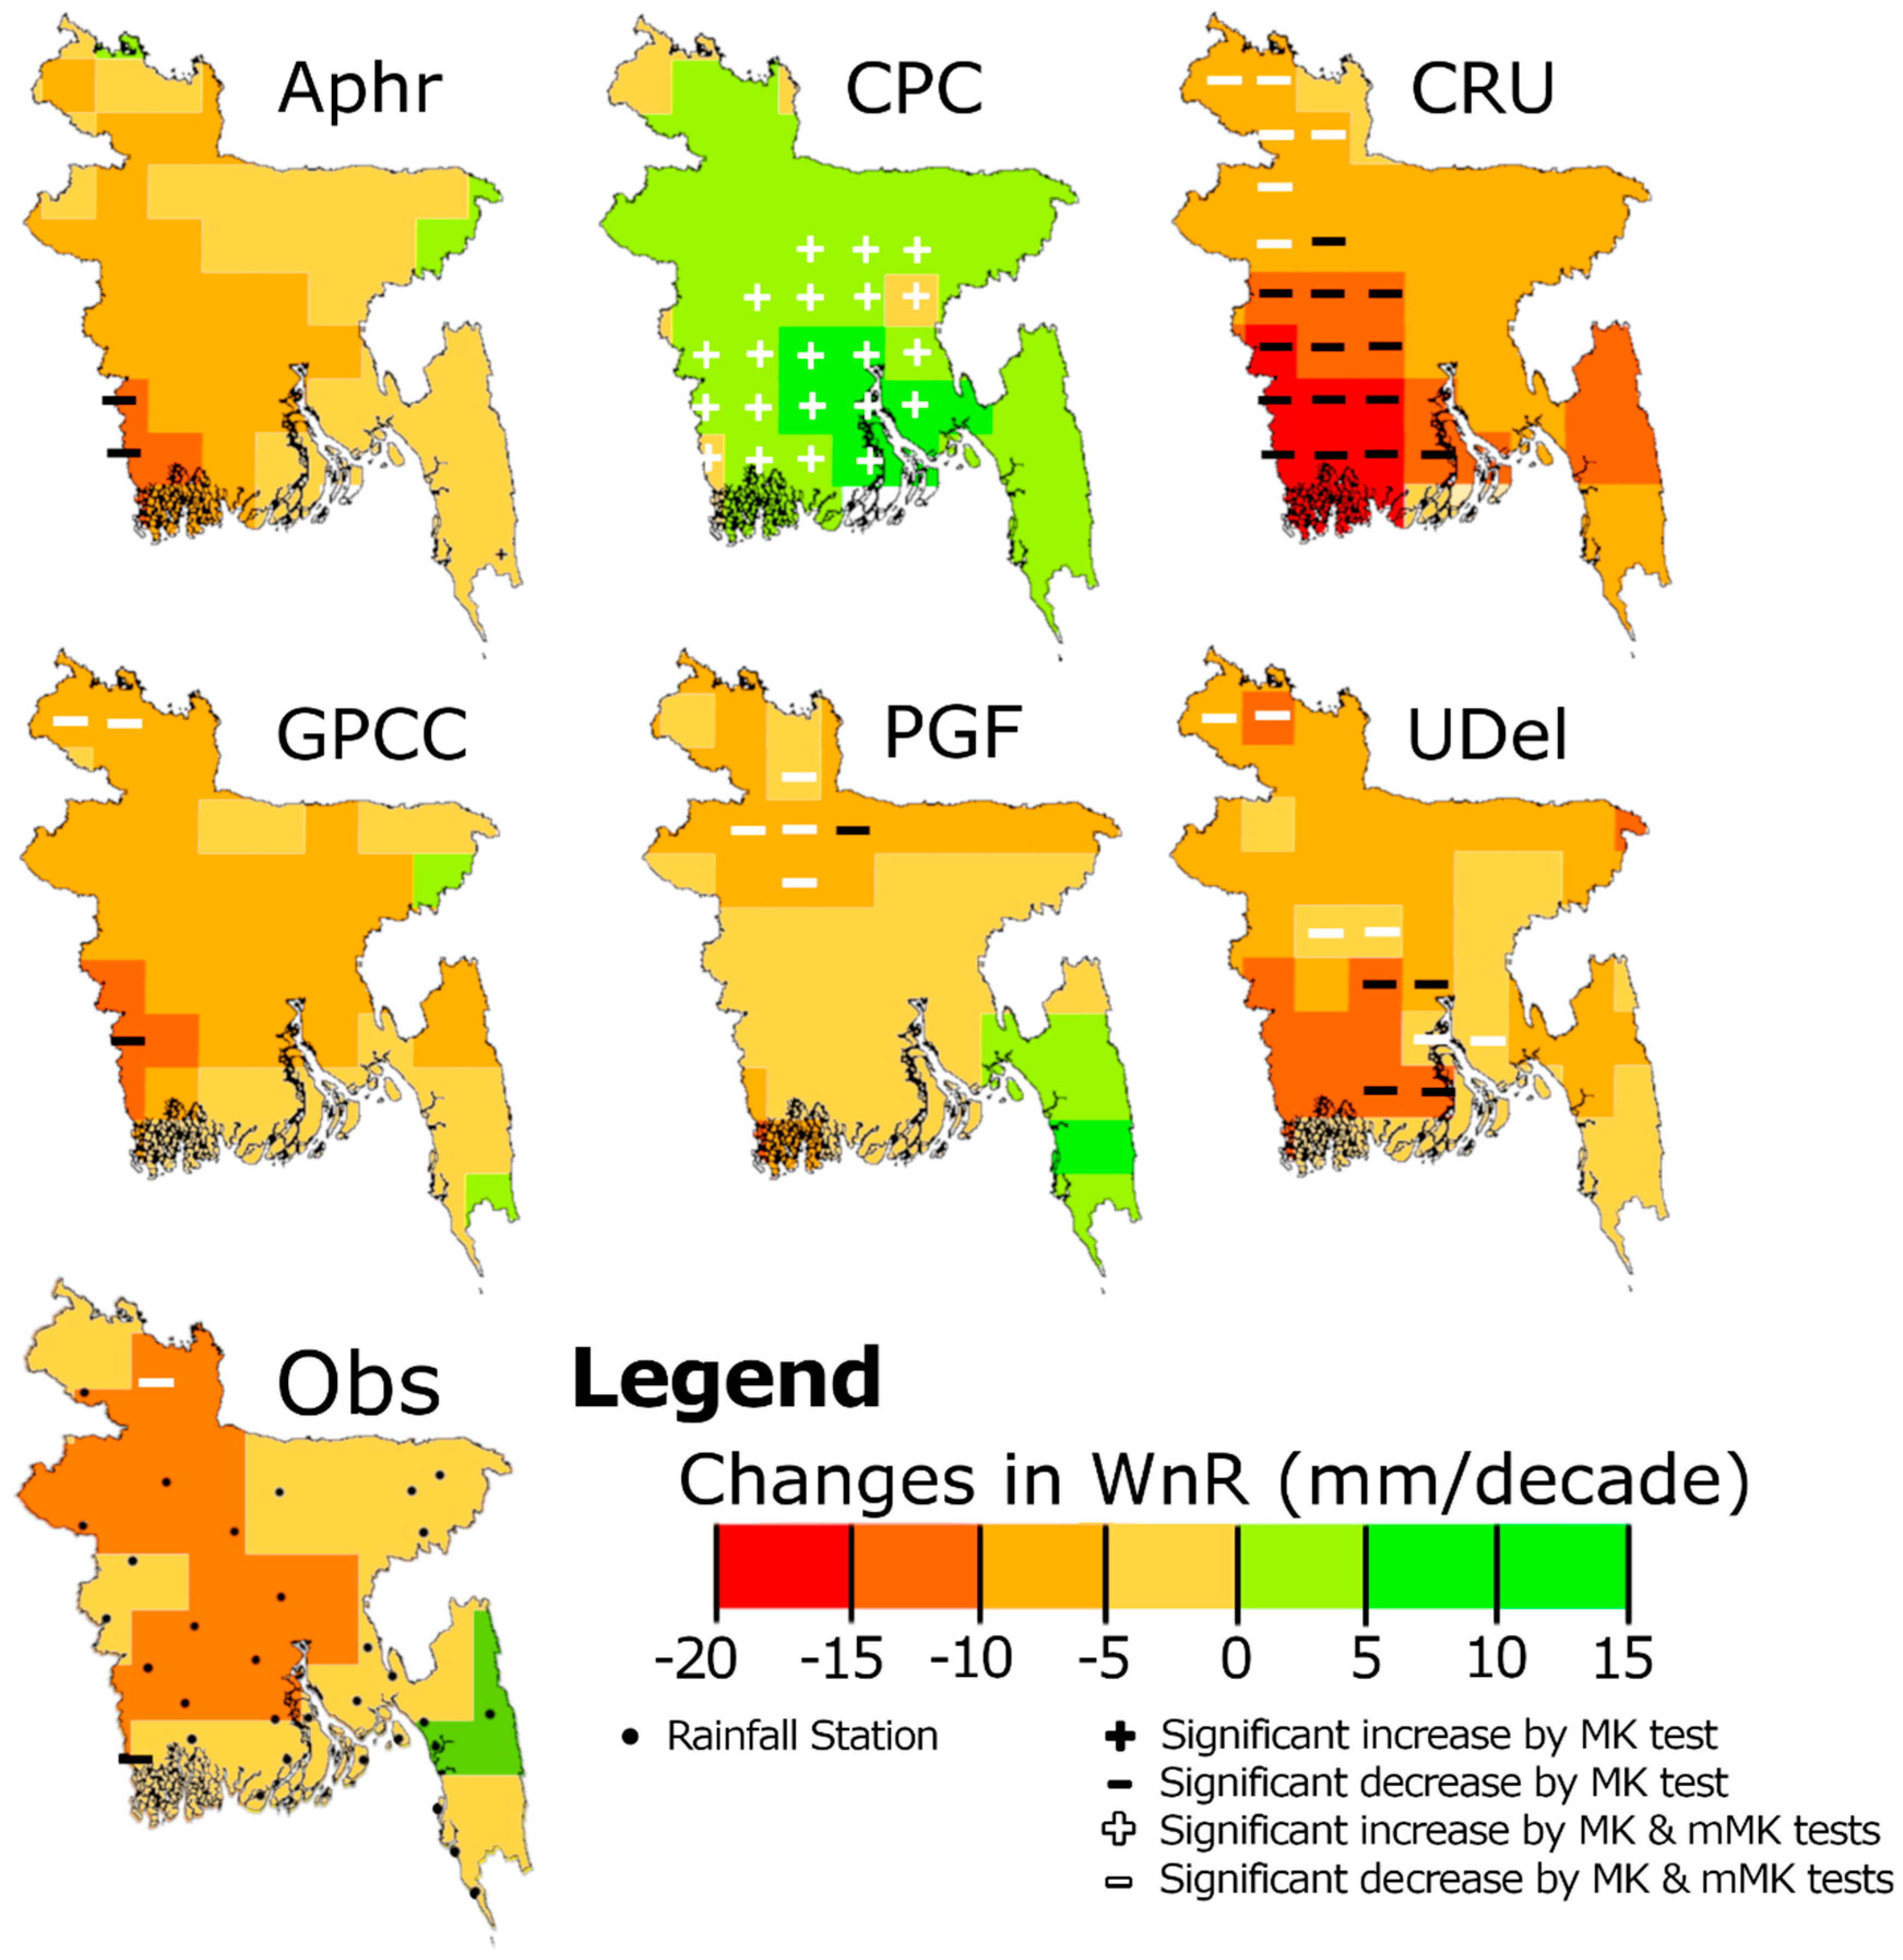
5.2. Comparison of Trends
6. Discussion
7. Conclusions
Author Contributions
Funding
Acknowledgements
Conflicts of Interest
References
- Ahmed, K.; Shahid, S.; Chung, E.S.; Ismail, T.; Wang, X.J. Spatial distribution of secular trends in annual and seasonal precipitation over Pakistan. Clim. Res. 2017, 74, 95–107. [Google Scholar] [CrossRef]
- Khan, N.; Shahid, S.; Ismail, T.B.; Wang, X.J. Spatial distribution of unidirectional trends in temperature and temperature extremes in Pakistan. Theor. Appl. Climatol. 2018. [Google Scholar] [CrossRef]
- Nashwan, M.S.; Shahid, S. Spatial distribution of unidirectional trends in climate and weather extremes in Nile River Basin. Theor. Appl. Climatol. 2018. [Google Scholar] [CrossRef]
- WMO. WMO Statement on the Status of the Global Climate in 2016; World Meteorological Organization: Geneva, Switzerland, 2017; Volume 1189, p. 25. [Google Scholar]
- Salman, S.A.; Shahid, S.; Ismail, T.; Rahman, N.B.A.; Wang, X.; Chung, E.S. Unidirectional trends in daily rainfall extremes of Iraq. Theor. Appl. Climatol. 2017. [Google Scholar] [CrossRef]
- Nashwan, M.S.; Shahid, S.; Abd Rahim, N. Unidirectional trends in annual and seasonal climate and extremes in Egypt. Theor. Appl. Climatol. 2018. [Google Scholar] [CrossRef]
- Ahmed, K.; Shahid, S.; Ali, R.; Harun, S.; Wang, X. Evaluation of the performance of gridded precipitation products over Balochistan province, Pakistan. Desalination 2017, 1, 14. [Google Scholar] [CrossRef]
- Shiru, M.; Shahid, S.; Alias, N.; Chung, E.-S. Trend analysis of droughts during crop growing seasons of Nigeria. Sustainability 2018, 10, 871. [Google Scholar] [CrossRef]
- Nashwan, M.S.; Shahid, S.; Chung, E.-S.; Ahmed, K.; Song, Y.H. Development of climate-based index for hydrologic hazard susceptibility. Sustainability 2018, 10, 2182. [Google Scholar] [CrossRef]
- Salman, S.A.; Shahid, S.; Ismail, T.; Al-Abadi, A.M.; Wang, X.-J.; Chung, E.-S. Selection of gridded precipitation data for iraq using compromise programming. Measurement 2019, 132, 87–98. [Google Scholar] [CrossRef]
- Shahid, S. Recent trends in the climate of Bangladesh. Clim. Res. 2010, 42, 185–193. [Google Scholar] [CrossRef]
- Shahid, S. Probable impacts of climate change on public health in Bangladesh. Asia-Pac. J. Public Health 2010, 22, 310–319. [Google Scholar] [CrossRef]
- Gain, A.K.; Mondal, M.S.; Rahman, R. From flood control to water management: A journey of Bangladesh towards integrated water resources management. Water 2017, 9, 55. [Google Scholar] [CrossRef]
- Nashwan, M.S.; Ismail, T.; Ahmed, K. Flood susceptibility assessment in Kelantan river basin using copula. Int. J. Eng Technol. 2018, 7, 584–590. [Google Scholar]
- Rahman, M.; Salehin, M.; Matsumoto, J. Trends of monsoon rainfall pattern in Bangladesh. Bangladesh J. Water Resour. 1997, 14, 121–138. [Google Scholar]
- Singh, O.P. Cause-effect relationships between sea surface temperature, precipitation and sea level along the Bangladesh coast. Theor. Appl. Climatol. 2001, 68, 233–243. [Google Scholar] [CrossRef]
- Hossain, M.; Roy, K.; Datta, D. Spatial and temporal variability of rainfall over the south-west coast of Bangladesh. Climate 2014, 2, 28–46. [Google Scholar] [CrossRef]
- Shahid, S. Rainfall variability and the trends of wet and dry periods in Bangladesh. Int. J. Climatol. 2010, 30, 2299–2313. [Google Scholar] [CrossRef]
- Shahid, S. Trends in extreme rainfall events of Bangladesh. Theor. Appl. Climatol. 2011, 104, 489–499. [Google Scholar] [CrossRef]
- Shahid, S.; Wang, X.J.; Harun, S. Unidirectional trends in rainfall and temperature of Bangladesh. In Hydrology in a Changing World, Proceedings of the FRIEND, Montpellier, France, 7–10 October 2014; IAHS Press: Montpellier, France, 2014; pp. 177–182. [Google Scholar]
- Endo, N.; Matsumoto, J.; Hayashi, T.; Terao, T.; Murata, F.; Kiguchi, M.; Yamane, Y.; Alam, M.S. Trends in precipitation characteristics in Bangladesh from 1950 to 2008. SOLA 2015, 11, 113–117. [Google Scholar] [CrossRef]
- Sheikh, M.M.; Manzoor, N.; Ashraf, J.; Adnan, M.; Collins, D.; Hameed, S.; Manton, M.J.; Ahmed, A.U.; Baidya, S.K.; Borgaonkar, H.P.; et al. Trends in extreme daily rainfall and temperature indices over South Asia. Int. J. Climatol. 2015, 35, 1625–1637. [Google Scholar] [CrossRef]
- Wang, X.L.; Feng, Y. Rhtestsv3 User Manual; Climate Research Division, Atmospheric Science and Technology Directorate, Science and Technology Branch, Environment Canada: Gatineau, QC, Canada, 2010; p. 24. [Google Scholar]
- Bari, S.H.; Rahman, M.T.U.; Hoque, M.A.; Hussain, M.M. Analysis of seasonal and annual rainfall trends in the northern region of Bangladesh. Atmos. Res. 2016, 176, 148–158. [Google Scholar] [CrossRef]
- Nury, A.H.; Hasan, K.; Mohammed Erfan, K.; Chandra Dey, D. Analysis of spatially and temporally varying precipitation in Bangladesh. Asian J. Water Environ. Pollut. 2016, 13, 15–27. [Google Scholar] [CrossRef]
- Mullick, M.R.A.; Nur, R.M.; Alam, M.J.; Islam, K.M.A. Observed trends in temperature and rainfall in bangladesh using pre-whitening approach. Glob. Planet. Chang. 2019, 172, 104–113. [Google Scholar] [CrossRef]
- Yue, S.; Wang, C.Y. Applicability of prewhitening to eliminate the influence of serial correlation on the Mann-Kendall test. Water Resour. Res. 2002, 38. [Google Scholar] [CrossRef]
- Syed, Z.H.; Choi, G.; Byeon, S. A numerical approach to predict water levels in ungauged regions—Case study of the meghna river estuary, Bangladesh. Water 2018, 10, 110. [Google Scholar] [CrossRef]
- Curtis, S.; Crawford, T.; Rahman, M.; Paul, B.; Miah, M.G.; Islam, M.R.; Patel, M. A hydroclimatological analysis of precipitation in the Ganges-Brahmaputra-Meghna river basin. Water 2018, 10, 1359. [Google Scholar] [CrossRef]
- Shahid, S. Spatial and temporal characteristics of droughts in the western part of Bangladesh. Hydrol. Process. 2008, 22, 2235–2247. [Google Scholar] [CrossRef]
- Kohler, M.A. On the use of double-mass analysis for testing the consistency of meteorological records and for making required adjustments. Bull. Am. Meteorol. Soc. 1949, 30, 188–189. [Google Scholar] [CrossRef]
- Panofsky, H.A.; Brier, G.W. Some Applications of Statistics to Meteorology; Mineral Industries Extension Services; College of Mineral Industries; Pennsylvania State University: State College, PA, USA, 1958. [Google Scholar]
- Ahmed, K.; Shahid, S.; Wang, X.; Nawaz, N.; Khan, N. Evaluation of gridded precipitation datasets over arid regions of Pakistan. Water 2019, 11, 210. [Google Scholar] [CrossRef]
- Mahmoud, M.T.; Al-Zahrani, M.A.; Sharif, H.O. Assessment of global precipitation measurement satellite products over Saudi Arabia. J. Hydrol. 2018, 559, 1–12. [Google Scholar] [CrossRef]
- Gupta, H.V.; Kling, H.; Yilmaz, K.K.; Martinez, G.F. Decomposition of the mean squared error and NSE performance criteria: Implications for improving hydrological modelling. J. Hydrol. 2009, 377, 80–91. [Google Scholar] [CrossRef]
- Willmott, C.J. On the validation of models. Phys. Geogr. 2013, 2, 184–194. [Google Scholar] [CrossRef]
- Perkins, S.E.; Pitman, A.J.; Holbrook, N.J.; McAneney, J. Evaluation of the AR4 climate models’ simulated daily maximum temperature, minimum temperature, and precipitation over Australia using probability density functions. J. Clim. 2007, 20, 4356–4376. [Google Scholar] [CrossRef]
- Sen, P.K. Estimates of the regression coefficient based on Kendall’s tau. J. Am. Stat. Assoc. 1968, 63, 1379–1389. [Google Scholar] [CrossRef]
- Mann, H.B. Nonparametric tests against trend. Econometrica 1945, 13, 245–259. [Google Scholar] [CrossRef]
- Kendall, M.G. Rank correlation Methods; Hafner Publishing Co.: Oxford, UK, 1948. [Google Scholar]
- Hamed, K.H. Exact distribution of the Mann-Kendall trend test statistic for persistent data. J. Hydrol. 2009, 365, 86–94. [Google Scholar] [CrossRef]
- Hamed, K.H. Trend detection in hydrologic data: The Mann-Kendall trend test under the scaling hypothesis. J. Hydrol. 2008, 349, 350–363. [Google Scholar] [CrossRef]
- Yue, S.; Wang, C. The mann-kendall test modified by effective sample size to detect trend in serially correlated hydrological series. Water Resour. Manag. 2004, 18, 201–218. [Google Scholar] [CrossRef]
- Koutsoyiannis, D.; Montanari, A. Statistical analysis of hydroclimatic time series: Uncertainty and insights. Water Resour. Res. 2007, 43. [Google Scholar] [CrossRef]
- Kumar, S.; Merwade, V.; Kam, J.; Thurner, K. Streamflow trends in Indiana: Effects of long term persistence, precipitation and subsurface drains. J. Hydrol. 2009, 374, 171–183. [Google Scholar] [CrossRef]
- Lacombe, G.; Hoanh, C.T.; Smakhtin, V. Multi-year variability or unidirectional trends? Mapping long-term precipitation and temperature changes in continental southeast Asia using precis regional climate model. Clim. Chang. 2012, 113, 285–299. [Google Scholar] [CrossRef]
- Jaccard, P. Nouvelles researches sur la distribution florale. Bull. Soc. Vaud. Sci. Nat. 1908, 44, 223–270. [Google Scholar]
- Jaccard, P. The distribution of the flora in the alpine zone. New Phytol. 1912, 11, 37–50. [Google Scholar] [CrossRef]
- Yin, Y.; Yasuda, K. Similarity coefficient methods applied to the cell formation problem: A comparative investigation. Comput. Ind. Eng. 2005, 48, 471–489. [Google Scholar] [CrossRef]
- Johnson, F.; Westra, S.; Sharma, A.; Pitman, A.J. An assessment of GCM skill in simulating persistence across multiple time scales. J. Clim. 2011, 24, 3609–3623. [Google Scholar] [CrossRef]
- Pour, S.H.; Shahid, S.; Chung, E.-S.; Wang, X.-J. Model output statistics downscaling using support vector machine for the projection of spatial and temporal changes in rainfall of Bangladesh. Atmos. Res. 2018, 213, 149–162. [Google Scholar] [CrossRef]
- Schneider, U.; Becker, A.; Finger, P.; Meyer-Christoffer, A.; Ziese, M.; Rudolf, B. GPCC’s new land surface precipitation climatology based on quality-controlled in situ data and its role in quantifying the global water cycle. Theor. Appl. Climatol. 2014, 115, 15–40. [Google Scholar] [CrossRef]
- Hou, A.Y.; Kakar, R.K.; Neeck, S.; Azarbarzin, A.A.; Kummerow, C.D.; Kojima, M.; Oki, R.; Nakamura, K.; Iguchi, T. The global precipitation measurement mission. Bull. Am. Meteorol. Soc. 2014, 95, 701–722. [Google Scholar] [CrossRef]
- Prakash, S.; Mitra, A.K.; Momin, I.M.; Rajagopal, E.N.; Basu, S.; Collins, M.; Turner, A.G.; Achuta Rao, K.; Ashok, K. Seasonal intercomparison of observational rainfall datasets over India during the southwest monsoon season. Int. J. Climatol. 2015, 35, 2326–2338. [Google Scholar] [CrossRef]
- Kishore, P.; Jyothi, S.; Basha, G.; Rao, S.; Rajeevan, M.; Velicogna, I.; Sutterley, T.C. Precipitation climatology over india: Validation with observations and reanalysis datasets and spatial trends. Clim. Dyn. 2016, 46, 541–556. [Google Scholar] [CrossRef]


| Study | Study Timeframe | Study Period | Data Type | Quality Control of Data | Trend Analysis Method | Major Findings |
|---|---|---|---|---|---|---|
| Rahman et al. [15] | Monsoon | - | Gauge | - | MK test | Southeast rainfall pattern was changing, no change was found in monsoon rainfall pattern |
| Singh [16] | Monsoon | 1961–1991 | Gauge | Not mentioned | Least squares method | Monsoon rainfall increased, with the highest increase in September then July |
| Hossain et al. [17] | Seasonal | 1948–2007 | Gauge | Daily missing data were filled using a simple averaging | Sen’s slope, MK test, and linear regression | Post-monsoon and winter rainfall had significant positive trends, pre-monsoon and monsoon rainfall had no significant trend |
| Shahid [18] | Annual and seasonal | 1958–2007 | Gauge | A total of 17 stations with missing data ≤2%. The standard normal homogeneity test used | Sen’s slope and MK test | Annual and pre-monsoon precipitation increased, no trend in monsoon, post-monsoon, and winter rainfalls |
| Shahid [19] | Annual and seasonal | 1958–2007 | Gauge | Double mass curve and the Student’s t test | Sen’s slope and MK test | An increasing trend in extreme precipitation indices |
| Shahid et al. [20] | Annual and seasonal | 1958–2007 | Gauge | Double mass curve and the Student’s t test | Sen’s slope and mMK | After removing the scaling effect, annual rainfall increased in North Bangladesh, and increase in pre-monsoon period |
| Endo et al. [21] | Seasonal | 1950–2008 | Gauge | Missing data <10%, except monsoon filled and the standard normal homogeneity tests used | Mann–Kendall’s tau test | Trends in monsoon and post-monsoon were not significant |
| Sheikh et al. [22] | Annual | 1961–2000 | Gauge | RHTest software [23] used to fill missing data | Mann–Whitney and MK tests | An increasing trend of annual rainfall |
| Bari et al. [24] | Annual and seasonal | 1964–2013 | Gauge | Months with missing days discarded and years having missing data ≥20% omitted | Sen’s slope, MK, sequential Mann–Kendall tests | Pre-monsoon and post-monsoon rainfall were increasing, annual and monsoon rainfall showed a decreasing trend |
| Nury et al. [25] | Monthly | 1975–2012 | Gauge | Not mentioned | Sen’s slope and MK test | Southeast of Bangladesh had the highest increasing trend, while the northwest had the lowest. |
| Mullick et al. [26] | Annual and seasonal | 1966–2015 | Gauge | Not mentioned | Yue and Wang [27]’s version of MK test | Annual, pre-monsoon, monsoon, and post-monsoon rainfall had a positive trend in most of the stations used |
| Dataset | Spatial Resolution | Temporal Resolution | Available Time Span | Data Sources |
|---|---|---|---|---|
| APHRODITE | 0.25° | Daily | 1951–2010 | GTS, National and International Agencies |
| CPC | 0.5° | Daily | 1979–2017 | NOAA and GTS |
| CRU | 0.5° | Monthly | 1901–2016 | WMO and NOAA |
| GPCC | 0.5° | Monthly | 1901–2017 | GTS, climate reports and synoptic weather reports |
| UDel | 0.5° | Monthly | 1900–2014 | GHCN2 GHCN-Daily, GSOD, NCAR |
| PGF | 0.25° | Daily | 1948–2010 | NCEP, NCAR, and global observed data |
| Method | Gridded Dataset | Area (%) | |||||||||
|---|---|---|---|---|---|---|---|---|---|---|---|
| Annual | Pre-Monsoon | Monsoon | Post-Monsoon | Winter | |||||||
| +ve | −ve | +ve | −ve | +ve | −ve | +ve | −ve | +ve | −ve | ||
| MK | APHRODITE | 9.5 | 0.0 | 2.7 | 1.4 | 5.4 | 0.0 | 16.2 | 0.0 | 0.0 | 2.7 |
| CPC | 43.2 | 0.0 | 10.8 | 0.0 | 31.1 | 0.0 | 50.0 | 0.0 | 29.7 | 0.0 | |
| CRU | 0.0 | 0.0 | 0.0 | 5.4 | 0.0 | 5.4 | 0.0 | 0.0 | 0.0 | 27.0 | |
| GPCC | 1.4 | 2.7 | 1.4 | 10.8 | 0.0 | 0.0 | 2.7 | 0.0 | 0.0 | 4.1 | |
| PGF | 0.0 | 0.0 | 0.0 | 8.1 | 0.0 | 4.1 | 17.6 | 0.0 | 0.0 | 8.1 | |
| UDel | 0.0 | 4.1 | 0.0 | 4.1 | 0.0 | 4.1 | 5.4 | 6.8 | 0.0 | 13.5 | |
| mMK | APHRODITE | 2.7 | 0.0 | 2.7 | 1.4 | 0.0 | 0.0 | 16.2 | 0.0 | 0.0 | 0.0 |
| CPC | 1.4 | 0.0 | 4.1 | 0.0 | 0.0 | 0.0 | 29.7 | 0.0 | 29.7 | 0.0 | |
| CRU | 0.0 | 0.0 | 0.0 | 5.4 | 0.0 | 5.4 | 0.0 | 0.0 | 0.0 | 8.1 | |
| GPCC | 0.0 | 1.4 | 1.4 | 9.5 | 0.0 | 0.0 | 1.4 | 0.0 | 0.0 | 2.7 | |
| PGF | 0.0 | 0.0 | 0.0 | 8.1 | 0.0 | 4.1 | 13.5 | 0.0 | 0.0 | 6.8 | |
| UDel | 0.0 | 4.1 | 0.0 | 4.1 | 0.0 | 4.1 | 2.7 | 6.8 | 0.0 | 8.1 | |
| Dataset | Annual | Pre-Monsoon | Monsoon | Post-Monsoon | Winter |
|---|---|---|---|---|---|
| APHRODITE | 0% | 24% | 1% | 63% | 7% |
| CPC | 0% | 12% | 1% | 30% | 5% |
| CRU | 10% | 12% | 16% | 72% | 6% |
| GPCC | 22% | 12% | 21% | 80% | 22% |
| PGF | 13% | 11% | 16% | 61% | 16% |
| UDel | 17% | 22% | 17% | 51% | 14% |
| Test | Dataset | Annual | Pre-Monsoon | Monsoon | Post-Monsoon | Winter |
|---|---|---|---|---|---|---|
| Pbias | APHRODITE | −872.7 | −478.7 | 49.1 | −125.1 | −765.2 |
| CPC | −1868.5 | −956 | 67 | −624.1 | −845 | |
| CRU | 581.9 | 324.5 | 19.6 | 167.7 | −633.5 | |
| GPCC | −26.4 | −9.6 | 1.5 | 53.9 | −552.6 | |
| PGF | −81.1 | 37.6 | 31.1 | 67.2 | −685 | |
| UDel | −118.8 | −38.6 | 17.3 | 24.6 | −623.3 | |
| md | APHRODITE | 0.27 | 0.2 | 0.51 | 0.4 | 0.04 |
| CPC | 0.13 | 0.1 | 0.27 | 0.27 | 0.04 | |
| CRU | 0.28 | 0.22 | 0.45 | 0.07 | 0.05 | |
| GPCC | 0.61 | 0.36 | 0.62 | 0.39 | 0.05 | |
| PGF | 0.47 | 0.28 | 0.51 | 0.36 | 0.04 | |
| UDel | 0.48 | 0.31 | 0.27 | 0.38 | 0.05 | |
| SS | APHRODITE | 0.21 | −0.06 | 0.88 | 0.33 | −0.25 |
| CPC | −0.10 | −0.19 | 0.75 | −0.23 | −0.25 | |
| CRU | 0.05 | 0.30 | 0.80 | −0.051 | −0.29 | |
| GPCC | 0.73 | 0.42 | 0.90 | 0.44 | −0.26 | |
| PGF | 0.51 | 0.37 | 0.81 | 0.38 | −0.20 | |
| UDel | 0.55 | 0.38 | 0.64 | 0.41 | −0.26 |
| Method | Gridded Dataset | POD | ||||
|---|---|---|---|---|---|---|
| Annual | Pre-Monsoon | Monsoon | Post-Monsoon | Winter | ||
| MK | APHRODITE | 0.76 | 0.85 | 0.88 | 0.71 | 0.91 |
| CPC | 0.44 | 0.71 | 0.53 | 0.35 | 0.94 | |
| CRU | 0.85 | 0.59 | 0.88 | 0.91 | 0.53 | |
| GPCC | 0.88 | 0.82 | 1.00 | 1.00 | 0.94 | |
| PGF | 0.85 | 0.71 | 0.91 | 0.68 | 0.94 | |
| UDel | 0.76 | 0.65 | 0.76 | 0.68 | 0.65 | |
| mMK | APHRODITE | 0.91 | 0.88 | 1.00 | 0.71 | 0.97 |
| CPC | 0.91 | 0.79 | 0.97 | 0.56 | 0.94 | |
| CRU | 0.91 | 0.65 | 0.88 | 0.91 | 0.91 | |
| GPCC | 0.94 | 0.82 | 1.00 | 0.97 | 0.97 | |
| PGF | 0.94 | 0.74 | 0.94 | 0.74 | 0.97 | |
| UDel | 0.76 | 0.71 | 0.76 | 0.71 | 0.74 | |
© 2019 by the authors. Licensee MDPI, Basel, Switzerland. This article is an open access article distributed under the terms and conditions of the Creative Commons Attribution (CC BY) license (http://creativecommons.org/licenses/by/4.0/).
Share and Cite
Nashwan, M.S.; Shahid, S.; Wang, X. Uncertainty in Estimated Trends Using Gridded Rainfall Data: A Case Study of Bangladesh. Water 2019, 11, 349. https://doi.org/10.3390/w11020349
Nashwan MS, Shahid S, Wang X. Uncertainty in Estimated Trends Using Gridded Rainfall Data: A Case Study of Bangladesh. Water. 2019; 11(2):349. https://doi.org/10.3390/w11020349
Chicago/Turabian StyleNashwan, Mohamed Salem, Shamsuddin Shahid, and Xiaojun Wang. 2019. "Uncertainty in Estimated Trends Using Gridded Rainfall Data: A Case Study of Bangladesh" Water 11, no. 2: 349. https://doi.org/10.3390/w11020349
APA StyleNashwan, M. S., Shahid, S., & Wang, X. (2019). Uncertainty in Estimated Trends Using Gridded Rainfall Data: A Case Study of Bangladesh. Water, 11(2), 349. https://doi.org/10.3390/w11020349