Article

Commercial Tanker Water Demand in Amman, Jordan—A Spatial Simulation Model of Water Consumption Decisions under Intermittent Network Supply

1
Department of Economics, Helmholtz Centre for Environmental Research—UFZ, Permoser Str. 15, 04318 Leipzig, Germany
2
Faculty of Economics and Business Management, Institute of Infrastructure and Resources Management, Leipzig University, Grimmaische Str. 12, 04109 Leipzig, Germany
*
Author to whom correspondence should be addressed.
Water 2019, 11(2), 254; https://doi.org/10.3390/w11020254
Submission received: 21 December 2018 / Revised: 16 January 2019 / Accepted: 22 January 2019 / Published: 1 February 2019
(This article belongs to the Special Issue Socioeconomic Indicators for Sustainable Water Management)

Abstract

:
The Hashemite Kingdom of Jordan is confronted with a severe freshwater crisis shaped by excess water demand and intermittent public supply. In Jordan’s capital and most populous city, Amman, the pervasive water shortage gave rise to private tanker water operations, which transport groundwater from wells in the vicinity of the city and sell it to urban consumers. These tanker water markets have received little attention in the literature up to date, particularly with regard to their relevance for commercial water users. This paper aims to empirically estimate the water demand of commercial establishments in Amman under public supply rationing and to assess to which extent tanker operations contribute to meeting commercial water needs. Building on a prior simulation model of residential water consumption, the results of three extensive surveys concerned with tanker water markets and various geographic data, we develop a spatial agent-based model of the water consumption behavior of commercial establishments in different sizes. According to our estimation, 35–45% of the overall water volume consumed by the commercial sector stems from tanker operations, depending on the season. We find that the local disparities in access to affordable network water, along with the dispersion of groundwater wells around the city, result in considerable spatial differences in tanker water consumption. The outcome of this analysis could be relevant for policy attempting to enhance freshwater sustainability in Jordan.

1. Introduction

In the twenty-first century, unprecedented water crises and conflicts are likely to occur in a growing number of regions around the world. The World Health Organization [1] estimates that physical and economic water scarcity already affects more than 40 percent of the world’s population, with a rising trend. Among other factors, such as population growth, climate change and unsustainable management practices, rapid urbanization aggravates the challenge of ensuring sustainable and pervasive access to freshwater. In a variety of cities in the Global South, parts of the population live in informal settlements and remain unconnected to a water network. Many other urban water users have a connection but nevertheless experience water shortages and intermittent supply and are therefore unable to fully meet their water needs. For both cases—non-existent or intermittent public supply—there is wide evidence that additional water services are provided by small, private businesses [2,3].
One form of water supply independent from a public network is the transport and sale of bulk water volumes from groundwater wells or surface bodies via tanker trucks. In Amman, Jordan, this type of water provision has been brought about by a chronic water scarcity that continues to keep the Hashemite Kingdom in its clutches. Measured in renewable freshwater resources, Jordan is among the 10 countries with the least water available per person and year [4], while renewable water resources are exploited above sustainable yield rates throughout the country [5]. Although nearly all households in Amman have a network connection [6,7], the low availability of water, along with high network losses, has resulted in a chasm between the demand of all water users and the capacity of Miyahuna, Amman’s utility, to deliver the requested volumes [8]. As a consequence, network supply in Amman is intermittent and ranges between 18 and 168 h per week, depending on the location within the city [9]. Affected water users have found a variety of ways to deal with this, for instance by installing rooftop and basement storage tanks to balance times of discontinued supply or by investing in water-efficient appliances to reduce their water consumption [10,11]. On top of that, many water users turn to tanker providers in order to meet their water requirements. The tanker operations pump water from both licensed and illegal groundwater wells in the vicinity of Amman and deliver it directly to the site of their customers [7]. By doing so, they—along with other water users such as highland farmers—abstract groundwater from an aquifer exploited in an alarmingly unsustainable way. The Amman-Zarqa basin is in fact the most overpumped in the country [5,12].
Although the academic literature has increasingly dealt with small-scale private water provision in the last two decades [3], much of the literature on urban water scarcity and supply intermittency maintains a utility-centric perspective and merely discusses other water providers on the side. Tanker water provision is particularly under-researched, although there is evidence for its occurrence on all continents [13]. To date, only a handful of studies investigate tanker water supply in depth. These mostly suggest that the high price of tanker water constitutes an economic burden and exacerbates social inequality, because the urban poor depend more heavily on it [14]. For the Jordanian case, this argument has been put forward by Wildman [15], who observed that wealthier water users have larger capacities to store the more affordable water provided through the network during times of supply. In addition, water provision through tanker operations has been interpreted as a welfare loss in the literature, resulting from a direct comparison with water from public networks [16,17]. Tanker water has also been associated with groundwater depletion [16] and conflicts between water users in peri-urban and urban areas [18]. Klassert and colleagues [19], however, have modeled residential water consumption in Amman and found that tanker water supply is very relevant for balancing the shortcomings of intermittent network supply and potentially during periods of crisis.
Most of the literature, nevertheless, seems inclined to interpret tanker water supply as problematic, while relatively few arguments are based on empirical evidence. In particular, information regarding the volume and characteristics of such water markets is missing, as well as assessments of potential contributions to welfare resulting from tanker water provision. This gap is to some extent due to the aforementioned focus on public utility supply in the literature but is also caused by the frequently informal and spatially heterogeneous character of tanker water markets, which impede one-fits-all statements concerning their role in sustainable urban water supply. Evidence-based analyses that take spatial and seasonal differences in water consumption into account seem necessary in order to move forward in the discussion on tanker water provision. Moreover, it seems obvious that water users can behave quite differently within the same supply system, due to differences in individual water requirements, availability and prices. Water user groups other than residential and agricultural consumers, however, have received insufficient attention so far—not only in the specific literature on small-scale water providers but in general [20].
As outlined above, previous research endeavors have shed light on the use of tanker water by households in Amman. As to whether other water users rely on tanker-provided water as well, and to which extent, far less is known. Recently, several empirical surveys concerned with the tanker water market in Amman were carried out by Sigel et al. [21,22]: (i) a survey with 242 commercial establishments (commercials survey), (ii) a survey with 300 tanker drivers (tanker drivers survey) and (iii) a survey with 11 owners/managers of groundwater wells (well operators survey). The commercials survey indicates that commercial water users much more frequently do not have a network connection (44%) when compared to households (95%). While some establishments claimed to have no option to receive a connection, others stated that they voluntarily refrain from having one. It therefore seems likely that the commercial sector relies to a greater extent on tanker water than residential users. This is substantiated by the results of the tanker drivers survey, in which the respondents claimed to sell approximately half of the total water volume delivered to commercial establishments (52%, opposed to merely 20% going to households). This potentially strong involvement of the commercial sector in the tanker water market might have several implications.
On the one hand, the comparatively low network connectivity among commercial water users suggests a significant use of tanker water of at least those parts of the commercial sector which rely on it as their only bulk water source [22]. This implies a potential connection between groundwater exploitation and economic value creation in commercial establishments consuming tanker water. As a result, any policy aiming to reduce groundwater overdraft and scale down or end tanker water provision might have impacts on the commercial sector, which is the main source of employment in the Governorate Amman and therefore of social relevance [23]. In another line of reasoning, the strong reliance on tanker water might be evidence for a financial burden on a water supply system which is already operated under severe losses. The commercial water users that refrain from cross-subsidizing the water network for all users and instead exacerbate groundwater stress by purchasing tanker water might adversely affect public interests.
With this paper, we aim to contribute to both the literature on tanker water provision and on commercial water use. We do so by carrying out a positive analysis of commercial water consumption in a systematic, spatially and seasonally differentiated way. As a result, we present an estimation of the volume of the market of tanker water for commercial establishments. Particular focus will be placed on investigating to which extent tanker water supply meets demands left unsatisfied by network water provision and to which extent it adds to consumer surplus. In addition, we discuss how commercial use of tanker water could be related to excess groundwater abstraction and the ongoing Jordanian water crisis. This objective is pursued by designing, implementing and analyzing an agent-based model (ABM) capable of simulating water consumption decisions of commercial establishments in different sizes and locations. The model draws on the conceptual structure of the prior ABM of residential water consumption in Amman by Klassert et al. [19] but dedicates its full attention to the commercial sector. Moreover, our new model explicitly includes a representation of the supply side of the tanker water market, profits from a considerable increase in spatial resolution and incorporates preliminary findings of the three aforementioned surveys.
The remainder of this paper is structured in the following way: Section 2 describes the conceptual structure of our ABM of commercial water consumption in Amman and the underlying theoretic notions and assumptions. In Section 3, we present where our data stems from and how it was processed. The methods of the model, particularly the water demand function and water distribution procedures, will be discussed in Section 4. In Section 5 and Section 6, we first present the most relevant results obtained from the simulation model and then discuss their implications. Section 7 concludes.

2. Model Concept

In this section, we present an overview of the simulation model which enables this analysis and the underlying design concepts. While attempting to provide a transparent documentation that ensures reproducibility and allows an informed interpretation of results, it can be challenging to find a balance between giving a full and lucid description and avoiding getting lost in detail. The elements of the following description have been chosen in consideration of the ODD + D protocol (Overview, Design Concepts, Details and Decision-Making) [24], an amended version of the original ODD protocol proposed by Grimm and colleagues [25] for the documentation of ecological ABM.

2.1. Model Overview

The purpose of the model is a simulation of network and tanker water consumption decisions of commercial establishments in different sizes and locations in Amman. Possible water allocations, i.e., appropriations of the available, scarce water resources to different consumers, are modeled by predicting and quantifying commercial water consumption decisions and are subsequently interpreted to assess the tanker water use of the commercial sector. The model is addressed to scientists, who can use the insights of the positive analysis for further studies, as well as policy makers, who can use the model results as information to consider in decision processes.
The model explicitly incorporates two human entities or groups of agents: Commercial establishments in different sizes and groundwater well owners. A third group of human actors—the tanker water drivers—are important for a conceptual understanding of the process through which tanker water is allocated but are modeled implicitly through certain actions taken by agents representing commercial establishments, i.e., they do not appear explicitly in the model code (cf. Appendix A, Note 1). The central commodity and the only good which is traded and consumed by the agents in the model is freshwater, which can either stem from the piped network, run by Miyahuna, or from groundwater wells, run as private businesses.
The only consumers of water considered by the model are the commercial establishments, which are divided into two sub-groups: connected establishments receive (intermittent) supply from Miyahuna, unconnected establishments rely exclusively on tanker water. Regardless of the existence of a network connection, the model distinguishes between five commercial categories of different sizes, measured by the number of employees (1–4, 5–19, 20–49, 50–99 and >99 employees). The size of an establishment determines the values of proxy variables such as the number of toilets or the water storage size. These variables, along with the water prices, determine the demand of each commercial agent for water. While the price of network water is fixed in a uniform tariff, the price of tanker water is determined by the distance of groundwater wells, i.e., by the cost of fuel for water transport. Each commercial establishment attempts to cover its water demand as inexpensively as possible (cf. Appendix A, Note 2).
Well owners are characterized by their location and by their ability to abstract groundwater at a certain rate, which is granted by a publicly issued license. Location and well yield determine how much water a well owner can pump and offer for sale and which customers he or she will serve. What a well owner cannot do is determine his or her sales price—this price is fixed by regulation [22]. Tanker drivers, finally, connect commercial establishments with well owners by purchasing water at different wells and transporting it to the location of the establishment (implicitly modeled in code through commercial agents). For this service, they add a premium to the cost of water they incurred at the well. This premium consists of a charge that depends on the distance the water has to ‘travel’ in order to reach its consumer and a profit margin, determined by the willingness to pay of the commercial establishment which is served.
Both temporal and spatial factors are considered by the model. Time comes into play through seasonality: water demand in establishments varies between summer and winter. For both seasons (cf. Appendix A, Note 3), the water allocation processes of one representative day are simulated and then extrapolated to yearly results. Space is another crucial aspect in the model design. The environment, in which the agents act, is an administrative landscape: the distribution zones (DZ) of Amman’s utility Miyahuna, which have different weekly durations of network supply. The locations of commercial establishments in each distribution zone are hypothetical and assumed to be at its center (To this end, the centroid of each DZ polygon was determined). Groundwater wells, on the other hand, have been placed in the model environment based on real-world geo-data. In short, the locations of commercial agents have two effects: first, they determine for how long—or how much—network water can be accessed and, second, they determine the distance between each agent and the groundwater wells, which influences the price of tanker water.
Within a model run, i.e., the allocation of freshwater in one day, two separately scheduled processes occur. First, the available piped water is distributed among those agents with a connection to the network. Then, those without a connection and those that require more water than they received during piped water distribution attempt to purchase groundwater from the wells. The demand of the commercial establishments for water at different prices (willingness to pay) informs the tanker drivers, which purchase water from the well owners. These distribute the limited amounts of water at their disposal until they run out or until no commercial agent is interested in their water anymore. The outputs of the model are the water allocations among commercial establishments, i.e., agent-specific combinations of network and tanker water prices and quantities, which can be differentiated by the establishment’s location in Amman and by the size of the establishment, measured by the number of employees. In addition, the model uses the commercial water demand function (cf. Section 4) to determine consumer surplus derived from the use of both tap and tanker water.

2.2. Design Concepts, Decision-Making and Assumptions

If we attempt to ‘step into the shoes’ of a restaurant owner in Amman, who faces network intermittency and can purchase tanker water from different wells, we might ask ourselves: Should network or tanker water be purchased? Or both? From which well should the tanker water be bought? These questions point at relevant decision-making processes.
We assume that the capabilities of commercial agents to make these decisions are constrained by factors such as incomplete information about the different supply options and uncertainty about the decisions of other water users. Therefore, some decisions in the model are based on simple heuristics, which corresponds to the economic concept of bounded rationality, i.e., the idea that rational decision-making is limited by factors such as the complexity of the decision problem and constraints in cognitive capacities and time availability [26]. We do, however, assume that the commercial decision-makers have a clear picture about the water needs of their establishment, which is reflected in the use of a water demand function.
The decision-making processes of individual human agents are conceptualized as follows: commercial establishments with a connection to the network first attempt to abstract as much water from the network as they demand at the given tariff. The agents make this choice because they bear fixed costs for a connection to the network and seek to distribute this cost across a preferably high quantity of water. In addition, they face uncertainty whether they could get tanker water at the (comparatively low) price of piped water and in the volumes they require. At this point, our model touches upon the economic concept of transaction cost, which denotes any type of cost associated with the exchange of a good or service, including factors such as communication, transport and finding information about prices, quality, etc. We assume that it is easier for a commercial establishment to use the tap during times of supply than to organize a delivery via tanker trucks, i.e., that transaction costs are lower. If the commercial agents receive as much water as they demanded from the network, they are satisfied and abstain from entering further rounds of distribution. If not, they enter the tanker water distribution, along with the establishments without a connection.
As a prerequisite for the tanker water distribution, the commercial establishments interested in tanker water determine their willingness to pay at different prices and communicate this to the tanker drivers. These now have to decide which well they purchase the water from. In order to offer low prices and save fuel, they decide to first head for the well that is closest to their customers. The tanker drivers now pay the fixed water charge at the well and add variable transport cost to calculate the price of water from this well. If they can get the amount of water their customers want at this price, they purchase this amount and abstain from further participating in the tanker distribution. If, however, they could not get enough water at this first well, the tanker drivers determine the price for the second closest well and assess whether their customers would demand water at this price. If so, they continue to the next closest well and participate in the distribution there. This is repeated with all other wells, if necessary, until the drivers either receive the quantity of water demanded (cf. Appendix A, Note 4) at the price they can offer at a specific well or until no water is left at any well. This can result in a situation where tanker drivers have bundled water from different sources at different prices for the same commercial establishment. Since the establishment is willing to pay the price of water at the ‘last’ and most expensive well, the tanker drivers will charge this marginal price for the entire delivery (cf. Appendix A, Note 5), even though it might include cheaper water from closer wells. This corresponds to the standard economic assumption of products being sold at their (local) marginal production costs. The tanker drivers are able to request the marginal price because their customers have incomplete information about the sources of water in their delivery.
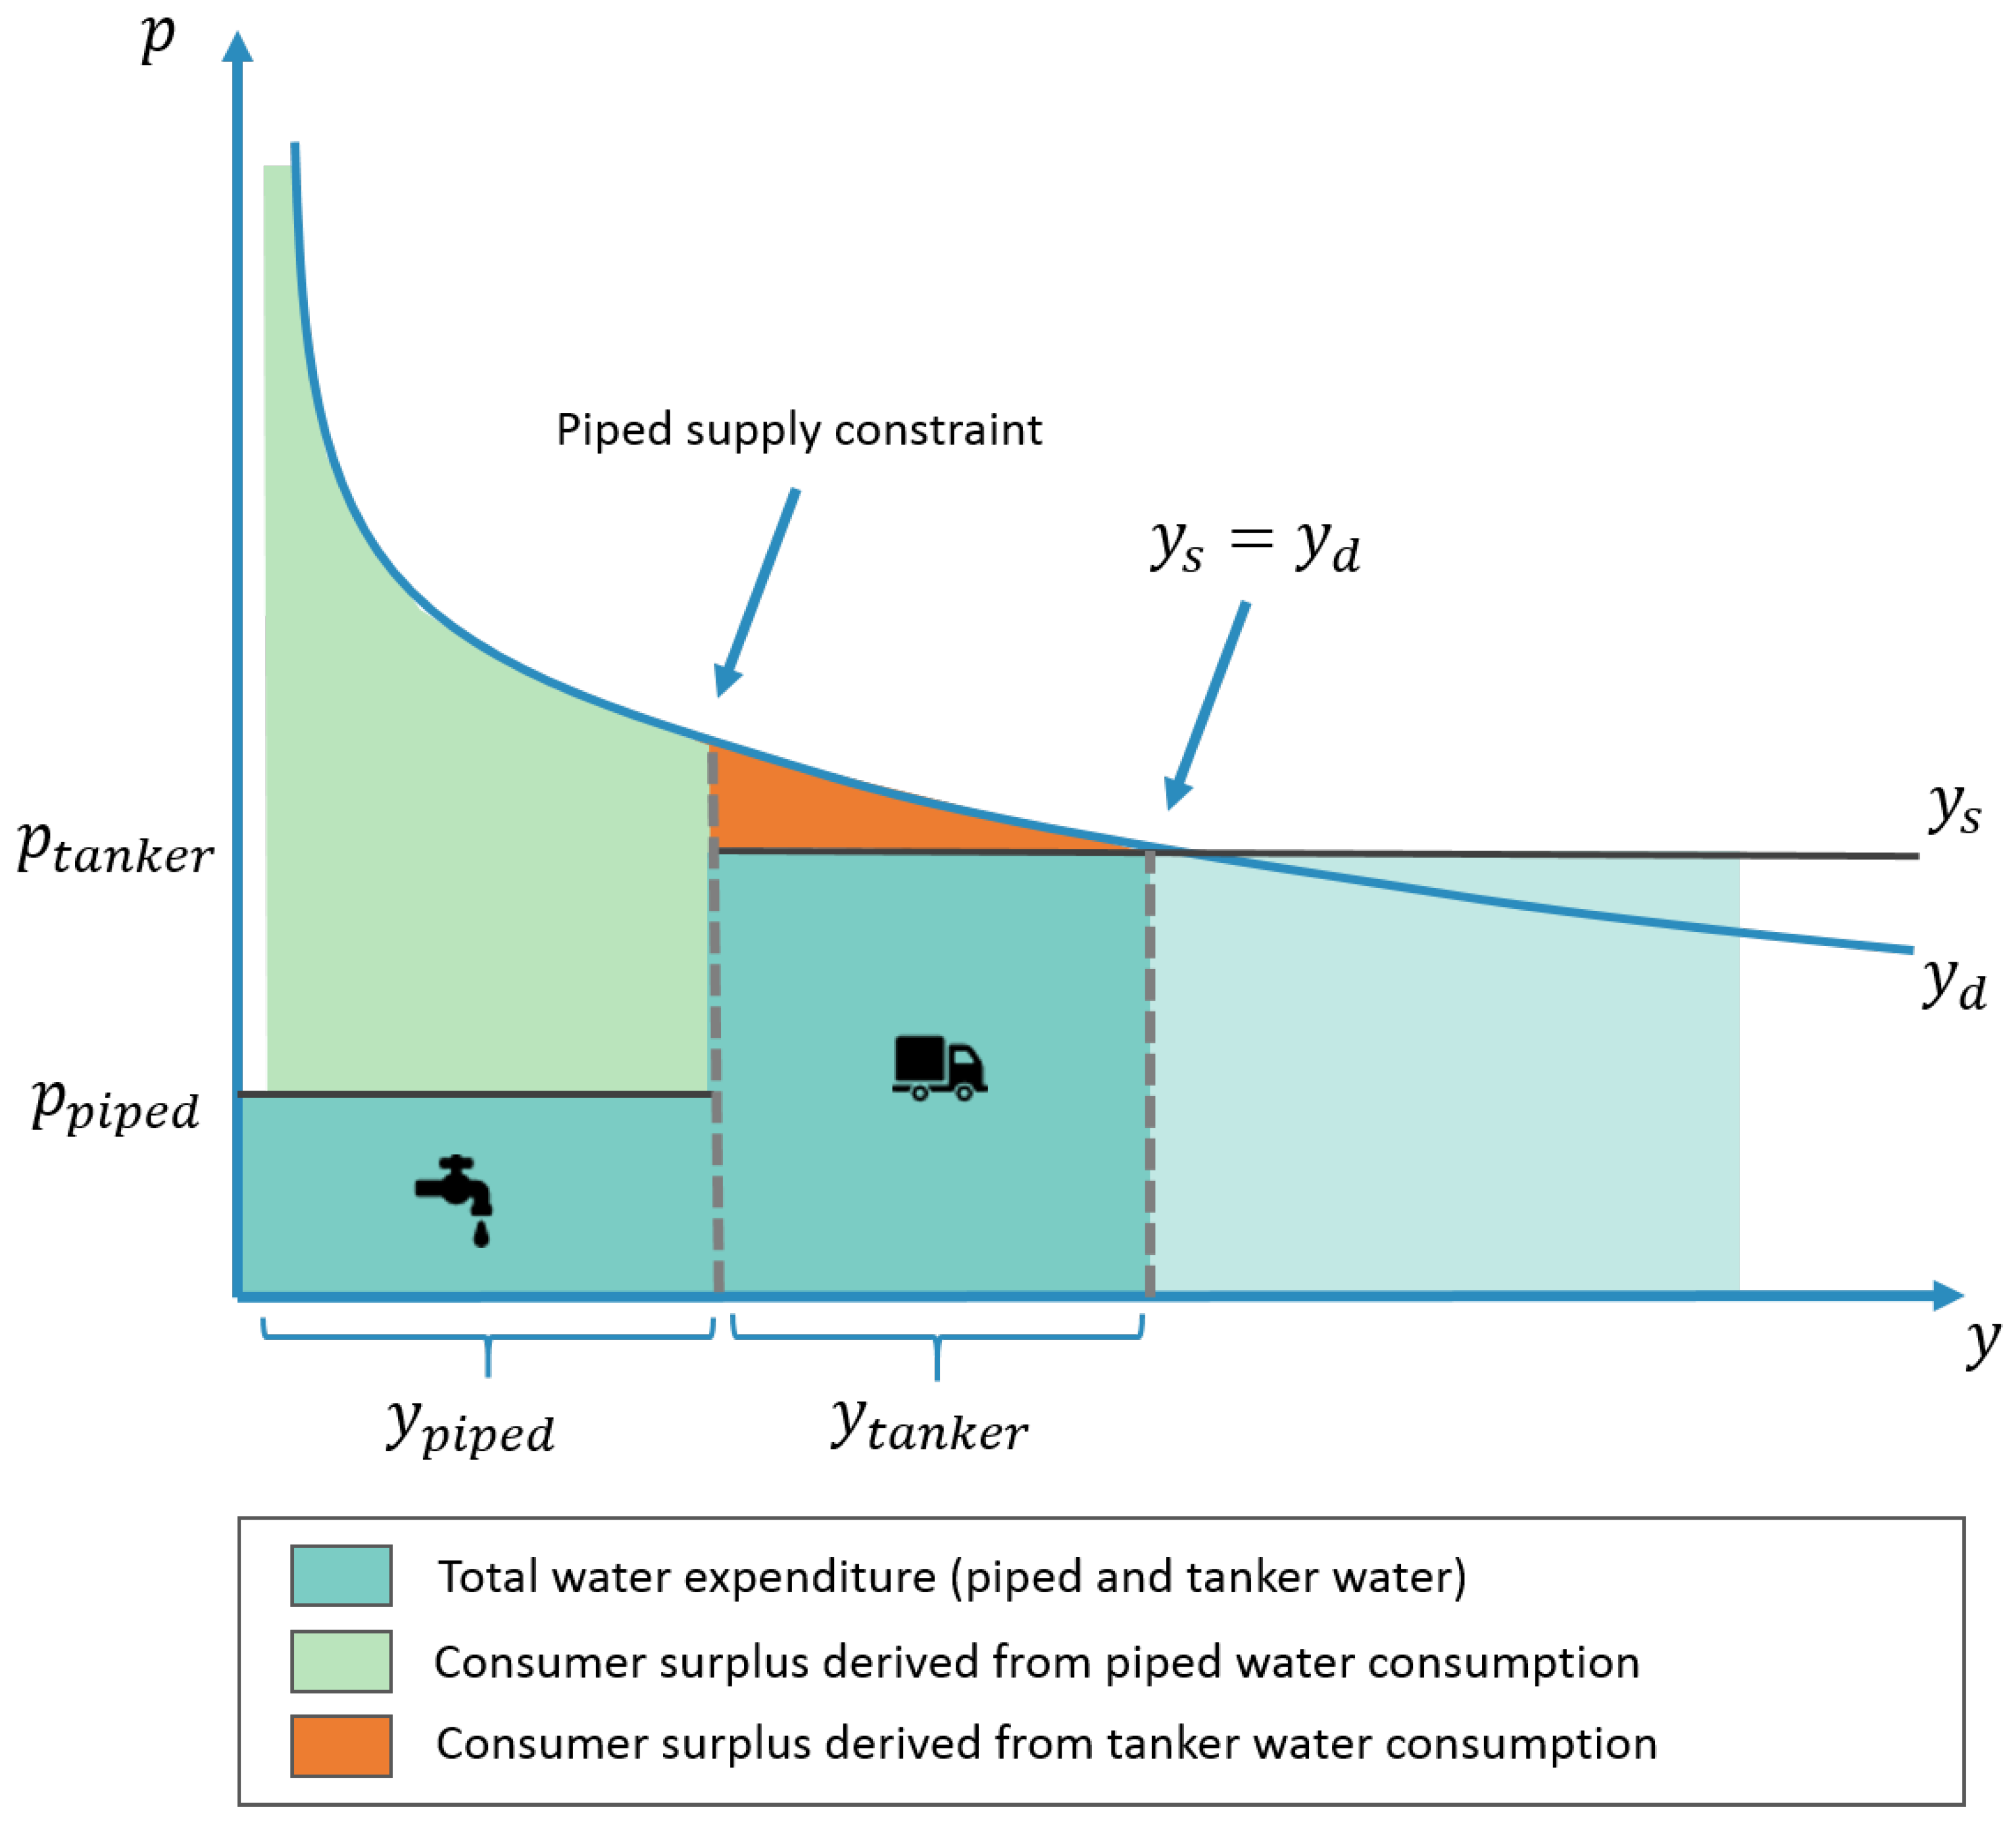
The approach used for the determination of network and tanker water is inspired by the model-based analysis of residential water consumption in Amman by Klassert et al. [19] and expands their approach (cf. Appendix A, Note 6). In their study, the authors discussed water allocations and policy scenarios by adopting the tiered-supply-curve approach that had been applied in a previous study of intermittent supply and tanker water provision by Srinivasan and colleagues [27]. The tiered-supply-curve is advantageous for studying situations in which water users rely on water from multiple sources in different quantities and at different prices. According to Klassert et al. [19], this is because “the consumption quantities from all sources considered and the consumer surplus generated by this consumption can be calculated based on a single demand function” (p. 3647). Figure 1 has been slightly altered from the representation by Klassert et al. for the purposes of this paper and can be used to illustrate the conceptual basis of the tiered-supply-curve approach (cf. Appendix A, Note 7).
It is important to highlight at this point that through this approach and in the conceptual design of the model, water is assumed to be a homogeneous good. This, however, may not be the case in the real world. Studies of residential water use [10,11] have revealed that network and tanker water serve different purposes in households and are viewed as goods with heterogeneous characteristics. Beyond that, the commercials survey has indicated that even groundwater from individual wells is perceived to be of different quality [22]. Thus, there might be varying forms of use in the commercial sector for water from different sources, which could be assessed in future research (cf. Section 6). In the model, we follow the line of reasoning that water from whichever source is stored in the same tank at the user’s site, thus justifying the use of the approach outlined above.
To complete the allocation of tanker water in the model, we further need to establish how the well owners decide to distribute their scarce water. In the real world, they obtain a license from water authorities and can only (legally) sell their water at a fixed rate. Given that they do not have the ability to discriminate prices, the model assumes that the well owners attempt to distribute their water relative to the water needs of the establishments that are sending the drivers (cf. Appendix A, Note 10).
After the allocations of network and tanker water have been simulated, the consumer surplus of each commercial establishment is determined by the model, based on the approach depicted in Figure 1. Consumer surplus is understood in economics as a monetary measure of utility derived from the consumption of a good, which is calculated by subtracting the actual price of the good from the amount of money the consumer is willing to pay for it. In the model, the calculation of this measure serves two purposes: On the one hand, it is a proxy to assess the importance of each source of water for the consumers through the surplus derived from it. On the other hand, it can be used as a baseline for later research to compare the welfare effects and desirability of different water distribution regimes or policy scenarios (cf. Section 7).

3. Model Implementation and Data

The simulation model of commercial water consumption in Amman has been developed by using extensive data sets, which are either publicly available or were obtained in personal communication with officials in the Jordanian water sector. Before this section elucidates on the sources of data and how it was processed for the model, the software that were used for both data processing and model implementation will be presented.

3.1. Software

This analysis was enabled by three free and/or open-source programs. Our ABM of commercial water consumption was implemented in NetLogo [28], a well-established and free multi-agent modeling environment. NetLogo was chosen because of its comparatively low computational complexity and because it allows for the integration of geo-spatial data through its geographic information system (GIS) extension. The different geographic data we use (see below) was processed in QGIS [29]. Finally, we use the open-source programming language R [30] for regression analyses for model inputs and the evaluation of model results (cf. Section 5).

3.2. Model Landscape and Interpolation of Water Supply Data

The spatial environment observed through the lens of the model is the area of the so-called “main” water network of Amman [6]. In personal communication with employees of Miyahuna, ESRI-Shapefiles of the main network and its distribution zones (DZ) were obtained and re-projected to the World Geodetic System 1984, a widely used reference system for geographic locations on planet earth and a projection applicable in NetLogo. All other geo-data was subsequently processed in the same projection.
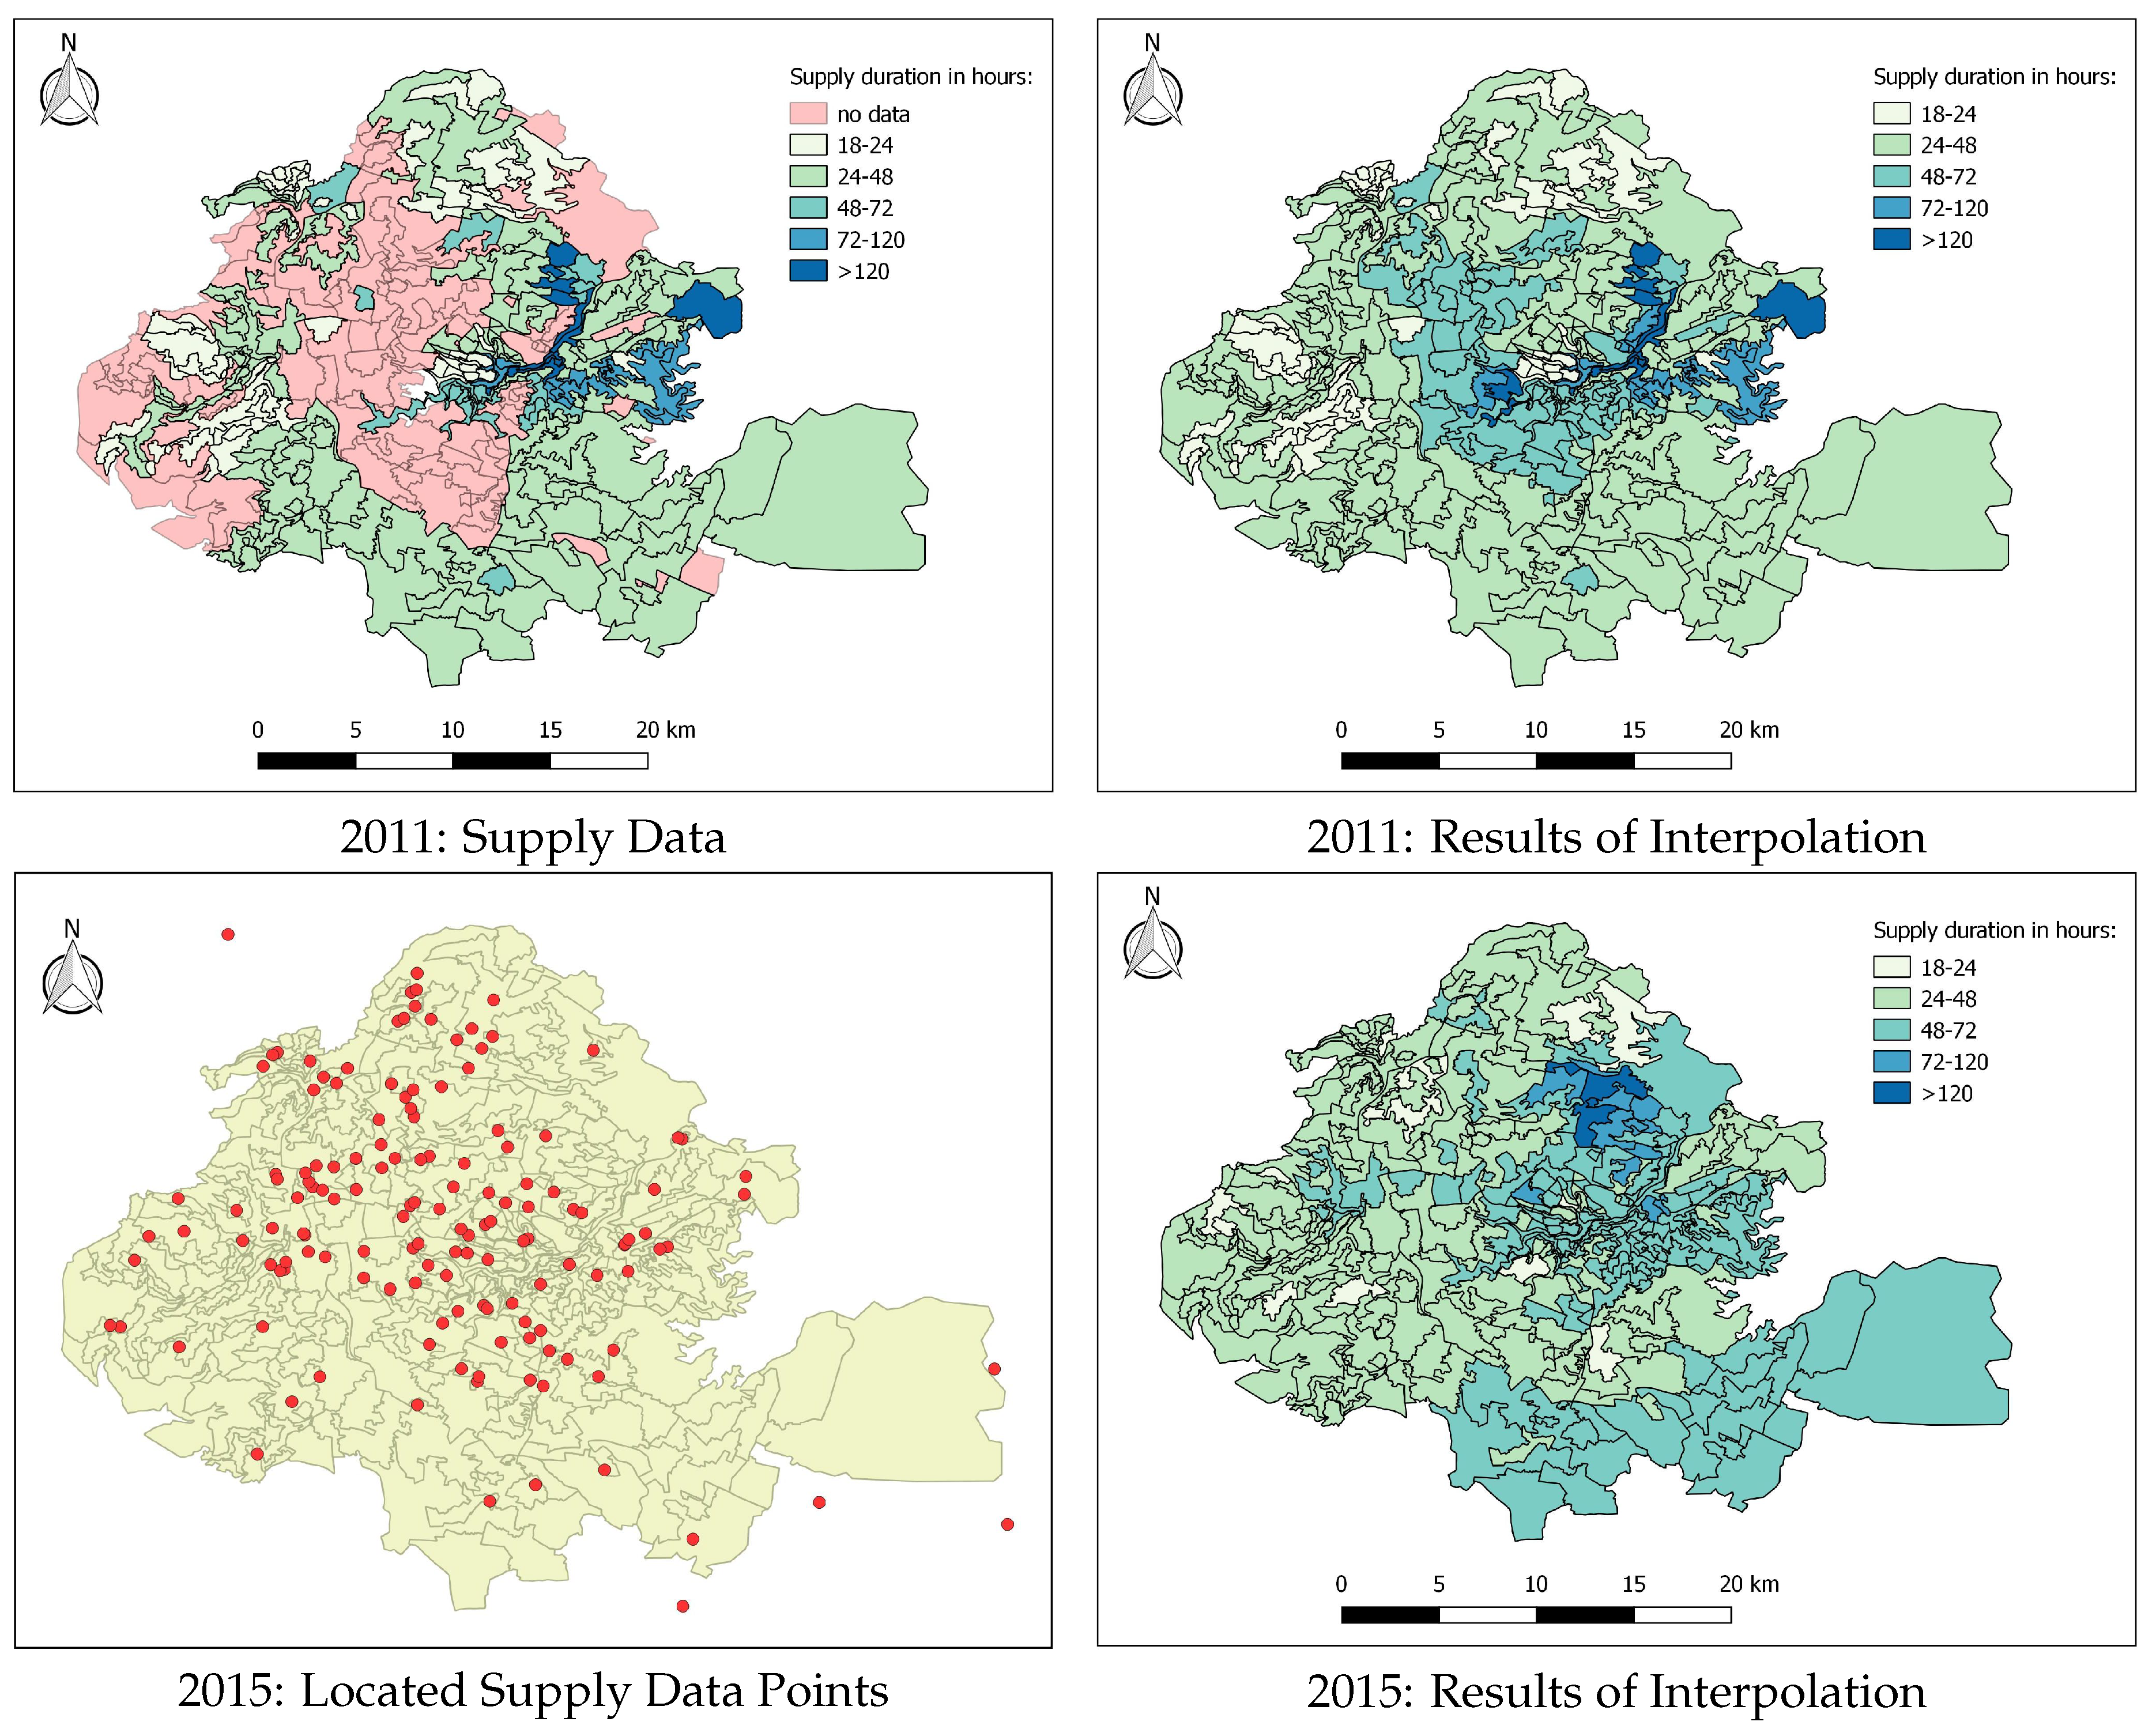
Within the network distribution zones (Figure 2), Miyahuna supplies water with diverging weekly durations from 18 h per week up to 168 h (continuous supply). Supply duration (SD) data could be obtained for two years: Firstly, Abu Amra and colleagues [31] have reported population numbers and SD for each distribution zone as part of a consultancy project for Miyahuna in the year 2011. Secondly, the Water Authority of Jordan (WAJ) has released SD data for the year 2015. This data, however, has been published in Arabic and does not report the supply duration for DZ directly but instead references certain neighborhoods or streets in Amman with supply data. These places were, as far as possible, located through the google maps search engine in Arabic language and then blended with the DZ-locations in QGIS. As a result, two data sets of supply durations are available (Figure 2, left side), with additional population information for the year 2011. We decided to run the model on both data sets for two reasons: First, the descriptive content of the model is increased, particularly because the network water availability in Amman grew considerably between 2011 and 2015, due to the finalization of the Disi Water Conveyance Project [8]. Secondly, the use of two data sets is a good measure for the robustness and consistency of the model.
In both sets of supply duration data, significant gaps remained. One way to close these gaps would be to fill all data gaps with the average SD of the data set. This, however, would have reduced the high spatial resolution of the model by removing differences between DZ. In addition, this would ignore the fact that adjacent areas rarely have strongly diverging SD, as can be seen in the top left supply regime in Figure 2, which might be a necessity for network management. Therefore, in order to fill the supply duration gaps, a raster analysis of available data was performed as the basis for a spatial interpolation. The analysis was enabled by the Inverse-Distance-Weighted method from the QGIS Interpolation plugin (cf. Appendix A, Note 11), which yielded weighted SD data for all DZ without supply information (Figure 2, right side). While it is uncertain how good the fit of this approach with reality is, it reveals a supply regime with observable regional differences that does not distort the overall average SD significantly, which for instance amounts to 48.32 h/week after interpolation vs. 48.01 h/week in the original data set for the year 2011. Pervasive access to real data, however, would be an asset for future model versions.
Another relevant data gap was missing information regarding population numbers which were used to estimate the number of commercial establishment agents (see below). Population numbers were unavailable in the 2011 data set for areas without SD data and missing in the 2015 data altogether. The gaps in the 2011 data set were filled by contrasting the sum of population in all DZ with population data for the five main subdistricts of Amman (Amman Qasabah, Marka, Al-Jami’ah, Wadi Essier & Quaismeh) in the year 2011. This data stems from the Department of Statistics of Jordan (http://web.dos.gov.jo/), which performed population censuses in 2004 and 2015. Under the assumption of constant population growth, data for 2011 was extrapolated and juxtaposed with the data from Abu Amra et al. [31]. The result was a deficit of 101,201 inhabitants in the latter data set. The ‘additional inhabitants’ from the DoS censuses were now distributed equally among those DZ without population information. The data from the censuses could also be used to calculate population growth rates for subdistricts between 2011 and 2015, in order to ‘update’ the population data on a DZ level obtained from Abu Amra et al. [31]. Unfortunately, the subdistricts do not match exactly with the DZ areas, leading to geographic overlaps. The population data of each DZ was therefore updated by measuring in QGIS to which fraction it lies within which subdistrict(s) and by applying the growth rates of all subdistricts that the DZ ‘touches’, weighted by area overlap.

3.3. Commercial Categories and Spatial Distribution

After the model landscape is created and equipped with two SD data sets, it requires agent populations, particularly commercial establishments. Commercial agents are created in all distribution zones apart from those that are excluded from intermittent public water supply, such as the Royal Palace or the University. This, along with supply durations and the locations of the groundwater wells (see below), already introduces spatial differentiation in a comparatively high resolution, particularly in comparison to earlier models.
Notwithstanding this, it is also interesting to differentiate between commercial establishments. There are at least two relevant distinctions that immediately come to mind: Company size and business sector. The former is introduced into the model by creating establishment agents in five size categories, measured by the number of employees: 1–4, 5–19, 20–49, 50–99, and 100 or more. This classification is used and recommended by the World Bank [32] for enterprise surveys. Data on the number of employees was included in the survey questionnaires for the commercial survey in Amman by Sigel et al. [21] and in establishment data from the Department of Statistics [23,33], which are both relevant sources for the model. It is also the basis for the estimation of a commercial demand function by Klassert et al. [34] which is a core element of the model. Because the availability of data on establishments in different business sectors was much lower, this distinction is not included in the model.
The remaining question was how many establishments of each category should be created in each DZ of the model. Because no data on the commercial sector of Amman is available in this high resolution, we examined whether a significant correlation can be established between the number of people living in a region—information which was either available or extrapolated for the DZ level—and the number of commercial establishments located there. Both population and commercial establishment numbers have been documented on a Governorate level [23,33]. This data was used to perform a log-log-regression of population density and establishment density for all commercial categories. Relevant statistical parameters of the regression analysis are listed in Table 1.
The results show significant correlations and are therefore used in the model to populate the DZ. At the initialization of the model, the number of commercial establishments in different size categories (superscript j) in each DZ (superscript i) is determined by inserting the residential population, the area, and the intercept and coefficient from Table 1 into the following equation:
n commercial i , j = exp ( intercept j + coefficient j · log ( pop i area i ) ) · area i i , j
This establishes the total number of establishments in each of the five categories per distribution zone. The model further distinguishes between those establishments that have a connection to the network and those that do not. This distinction is included due to observations from the commercials survey carried out by Sigel et al. [21,22]. The survey found that significant fractions of establishments across all sizes claimed to not be connected to Miyahuna’s network. Thus, in each DZ and category, n commercial is split up in shares of connected and unconnected establishments ( x ( un ) connected ):
n unconnected i , j = n commercial i , j · x unconnected j i , j n connected i , j = n commercial i , j · ( 1 x unconnected j ) i , j

3.4. Groundwater Well Data

The second relevant group of agents are the well owners, which sell groundwater to tanker drivers, who in turn transport it to their commercial customers. Most of the groundwater wells included in the model were visited during the well operators survey by Sigel et al. [21,22]. From these interviews, abstraction volumes for wells were gathered whenever the interviewee was willing to render this information. Out of the 21 wells considered by the model, geo-information on 18 wells stems from the survey of Sigel and colleagues. This data was supplemented with a data set on wells and their yield rates acquired from WAJ in personal communication.
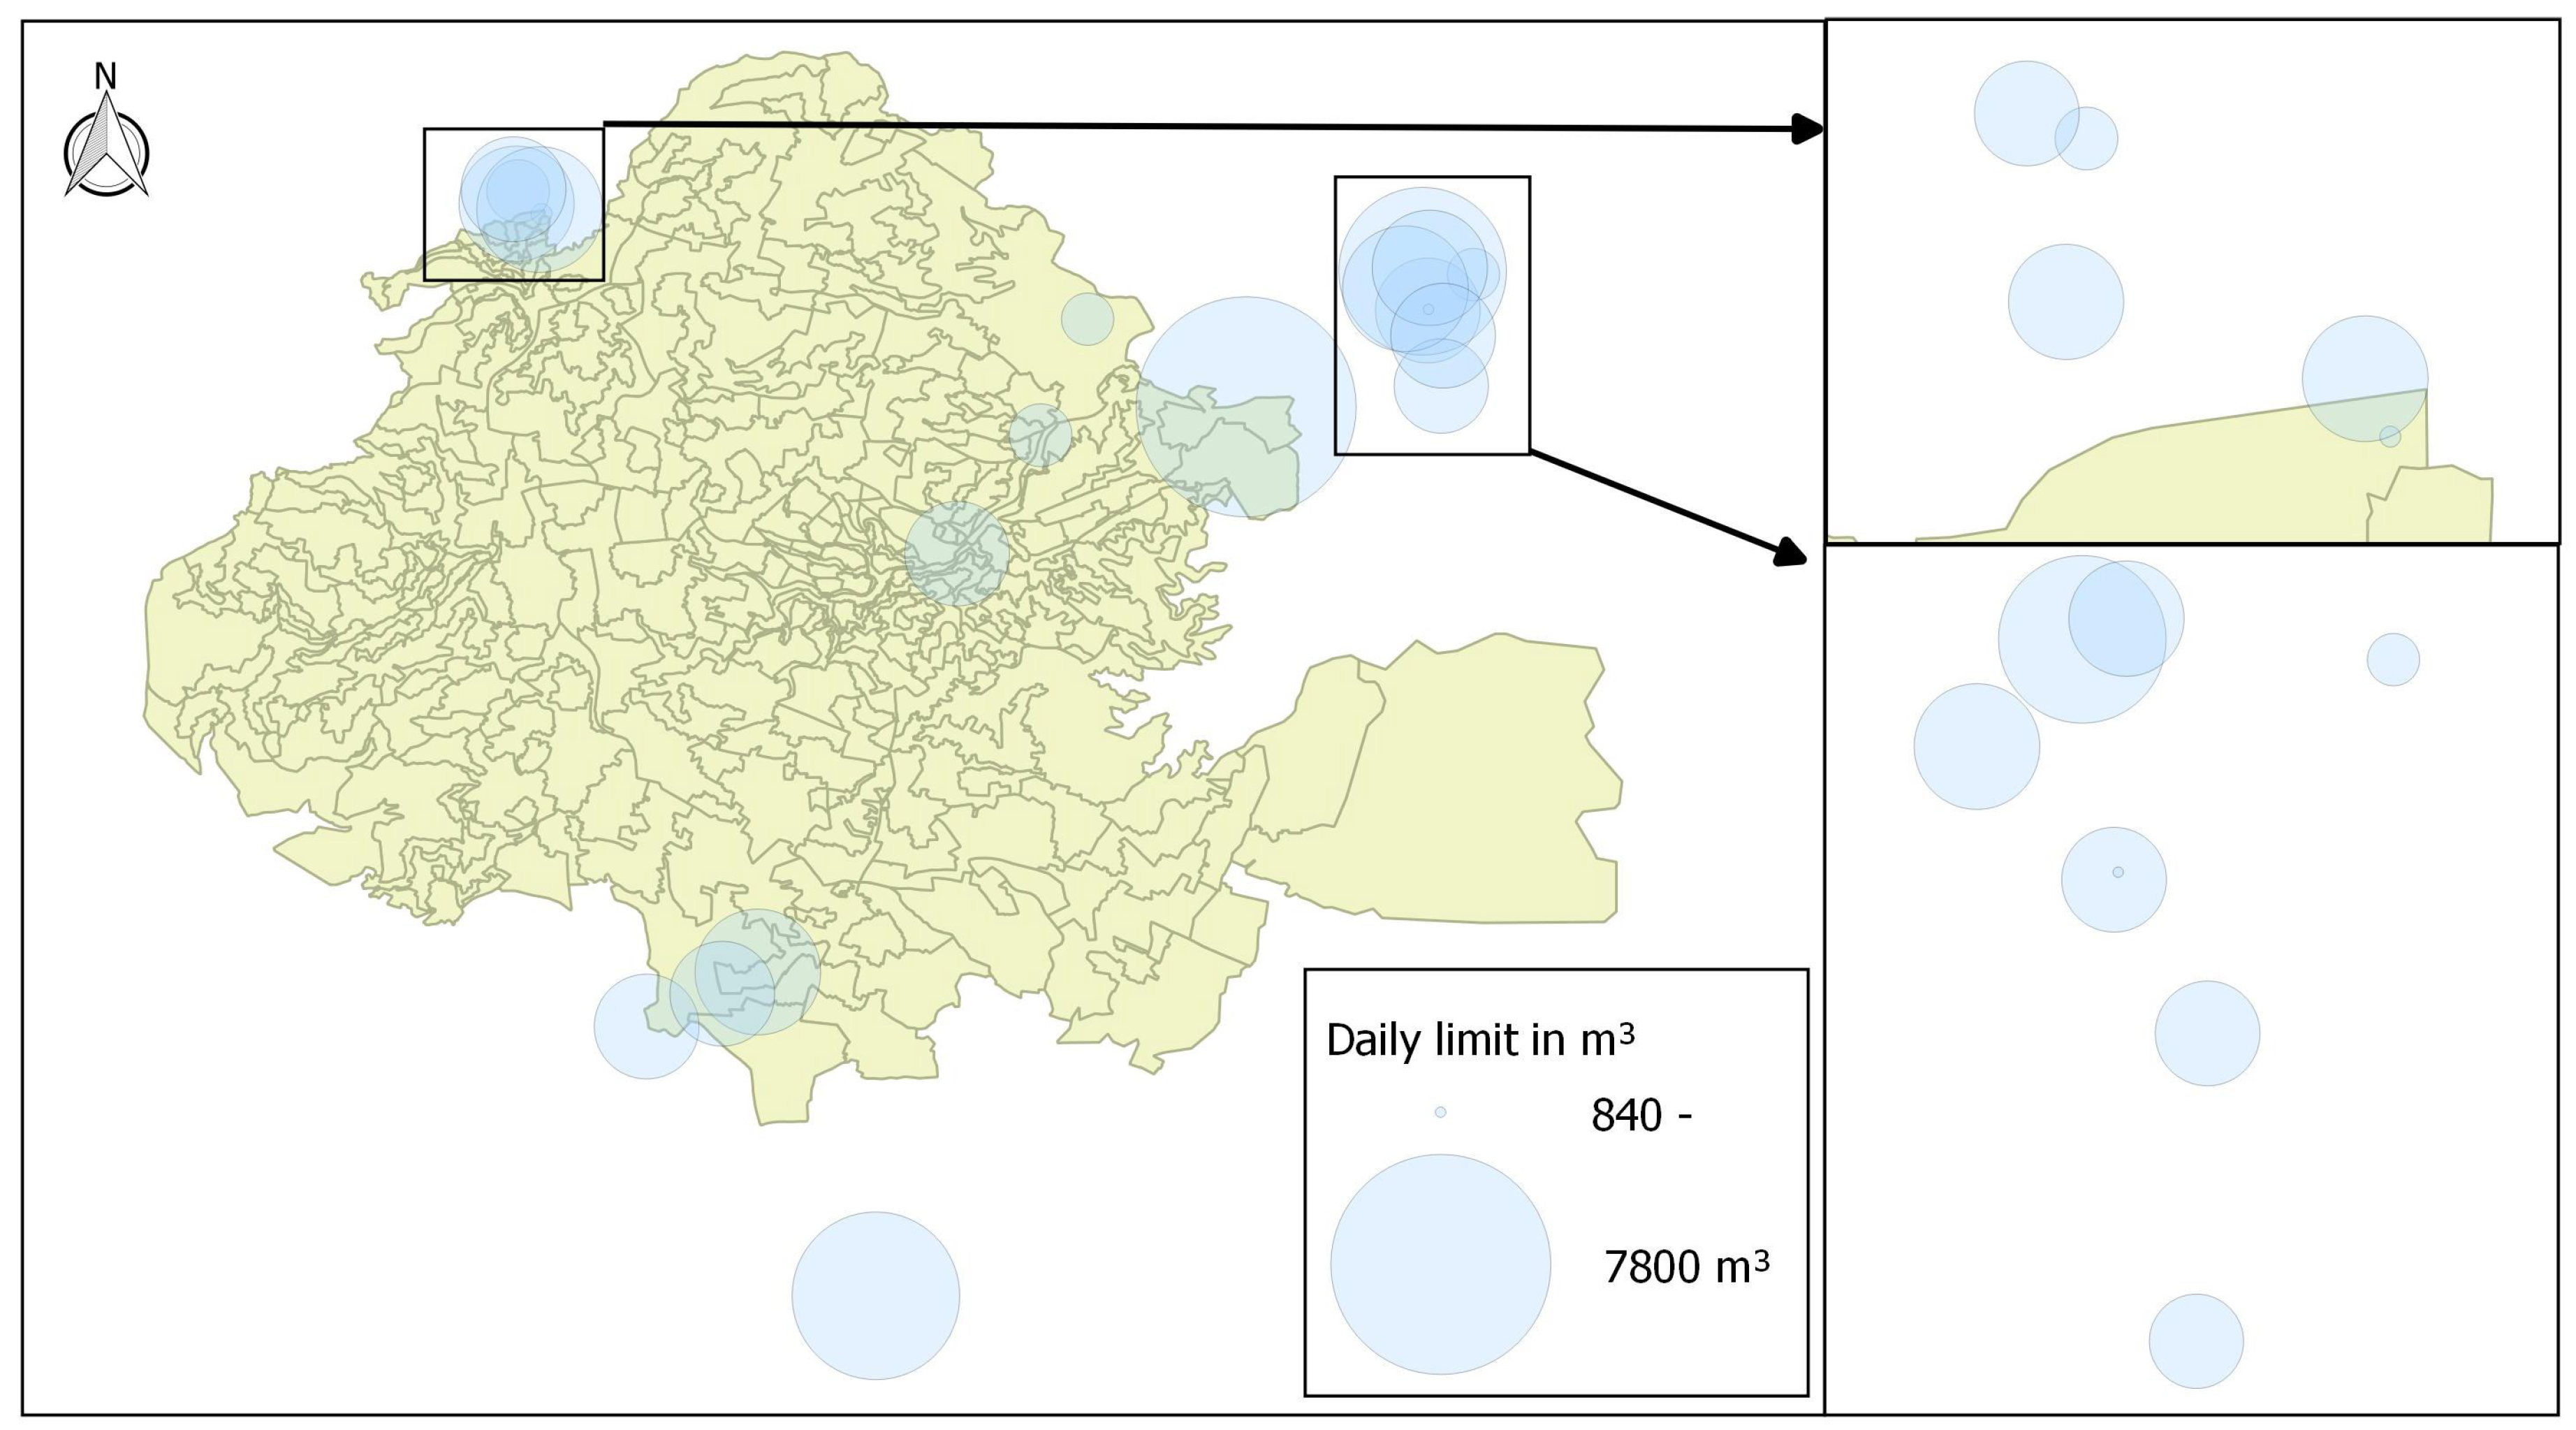
The statements of interviewees concerning groundwater extraction and the data of WAJ suggest that the amount of tanker water (cf. Appendix A, Note 12) sold per year in Amman amounts to roughly 6 million m3. If 52% of tanker water is sold to the commercial sector, as preliminary results of the tanker drivers survey suggest, this would imply an annual commercial tanker consumption of around 3.1 million m3. This value, however, should be treated with care because it seems likely that well operators might understate their pumping behavior to avoid the impression that they overabstract groundwater beyond their licensed yield rates. In reality, abstraction rates or volumes might be higher than the available data suggests. This, in addition, does not take abstractions from illegal wells into account. The suspicion that the groundwater abstraction data is not trustworthy was substantiated in the survey with commercial establishments, which have fewer or no incentives to conceal their tanker water consumption and who claimed on average that their (volumetric) tanker water consumption is slightly higher than their network water use (59% tanker vs. 41% network water). Moreover, the majority of the establishments which refrain from consuming network water and rely on tanker water exclusively claimed to do so by choice, due to the higher availability of tanker water, its price or its quality. For these reasons, much higher water volumes are likely to be sold in the tanker water market in Amman than the initial value presented above suggests. Because the real extent of the tanker water market and the volumes consumed by the commercial water sector are unknown, we chose to approximate these through yearly commercial network consumption, following the indications from the commercials survey. Network water consumed by commercial establishments in Amman was estimated at roughly 14.5 million m3 in 2011 (cf. Appendix A, Note 13) and 18.3 million m3 in 2015 [35]. If, according to the survey, roughly 60% of bulk water consumption is tanker water, this would imply a sector-wide consumption of about 27 million cubic meters in 2015. These figures, however, stand in stark contrast to the aforementioned 3.1 million m3 of commercial tanker water consumption calculated from official yield rates. We therefore chose to rely on a middle value between 3 and the 27 million m3 of available tanker water and decided to scale up the documented well yields by the factor 5 across our data set. This results in a yearly availability of tanker water of 15.6 million m3, a value between official numbers and the rough estimation based on the survey, which amplified the groundwater yields on the absolute level but kept relative variations between the wells constant. This approach assigns the water availability we assume to documented wells and ignores the existence of other groundwater pumping facilities. Thus, the water volumes attributed to certain wells here might be different in reality. Note that the well abstraction values are used in the model for both 2011 and 2015 because no data was available that reflected temporal changes between both years with regard to well existence or yield. The 21 groundwater wells that constitute the ‘producers’ of tanker water in the model are depicted in Figure 3.

4. Materials and Methods

Building upon the conceptual structure and data sources of the model, which were explored in previous sections, we will present in the following how the model was implemented in NetLogo. In particular, we discuss the commercial water demand function, the allocations of network and tanker water and the calculation of welfare.

4.1. Commercial Water Demand

One of the prerequisites of the allocation processes specified below is the determination of the water demand of commercial agents. Klassert and colleagues [34] have estimated a commercial water demand function, using the same survey data [21,22] that this analysis draws upon. Therefore, a preliminary version of their commercial demand function estimate, available at the time of this analysis, is considered applicable for our model.
y water i , j = exp ( b price · p water i , j + z j )
with
z j = a 0 + b empl · x empl j + b urb · x urb j + b vendor · x vendor j + b hotel · x hotel j + b toilet · x toilet j + b storage · x storage j + b summer · x summer
Specific values for the parameters of Equations (3) and (4) can be found in Table 2. As becomes apparent, an establishment’s demand for water is determined by the water price ( p water i , j ), the number of employees and toilets ( x empl j & x toilet j ), the size of its water storage ( x storage j , for additional reflections see Note 14 in Appendix A), the season and whether in its size category, water vendor shops and hotels are common ( x vendor j & x hotel j ). In contrast to the Jordanian-wide application for which this preliminary demand function is developed, the “urban dummy” is assumed to be 1 for all categories because the demand occurs in a completely urban setting. The variable x summer is set to the value 1 for all model runs in summer and to 0 for all in winter.

4.2. Network Water Allocation

The first of the two allocation processes simulated by our model is the network water allocation. If the aggregate demand for network water of all connected establishments exceeds the volumes available from Miyahuna, some form of distribution mechanism needs to be in place. While this distribution hinges on operational cost and constraints of the piped network and on decision-making in water institutions in the real world [19], the model requires assumptions to execute the allocation of network water. The allocation process, further specified below, is summarized by the pseudo-code in Table 3.
In a first step, the network demand y network i , j of each establishment of size j in DZ i is calculated by using Equation (3) and inserting the unit price of network water p network v a r as well as category-specific parameters.
Now, the available network volume Q network is distributed among the connected establishments. Two factors are assumed to determine how much water is allocated to whom: (i) the supply duration and (ii) the size of the establishment. The former assumption is relatively straightforward because whoever enjoys supply for a longer period of time seems more likely to be able to abstract more water from the network. The assumption that “size matters” is based on statistical evaluation of the commercial survey by Sigel et al. [21]. The size factor ( S F ) was calculated by dividing the surveyed network abstractions of commercial establishments by their supply duration. Then, mean abstractions per hour were calculated for each size category. The smallest category (1–4) serves as the “baseline” establishment with S F = 1 , while the size factor of the other categories was calculated by dividing the mean abstraction of that respective category with the mean abstraction of the smallest category. The results of this evaluation can be found in Table A2 in the Appendix B. This becomes relevant for the determination of n SEE (Small Establishment Equivalent), a hypothetical number for which establishments of all sizes are converted into their ‘equivalent’ of small establishments with 1–4 employees and summed up. An establishment with 100 or more employees, for instance, receives roughly six times the amount of network water than an establishment in the category of 1–4 employees can get in one hour and therefore enters the allocations as about six small establishment equivalents. Now, we divide Q network among all small establishment equivalents to receive an—again hypothetical—mean network abstraction:
a b s mean hyp = Q network n SEE
with
n SEE = n connected i · S F j i , j
In a next step, the individual supply durations are factored in by establishing the supply duration factor ( S D F ), the supply duration of a specific establishment divided by the mean supply duration of all small establishments equivalents n SEE . This factor determines for how long a commercial establishment receives water in relation to the average. S D F i > 1 indicates a network access longer than the average and vice versa.
S D F i = S D i , j S D SEE i n SEE n SEE
The actual network abstraction of a specific establishment is simulated in the model by multiplying the hypothetical mean abstraction from Equation (5) with the size and supply duration factors:
a b s n e t w o r k i , j = a b s mean hyp · S F j · S D F i n connected
For an individual establishment, this process of allocating network water has two possible outcomes:
  • Case 1: a b s network i , j < y network i , j
    The establishment has received less water than it demanded at the network tariff and enters—unless further network water can be distributed (see below)—the tanker water allocation.
  • Case 2: a b s network i , j > = y network i , j
    The establishment receives exactly the quantity it demanded and abstains from further water distribution processes. If the procedure allocated more water to an establishment than it demands at the given price, the model collects the excess water ( ( a b s network i , j y network i , j ) ) and distributes the “leftovers” by reiterating through the allocation process.
The model loops through the network allocation procedure until all water is distributed or no establishment is interested in any further consumption. From the second round of the allocation onward, the demand calculated by using Equation (3) is reduced by the abstractions in previous rounds. In a final step, the expenditure for all network water, which was consumed by an establishment, can be calculated:
e x p network i , j = a b s network i , j · p network v a r + p network f i x 91.25 i , j
The expenditure for network water includes the daily abstraction, multiplied with the unit price of water, and a basic charge for a network connection raised by Miyahuna ( p network f i x ), which is collected on a quarterly basis and therefore divided by 91.25 to establish a daily share of the basic charge.

4.3. Tanker Water Allocation

In the sequence of the model, the tanker water allocation is simulated next. It begins again by adapting Equation (3) to calculate demand for tanker water at different prices, which is reduced by potential previous abstractions from the piped network.
y tanker i , j , k = exp ( b price · p tanker i , k + z i , j ) a b s network i , j i , j
The tanker price p tanker i , k that commercial establishments pay is the sum of two elements: first, a legally prescribed, fixed price per cubic meter water that well owners are allowed to charge ( p tanker f i x ), consisting of a unit price of 0.5 JD/m3 (cf. Appendix A, Note 15) and a water tax of 0.25 JD/m 3 [22]. The second element of the price of tanker water (for the end consumer) is a variable element depending on the distance d i , k between an establishment and a well (superscript k). Tanker water prices for all possible combinations of establishments and wells are calculated in the following way:
p tanker i , k = p tanker f i x + p tanker v a r · d i , k i , k
The model calculates the distance between establishments and wells by applying the Haversine formula (cf. Appendix A, Note 16) in Equation (12), which is used in the geo-sciences for calculating distances between locations by using their latitude and longitude.
d haversine i , k = π 180 · arccos ( sin l a t i · sin l a t k + cos l a t i · cos l a t k · cos ( l o n g k l o n g i ) ) · 6371 k m i , k
This, however, is only the distance ‘as the crow flies’ and needs to be increased by some measure because tanker trucks travel on roads. We have therefore used the circuity factor calculated by Ballou and colleagues [36] to account for this. Since Jordan is not among the countries studied by the authors, we multiply the distances from Equation (12) by Turkey’s circuity factor (1.36). This assumption was made because Turkey was the only country from the Middle East and with an equally developed infrastructure available in the study of Ballou et al. [36].
d i , k = d haversine i , k · 1.36 i , k
Now, the prerequisite of the tanker water allocation—the prices resulting from all possible combinations of establishments and wells—is established by the model. The allocation is organized in rounds: In the first round, each commercial establishment sends out a tanker driver (cf. Appendix A, Note 17) that heads for the closest well. In the second round, the same happens again, unless the closest well has no more water. In that case, the tanker drivers head towards the second closest well (and to the third and so on). Whenever a commercial establishment can meet its entire demand through the water it receives at a well in a round, its tanker driver drops out of the allocation process.
Since the tanker water which is consumed by an establishment might stem from different wells, accessed in a specific succession, the demand for water at a well needs to be adapted after each purchase, i.e., y tanker i , j , k is reduced by previous well purchases (cf. Equation (17)).
As we mentioned before, we assume that the well owners attempt to grant access to their water proportional to the water demand or willingness to pay of an establishment. The amount of water they can offer during one day is the abstraction rate of the well, multiplied by 24 h:
a b s limit k = a b s rate k · 24 k
To avoid those establishments that are close to a well exploiting it in the first round, before others are able to access it, the maximum amount that each can purchase in one round is limited to 0.01 cubic meter. By doing so, the water volumes that each commercial establishment purchases converge towards an allocation that reflects their willingness to pay. This results in an allocation process which can occur in rounds but is closer to the result that a fully efficient market would produce than a model following the “first come, first serve” principle, which—in the case of our model—would produce unrealistic patterns of water use. In the model, this approach is implemented through the following equation, which determines the amount of water one commercial establishment receives per allocation round as the share of its willingness to pay in a reference value ( y ref ) (cf. Appendix A, Note 18):
request i , j , k = y tanker i , j , k y ref · 0.01 establishments i , j at well k
In the case that the sum of requests of all commercial establishments at a certain well are below its water availability, all abstract what they requested. Here, it could occur that a commercial establishment receives exactly the amount of water it demanded for the price at this well (cf. Appendix A, Note 19). If so, all establishments for which this holds true abstain from participating in further allocations. In the case that the sum of the requests of all establishments at a well exceeds water availability, the well owner seeks to distribute his available water proportional to the water demand of the requesting establishments. This is reflected in the equation below, which specifies the amount of water that a specific commercial establishment receives at a well with or without enough water for all requests:
a b s tanker i , j , k = request i , j , k i f request i , j , k a b s limit k a b s limit k · request i , j , k request i , j , k i f request i , j , k > a b s limit k
After each round, the well owners decrease the available water by the sum of all water they sold during the round. If all water is sold, the well is shut down for the day. This process is repeated by the model in a loop until either all establishments could satisfy their demand at some point or every well has been exploited fully. Similar to the procedure of the network allocation, the tanker water demand function is adapted from the second round onward by subtracting previous abstractions:
y tanker i , j , k = exp ( b price · p tanker i , k + z i , j ) a b s network i , j a b s tanker i , j i , j
In the end of the allocation process, it is likely that each establishment received water from several wells. The expenditure for the entire delivery is calculated based on the “last” (marginal) price that the tanker driver incurred—the added charge constitutes the premium of the driver. An establishment’s expenditure for tanker water is calculated as follows:
e x p tanker i , j = p tanker final , i , j · a b s tanker i , j , k

4.4. Determination of Welfare

The results of the network and tanker water allocations can be used to establish the consumer surplus which commercial agents derive from water consumption. This can serve as an indicator for the utility that a commercial establishment derives from consuming the water it uses. The consumer surplus can further be used for analyses of the water allocation (see Section 5) to, for instance, compare commercial welfare in different locations of the city. There are three water supply modes resulting from the allocations above: An establishment consumes either network or tanker water exclusively, or it relies on both water sources. As discussed in Section 2, the welfare derived from the consumption of water is equal to the area between the demand curve of an establishment and one or two blocks, indicating combinations of price and quantity (cf. Figure 1).
The generic equation for consumer surplus from one block, ranging from quantity q 1 (cf. Appendix A, Note 20) to q 2 , is:
C source i , j = q 1 i , j q 2 i , j p i , j ( q i , j ) d q i , j p 2 i , j · ( q 2 i , j q 1 i , j )
which can be rearranged to
C source i , j = h ( q 2 i , j ) h ( q 1 i , j ) p 2 i , j · ( q 2 i , j q 1 i , j ) with h ( q i , j ) = ( ϕ 1 ln q i , j ϕ 1 + ϕ 2 ) q i , j with ϕ 1 = 1 b p r i c e ; ϕ 2 = z j b p r i c e
The consumed quantities can be used to set the boundaries for the calculation of the integer that yields the consumer surplus. Where only one source of water is used, the larger quantity ( q 2 ) is the quantity of either network or tanker water that was abstracted and the smaller quantity is set at 0.001 m3. In the third possible situation, where both water sources are consumed, this also is the method of calculating the consumer surplus derived from network water consumption because it is the first block that has been consumed (cf. Appendix A, Note 21), thus starting at the left side of the coordinate system (at quantity 0.001). For the surplus from tanker water, on the other hand, q 1 is set to the network consumption ( q 1 = a b s network i , j ), while q 2 is the total water abstraction. By calculating welfare in this fashion, exact shares of total consumer surplus can be attributed to each water source. The total welfare from both water sources assumes once more that q 1 = 0.001 . The combined abstracted quantities of tanker and network water constitute q 2 in this case.
C i , j = C source i , j
The welfare of the entire commercial sector, attributed to both bulk water sources is then:
C source total = C network i , j if source is network water C tanker i , j if source is tan ker water

5. Results

In this section, we present the most relevant results of our simulation model of commercial water consumption in Amman. These include new insights on tanker water use in commercial establishments, differentiated by size and location. We observe strong spatial and seasonal variations of water consumption and a strong participation of the commercial sector in tanker water markets, particularly among large establishments. A comparison of model runs for the years 2011 and 2015 shows that the Disi Water Conveyance Project has impacted tanker water provision considerably.

5.1. Water Allocations and Seasonal Effects

The results of our simulation (Table 4 and Table A3) suggest that at least parts of the commercial sector use tanker water to meet their needs. According to the model, the commercial sector in Amman consumed around 8.7 million m3 of tanker water in 2011 and approximately 9.7 million m3 in 2015. This implies that our simulated numbers are about three-fold of those calculated from official well yields (cf. Section 2.2), which will be discussed in the next Section. It is not surprising that significant shares of commercial establishments rely on tanker water exclusively—this was assumed a priori in the design of the model and based on the survey data. What the simulation indicates beyond this, however, is that among commercial water users with a network connection, tanker water is frequently used to supplement the deliveries from Miyahuna. Particularly, establishments with 20–49 and more than 99 employees seem to use both sources of water, as Table 4 illustrates.
As a result of the extensive involvement of the commercial sector in the tanker water market, considerable contributions to welfare derived from water consumption can be attributed to groundwater extraction in and around Amman. According to our simulation, the commercial sector in Amman derived around 64 million JD from consuming tanker water in 2011 and roughly 73 million JD in 2015. These numbers are almost equivalent to the welfare contributions of piped water, which amount to approximately 68 and 71 million JD in 2011 and 2015 respectively. While a comparison of these numbers is easily possible for those establishments that rely on one source or the other exclusively, it is less straightforward when looking at the welfare of those establishments which use water from both sources. Here, it becomes apparent that in the calculation of consumer surplus, network water enjoys a ‘pole position’. In the four smaller size categories, this has the effect that the average contributions of tanker water to consumer surplus are only marginal, while welfare contributions are higher among establishments with a large number of employees, which seem to use tanker water as an essential production input.
The seasonality of water demand has relevant effects on the allocations. The quantity constraint for network water is irrelevant in winter, because all connected establishments receive enough water for their needs (cf. Table A3). This implies that the cheap network water can be allocated to less essential uses during the winter months. Tanker water, in contrast, is only available at low rates in limited volumes. The succession of well exploitation therefore increases the price after a while and thus constrains water use—with a strong spatial variation though, as explained in the following section. Competition for tanker water is much stronger in summer because the network allocation leaves many water users unsatisfied. Therefore, the average price of tanker water is considerably higher than in winter, as economic theory would suggest. In the model, this effect arises because the ‘cheap’ wells close to the city run out of water. The available quantity of tanker water is never consumed fully because the price of tanker water increases concurrently with the distance between consumer and well. Therefore, tanker water quantity constraints become only relevant for individual wells which are frequented more than others.
The model results indicate that the finalization of the Disi Water Conveyance and the resulting higher availability of network water has decreased commercial tanker water use on an individual level, particularly in establishments with few employees that have low water demand. It seems reasonable to assume that this also created co-benefits for commercial establishments relying only on tanker water, because it decreased their competition for water from cheaper wells. This is not reflected in the tanker water prices because the commercial sector, according to our model, grew by almost 20% in four years and with it the number of unconnected establishments. The expansion of network water availability thus merely averted an even stronger competition for water from “cheap” wells.

5.2. Spatial Observations

The local differences in network supply durations and the geographic dispersion of groundwater wells around Amman create patterns of strong spatial differences. Geographic (dis-)advantages in access to network water are a direct result of Miyahuna’s supply regimes (Figure 2). The ability of establishments in the different distribution zones (DZ) to meet their water needs through the tap determines their participation in the tanker water allocation. Thus, Miyahuna’s supply durations have direct effects on the tanker water allocation as well, although only during the summer months, when the network quantity constraint becomes relevant. One of the strengths of our ABM is its capacity to visualize the outcome of the simulated allocation processes and highlight spatial variations. Because the commercial agents in different categories located in each DZ purchase differing quantities of tanker water at differing prices and subsequently derive welfare on different scales, weighted average results are presented for the DZ in the figures below. While different prices can be weighed with their respective consumption quantities, we chose to display the average of the quantity of water consumed and the welfare derived from it on a per capita basis for the (residential) population of each DZ, representing a proxy for commercial activity there (cf. Appendix A, Note 22).
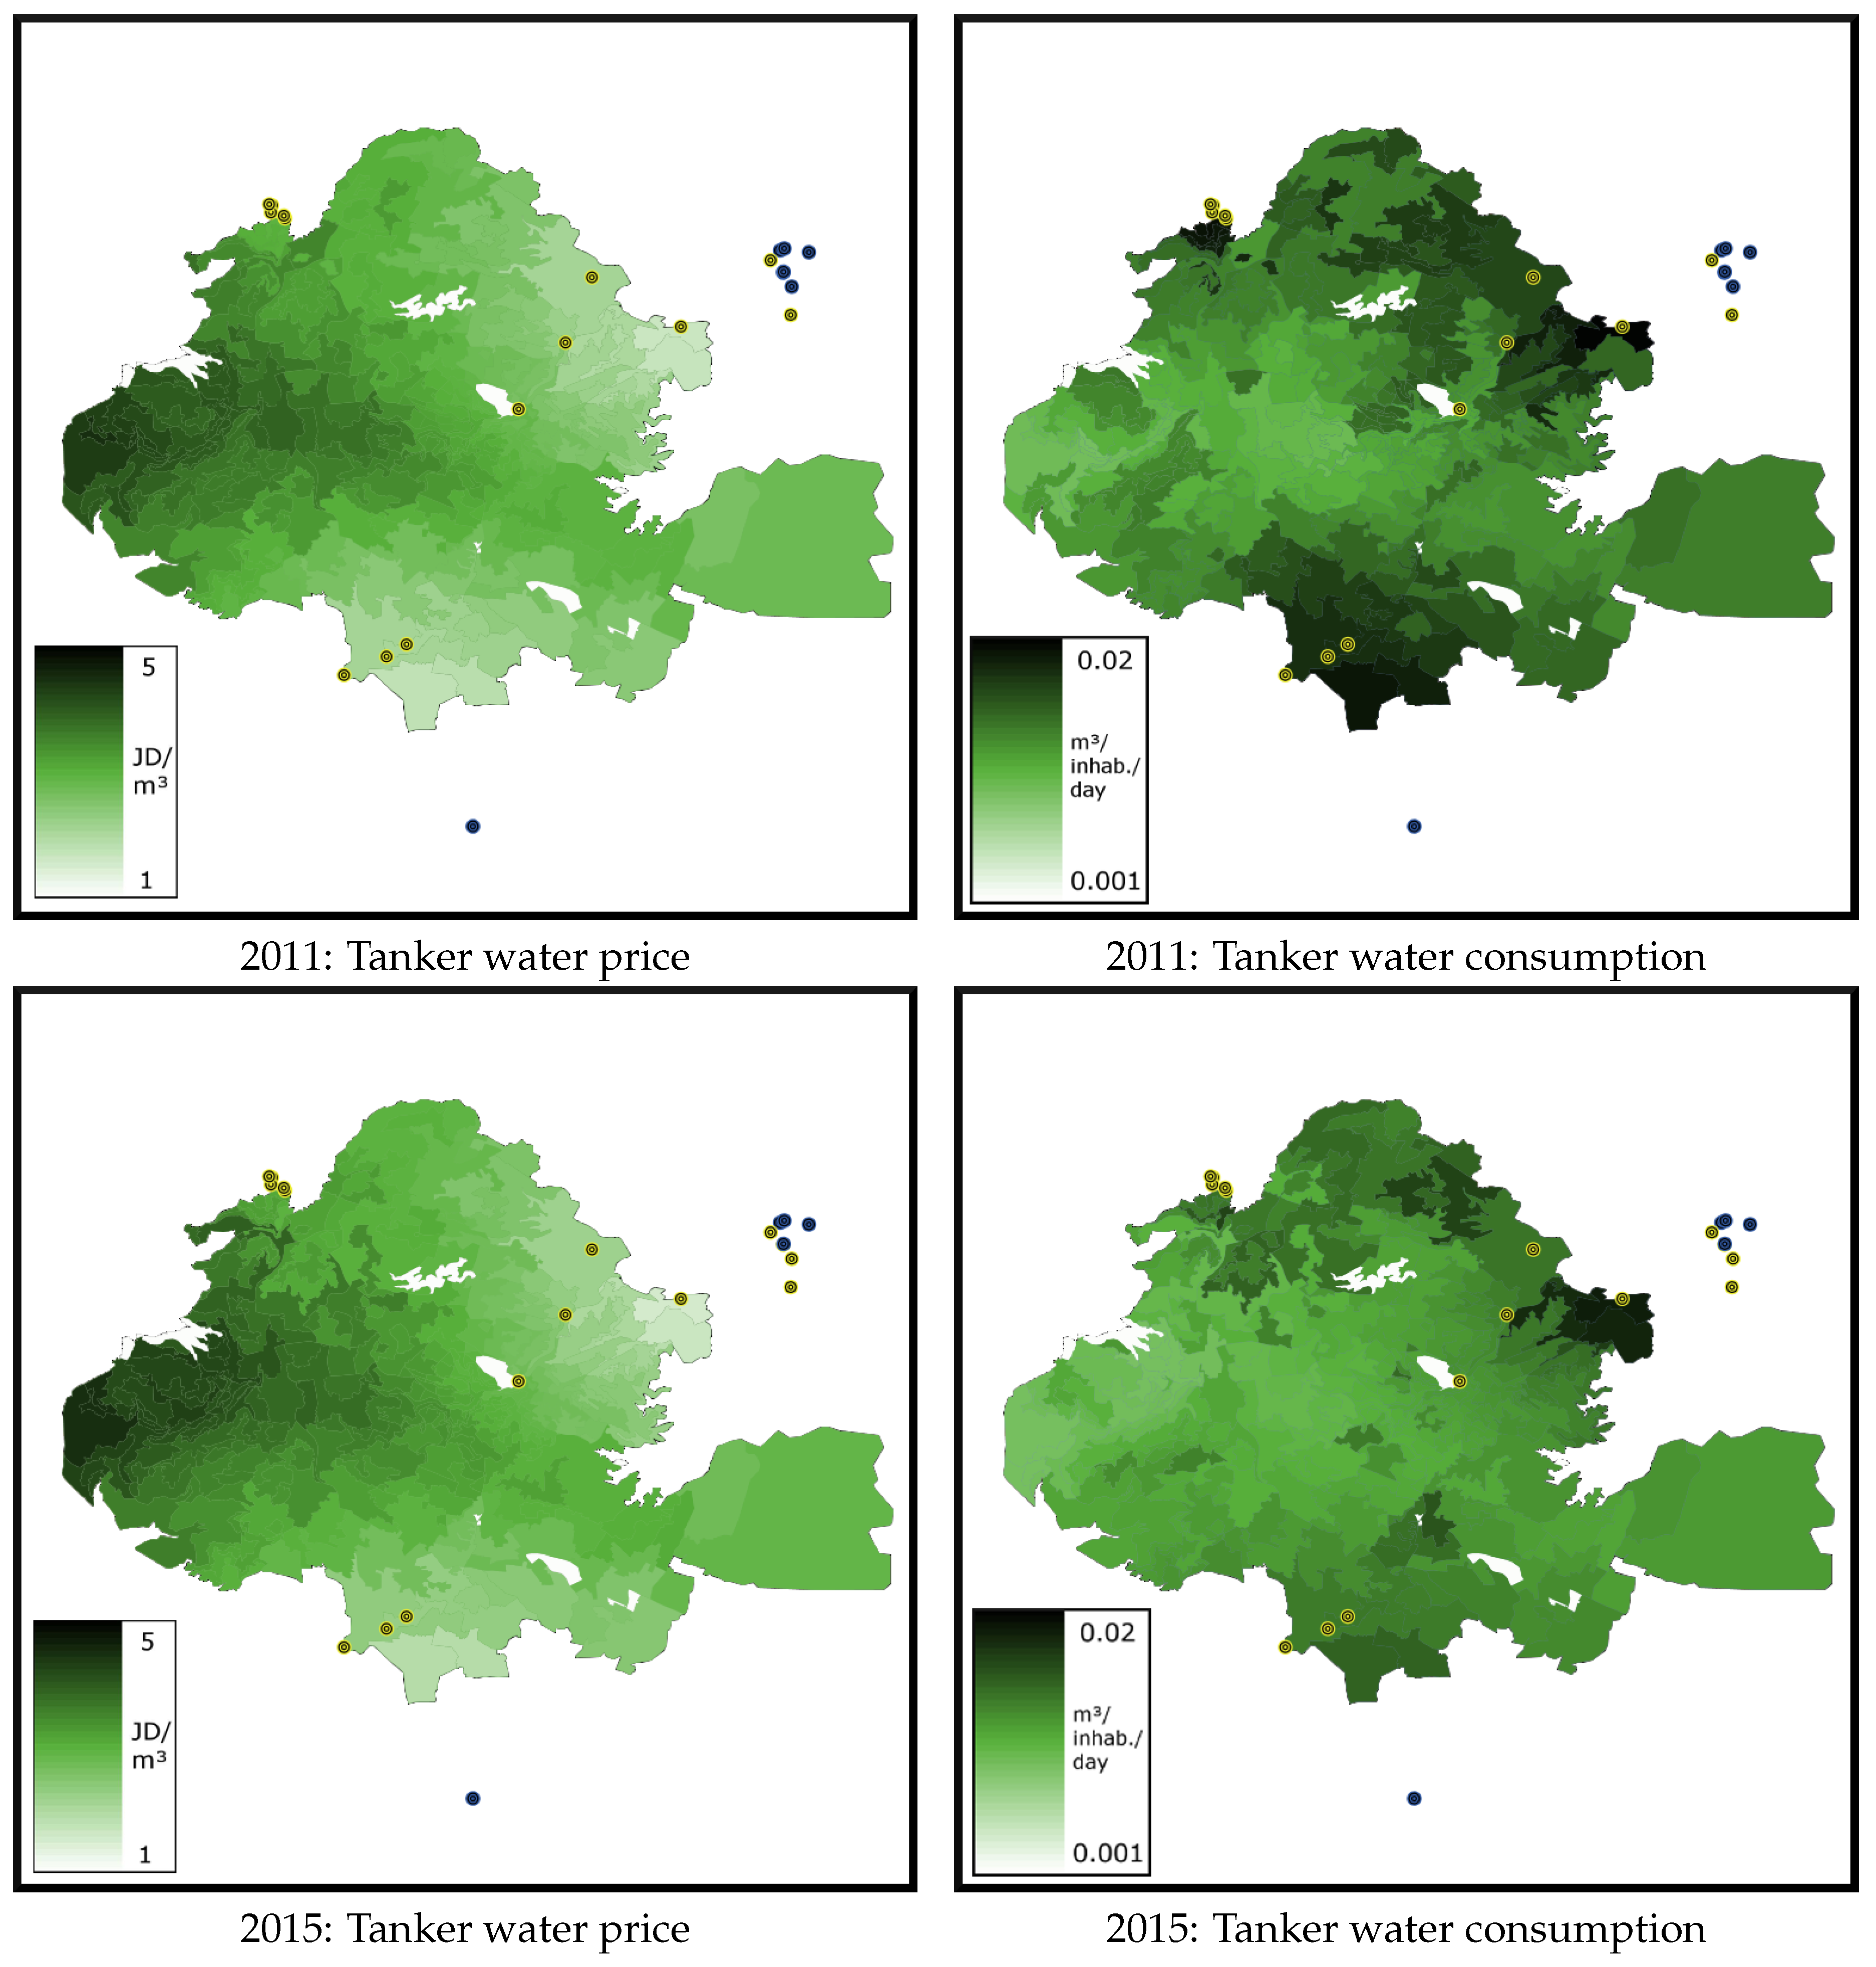
The visualization of average tanker water prices per cubic meter of water in Figure 4 (left side) clearly indicates that tanker-reliant commercial establishments in the west of the city are at a disadvantage. According to the model, certain establishments in the west-most DZ pay up to six times the lowest price incurred close to the well cluster in the north-east of Amman. These high prices raise the question whether establishments in the west would actually purchase tanker water or whether there might be other, undocumented ground- and surface water abstractions in the area as a result of the high prices for water from licensed wells. Southern and northeastern tanker water users, in contrast, incur average prices quite similar to the cost of water from the network, which would explain why there are establishments that choose to refrain from establishing a connection to the network.
The different price levels influence the spatial distribution of tanker water consumption as illustrated for the summer months of 2011 and 2015 on the right side of Figure 4 (Because the residential population of a DZ serves a weight for the calculation of average, the quantities cannot be interpreted directly but illustrate the relations of quantities consumed in individual DZ). As can be expected, the consumption quantities are significantly higher in low-price areas. What immediately catches the eye if both years are compared is that establishments in the most Southern areas of the city reduced their tanker water consumption in 2015, despite incurring continuously low prices. This can be explained by the duration of network supply, which increased in these zones between both years as depicted in Figure 2.
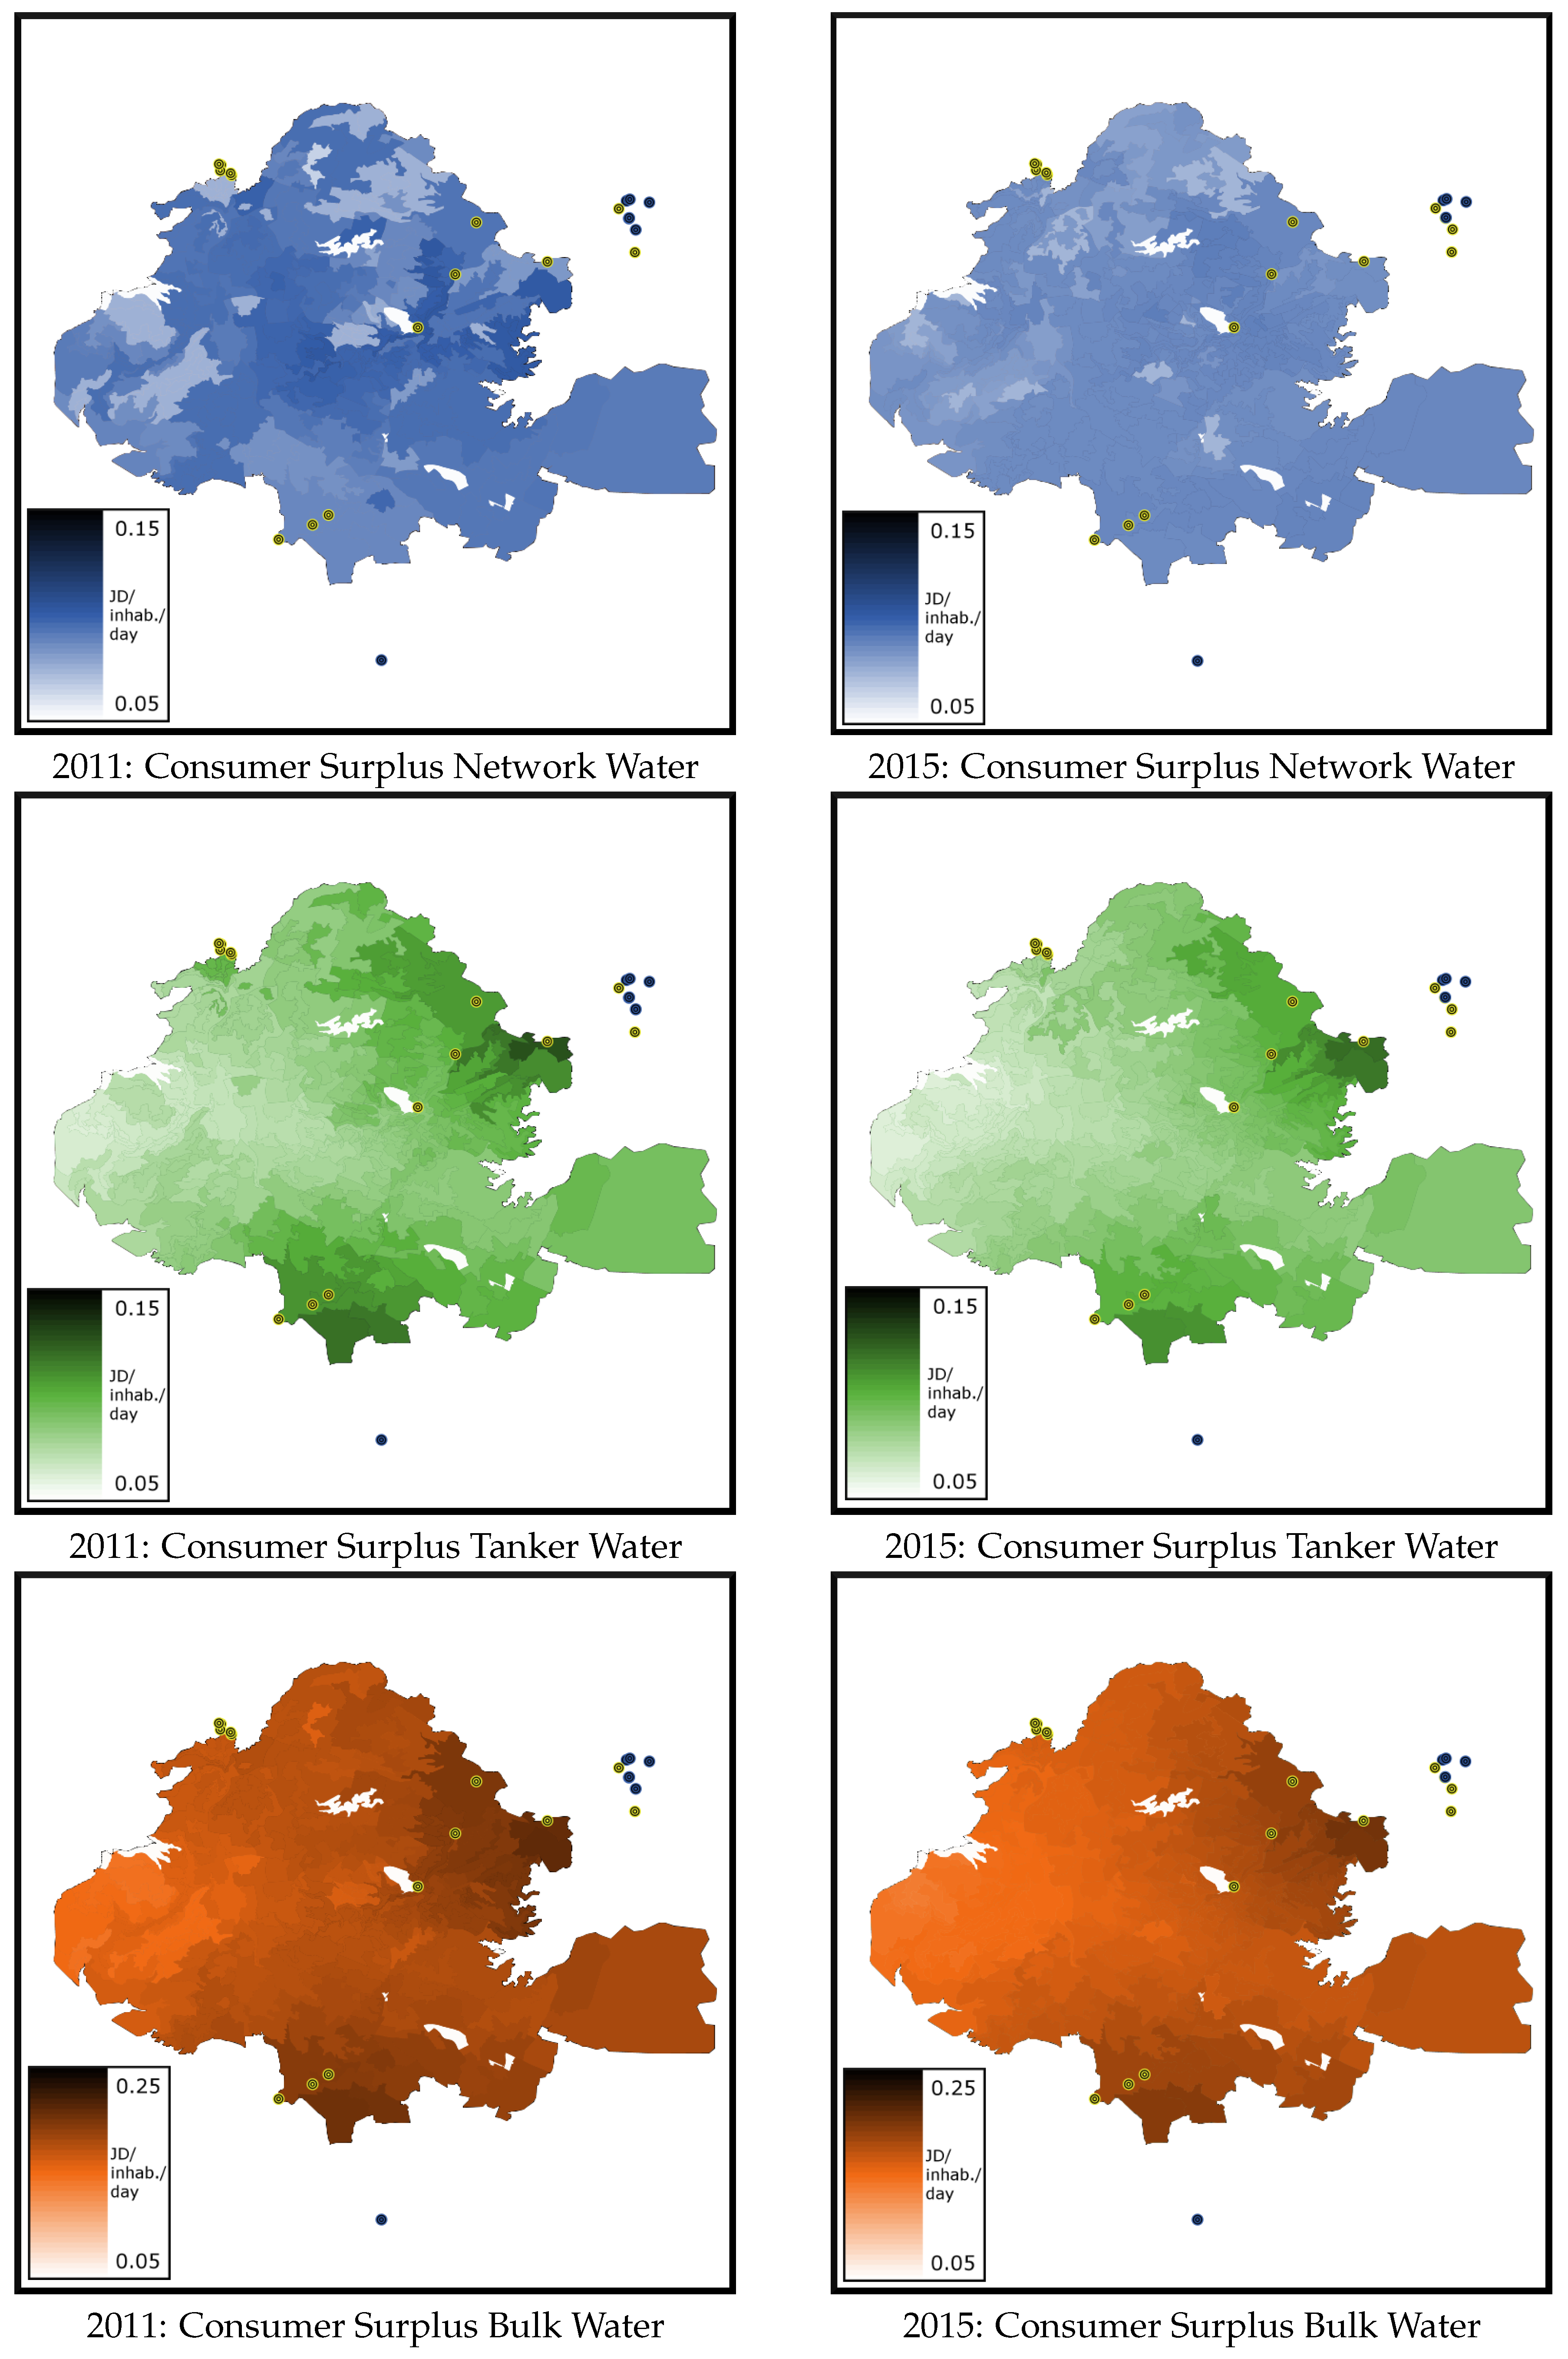
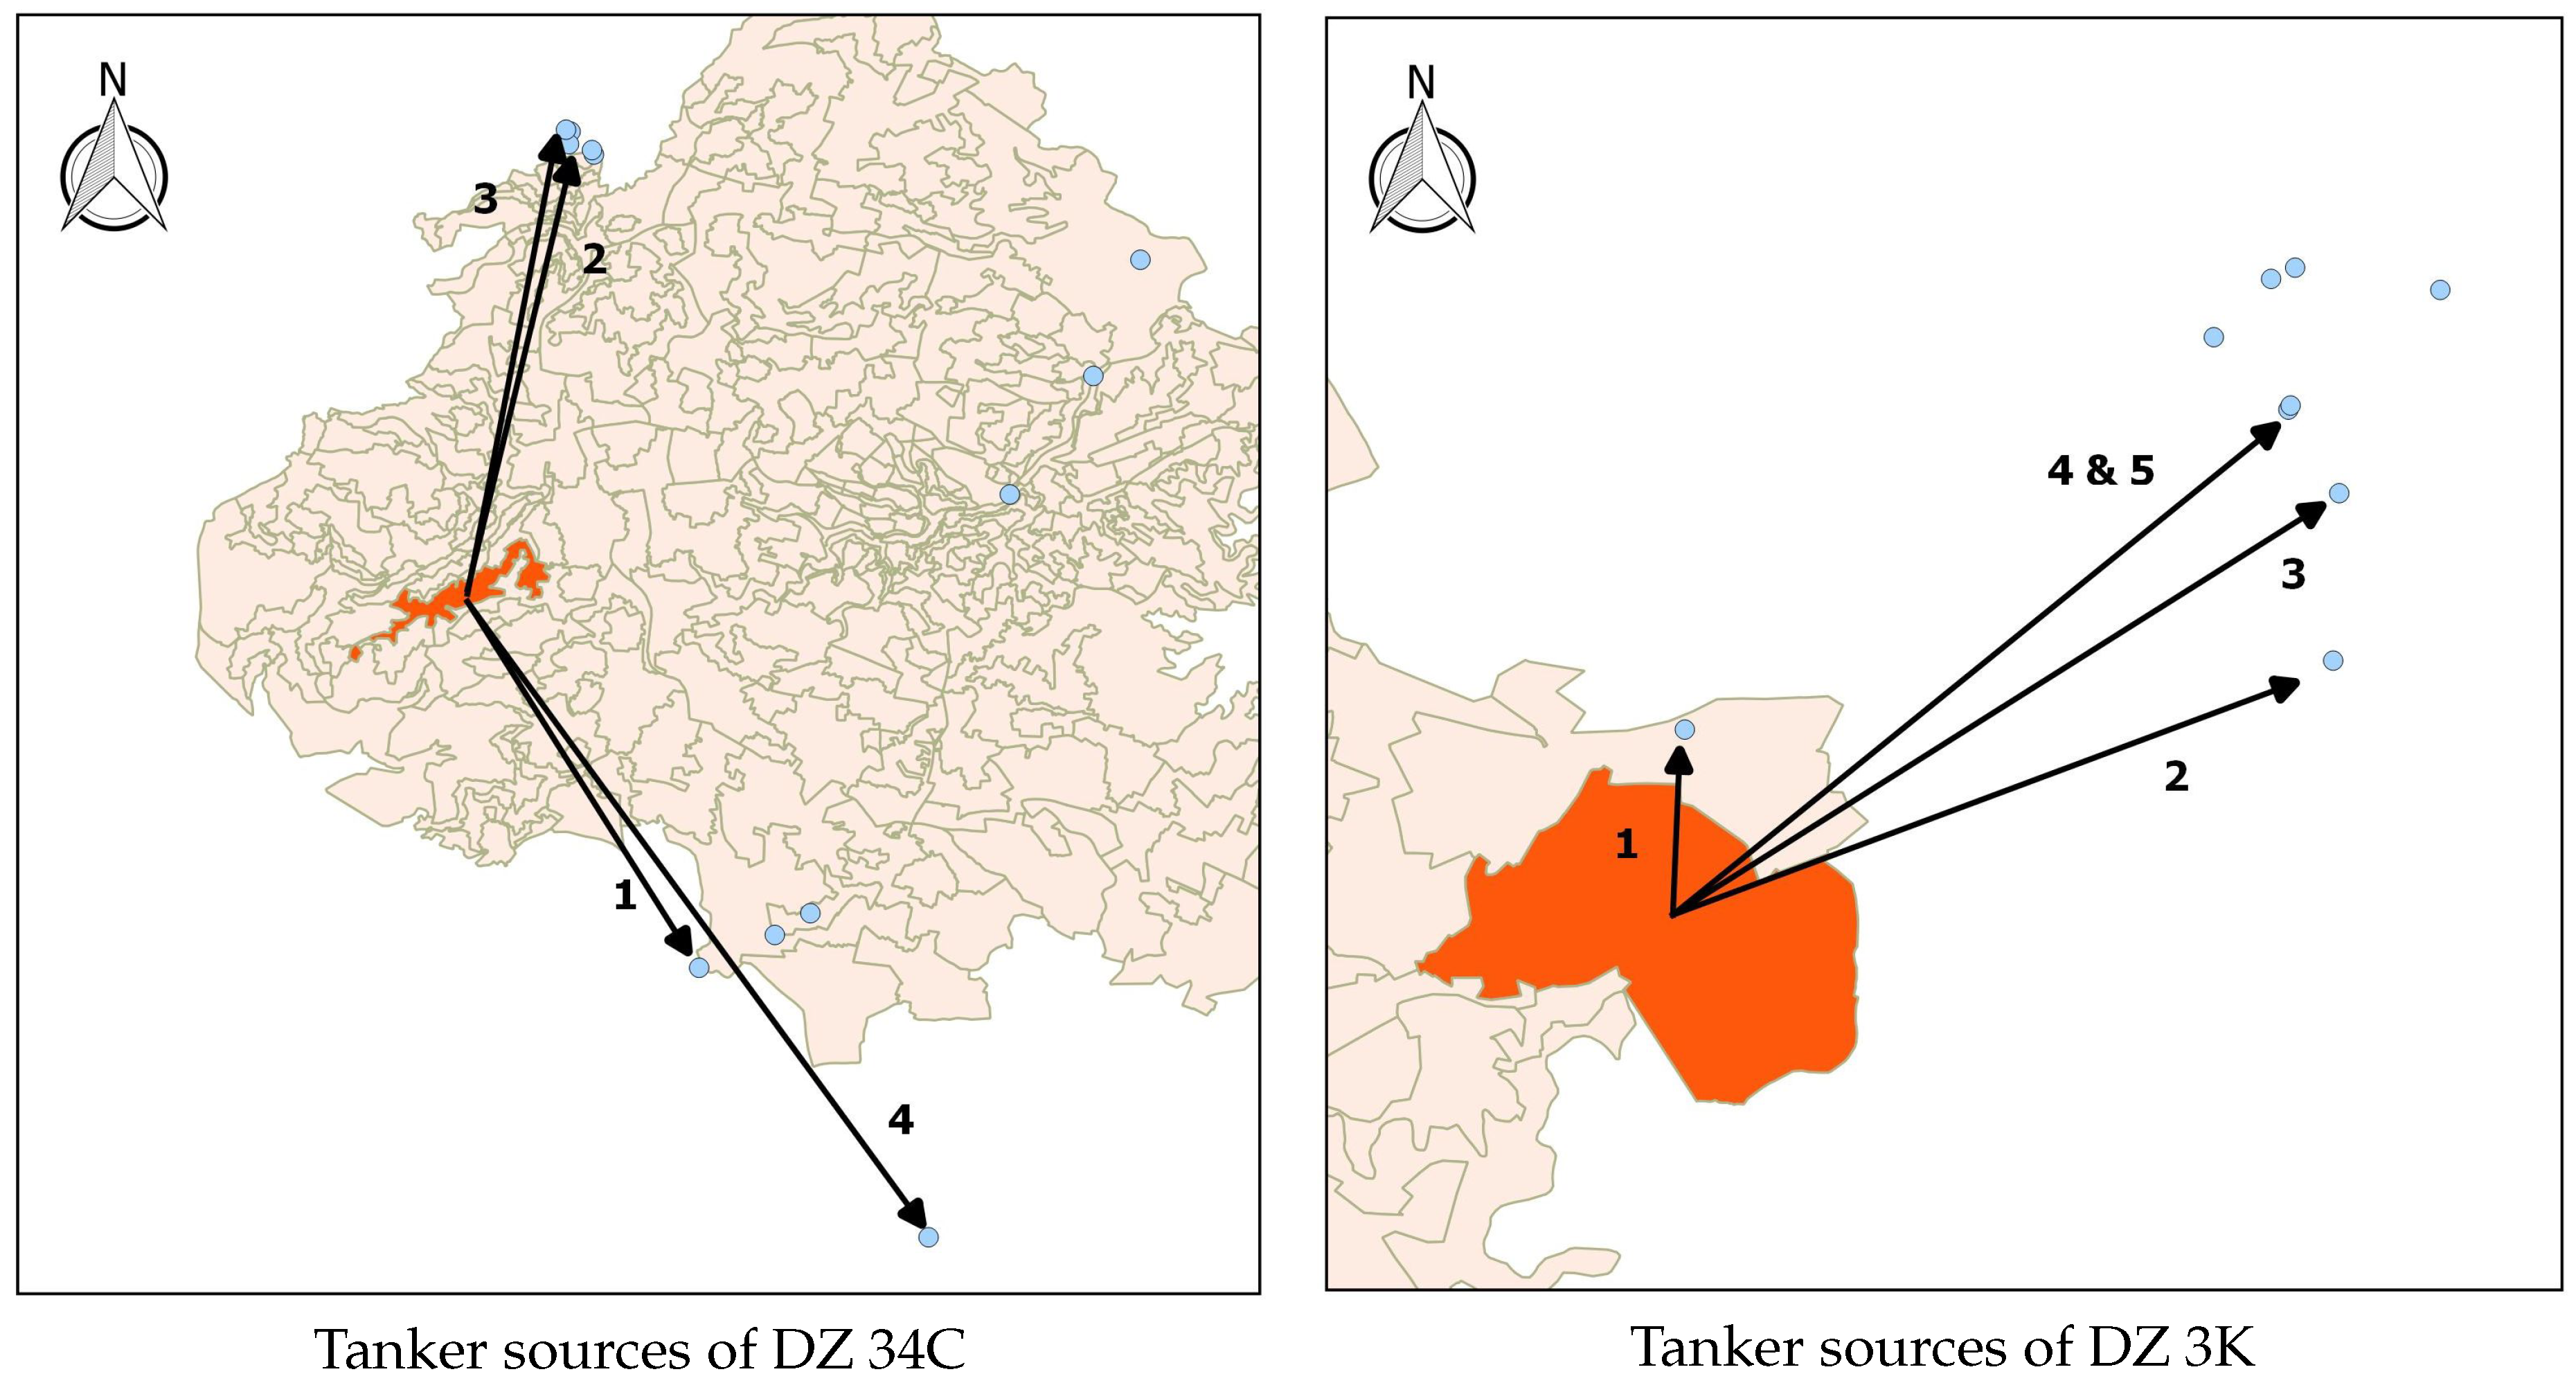
Because the consumer surplus of commercial establishments demanding water depends on both water sources—that is, if both are consumed—it seems reasonable to investigate spatial differences in welfare derived from each source individually as well as from bulk water consumption (Figure 5). While it is relatively straightforward that those areas which enjoy more access to network water derive a higher consumer surplus than less supplied areas, the tanker water allocation introduces much stronger spatial differences in surplus due to the strong variation of prices. Because of this effect, commercial establishments in northeastern and southern areas of the city seem to fare best under the current water supply system. The effect of the tanker water allocation can be illustrated quite well by comparing two DZ in different parts of the city (cf. Figure 6). The arrows in the figure show which wells the consumed tanker water stemmed from in both zones and in which succession these wells were exploited. Establishments from distribution zone 34C in western Amman send their drivers across comparatively large distances to meet their tanker water demand and thus incur higher final tanker prices. The establishments in 3K, however, can access the little used well cluster in the northeast of the city and incur lower final prices.

6. Discussion

Our simulation suggests that tanker water provision is relevant for a significant part of the commercial sector in Amman, particularly among large establishments. Regardless of the year, we observe that more than 40% of the total water consumed by the commercial sector in summer stems from tanker trucks. During winter, the tanker share drops by a few percentage points but stays at a high level due to those establishments that consume tanker water exclusively. This result, along with the drop in the price of tanker water during winter, demonstrates that the distinction between seasons enhances our understanding of these markets. The same seems to hold for the spatially differentiated approach adopted here, which has revealed strong geographic disparities in water use for both sources considered. Together, the different durations of network supply and the dispersion of groundwater wells around the city create a high variability in tanker water prices and quantities demanded/consumed. This might suggest that for those establishments located in the proximity of a well cluster it is economically beneficial to opt out of the network allocation, while in other parts of the city a network connection provides cheaper access to water.
While this may not be sufficient to fully explain why so many establishments remain unconnected compared to the high connectivity rates of households, it is a plausible indication. The model results thus further substantiate the conjecture that commercial water consumption in Amman occurs in patterns very dissimilar from residential water use. Regardless of the range of potential explanations (cf. Appendix A, Note 23), the low commercial connectivity has negative financial implications for the water system as a whole due to the cross-subsidizing role of commercial consumers, as argued by Klassert and colleagues [37].
If our simulation accurately reflects reality, the total extent of commercial tanker water consumption in Amman is roughly 9.7 million m3 per year. If this is extrapolated, under the assumption gathered from the tanker drivers survey, which indicated that the commercial sector receives around 52% of the tanker-supplied water, the total size of the tanker water market in Amman, i.e., the consumption of all user groups, amounts to roughly 18.7 million cubic meter per year. On the one hand, this demonstrates the existing gap between public supply volumes and water demand in Amman. In the current water supply system, tanker water contributes significantly to (commercial) welfare. On the other hand, the possible tanker market size establishes a substantial connection to groundwater extraction and is therefore of relevance for water management. To put our simulated tanker water market volume in context: the safe yield of the Amman-Zarqa basin is estimated at 87.5 million m3 per year, while it is currently exploited at a rate of approximately 166 million m3 per year [5,12]. In such a situation, policy-makers aiming to enhance freshwater sustainability need to prioritize among competing water uses, which is reflected upon briefly in the next section.
While the real volume of the tanker water market in Amman remains unknown, our simulation for commercial water consumption has yielded results that exceed officially documented numbers considerably. These results, however, have to be interpreted with care for a number of reasons. First, the quality of model results depends strongly on the quality of input data. To some extent, the available data we used for the model constitutes a constraint, for instance with regard to supply durations and groundwater well yields. While the survey data used for the development of our model is the first of its kind and has enriched our understanding of the involvement of the commercial sector in the tanker water market considerably, we cannot exclude the possibility of some degree of bias in the data.
The majority of the results produced by our model, however, are in line with the findings of all three surveys of the tanker water markets in Amman. While there are only marginal deviations in prices, the model suggests a lower share of tanker water in the bulk water consumption volumes than the survey does (35–45% vs. 62–65%). A possible explanation for this is our method of distributing commercial agents across Amman, which creates a large number of establishments in densely populated areas with a longer duration of network supply. While this approach of linking commercial populations to the existing residential data was plausible, it ignores the fact that certain urban districts are more relevant for tourism, commerce and shopping. This might affect the results of the simulation model to some extent, since the geographic location is a relevant factor in determining how much water is consumed from which source. To assess whether the survey or the simulation model is closer to reality in this regard, a better understanding of the geographic distribution of commercial establishments in Amman is required. A third possible method for the analysis of the commercial use of tanker water could be the development of a spatial-econometric model. This approach would complement our simulation and the surveys and should therefore be explored in future research. All three options would profit from the availability of reliable data on the commercial sector in Amman.
The results we obtained are limited by the use of simplifying assumptions. With regard to model design, it could be argued that for potential future versions it is necessary to reassess in depth the applicability of the assumption that network water is allocated before tanker water. Particularly in locations close to a well cluster, the tanker water prices are below the cost for network water, which implies that at least as long as the cheap water from the vicinity is available, commercial users might consume tanker water before they open the tap. As mentioned before, however, the concept of transaction cost can be used to argue in favor of our assumption. Additionally, simultaneous allocations of network and tanker water would increase the complexity of the model significantly and would also require a reassessment of the calculation of welfare, which considers network water as the first consumed good under the demand curve.
Apart from the time sequence of the allocations, we have treated water from all sources, including groundwater from different wells, as a homogeneous good. In reality, different applications of water from different sources can be observed: (perceived) water quality often is the decisive factor when choosing a source for a specific activity such as water for drinking and cooking, other indoor uses like cleaning and washing or outdoor uses such as irrigating [11]. Most of these existing observations, however, apply to household water use. It is thus necessary to gain a deeper understanding to which extent commercial water consumers differentiate between water from different sources. At this point in time, we had to rely on the aforementioned assumption that water from all sources is pumped into the same storage tank and is therefore treated the same. Future research could be aimed at investigating heterogeneity of water as a good and input for commercial activities, which also opens further room for improvement of the model: depending on the availability of more data, the introduction and use of storage as a factor could enrich the model, which is so far merely considering storage size in the calculation of water demand. Yet, establishments with a large storage capacity and good access to network water would potentially behave differently if the option to store was included in the model.
Notwithstanding the constraints discussed above, we have developed a model with a high degree of spatial differentiation that has produced the first estimate of the water consumption of the commercial sector in Amman and shed some light on how the tanker water market functions. While other approaches from the economic theory, notably general equilibrium models, are increasingly addressing issues such as water scarcity and supply intermittency (e.g., [38,39]), we have provided an example of how agent-based modeling can be used to improve our understanding of behavior in complex water supply systems shaped by a variety of small-scale providers.

7. Conclusions

This paper aimed to carry out a positive analysis of commercial water consumption in Amman. Our simulation model revealed that tanker water provision is highly relevant for the commercial sector in Amman, arguably more than for residential consumers. The analysis further showed that the differences in network supply durations and the spatial dispersion of groundwater wells influence water allocation considerably. Establishments in advantageous locations can incur tanker prices lower than the network tariff, especially in winter. The west of the city, however, is far-off from (documented) groundwater wells, which turns tanker water into a comparatively expensive alternative to the network.
While a sustainable urban water supply system might look different from the one prevalent in Amman, it cannot be dismissed that tanker operators perform a currently indispensable service. This paper did not aim to conclude which share of Jordan’s groundwater should be allocated where. Policies aiming at the reduction of groundwater draft for tanker water sales, however, should consider that these contribute significantly to commercial welfare by balancing the inadequacies of the network system. Thus, reductions in tanker water availability might impact value creation in the commercial sector adversely, which is the main source of employment and tax income in the Governorate Amman.
The previous paragraph also points at a questionable premise in the approach towards tanker water common in the literature: tanker water provision is frequently compared with a network water system with continuous supply at low tariffs and thus framed as a problem. While such a water supply system may be considered desirable, it does not seem to be a realistic prospect in Amman within the near future, i.e., the real is compared to an ideal situation. We argue that tanker water markets and their potential alternatives should be evaluated carefully and based on evidence before conclusions on their desirability in urban water supply systems are drawn. The same consideration can be transferred to welfare statements (e.g., [16,17]): when compared with the same amount of water from the network under the current tariff, large parts of tanker water consumption can be framed as a welfare loss. If however, one assumes that tanker water cannot be replaced in the short run, it contributes to welfare.
While we took a first step towards comprehending the processes underlying commercial water consumption in Amman and explored how tanker water pumped for the commercial sector might be related to groundwater management, our analysis revealed significant data gaps and starting points for future research. It could for instance be worthwhile to assess whether our model could be adapted to evaluate the effects of policy measures aiming at prices or available water volumes. For this, the results presented in this paper could serve as a baseline to measure the impacts of policies on groundwater sustainability and on the welfare of the commercial sector. Further, in-depth studies on tanker water consumption can contribute information to difficult decision-making processes concerning trade-offs between securing water needs, while moving towards a more sustainable use of freshwater.
Author Contributions

All authors made substantial contributions to the analysis at hand and the development of this paper. C.K. and H.Z. developed the agent-based model of commercial water consumption. H.Z. processed the model data, inputs and outputs, implemented and analyzed the model and developed the first draft of this manuscript. C.K. estimated the commercial water demand function used in the model. E.G., B.K., C.K. and K.S. reviewed the paper and contributed with suggestions leading to substantial improvements. All authors read and approved the final manuscript.

Funding

This work was conducted as part of the Belmont Forum water security theme for which coordination was supported by the US National Science Foundation under grant GEO/OAD-1342869 to Stanford University. This work was also conducted as part of the Belmont Forum Sustainable Urbanisation Global Initiative (SUGI)/Food-Water-Energy Nexus theme for which coordination was supported by the US National Science Foundation under grant ICER/EAR-1829999 to Stanford University. Any opinions, findings, and conclusions or recommendations expressed in this material do not necessarily reflect the views of the funding organizations. The authors of this work would like to acknowledge support from Deutsche Forschungsgemeinschaft (German Research Foundation) and the German Federal Ministry of Education and Research (BMBF). Any opinions, findings, and conclusions or recommendations expressed in this material also do not necessarily reflect the views of Deutsche Forschungsgemeinschaft and BMBF.

Acknowledgments

We would like to thank the entire team of the Jordan Water Project and the FUSE project for their support. In particular, we are grateful to Raphael Karutz, Yuanzao Zhu and Christopher Krohn for their feedback on this manuscript. The icons in Figure 1 were made by Freepik from www.flaticon.com.

Conflicts of Interest

The authors declare no conflict of interest.

Abbreviations

The following abbreviations are used in this manuscript:
ABMAgent-based model
DZDistribution zone(s)
GISGeographic Information System
SDSupply duration(s)
WAJWater Authority of Jordan

Appendix A. Notes

  • Note 1: During the implementation of the model, we found that computational complexity can be reduced by modeling tanker drivers implicitly through the commercial agents, who purchase water directly from wells. In reality and in the conceptual design of the model, tanker drivers assume the role and carry out the actions attributed to them in this paper, while they are not programmed as separate entities.
  • Note 2: Not necessarily contradicting this assumption, there is empirical evidence from the commercials survey [22] which indicates that for commercial establishments, conceptions about water quality and the reliability of service are important decision factors besides prices.
  • Note 3: Jordan has three months of summer (June–August) and nine months recognized as winter [40].
  • Note 4: The demanded quantity can be zero, if the price at the next closest well is higher than the agent’s willingness-to-pay.
  • Note 5: This assumption is in line with the reality of tanker water deliveries, where it is usually necessary for consumers to purchase the entire load of the delivering truck (3–20 m3) [15]. In the model, the purchase of smaller quantities of tanker water is possible because the water allocation occurs in daily sequencing, while tanker (and network) water is usually delivered less frequently in the real world.
  • Note 6: A key difference with regard to tanker water allocation is that the model by Klassert and colleagues assumed a uniform tanker water price and no quantity constraint on groundwater availability.
  • Note 7: For the sake of completeness, it has to be noted that there are commercial establishments that use one source of water exclusively. In these cases, the supply curve consists of one block of either piped or tanker water and the consumer surplus is naturally only derived from this source.
  • Note 8: The graph suggests that the price of network water is lower than the price of tanker water. While this is true in many cases, exceptions exist (cf. Section 6).
  • Note 9: In the illustration, water supply can fully meet the demand of the establishment. It is, however, also possible that the available piped and tanker water volumes are unable to meet existing demands. Whether the demand of a commercial establishment can be satisfied is subject to the processes of allocation described in Section 2.
  • Note 10: Another explanation for this choice of behavior could be the idea that an establishment with a higher demand instructs more drivers to purchase water for it, thereby increasing its chances of getting more of the scarce water.
  • Note 11: The plugin documentation can be accessed here: https://docs.qgis.org/2.8/en/docs/user_manual/plugins/plugins_interpolation.html.
  • Note 12: These values were calculated under the assumption of 24 h of pumping, which are possible due to large water storage facilities that groundwater wells usually include.
  • Note 13: This number stems from the water sector model of the Jordanian Ministry of Water and Irrigation, which is built upon the WEAP-software (https://en.wikipedia.org/wiki/WEAP) and has been made accessible to the Jordan Water Project.
  • Note 14: This is the only part of the model in which the size of the water storage tank of an establishment is considered. In reality, the function of a storage tank is to bridge periods of discontinued network supply or between individual tanker deliveries—the storage might contain water for the consumption of several days. Since the model simulates a daily water allocation, the different size of the storage in the respective commercial category is rather used as an input for the water demand function. In Section 6 we discuss how the inclusion of storage might enrich the model in future versions.
  • Note 15: In the real world, almost any well owner is a potential farmer that faces opportunity cost for the decision to sell water to tankers. USAID [40] has calculated the weighted average water value in irrigation in Jordan at 0.49 JD per cubic meter.
  • Note 16: We assume a mean volumetric earth radius of 6371 km, in line with NASA’s factsheet on planet earth (https://nssdc.gsfc.nasa.gov/planetary/factsheet/earthfact.html.
  • Note 17: As mentioned before, the commercial agents in the NetLogo model actually carry out all those actions, that are attributed to tanker drivers here. This means that in the code, the tanker drivers exist only implicitly, while the “communication” between commercial establishment and well is carried out directly.
  • Note 18: The reference value is the highest possible demand in the model, which is determined by calculating the demand of an establishment in the largest size category (100+) at the lowest possible price, which is the abstraction charge at the well (0.75 JD/m3).
  • Note 19: Note that the demand is in almost any case higher than the request. If, however, an establishment purchases from the same well for several rounds, it could accumulate water volumes equal to its demand.
  • Note 20: The smaller quantity q 1 is always set to at least 0.001 cubic meter of water, since it is assumed that an establishment will always demand at least a marginal quantity of water (1 L).
  • If a commercial establishment is situated very closely to a well—and only consumes water from this well—it could incur a final tanker price that is lower than the network price. The consumption of network water, however, has occurred earlier than that of tanker, which is why the piped quantity purchased is nevertheless regarded as q 1 in the tanker welfare calculation (cf. Section 2.2). For total welfare, it does not matter which quantity is considered first because both the tanker and the piped block are summed up and subtracted from the area below the demand curve.
  • Note 22: The spatial results presented in this section are generated in the model directly. The underlying shapefiles include information on the population in each DZ, which we used to create the number of establishments there.
  • Note 23: Another possible reason for the low network connectivity of the commercial sector might be that the diameter of pipes and the water pressure in the system are too small for large establishments with a high consumption of water.

Appendix B. Model Variables and Parameters

Table A1. Model variables, sub- and superscripts.
SymbolExplanationDefinition
Scripts
iUnique distribution zone identifier ϵ 1 , 2 , , 343
jSize category identifier1–4: 0
5–19: 1
20–49: 2
50–99: 3
100+: 4
kUnique well identifier ϵ 1 , 2 , , 21
Variables
n commercial i , j Number of establishments in DZ ϵ R 0
n ( un ) connected Number of establ. with(out) network connection ϵ R 0
y network i , j Network water demand ϵ R 0
a b s network i , j Network water abstraction ϵ R 0
S D F Supply duration factor ϵ R 0
e x p network i , j Network water expenditure ϵ R 0
a b s mean hyp Hypothetical mean network abstraction ϵ R 0
y tanker i , j , k Tanker water demand at well k ϵ R 0
p tanker i , k Tanker water price at well k ϵ R 0
d i , k Distance between establishments in DZ i and well k ϵ R 0
request i , j , k Tanker water quantity request ϵ R 0
a b s tanker i , j , k Tanker water abstraction at well k ϵ R 0
e x p tanker i , j Tanker water expenditure ϵ R 0
a b s limit k Abstraction limit of well k ϵ R 0
C i , j Consumer surplus of establishment ϵ R 0
C source total Consumer surplus of all establishments from water source ϵ R 0
Table A2. Model parameters.
SymbolExplanationCategory/YearDefinitionSource
x int j Establishment density interceptallTable 1[23,33]
x cof j Establishment density coefficientallTable 1[23,33]
x unconnected j Share of unconnected establishments1–460.5%[22]
5–1961.0%[22]
20–4940.7%[22]
50–9942.9%[22]
100+21.4%[22]
p o p i Population of a DZ20110–57,000[31,33]
[23]
20150–70,500[23,33]
a r e a i Area of a DZ 0.036–5.45 km 2 WAJ *
p network v a r Unit price network water **20111.56 JD[41]
20152.165 JD[42]
p network f i x Fix quarterly network charge20116 JD[41]
20157.8 JD[42]
Q network Available network quantity201114.534 mln. m 3 MWI *
201518.29 mln. m 3 [35] (p. 11)
S D Supply duration201118–168 h week [31]
201518–168 h week [9]
S F Size factor1–41[22]
5–192.67[22]
20–491.30[22]
50–994.92[22]
100+6.06[22]
p tanker f i x Fixed abstraction charge at well 0.75 JD m 3 [21,22]
p tanker v a r Variable tanker transport cost 0.15 JD km [21,22]
a b s rate k Well yield 7–65 m 3 h [22] WAJ *
y ref Reference tanker demand100+42.99 m 3 [34]
Note: * Data has been acquired in personal communication with WAJ and MWI. ** Price consists of unit price per m 3 and a wastewater charge, also per m 3 . The historic tariffs for 2011 have been deleted from the WAJ website.

Appendix C. Key Model Results

Table A3. Selected model outputs across all model runs.
Model RunSeasonEstablishmentsNetwork AllocationTanker Allocation
TotalSatedAvailableConsumedSurplus *AvailableConsumedSurplus *Mean Price **
n%m 3 /daym 3 /dayJD/daym 3 /daym 3 /dayJD/dayJD/m 3
2011Summer49,023.9810039,819.1839,819.18231,174.6242,751.4932,685.19215,624.512.90
Winter49,023.9810039,819.1836,765.59169,702.0642,751.4920,814.22161,032.262.24
2015Summer58,168.7810050,109.5950,109.59253,130.642,751.4935,407.42248,168.532.98
Winter58,168.7810050,109.5938,884.82175,800.9242,751.4923,763.14182,753.322.46
Note: * Aggregate consumer surplus derived from consumption of water from this source by all of its users during one day. ** Weighted mean tanker water price of all consumers of tanker water (weighed by purchased amount).

References

  1. World Health Organization. Progress on Drinking Water and Sanitation; Documents for Sale; World Health Organization: Geneva, Switzerland, 2015. [Google Scholar]
  2. Opryszko, M.C.; Huang, H.; Soderlund, K.; Schwab, K.J. Data gaps in evidence-based research on small water enterprises in developing countries. J. Water Health 2009, 7, 609–622. [Google Scholar] [CrossRef] [PubMed]
  3. Kariuki, M.; Schwartz, J. Small-Scale Private Service Providers of Water Supply and Electricity: A Review of Incidence, Structure, Pricing and Operating Characteristics; The World Bank: Washington, DC, USA, 2005. [Google Scholar]
  4. Food and Agriculture Organization (FAO). AQUASTAT Database Database Query Results; FAO: Rome, Italy, 2017. [Google Scholar]
  5. Water Authority of Jordan. Jordan Water Sector: Facts & Figures; Water Authority of Jordan: Amman, Jordan, 2015.
  6. United States Agency for International Development (USAID). Strategic Master Plan for Municipal Water Infrastructure: Final Report; USAID: Amman, Jordan, 2015.
  7. Gerlach, E.; Franceys, R. Regulating water services for the poor: The case of Amman. Geoforum 2009, 40, 431–441. [Google Scholar] [CrossRef]
  8. Miyahuna. Annual Report; Jordan Water Company: Amman, Jordan, 2015. [Google Scholar]
  9. Water Authority of Jordan. Water Distribution Program: Summer 2015; Water Authority of Jordan: Amman, Jordan, 2015.
  10. Rosenberg, D.E.; Talozi, S.; Lund, J.R. Intermittent water supplies: Challenges and opportunities for residential water users in Jordan. Water Int. 2008, 33, 488–504. [Google Scholar] [CrossRef]
  11. Rosenberg, D.E.; Tarawneh, T.; Abdel-Khaleq, R.; Lund, J.R. Modeling integrated water user decisions in intermittent supply systems. Water Resour. Res. 2007, 43, 424. [Google Scholar] [CrossRef]
  12. Al-Zyoud, S.; Rühaak, W.; Forootan, E.; Sass, I. Over Exploitation of Groundwater in the Centre of Amman Zarqa Basin—Jordan: Evaluation of Well Data and GRACE Satellite Observations. Resources 2015, 4, 819–830. [Google Scholar] [CrossRef]
  13. Constantine, K.; Massoud, M.; Alameddine, I.; El-Fadel, M. The role of the water tankers market in water stressed semi-arid urban areas: Implications on water quality and economic burden. J. Environ. Manag. 2017, 188, 85–94. [Google Scholar] [CrossRef] [PubMed]
  14. Venkatachalam, L. Informal water markets and willingness to pay for water: A case study of the urban poor in Chennai City, India. Int. J. Water Resour. Dev. 2014, 31, 134–145. [Google Scholar] [CrossRef]
  15. Wildman, T. Water Market System in Balqa, Zarqa, & Informal Settlements of Amman & the Jordan Valley; OXFAM International: Nairobi, Kenya, 2013. [Google Scholar]
  16. Srinivasan, V.; Gorelick, S.M.; Goulder, L. Factors determining informal tanker water markets in Chennai, India. Water Int. 2010, 35, 254–269. [Google Scholar] [CrossRef]
  17. Baisa, B.; Davis, L.W.; Salant, S.W.; Wilcox, W. The welfare costs of unreliable water service. J. Dev. Econ. 2010, 92, 1–12. [Google Scholar] [CrossRef]
  18. Prakash, A.; Singh, S.; Brouwer, L. Water Transfer from Peri-urban to Urban Areas. Environ. Urban. ASIA 2015, 6, 41–58. [Google Scholar] [CrossRef]
  19. Klassert, C.; Sigel, K.; Gawel, E.; Klauer, B. Modeling Residential Water Consumption in Amman: The Role of Intermittency, Storage, and Pricing for Piped and Tanker Water. Water 2015, 7, 3643–3670. [Google Scholar] [CrossRef]
  20. Griffin, R.C. Water Resource Economics: The Analysis of Scarcity, Policies, and Projects; MIT Press: Cambridge, MA, USA, 2016. [Google Scholar]
  21. Sigel, K.; Klassert, C.; Zozmann, H.; Talozi, S.; Klauer, B.; Gawel, E. Socioeconomic Surveys on Private Tanker Water Markets in Jordan: Objectives, Design and Methodology; UFZ Discussion Paper; Helmholtz-Centre for Environmental Research: Leipzig, Germany, 2017. [Google Scholar]
  22. Sigel, K.; Klassert, C.; Zozmann, H.; Talozi, S.; Klauer, B.; Gawel, E. Impacts of Private Tanker Water Markets on Sustainable Urban Water Supply: An Empirical Study of Amman, Jordan; UFZ Report 2/2019; Helmholtz-Centre for Environmental Research: Leipzig, Germany, 2019; in preparation. [Google Scholar]
  23. Department of Statistics. Employment in Establishment—Online Database; Department of Statistics of Jordan: Amman, Jordan, 2013.
  24. Müller, B.; Bohn, F.; Dreßler, G.; Groeneveld, J.; Klassert, C.; Martin, R.; Schlüter, M.; Schulze, J.; Weise, H.; Schwarz, N. Describing human decisions in agent-based models—ODD + D, an extension of the ODD protocol. Environ. Model. Softw. 2013, 48, 37–48. [Google Scholar] [CrossRef]
  25. Grimm, V.; Berger, U.; Bastiansen, F.; Eliassen, S.; Ginot, V.; Giske, J.; Goss-Custard, J.; Grand, T.; Heinz, S.K.; Huse, G.; et al. A standard protocol for describing individual-based and agent-based models. Ecol. Model. 2006, 198, 115–126. [Google Scholar] [CrossRef]
  26. Simon, H.A. Theories of bounded rationality. Decis. Organ. 1972, 1, 161–176. [Google Scholar]
  27. Srinivasan, V.; Gorelick, S.M.; Goulder, L. Sustainable urban water supply in south India: Desalination, efficiency improvement, or rainwater harvesting? Water Resour. Res. 2010, 46. [Google Scholar] [CrossRef]
  28. Wilensky, U. Netlogo Center for Connected Learning and Computer-Based Modeling: Northwestern University, Evanston, IL, USA. Available online: http://ccl.northwestern.edu/netlogo/ (accessed on 22 January 2019).
  29. QGIS Development Team. QGIS Geographic Information System Open Source Geospatial Foundation Project: Chicago, IL, USA, 2017. Available online: http://qgis.osgeo.org (accessed on 22 January 2019).
  30. R Core Team. R: A Language and Environment for Statistical Computing. R Foundation for Statistical Computing: Vienna, Austria, 2018. Available online: http://www.R-project.org/ (accessed on 22 January 2019).
  31. Abu Amra, B.; Al-A’raj, A.; Al Atti, N.; Dersieh, T.; Hanieh, R.; Hendi, S.; Homoud, F. Amman Water Supply Planning Report, Volume 3, Appendices G & H; Report Prepared by CDM for the United States Agency for International Development (USAID), the Ministry of Water and Irrigation (MWI), and the Water Authority of Jordan (WAJ): Amman, Jordan, 2011.
  32. World Bank. Survey Methodology for Enterprise Surveys; The World Bank: Washington, DC, USA, 2017. [Google Scholar]
  33. Department of Statistics. Establishment Survey; Department of Statistics of Jordan: Amman, Jordan, 2006.
  34. Klassert, C.; Sigel, K.; Talozi, S.; Gawel, E.; Klauer, B. Commercial water demand in Jordan: Capturing multiple supply sources in a discrete/continuous choice model. 2019. in preparation. [Google Scholar]
  35. Ministry of Water an Irrigation. Water Sector Capital Investment Plan: 2016–2025; Ministry of Water an Irrigation of Jordan: Amman, Jordan, 2015.
  36. Ballou, R.H.; Rahardja, H.; Sakai, N. Selected country circuity factors for road travel distance estimation. Transp. Res. Part A Policy Pract. 2002, 36, 843–848. [Google Scholar] [CrossRef]
  37. Klassert, C.; Gawel, E.; Sigel, K.; Klauer, B. Sustainable Transformation of Urban Water Infrastructure in Amman, Jordan—Meeting Residential Water Demand in the Face of Deficient Public Supply and Alternative Private Water Markets. In Urban Transformations; Kabisch, S., Koch, F., Gawel, E., Haase, A., Knapp, S., Krellenberg, K., Nivala, J., Zehnsdorf, A., Eds.; Volume 10, Future City; Springer International Publishing: Cham, Switzerland, 2018; pp. 93–115. [Google Scholar]
  38. Luckmann, J.; Flaig, D.; Grethe, H.; Siddig, K. Modelling Sectorally Differentiated Water Prices-Water Preservation and Welfare Gains Through Price Reform? Water Resour. Manag. 2016, 30, 2327–2342. [Google Scholar] [CrossRef]
  39. Nechifor, V.; Winning, M. Global Economic and Food Security Impacts of Demand-Driven Water Scarcity—Alternative Water Management Options for a Thirsty World. Water 2018, 10, 1442. [Google Scholar] [CrossRef]
  40. USAID. Water Valuation Study: Disaggregated Economic Value of Water In Industry and Irrrigated Agriculture in Jordan; United States Agency for International Development: Amman, Jordan, 2012.
  41. Water Authority of Jordan. Water and Wastewater Prices: Non-Residential Water Users; Water Authority of Jordan: Amman, Jordan, 2012.
  42. Water Authority of Jordan. Water and Wastewater Tariff for Quarterly Bills for Governorates which Are Managed by Companies; Water Authority of Jordan: Amman, Jordan, 2016.
Figure 1. The tiered supply curve (based on [19,27]) runs along the upper boundaries of two blocks sorted in order of increasing prices per unit of water. The areas between those blocks and the demand curve of a commercial establishment are interpreted as the shares of consumer surplus, which can be attributed to water supplied from the respective source, indicated by the light green and orange areas (cf. Notes 8 & 9 in Appendix A).
Water 11 00254 g001
Figure 2. Network water supply durations per week in Amman for the years 2011 and 2015.
Water 11 00254 g002
Figure 3. Groundwater wells in the model and their assumed abstraction limit per day.
Water 11 00254 g003
Figure 4. Simulation results: Average tanker water prices and consumption quantities per distribution zones (DZ) for the years 2011 and 2015. Fully exploited well fields are indicated by yellow spirals, while those with pumping capacities left at the end of the day are marked in blue.
Water 11 00254 g004
Figure 5. Simulation results: Average consumer surplus per DZ for the years 2011 and 2015, derived from different water sources.
Water 11 00254 g005
Figure 6. Simulated succession of well exploitation of establishments in selected DZ.
Water 11 00254 g006
Table 1. Log-Log-Regression of the population density and the commercial establishment densities of five different sizes. Absolute population and establishment numbers on a Governorate level were accessible/extrapolated for the years 2006 to 2015 and then divided by the respective areas of the Governorates to retrieve the densities.
Establishment Density (log)
No. of Employees1–45–1920–4950–99100+
Population density (log)0.997 ***1.011 ***1.012 ***1.029 ***1.005 ***
(0.015)(0.016)(0.016)(0.017)(0.019)
Intercept−4.027 ***−6.426 ***−8.768 ***−9.611 ***−8.998 ***
(0.071)(0.076)(0.080)(0.082)(0.091)
Observations120120120120120
R 2 0.9750.9720.9700.9690.961
Adjusted R 2 0.9750.9720.9690.9690.961
Residual Std. Error (df = 118)0.2570.2760.2900.2970.329
F Statistic (df = 1; 118)4671.688 ***4160.779 ***3767.090 ***3705.972 ***2895.134 ***
Note: *** p < 0.01.
Table 2. Commercial demand function inputs for establishments in different sizes, measured by the number of employees.
Coefficient (b)1–45–1920–4950–99>99
a 0 −1.2940311111
x empl j 0.4327920.8991962.2993123.3443754.0822355.921936
x urb j 1.1945311111
x vendor j 1.2491720.3070180.044776000
x hotel j 0.6196750.0614040.1194030.0666670.5333330.571429
x toilet j 0.0051735.0176998.88157910.632.2777877.2
x storage j 0.00076221.7245829.3322433.65714111.1111391.9286
x summer 0.409443-----
price−0.21858-----
Table 3. Algorithm for the Network Water Distribution.
0:While Q network > 0 :
1:Loop for all n connected :
2:  Calculate y network i , j Connected establishments determine demand by inserting network tariff in Equation (3)
3:  Calculate a b s network i , j Next, they determine their abstraction as in Equation (8)
4:  Set Q network = Q network a b s network i , j Decrease water availability
5:  If a b s network i , j > y network i , j :Return excess water
6:   Set Q network = Q network + ( a b s network i , j y network i , j )
7:   Set a b s network i , j = y network i , j
Table 4. Water user groups per category: Summer 2011.
CategorySummer 2011
Employeesn% Network only% Tanker only% Both
1–443548.116.9160.5632.53
5–194498.1734.2361.064.71
20–49434.952.5940.7456.67
50–99218.8017.4542.8639.69
>99323.952.0621.4376.51