1. Introduction
Efficient water use is an essential factor in mitigating global and local water scarcity [
1]. Previous research suggests that 80% of the world’s population may face problems in accessing water resources [
2]. Although Colombia is a rich country in terms of water resources, competition for water resources can be intense in areas with a large population and a high level of economic activity [
3]. In addition, and despite recent progress, there is still a need for establishing effective policies for integrated management of water resources [
4].
Residential water demand management strategies, such as adjusting consumer prices, imposing restrictions on water usage, providing information in the media and demonstrations of efficient water use and the use of water-saving devices in homes have been applied with an aim to manage the deficit between availability and demand for water [
5,
6,
7,
8]. These initiatives, which have been primarily tested in developed cities, invite water users, regulators and managers to develop recognition and respect for the roles and perspectives of various stakeholders in the development of a participatory water management program [
9]. With this approach, educational campaigns implement strategies designed to encourage voluntary water conservation, thus seeking to change users’ behavior. However, educational programs are often developed with little information on water consumption in homes [
10], and so the resulting approaches to water-saving strategies can be inefficient [
11].
This pilot study aims to identify the socioeconomic and behavioral variables that influence residential water consumption changes and to assess the effects of using of educational strategies to promote the voluntary management of residential water demand in urban households in the fast growing municipality of Soacha in Colombia. Soacha stands out for its water sufficiency, although it is one of the Colombian municipalities with the highest social, physical, and environmental stresses. This study implemented an environmental education program for the voluntary management of water demand in collaboration with three educational institutions. Most previous research on voluntary management of residential water demand has studied developed urban areas; here the intention is to close the existing knowledge gap by studying household water consumption and the effectiveness of educational programs in low or medium-low income residential units. The methods and results proposed here will be useful for larger scale implementations and for other cities facing similar high levels of urbanization and, in general, economic, social and environmental challenges.
1.1. Voluntary Management of Residential Water Demand
The constant growth of population, and hence the challenge to supply sufficient water, provides the impetus to promote efficient use of water. Water-efficiency strategies include introducing legal regulations and tariff-based measures, providing information and/or implementing educational campaigns, and using new technologies, such as water-saving devices and controls to reduce or repair leaks in the water distribution system [
12]. For example, fixing the price of water is a top priority, because it is known that low costs can induce excessive use [
5]. Additionally, installing high-efficiency technologies in household appliances can generate water consumption reductions in a home of between 35 to 50%, while programs to educate users on water consumption have shown to achieve reductions ranging from 2 to 12% [
7]. However, aspects, such as income, household composition, environmental awareness, community participation and the long-term effects, need to be carefully evaluated for a better understanding of the expected outcome of any of the aforementioned water demand management strategies [
13].
Although educational campaigns to promote behavioral changes could achieve relatively low reductions in comparison with other management strategies (i.e., compulsory and restrictive measures, such as rationing, use allowances or increase in billing rates), they allow for a reduction in the demand for residential water without generating conflicts and resistance in users [
10]. Therefore, changes in behavior on a voluntary basis may be critical to the promotion of long-term cultural changes in the way community members think about and use water [
14].
1.2. Socio-Economic and Behavioral Factors that Control the Demand for Water
The study of consumer behavior allows for an understanding of the attitudes of the community regarding the management of water demand. Different factors can be used to estimate the water use in a given area, taking into account the socioeconomic information of households in addition to the characteristics of the devices used [
15], population growth and future demographic changes [
16]. For example, Arbués et al. [
5] and Barrett et al. [
17] evaluated the relationship between socioeconomic status and water consumption, finding that some of the variables that determine water consumption in households are: The cost of the service, the family income, the characteristics of the household and the type of housing. Furthermore, Russell and Fielding [
18] identified that behaviors, attitudes, beliefs, habits or routines, personal aptitudes and socio-demographic factors can promote voluntary residential water conservation. Manco et al [
19] also considered some additional variables grouping them by factors as follows: (a) Social factors: People per household, family composition, and level of education; (b) Economic factors: Historical consumption; (c) Cultural factors: Values, norms, and social models; and (d) Climatic factors: Temperature, rainfall and relative humidity. In general, the major variables that determine behavior around water consumption in households are: Price of water, billing cycle, household characteristics, family income, educational level, climatic conditions, type of housing, water use regulations, and the size of the city [
17,
20,
21].
1.3. Educational Programs and Behavioral Changes
Educational campaigns encourage voluntary conservation of water, either by altering behavior [
22] or the adoption of devices that are more efficient in the use of water [
23]. To achieve behavioral changes, several strategies are effective, such as, among others, the use of informative material, training on proper water management, guidelines in the media, multimedia applications, and feedback on consumption levels [
15,
24,
25,
26]. Geller [
14] indicated that the provision of informative material raises awareness and efficiently communicates knowledge about the behaviors necessary to conserve water. Notably, the supply of informative material and training programs is the most often and extensively used strategy, having had successful application in several countries.
Katz et al. [
27] evaluated the effectiveness of an educational campaign in Israel, a country with a chronic shortage of water. This campaign included the sending of conservation messages over e-mail in addition to an online exercise that allowed the researchers to compare the participants’ reactions to the conservation messages versus an increase in the water price. The results showed an average of 7.6% reduction in water consumption per household, which indicates the significant effectiveness of educational campaigns in the context of scarcity of resources, at least in the short term. In Queensland (Australia) the educational programs generated not only immediate reductions in the use of water but they also contributed to changes in attitudes and long-term behavior, going from 180 to 120 Lt/inhabitant/day in three years [
28]. In Saudi Arabia, free technical assistance and support provided at the time of installation of sanitary appliances in residences along with extension programs and education in graphic form produced a positive impact that reduced the consumption of water by 20 to 30% [
23]. In Bogotá (Colombia) an educational campaign for water saving managed by the mayor’s office arose due to the collapse of the water supply system forcing a reduction in water consumption to avoid scarcity and public health problems. Consumption went from 21.8 to 11.9 m³/household per month over a period of 10 years, corresponding to two years of effective educational campaign and the eight years after completion [
29].
Despite these favorable results, the reduction in water consumption did not occur everywhere. For example, Fielding et al. [
24] found that educational programs can be effective in the short-term, but to remain effective in the long-term require continuous messages on water conservation. They evaluated educational programs for 221 residents in South East Queensland (Australia). They collected information on participants’ water use for the periods before, during, and after the implementation of the educational programs. Their results showed that water consumption increased in the control group, but decreased in the treatment groups. However, after the program ended, the use of water by the treatment groups showed an upward trend. The authors concluded that the long-term effectiveness of educational programs depends on a continuous implementation of the strategies and a context of water scarcity. Therefore, determining a change in behavior and the reasons behind it is important [
6,
30]. Furthermore, the behavioral change for water demand must consider long-term results [
31,
32]. A continuous program would allow for a greater acceptance of the educational campaigns as part of water demand management policies [
30,
31].
2. Case Study
This study was implemented in the municipality of Soacha, located to the south-west of Bogotá (Colombia) with a population of 700,000 inhabitants in 2015. The study was located in communes 5 (San Mateo) and 6 (San Humberto). Of the total number of inhabitants in Soacha, 16% and 18% live in these communes respectively. The participating schools were: The Liceo Mayor de Soacha "Bienestar para todos" (45 students) which is a private school, the Instituto Educativo San Mateo (26 students) and the Instituto Eduardo Santos (49 students) which are both public schools. It is worth mentioning that although the Liceo Mayor de Soacha is a private school, it receives public subsidies and the socioeconomic conditions of its students are comparable to those from the two public schools (students also belong to low and medium-low income homes). From the initial sample of 120 households, 25 were excluded (corresponding to about 20%), because the local water utility reported that these households do not have water consumption measuring devices, although they are connected to the water supply service. Consequently, their consumption readings remained constant over time. Only when the self-report techniques were analyzed were these households included. In this case study, homes are distributed according to the socioeconomic strata, as follows—15.13% belong to Strata 1 (households with low-low incomes), 30.25% belong to Strata 2 (households with low incomes) and 54.62% belong to Strata 3 (households with middle-low incomes).
Regarding water consumption for the sample, on average, households consume nearly 60 L/person/day. Breaking down the total, 50% of households consume up to 50 L/person/day, 39% consume between 50 and 100 L/person/day, 6% consume between 100 and 133 L/person/day and 2% consume 260 L/person/day, which was the highest consumption in this study. The average consumption of the study is low when compared to the per capita consumption in Colombia. The majority of households have between 4 to 6 inhabitants with consumption of between 100 and 300 L/household/day. The households with the highest total consumption exceed 10 inhabitants, of which there were two cases. One household of 4 inhabitants used 1,017 L/household/day. This household was renting the property with the water bill included in the rent, here it can be inferred that there was less concern for saving water. The second case showed a consumption of 1,150 L/household/day (17 inhabitants). This property was mortgaged and the water bills were not included. Regarding the type of housing, 67.5% of families live in houses (as opposed to apartments) which also coincides with higher consumption. In this case study the house tenure variable should receive special attention: Whether the family owns the house (including those with a mortgage) or pays rent could play an important role in determining water consumption (in our case 40% of the households are owners outright, 30.53% are repaying a mortgage and 29.47% are renters).
3. Materials and Methods
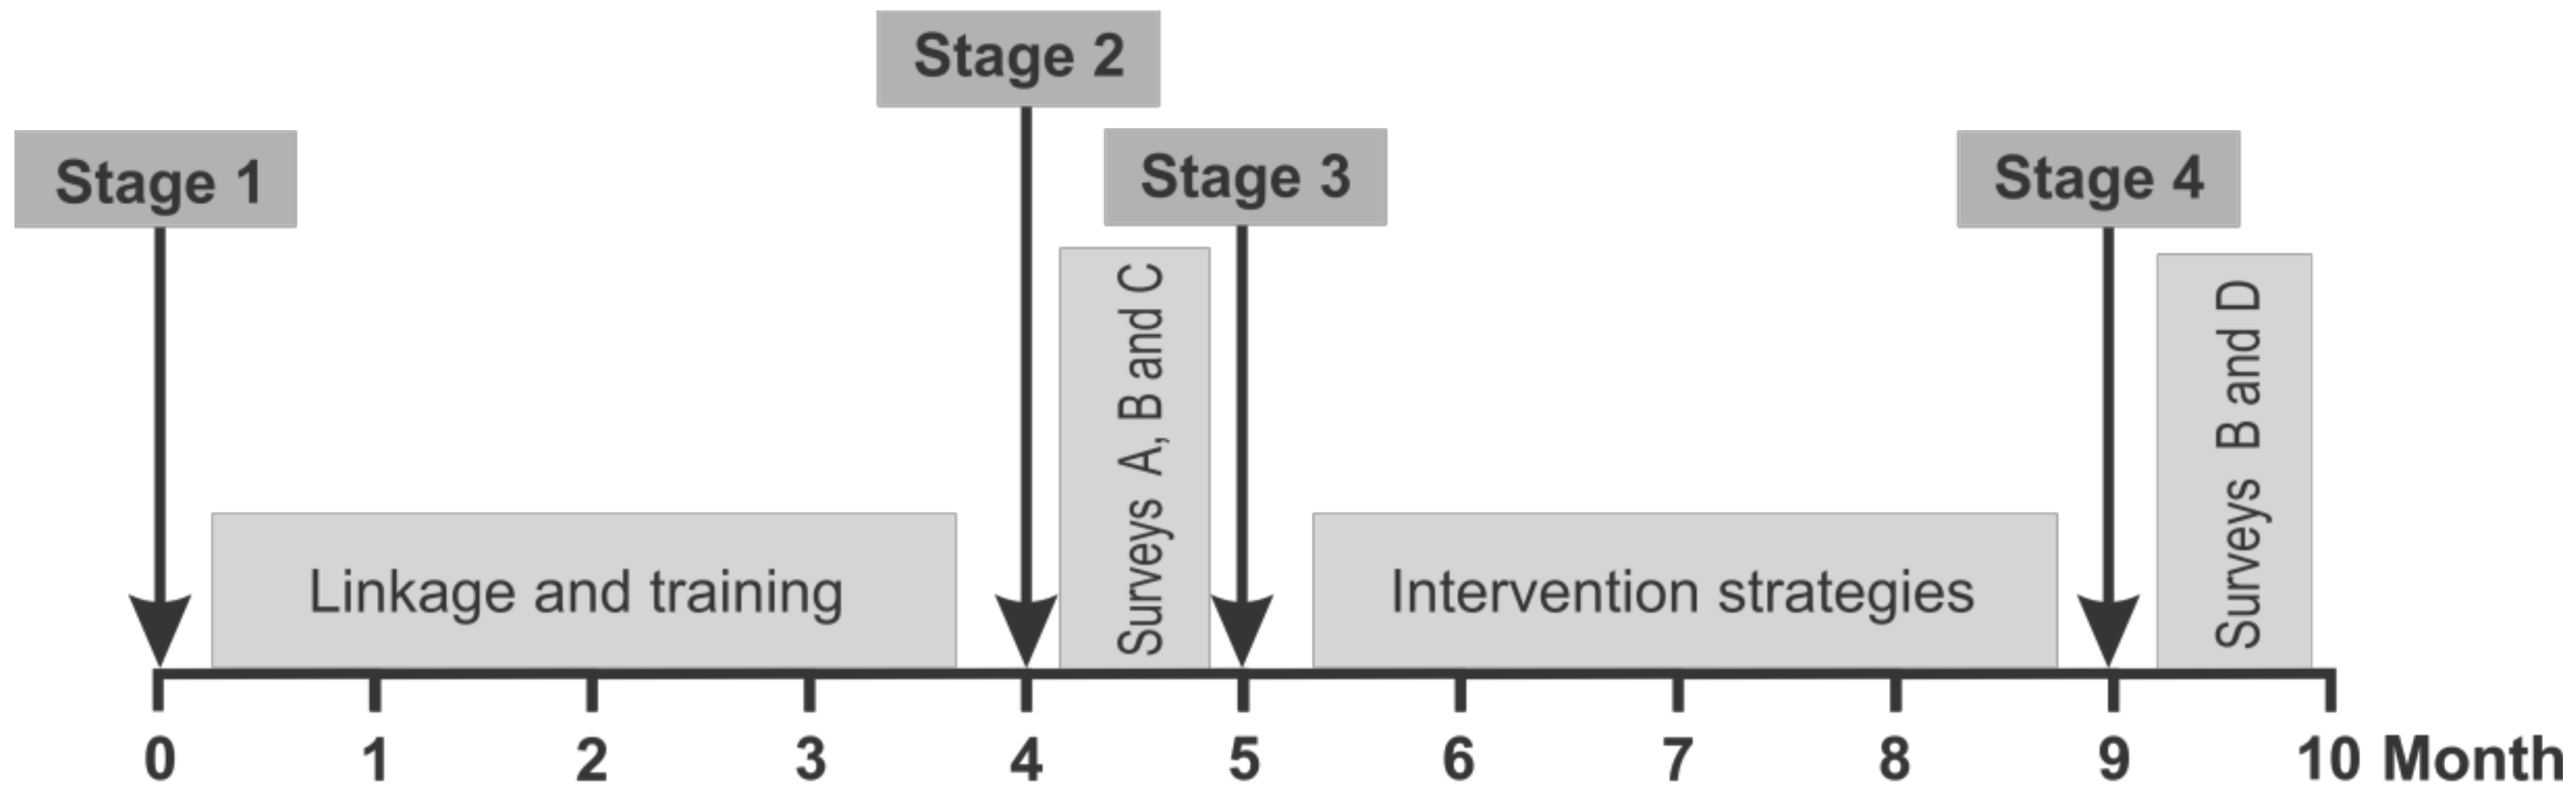
An educational program was implemented focusing on intervention practices associated with residential water consumption. For this, partnerships with schools were established, including teachers and students from grades six to eleven. The study was presented to the Secretary of Education to obtain their support. The Secretary of Education suggested that the participant schools should consider the scopes of both their environmental educational projects (known as PRAEs and compulsory for every school in the country) and the study. The hours that the participant students spent on the project were considered valid towards the hours of social work that students are required to complete as part of the PRAEs of each institution. Therefore, the teachers supported the research by involving their students who were the study’s main actors both in the institutions and their homes. The ages of the participants ranged between 12 to 15 years. Four stages were established: (1) Linkage of participating students and their families, and training on the objectives and scope of the project; (2) diagnosis of the socio-economic situation and behavior regarding water usage; (3) establishment of the educational campaign aimed at saving water and (4) monitoring changes in behavior during the campaign [
24]. The project lasted for 10 months. During the initial four months stage 1 was developed. After that, the diagnosis (stage 2) was carried out and the educational campaign was implemented over the remaining 5 months (stages 3 and 4) (see
Figure 1).
3.1. Implementation of Educational Program
The intervention periods were planned according to the teaching schedule in the educational institutions and the periods in which the water service is invoiced and delivered to households. The participation of students and their households was random and voluntary, based on the dissemination of the study in the respective educational institutions and the interest in joining this study. After this linkage of students and their families and their training on objectives and scope of the study, three intervention strategies (i.e., the virtual platform for students attending Instituto Educativo San Mateo, learning activities for students attending Liceo Mayor de Soacha “Bienestar para todos”, and graphical tools for students attending Instituto Educativo Eduardo Santos) were carried out with a bi-monthly frequency in 120 households, 30 for each intervention strategy, as well as 30 households used as a control (for these the students did not participate in the educational program at the three schools). In those schools with more that 30 students interested in participating, the remaining students were either part of the control group or they joined the group of students from the school that was still missing participants (i.e., the virtual platform group was completed with students from another school). The intervention strategies are described below.
3.1.1. Virtual Platform
A virtual platform (i.e., a web page) was developed with the purpose of interacting with users by sharing experiences of reducing water consumption in their homes. The tool included a presentation with the project description along with photos of the student’s families’ experiences. A reference map was also included to establish the location of each user with photos of the water-saving actions and space to leave a comment to interact with other participants. The platform also included a section with videos, workshops, games and interactive activities and, finally, a forum where students communicated and accessed a survey. The participants of this intervention strategy received training on how to navigate the web page and after that, they were able to work autonomously.
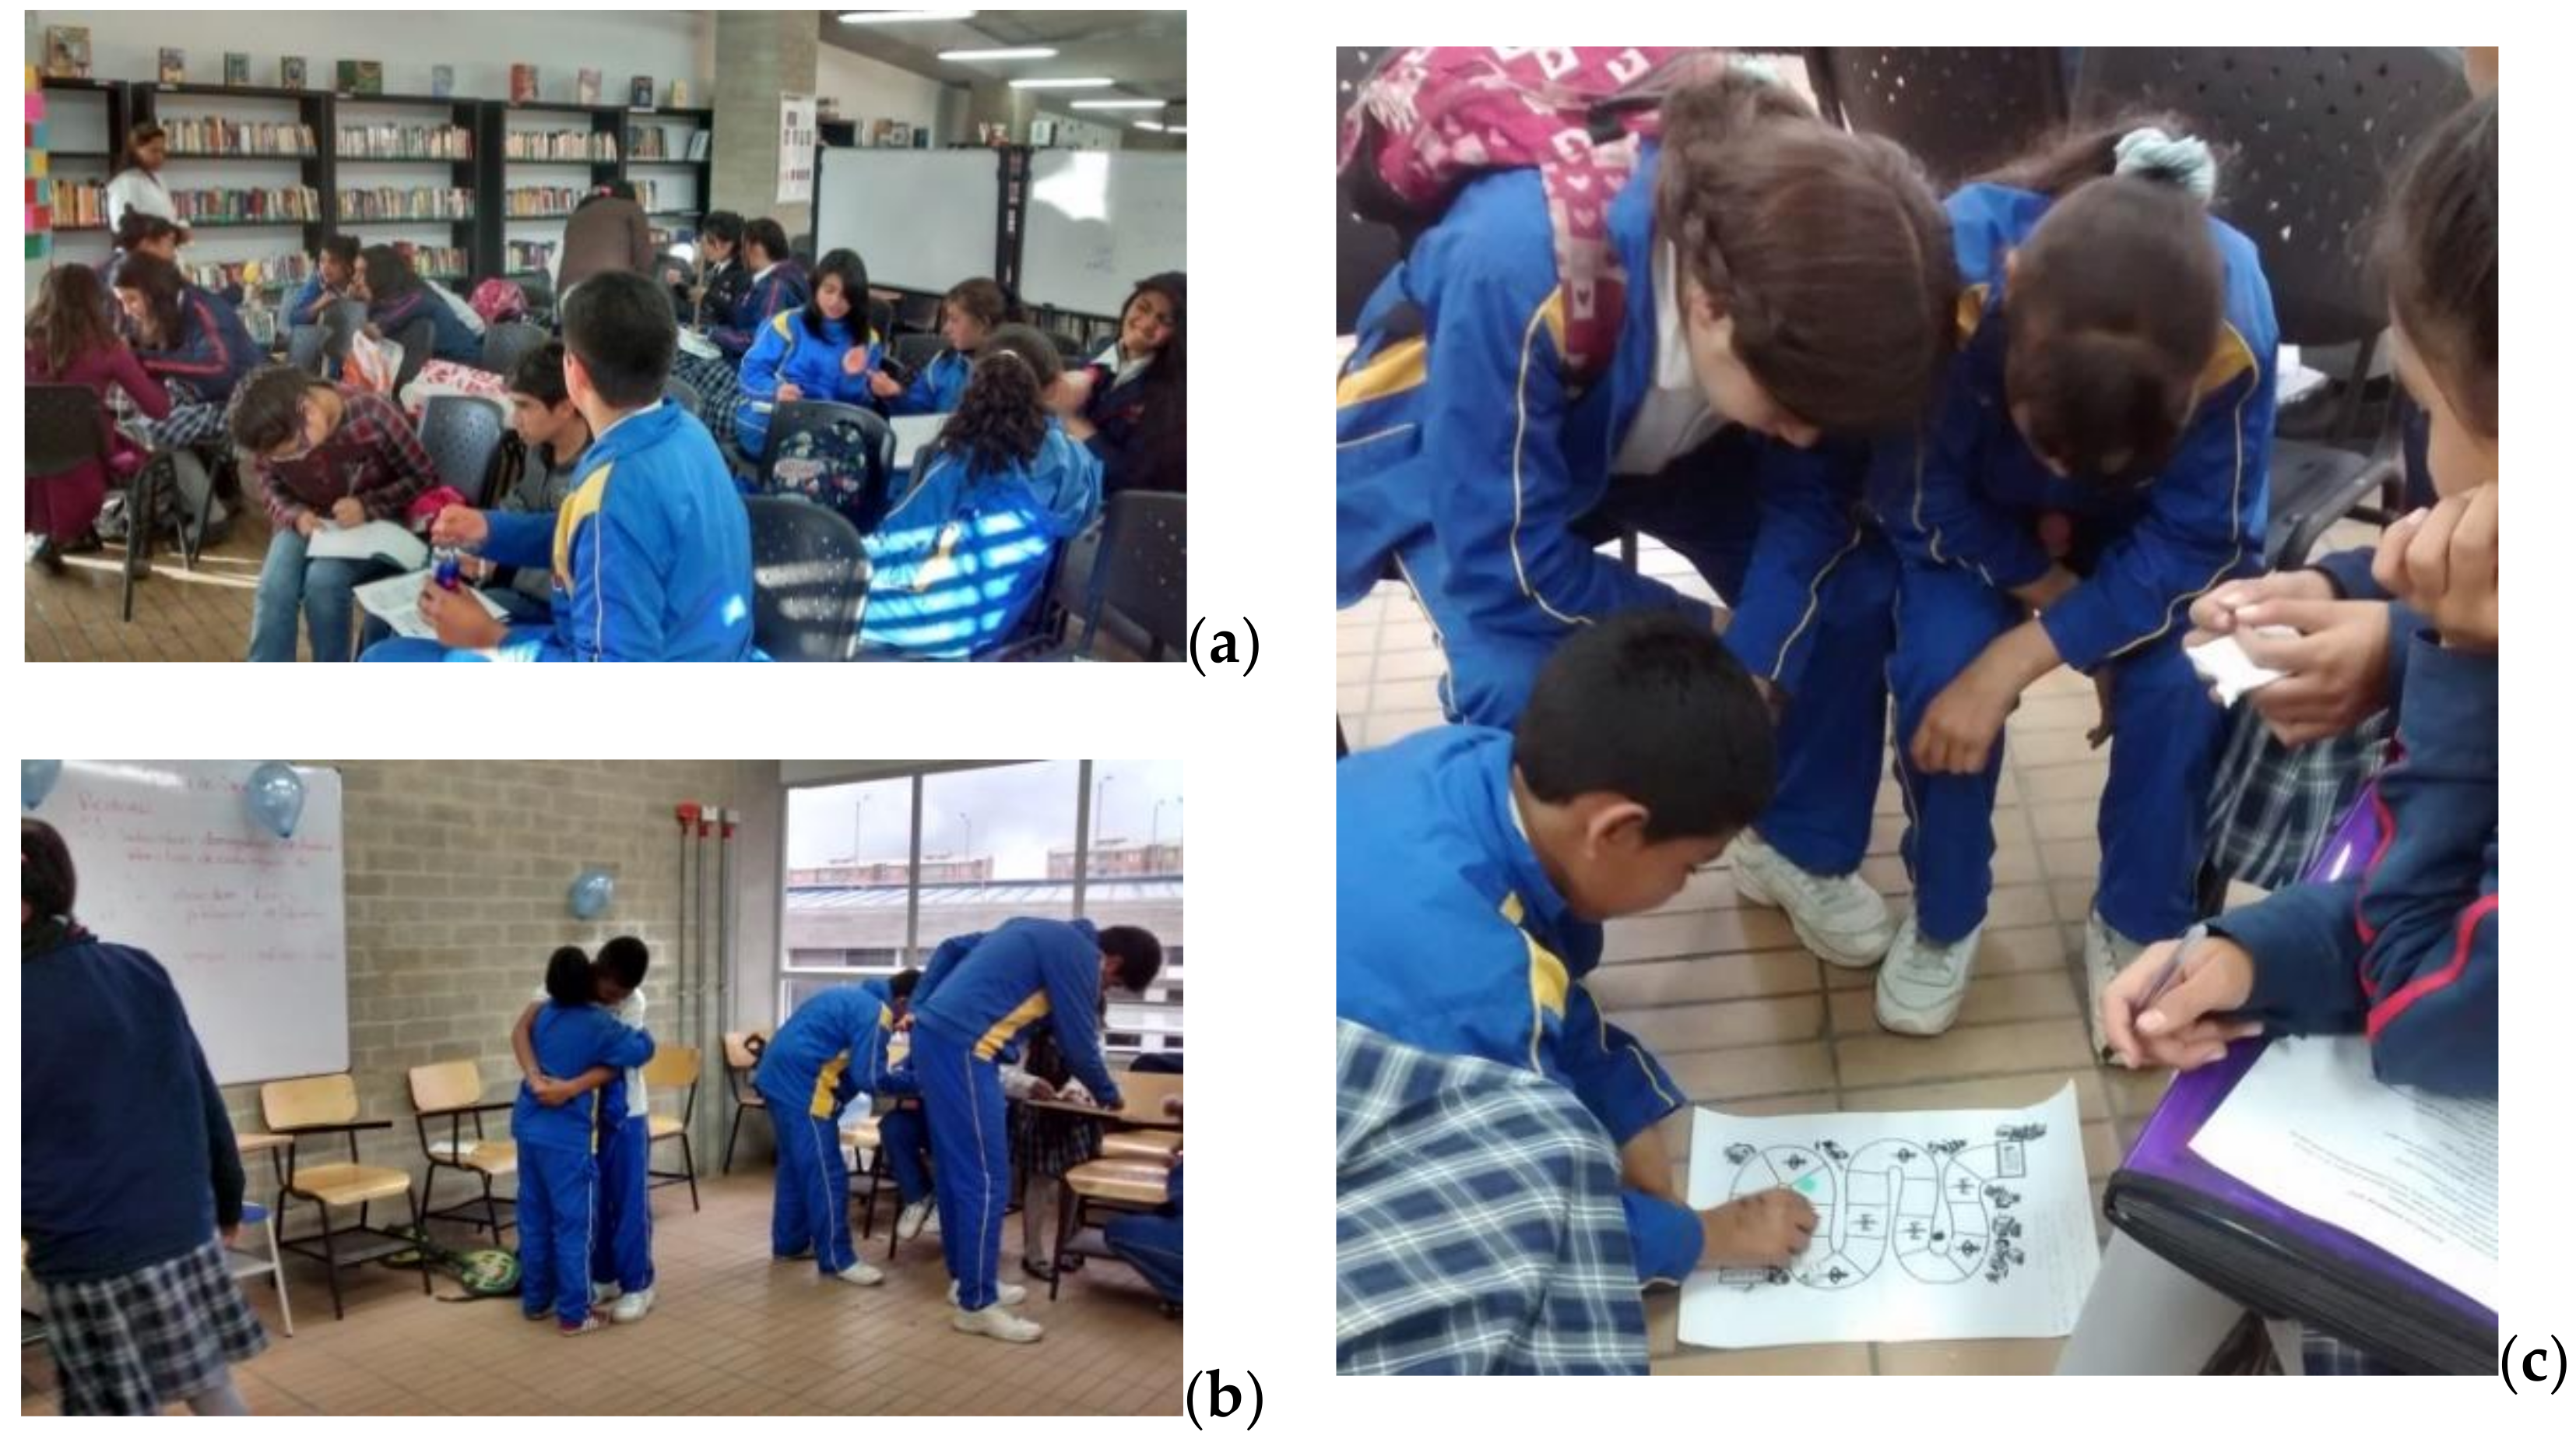
3.1.2. Learning Activities
These activities focused on using face-to-face educational workshops with videos, experiments, and games on water saving measures for the daily water consumption activities that take place at home (see
Figure 2). Emphasis was placed on issues, such as: Sources of water, water pollution, problems with water resources in the country, water care, measurement of water used at home, and saving techniques. The objective of this strategy was for students to lead their families in the change of consumption habits while being trained in topics related to the management of water resources. To do so, the students took part in hands-on workshops and were issued with practical activities to be carried out at home. The parents were also invited to an introductory meeting in which they were informed about the study and the role of students and their families in it.
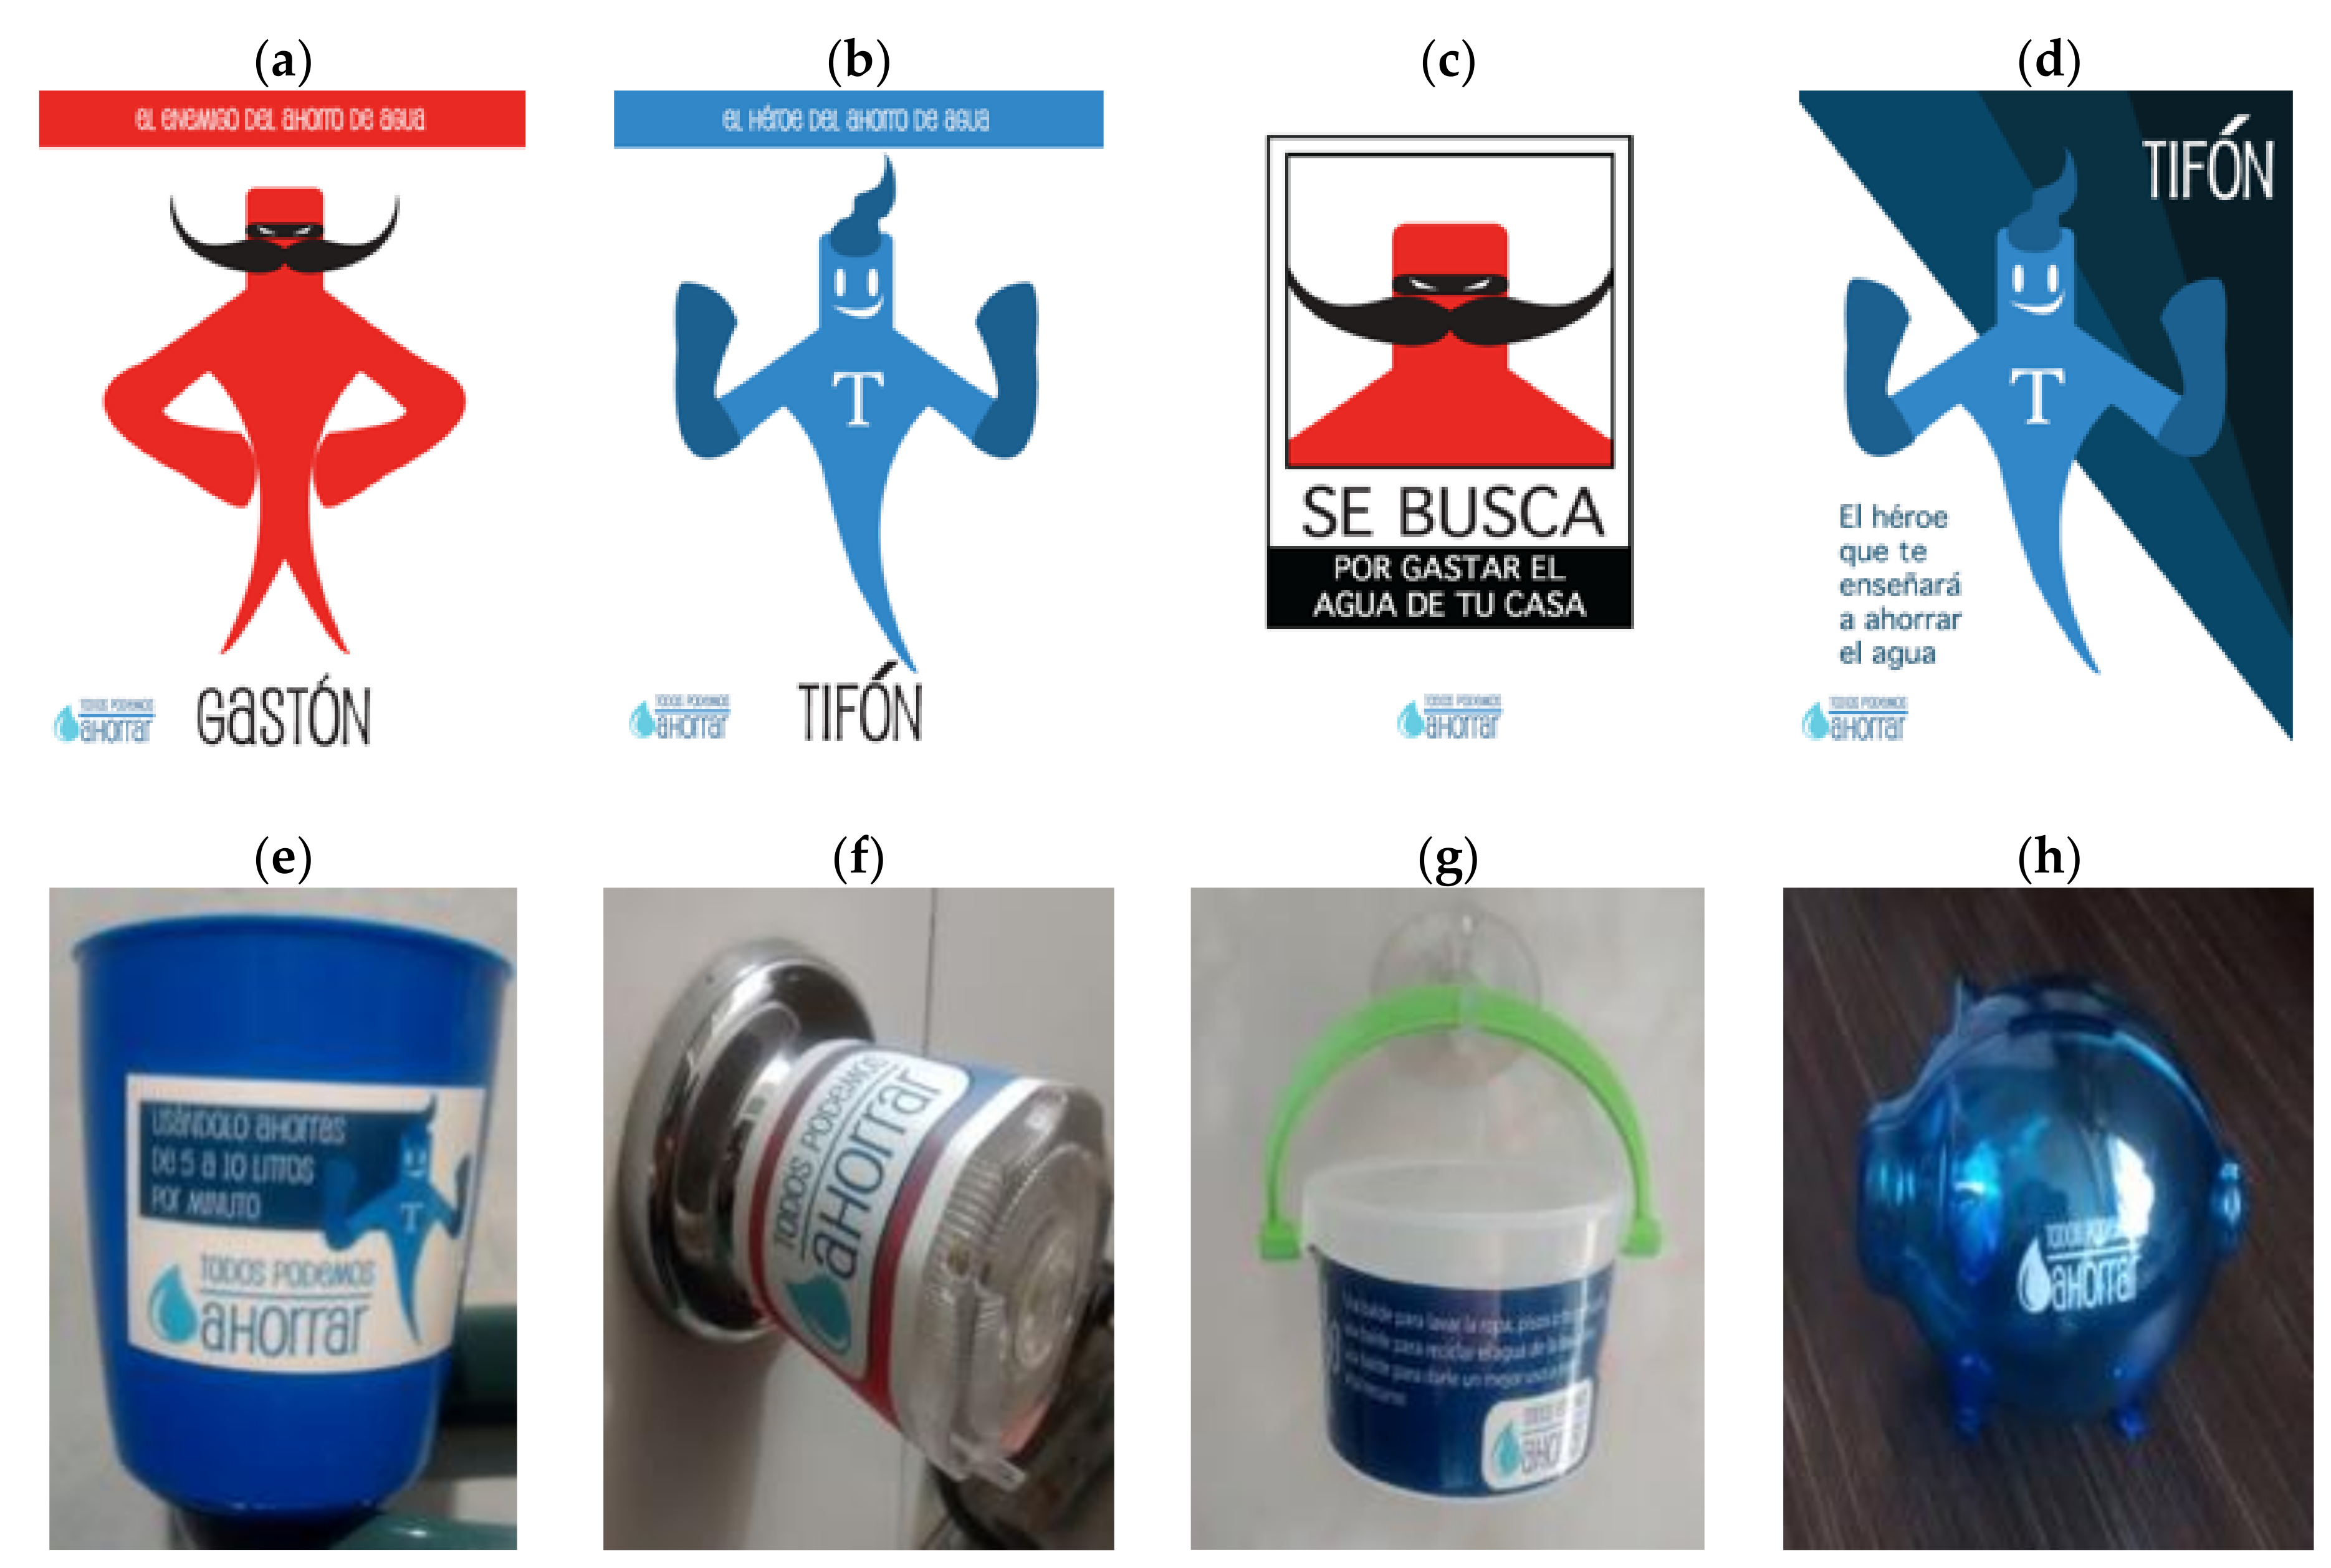
3.1.3. Graphical Tools
Graphical techniques were implemented as tools to persuade the participants to reduce their daily water consumption through information about the actions and measures for saving water in specific places around the home. Stickers and plastic elements for bathrooms, house keys and laundry areas were designed and provided (see
Figure 3). Short student training sessions on the correct use of these elements were conducted.
3.2. Information Gathering Instruments
The baseline was established for both the control and the intervention strategies groups with the application of a survey of consumption measurement and socio-demographic factors. Aspects, such as general characteristics of each group and the study area, were gathered (Survey A). This survey also requested information on household water consumption, which was confirmed by reviewing the bill invoiced by the local water utility.
A self-report survey on saving techniques was also applied (Survey B, adhering to the survey proposed by [
33] but using water saving techniques proposed by [
19]). Each user made a self-report of their water consumption behavior taking into account different places in the house, such as bathrooms, kitchen, laundry and external activities. An additional survey (Survey C) evaluated the quality-of-life factors (of the family as perceived by the student) as those studied by [
33], where psychological factors were analyzed, such as social influences, self-motivation, and personal well-being.
Finally, an evaluation survey (Survey D) was applied to monitor the changes in the attitudes and behaviors of the participants of the program and, in this way, obtain feedback after having made the interventions. This survey was adapted from the one used by [
25] in a study whose purpose was to promote the sustainable consumption of electricity. Individual guidance was provided for each of the surveys applied.
3.3. Statistical Analysis
The statistical analysis aimed to: (i) Identify the socio-demographic, environmental, physical or quality of life variables that better explain water consumption changes during and after the educational program, and (ii) measure those water consumption changes. To establish which variables were associated with water consumption changes, a regression of ordinary least squares was used. A linear correlation between the difference of the water consumption at the baseline and at the end of the intervention strategies was obtained, considering socio-demographic, environmental, physical and quality of life factors, and type of intervention strategies (see
Table 1). The explanatory variables were numerical and qualitative. The surveys of self-report techniques and quality of life factors were measured using the Likert scale [
34] with frequency categories from never to always which were assigned numerical values. The qualitative variables were used as Dummy variables [
35] in order to integrate them into the regression model. To quantify the water consumption behavior changes between the baseline and the end of the intervention strategies, the signed Wilcoxon rank test [
36] was used. Positive or negative changes in the water consumption behavior can potentially be translated into the reduction or increase of water consumption respectively.
4. Results and Discussion
4.1. Variables that Influence Changes in the Demand for Water
A lineal regression model (R² = 0.43) identified the variables that better explained the change in water consumption (
p-value < 10%). These are: Belonging to an intervention strategy (i.e., graphical tools), housing tenure modality, type of housing, number of families, strata, income, education level of the head of household, and laundry method (either manual or by washing machine). Moreover, the model also identified two quality of life factors: (i) Enjoyment of nature and culture and (ii) good family relationships (
Table 2).
We selected the statistically significant variables—further evaluated in different linear regression models—with
p-values lower than 0.1, as presented in
Table 2 (boldface type), in order to consider both marginally significant variables and highly significant ones. This analysis showed that the use of graphical tools, the type of housing, the number of families, and renting are highly significant variables (
p-values lower than 0.01) related to the changes in water consumption even with low values of R². As shown in
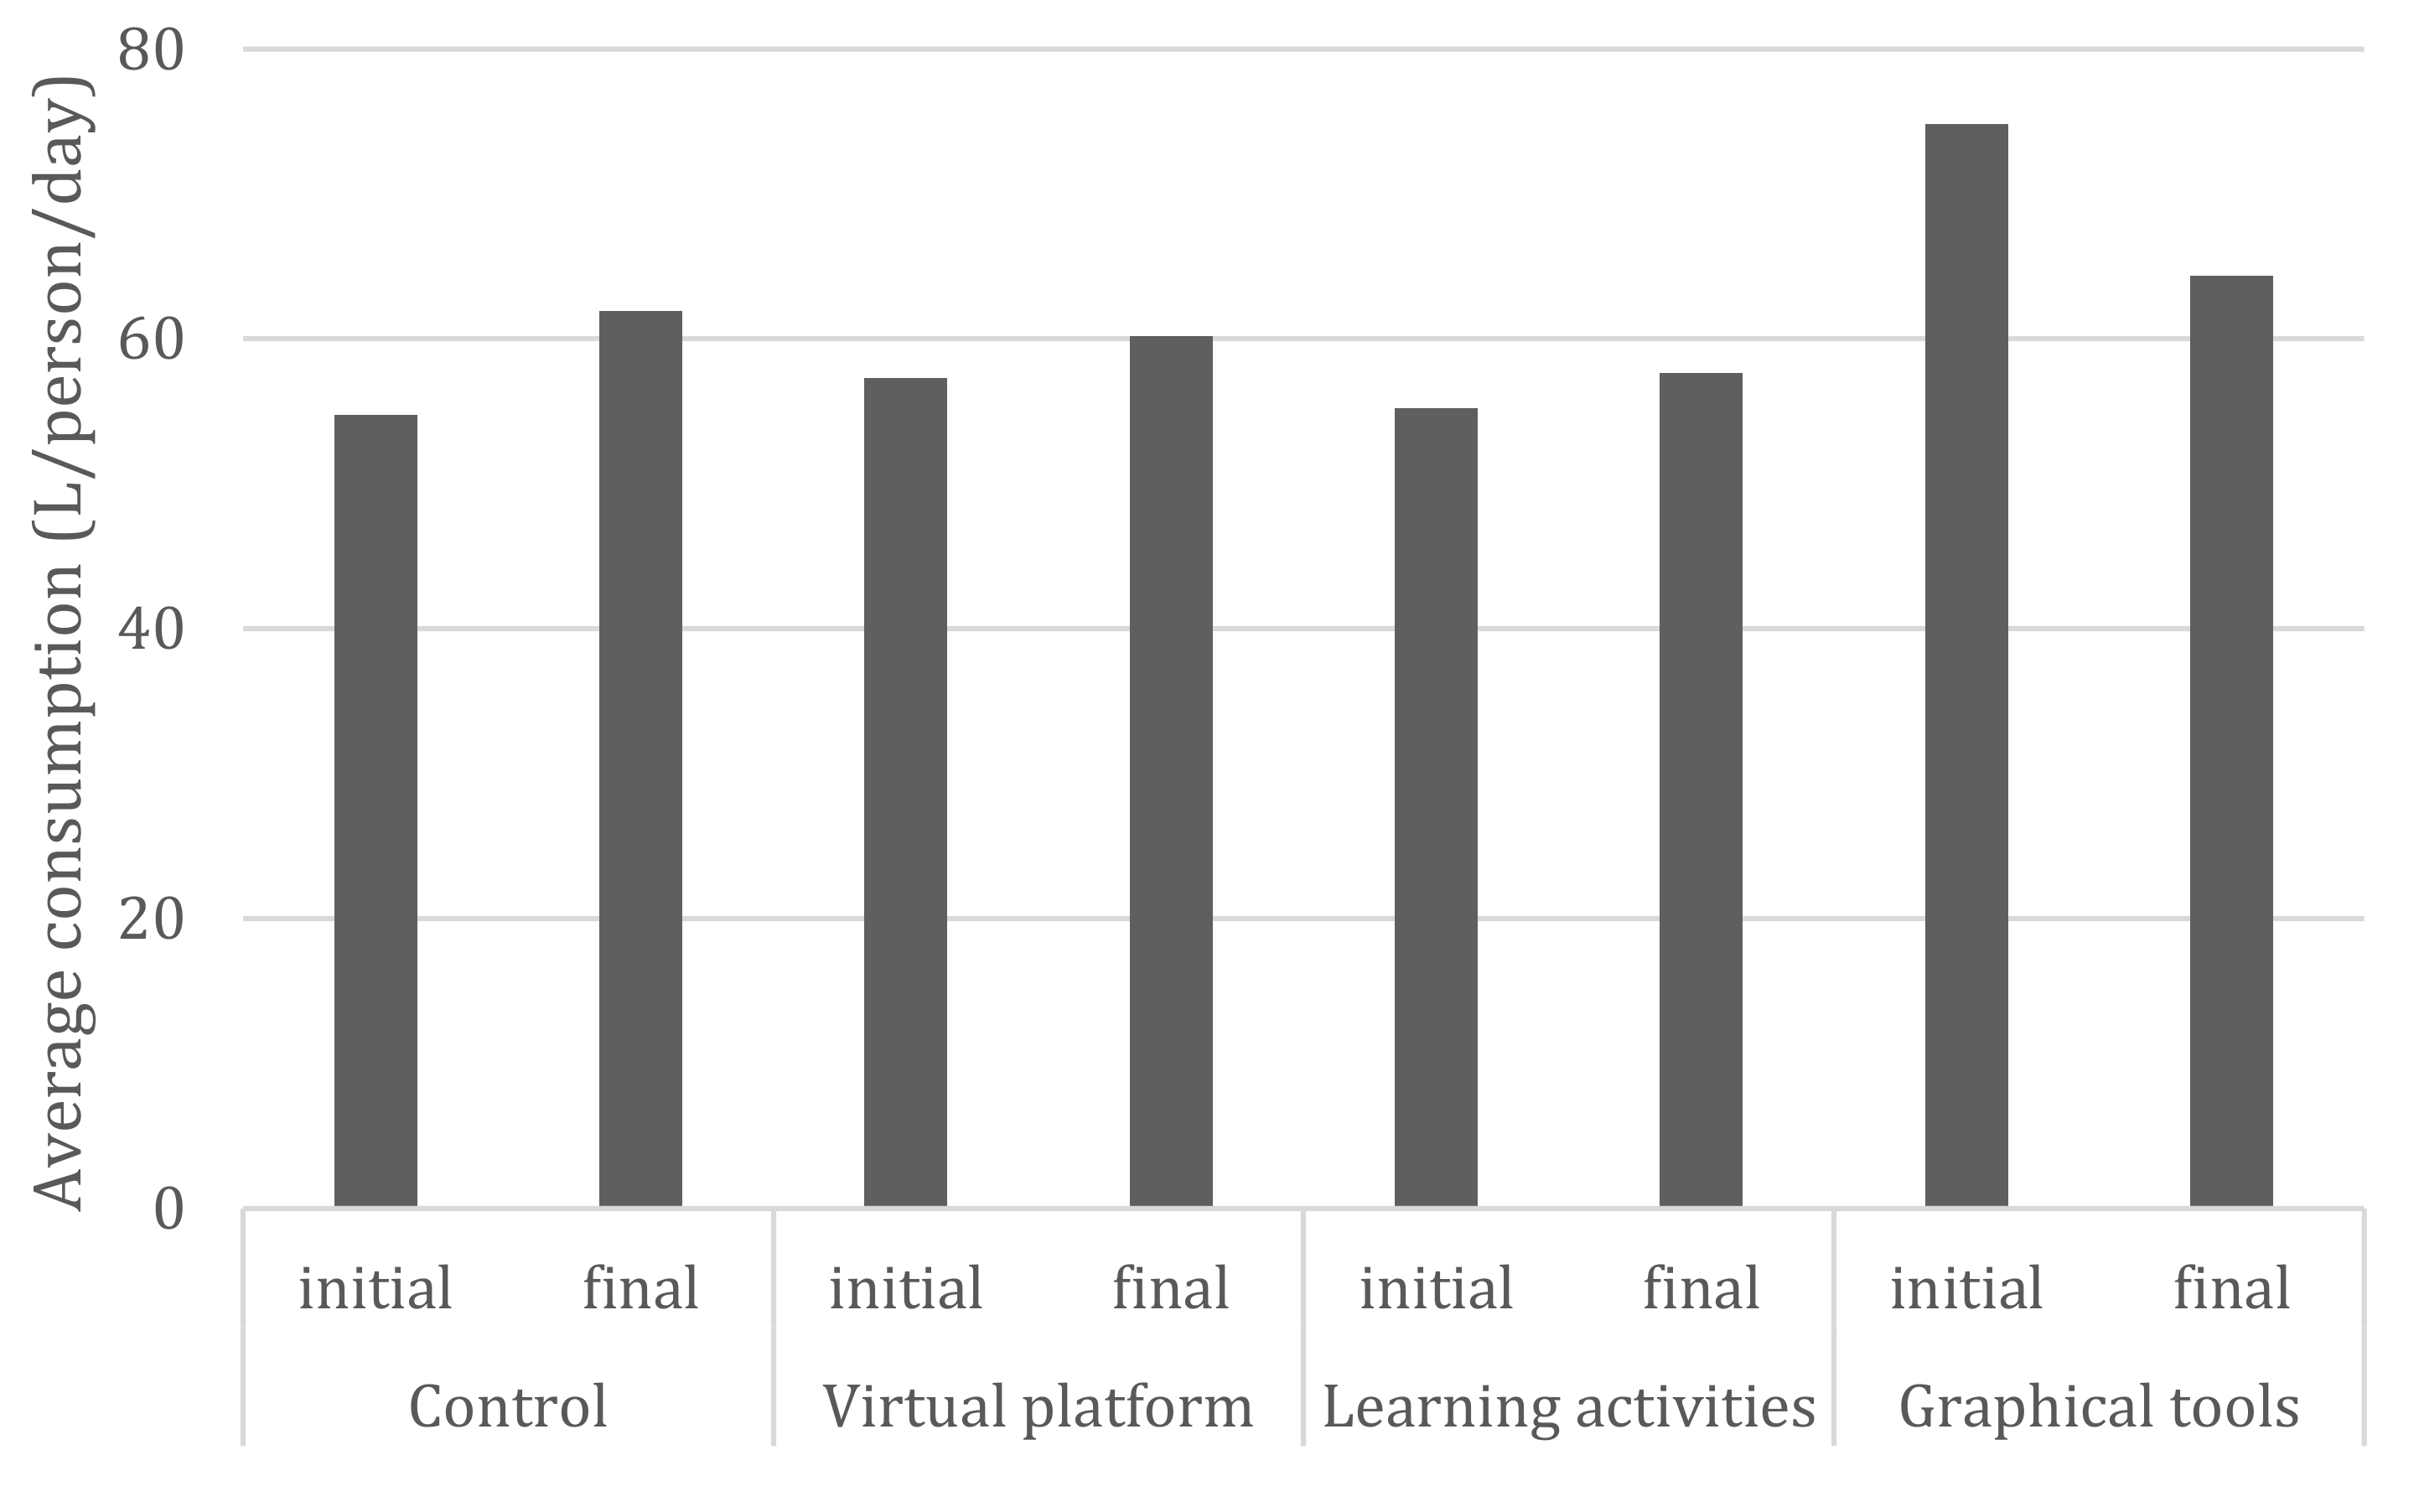
Figure 4, only the graphical tools reduced water consumption (i.e., 14%), which indicates the positive effect of the applied strategy. It is important to note that the regression models indicate a statistically significant decrease in water consumption if the household receives the graphical intervention strategy, which translates into a reduction in consumption. We can see that the initial average water consumption (per person) for the graphical tool group is higher than the rest of the groups. The latter is related to the fact that, in this group, 36.7% of the households are composed by more than one family, in contrast to the control group with 17.7%, the virtual platform group with 23.3%, and the learning activities group with 0%.
Regarding the variable type of housing, a statistically significant reduction in consumption was observed for houses. Similarly, He and Kua [
33] achieved greater success in savings for larger households probably because 69.47% of those living in houses in the study own the property, which fosters greater concern about the consumption of public services. When looking at the effect of the tenure modality, households repaying a mortgage showed a significant reduction in consumption. This is an important result, mainly because nearly half of the households in this study belong to this modality (with water bills not included in the monthly rent). In addition to this finding, belonging to Strata 2 (low income households) significantly influenced water consumption changes: Households in Strata 2 increased their consumption when compared to Strata 1 (low-low income households). This result is similar to the findings of [
20] who affirm that the probability of low-income households taking measures to save water is lower. In our case study is worth mentioning that Strata 1, 2 and 3 have subsidized tariffs (the lower the strata the higher the subsidies), Strata 4 pays the actual cost of the cost of supplying potable water and Strata 5 and 6 pay a higher tariff than Strata 4, thus allowing the allocation of subsidies to Strata 1, 2 and 3.
In households where two or more families live together, the regression model shows a statistically significant coefficient suggesting an increase in consumption. This result is consistent with the diagnosis that households with the highest number of inhabitants registered the highest water consumption. The households made up of two or more families correspond to 20.83% of our total study. Finally, the quality-of-life factor “enjoyment of nature and culture” has a statistically significant effect on water consumption: There is an increase in water consumption when families value nature and culture which is contrary to the expectation that access to nature and culture favor water saving actions. In addition, the factor of good family relationships significantly decreased the variation in water consumption. Thus, this study shows that good family relations impact water consumption as the message on water-saving gets passed round within the family when the relationship is good.
4.2. Effect of Educational Campaigns
The effect of the educational campaign was also evaluated via the self-report of consumption behavior based on water saving techniques. We compared the application of this instrument to the baseline and at the end of the campaign using the Wilcoxon signed-rank test [
36]. The results showed that all intervention strategies presented a positive effect on saving water (
Table 3).
The control group obtained the least positive changes and even increased its consumption for nine of the 24 recommended techniques. Nevertheless it is noteworthy that this strategy of zero intervention had three positive statistically significant self-report techniques. The virtual platform resulted in several positive changes in water consumption. However, it only showed five statistically significant effects of positive savings. From the learning activities, there were significant changes in the report of nine savings techniques with positive change. The graphical tools obtained seven statistically significant positive behavioral changes.
The most effective self-report techniques were using a container inside the cistern, energy-saving devices, a cup for brushing teeth or shaving, collecting water when regulating the temperature, and reusing water from other places in the house. For the particular cases of turning off the tap when soaping hands and dishes in sinks and soaping during showers, it was observed that these techniques did not show differences between the studied periods, which is presumed to be because these water saving habits are already established in the households studied. In the water collection when regulating temperature technique, it is important to highlight that 50% of households do not have water heaters.
The learning activities and graphical tools had a greater effect on the positive behavior changes around water demand. This change revealed that the development of environmental education projects expands knowledge and understanding of the complexity and globality of problems and teaches attitudes, values, and behaviors [
19]. In the same way, Álvarez and Vega [
37] suggest that individuals only assume responsible environmental behaviors when they are informed about ecological problems and are motivated towards it. Moreover, Geller [
14] indicated that the provision of information through graphic materials raise awareness and efficiently communicate knowledge about the behaviors necessary for the conservation of water and offer suggestions on how to do it. Our study evidenced that the provision of materials that encouraged a change in behavior, such as, for example, a cup with savings information printed on it, had a level of significance of 0.0002 in the positive shift in water savings.
4.3. Evaluation of Educational Program
For each intervention strategy, an evaluation instrument was applied to analyze aspects related to the participation in the applied strategy, actions by other members of the household, behavioral changes and the environment in which the project was developed. For the three intervention strategies, it was observed that households responded positively to the application of educational campaigns, having the highest percentages of responses correspond to “agree” and “strongly agree”. Residents adopted the recommended measures to reduce water consumption for the following reasons, in order of importance: Concern for the environment, the satisfaction derived from applying the procedures, trust in the people and institutions promoting the project, ease in the application of the measures, saving money and the motivation generated by the campaign.
Mass et al. [
38] suggested that education and conservation programs that foster prosocial and environmental attitudes are a practical strategy for inducing conservation. As shown by [
10], educational campaigns do not generate conflicts nor resistance in users’ acceptance, contrary to necessary and restrictive measures, such as rationing or an increase in rates. However, it is important to note that the billing rates in Soacha are in some cases up to 50% lower compared to Bogotá (the capital city). The tariff for the water supply system service is established based on consumption and strata: There is a fixed charge value per m³, and if consumption surpasses 40 m³, for example in Strata 1, the value of the cubic meter is tripled.
4.3.1. Virtual Platform
When asked if the virtual platform served as a water saving tool, approximately 27% answered desagree or neutral, which reveals that this strategy did not contribute to savings for a considerable number of people. This result becomes more relevant considering that 60% of students did not review the online content at all or completed very little. The fact that 84% did not carry out the activities or showed little interest might explain the lower performance in water saving. Despite these high percentages, the students reported a change in their behavior regarding the use of water, also learning about the efficient use of water, and became concerned about environmental issues. However, the virtual platform did not prove to be an effective strategy, possibly due to errors in the functioning of the webpage (36.7%), difficult access (40%) and lack of indispensable equipment for the use of a computer and the internet (43.3%).
4.3.2. Learning Activities
In this intervention strategy, 100% of the participants reported that the workshops provided them with tools to reduce water consumption. Although this intervention strategy did not result in reductions in water consumption, positive behavioral changes in the self-report techniques suggest an improvement in the initial water demand. It was found that the workshops were able to change behaviors in 90% of the cases. The latter was primarily due to either environmental concern (86.6%), an interest in saving money (73.3%) or the workshop activities (97.7%). Possibly the non-association of these results with a difference in consumption is because 63.4% of the participants either did not share the information received to other members of the household or shared very little. This result suggests that the ignorance of the other household members increased water consumption. Moreover, as shown by [
39], the lack of personal contact and the impossibility of reaching all the members of the participating households with educational messages are the reasons for the lack of effectiveness of educational programs.
4.3.3. Graphical Tools
In presented by [
26] participants with high water consumption achieved decreases when receiving feedback of their consumption via emoticons. Similarly, in our study, the use of graphical material reduced water consumption by 76.7%, being the only intervention strategy that presented a significant decrease in consumption, as well as a positive change in behavior in self-report techniques. This result may occur because 90% of the participants read and put into operation the material provided. A high percentage of participants claimed to have learned from the training and applied the recommendations, however, it is noteworthy that 10% of their relatives either did not read the material and 30% were not informed about it.
5. Conclusions
This study showed that the type of housing, more families per household and renting significantly influence water consumption changes. These dynamics should be reviewed more carefully for the implementation of strategies that allow comprehensive water management bodies to establish policies that generate successful interventions.
Quality of life factors produced both positive and negative effects on a community’s water demand. It was evidenced that enjoying nature and culture, having good family relationships, and having material possessions significantly influenced the variation of water consumption. This is relevant, because the municipality of Soacha (Colombia) is facing a social crisis, being the receptor of families in difficult socio-economic conditions, some of these having been displaced, which has led to overcrowding and disorganized urban growth that has caused a deficit in the provision of public services.
The educational campaigns positively affected behavior in response to water demand, in participating households in the municipality of Soacha (Colombia). Educational campaigns are low-cost strategies that aim to change the behavior of a community facing the demand for the resource in question through the dissemination of educational messages. However, they require great efforts in aspects, such as accompaniment, time and commitment of all those involved [
40].
The participants of the graphical tools strategy reduced their water consumption, which coincided with previous findings that this method generated positive behavioral changes in the reduction of water consumption. This study’s analysis of self-report techniques showed that households could change their habits of water demand and generate savings. However, the other intervention strategies applied did not reduce water consumption compared with the control. This shows that there was a lower consumption, likely due to the improvement in their habits, because they had applied the given recommendations.
Strategies, such as learning activities and the virtual platform proved not to be effective in the management of water demand. The recommendation here is to generate incentives that motivate the participants to engage with these types of methods, since they require more commitment in time and dedication which translated, in many cases, into a dropout rate of close to 22%. Working with educational institutions favored the inclusion of children and young people interested in environmental issues to be trained in the management of resources. This experience shows the importance of education policies that encourage responsibility in preserving resources for future generations.
It is important to consider information technologies in the execution of educational campaigns, which is why the intervention strategy with the virtual platform was included. However, local governments should make efforts to bring together public and private institutions to provide adequate conditions for the population to access technology, in other words, an investment in infrastructure, equipment, software, and internet access.
Although this study had a limited duration, which makes it necessary to follow up on these campaigns to evaluate medium and long-term changes in household behavior given that educational programs can trigger profound consequences over the long term, the obtained results can be used in agent-based models to forecast water consumption in an expanding urban area under different socio-economic and intervention scenarios [
41]. One difficulty in this case study was the families’ frequent change of address and the lack of water meters in some households, which reduced the sample investigated by 20%.


