Article

The Impact of Vegetation Successional Status on Slope Runoff Erosion in the Loess Plateau of China

1
State Key Laboratory of Eco-hydraulics in Northwest Arid Region, Xi’an University of Technology, Xi’an 710048, China
2
Key Laboratory National Forestry Administration on Ecological Hydrology and Disaster Prevention in Arid Regions, Xi’an 710048, China
3
State Key Laboratory of soil Erosion and Dry-land Farming on the Loess Plateau, Institute of Soil and Water Conservation, Chinese Academy of science and Ministry of Water Resources, Yangling 712100, China
*
Author to whom correspondence should be addressed.
Water 2019, 11(12), 2614; https://doi.org/10.3390/w11122614
Submission received: 4 November 2019 / Revised: 5 December 2019 / Accepted: 7 December 2019 / Published: 11 December 2019
(This article belongs to the Special Issue Soil–Water Conservation, Erosion, and Landslide)

Abstract

:
Slope vegetation restoration is known to influence erosion in the Loess Plateau region in China. The ability of vegetation to mitigate soil erosion under extreme runoff, however, has not been studied in great detail in this region. Here, we examine five typical vegetation communities in the Loess Plateau region that originated from restoration efforts enacted at different times (1, 11, 15, 25, and 40 years). Water scouring experiments were carried out to monitor vegetation community succession and its effects on erosion. These results indicate that the sum of plant importance values increased from 260.72 to 283.06, species density increased from 2.5 to 4.5 per m2, and the amount of litter and humus increased from 24.50 to 605.00 g/m2 during the 1 to 40 years of vegetation community succession. Root biomass and root diameter reached a maximum of approximately 10.80 mg·cm−3 and 0.65 mm at 40 years of recovery. Slope runoff velocity decreased by 47.89% while runoff resistance increased by 35.30 times. The runoff power decreased by 19.75%, the total runoff volume decreased by 2.52 times, and the total sediment yield decreased by 11.60 times in the vegetation community. Slope runoff velocity and power had the largest correlation with aboveground vegetation (0.76, 0.74), total runoff had the largest correlation with underground roots (0.74), and runoff resistance was most strongly correlated with soil structure (0.71). Studies have shown that the succession of vegetation communities can enhance the aboveground ecological functions of plants, thereby significantly reducing the runoff velocity and power. The development of plant root system significantly reduces the runoff volume; the improved soil structure significantly increased the runoff resistance coefficient.

1. Introduction

In recent years, there has been a series of studies conducted on soil and water conservation focusing on silt-dam gully engineering, terraced fields of slope engineering, and the Grain for Green Project on the Loess Plateau [1,2,3]. These efforts play an important role in the ecological restoration of Loess areas. The average annual sediment in the Yellow River has been reduced from an estimated 1530 million tons in the 1950s to 166 million tons in the 2010s [4]. About 40% to 50% of the reduction of the average annual sediment in the Yellow River comes from soil and water conservation measures in the Loess Plateau [5]. Since 1999, the Chinese government has carried out the Grain for Green Project, which has restored slope vegetation along the Loess Plateau. Observations from remote sensing show that the vegetation coverage of the Loess Plateau increased from 31.6% in 1999 to 59.6% in 2013 [6]. Restored forest and grassland areas accounted for about 56.7% of the total area of the Loess Plateau [7]. Some have suggested that vegetation restoration on the Loess Plateau has resulted in a 50% reduction in sedimentation along the Yellow River [8,9]. Ecological restoration of vegetation thus plays an important role in reducing slope soil erosion in the region [10]. Rainfall, however, does not automatically generate runoff. Erosion caused by a few short-duration heavy rainstorms can account for more than 60% to 90% of the total annual erosion [11]. Loess slopes can be damaged by slope runoff when extreme rainstorm events are frequent [12]. The slope is also the pioneer path of sediment production, which has a great contribution to the total amount of sediment observed in the outlet section of the watershed in the Loess hilly region [13]. As such, a better understanding of how vegetation can mitigate slope runoff and sediment under the erosion action of high-intensity slope runoff on the Loess Plateau is urgently required.
The Grain for Green Project facilitates a great change in landscape patterns in a certain sense, with the vegetation changing from annual crops to perennial native plants on the Loess Plateau [1]. The vegetation community, in the process of recovery without intervention, began to take place as species succession because of the extension of the years. Successional dynamics in the Loess Plateau typically follow a pattern of Artemisia plants, giving way to perennial rhizome grasses, and finally to perennial arbuscular herbs [14]. Gramineae, Legume, and Compositae occupy an important position in the natural succession of plant communities [15]. Previous studies have found that leguminous plants, such as Lespedeza davurica, can improve the soil organic matter, total nitrogen, total phosphorus, and available nitrogen content [16]. The Legume plants gradually became the dominant species, and soil organic carbon, in the 0–50 cm depth soil, gradually recovered after vegetation succession for about 20 years on Loess Plateau [17]. The Asteraceae and Gramineae plants are mainly represented by Artemisia capillaris, Artemisia sacrorum, and Bothriochloa ischaemum. They can grow naturally in the early stage of vegetation restoration, and their root systems have a strong ability to retain surface soil [18,19,20]. During succession, plant biomass, ground coverage, root structure, and function will change. The soil physical and chemical properties undergo predictable dynamics as well [21,22,23]. The number of species and individuals increases rapidly from 1 to 10 years in disturbed vegetation communities on the Loess Plateau [24]. The maximum root length density reached 31.04 mm/cm3 in the 0–20 cm depth soil at 15 years after abandonment, and maximum root biomass density reached 3.35 mg/cm3 after 21 years. Likewise, the water absorption capacity and the turnover frequency of root systems gradually increased in the process of vegetation restoration [17]. The slope is a basic unit of erosion, and erosion is primarily driven by the hydrodynamic index of the runoff and the erodibility of the topsoil [25]. The flow rate, flow velocity, and runoff depth are key factors directly affecting the slope separation process, and are also the basic parameters used for calculating other hydrodynamic indicators, such as runoff shear, runoff power, Reynolds number, and Froude number. These, in turn, are affected by factors, such as the underlying surface and vegetation [26,27]. Therefore, studying slope runoff hydrodynamics across vegetation communities in varying degrees of succession can help to reveal the role that the successional status has on mitigating slope erosion.
To study this, we studied slope runoff and erosion in five areas that had vegetation in varying degrees of succession (i.e., from 1 to 40 years after restoration) by the method of artificial simulation. Our goal was to analyze the effects of the vegetation successional status on slope soil erosion under water flushing conditions. We expect that results from this study will provide scientific guidance for future research on water erosion dynamic mechanisms and vegetation regulation principles in the Loess Plateau.

2. Materials and Methods
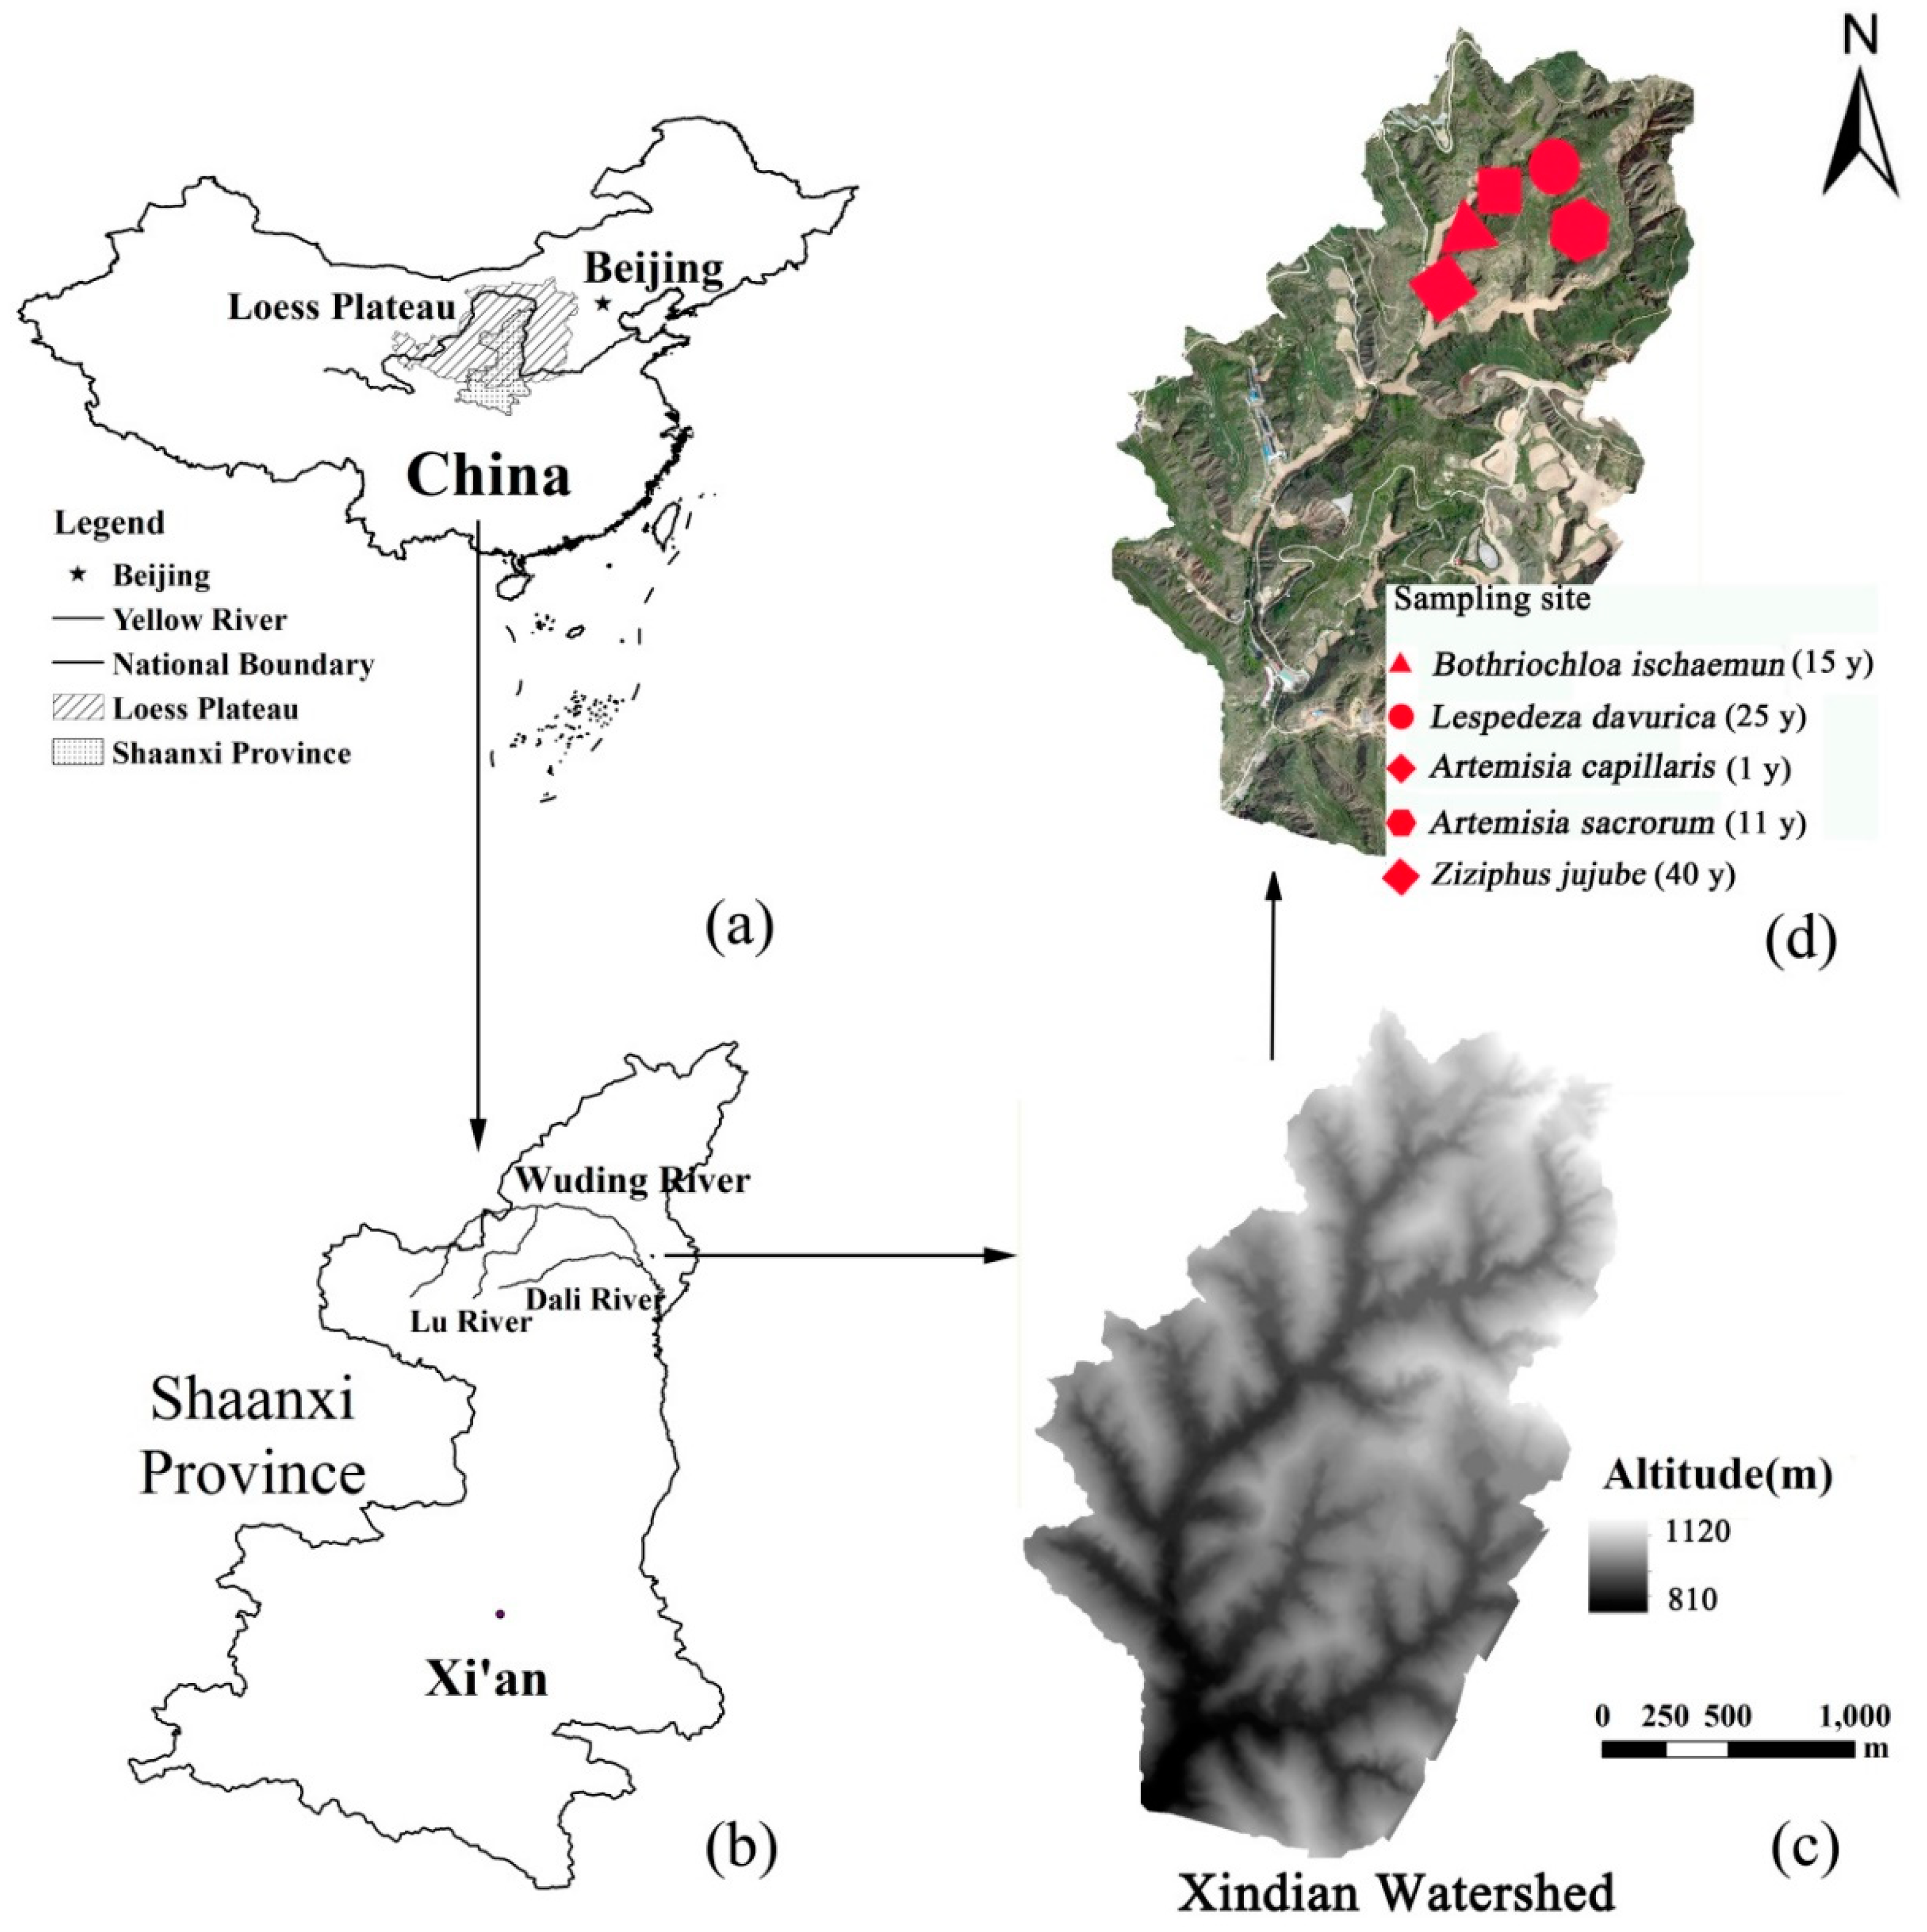
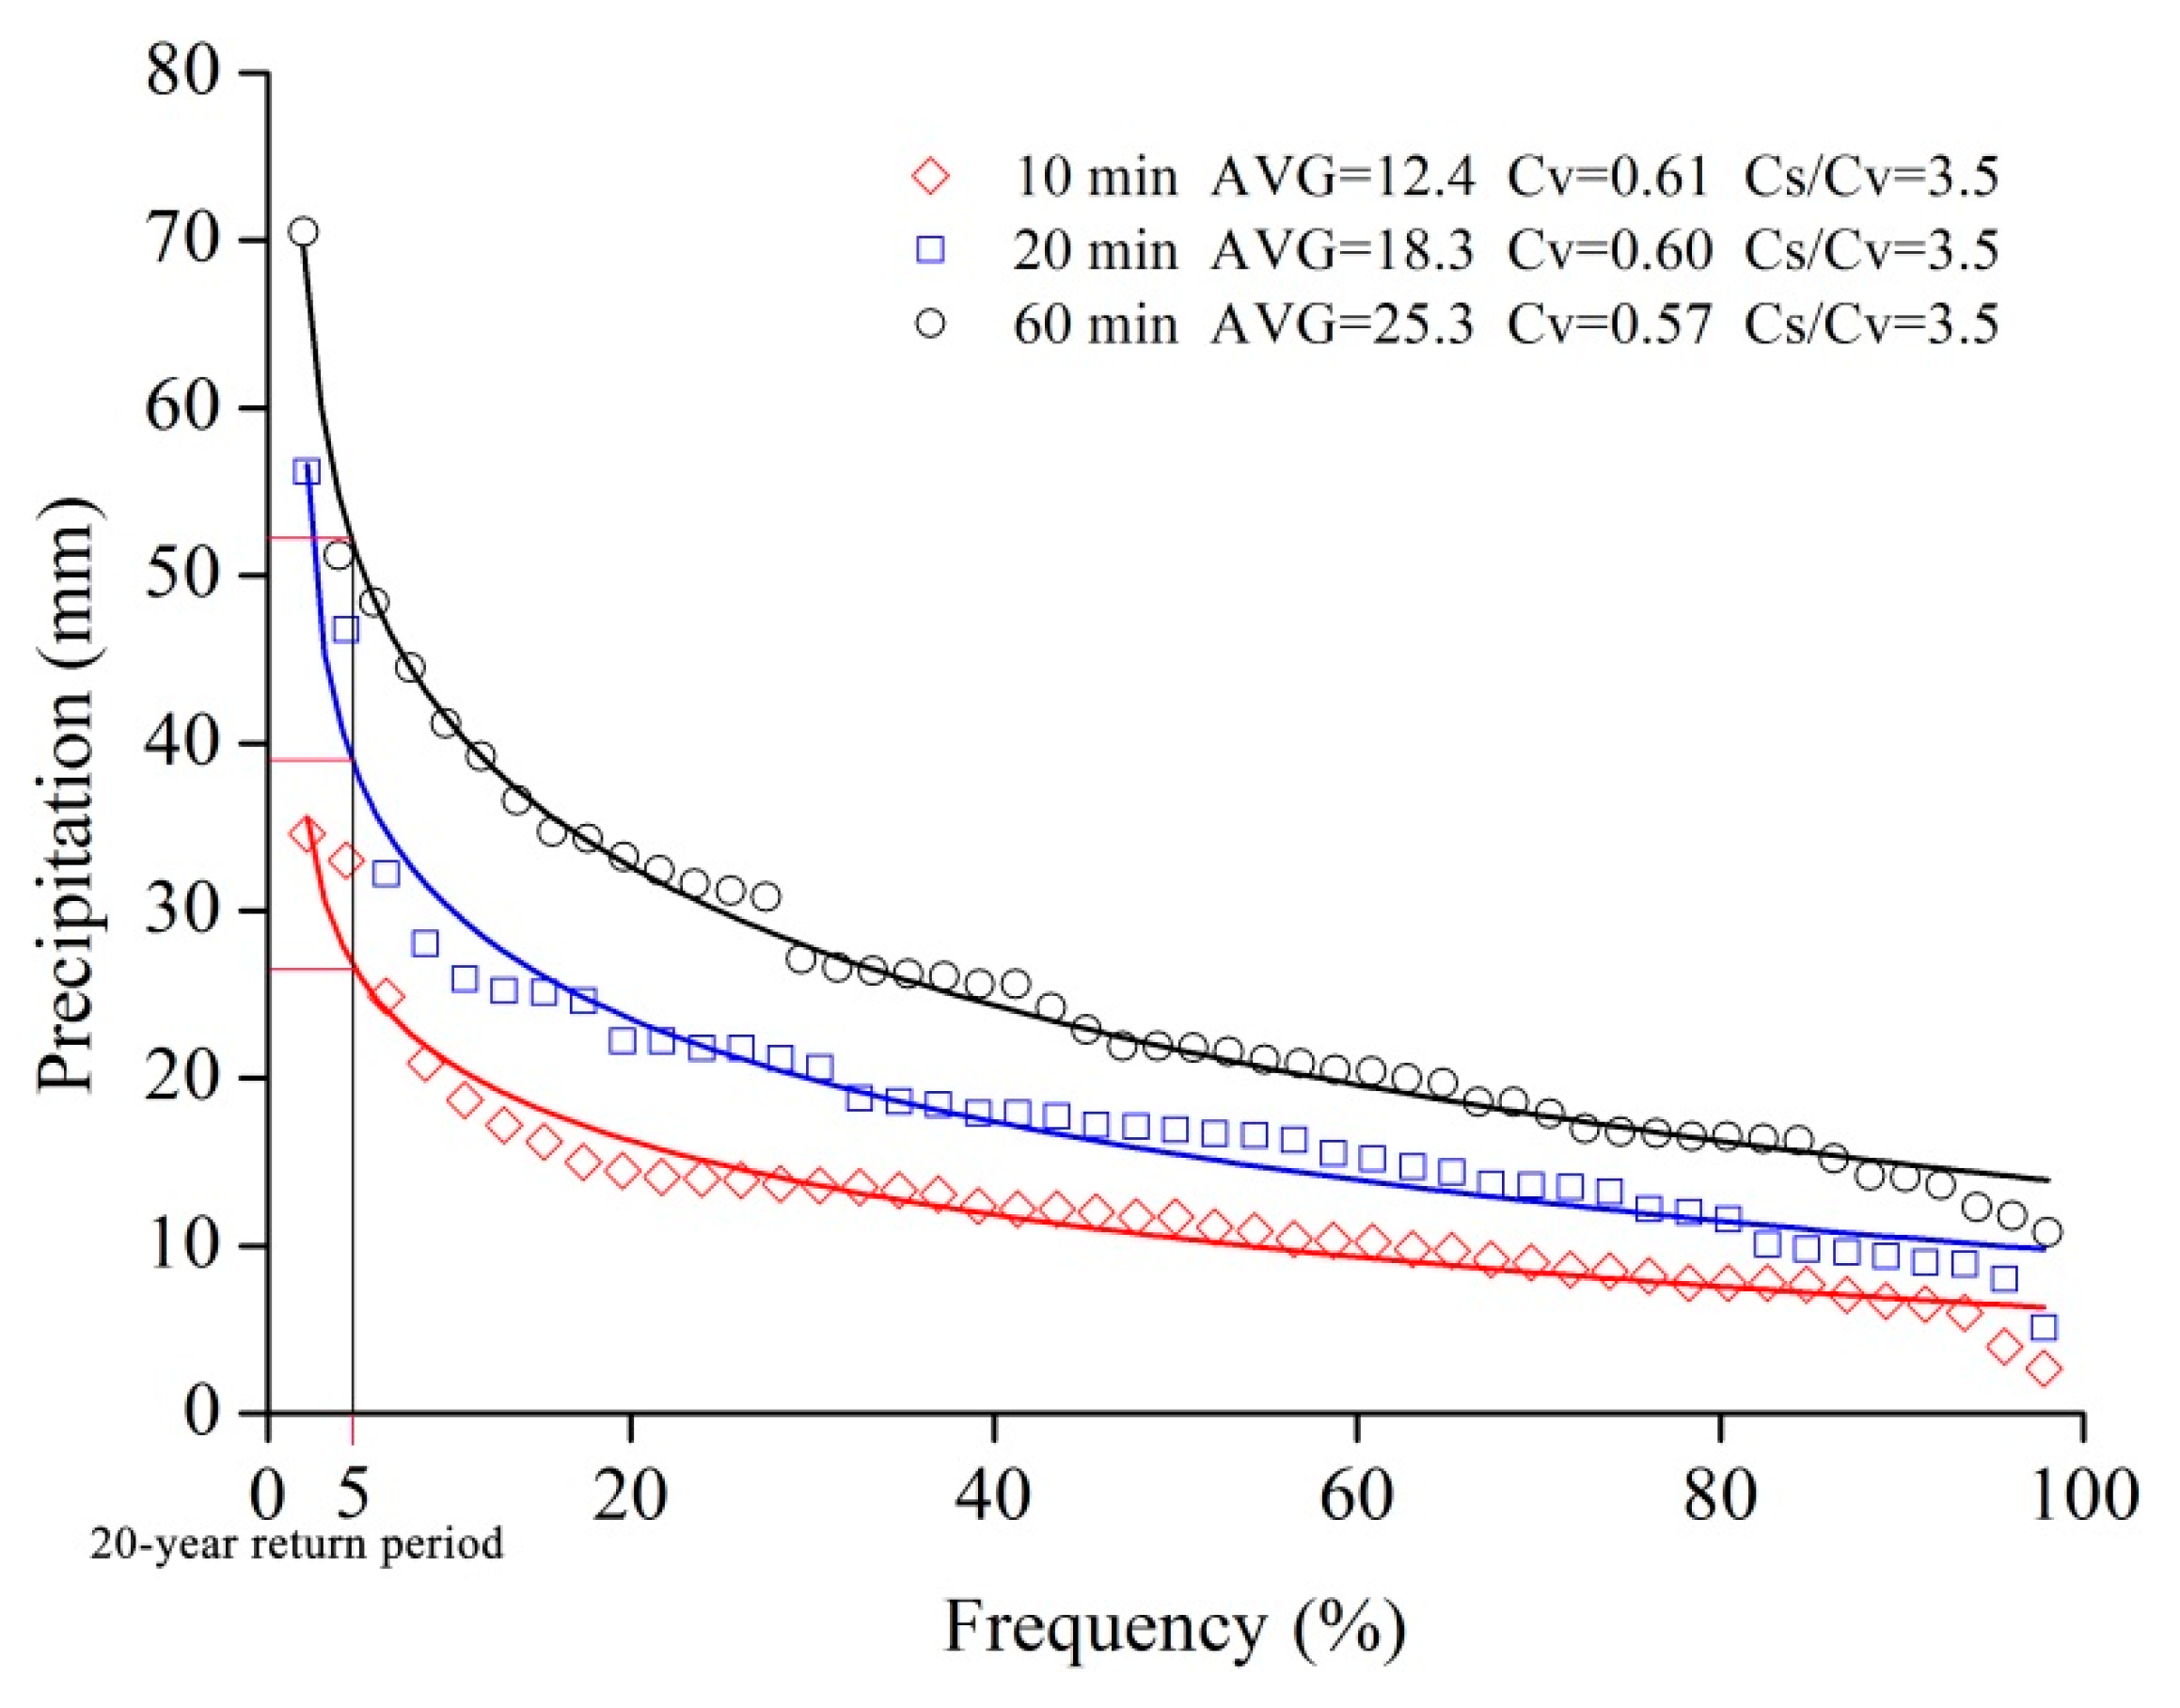
2.1. Study Area

The study area is located in the Xindan watershed on the Loess Plateau in China (E 110°15′–110°20′, N 37°27′–37°32′; 810–1120 m a.s.l.) (Figure 1). The soil type is to yellow loess soil, and the plough layer is thin (20–30 cm). Xindian watershed is a national soil erosion control area, which has been banned for about 60 years. The average annual temperature and precipitation in the study area is 9.7 °C and 486 mm, respectively. Precipitation does, however, vary widely across years and space. In recent years, there has been a notable decrease in precipitation days, an increase in the frequency of heavy rains, and an increase in both droughts and floods.
The successional sites included the Artemisia capillaris for 1 year since restoration, A. sacrorum for 11 years, Bothriochloa ischaemum for 15 years, Lespedeza davurica for 25 years, and Ziziphus jujube for 40 years. These species are dominant because of succession. It is also an inevitable sequence of vegetation succession in the Loess Plateau. This method of selection can be regarded as a method of a spatial sequence equivalent to a vegetation succession time series.

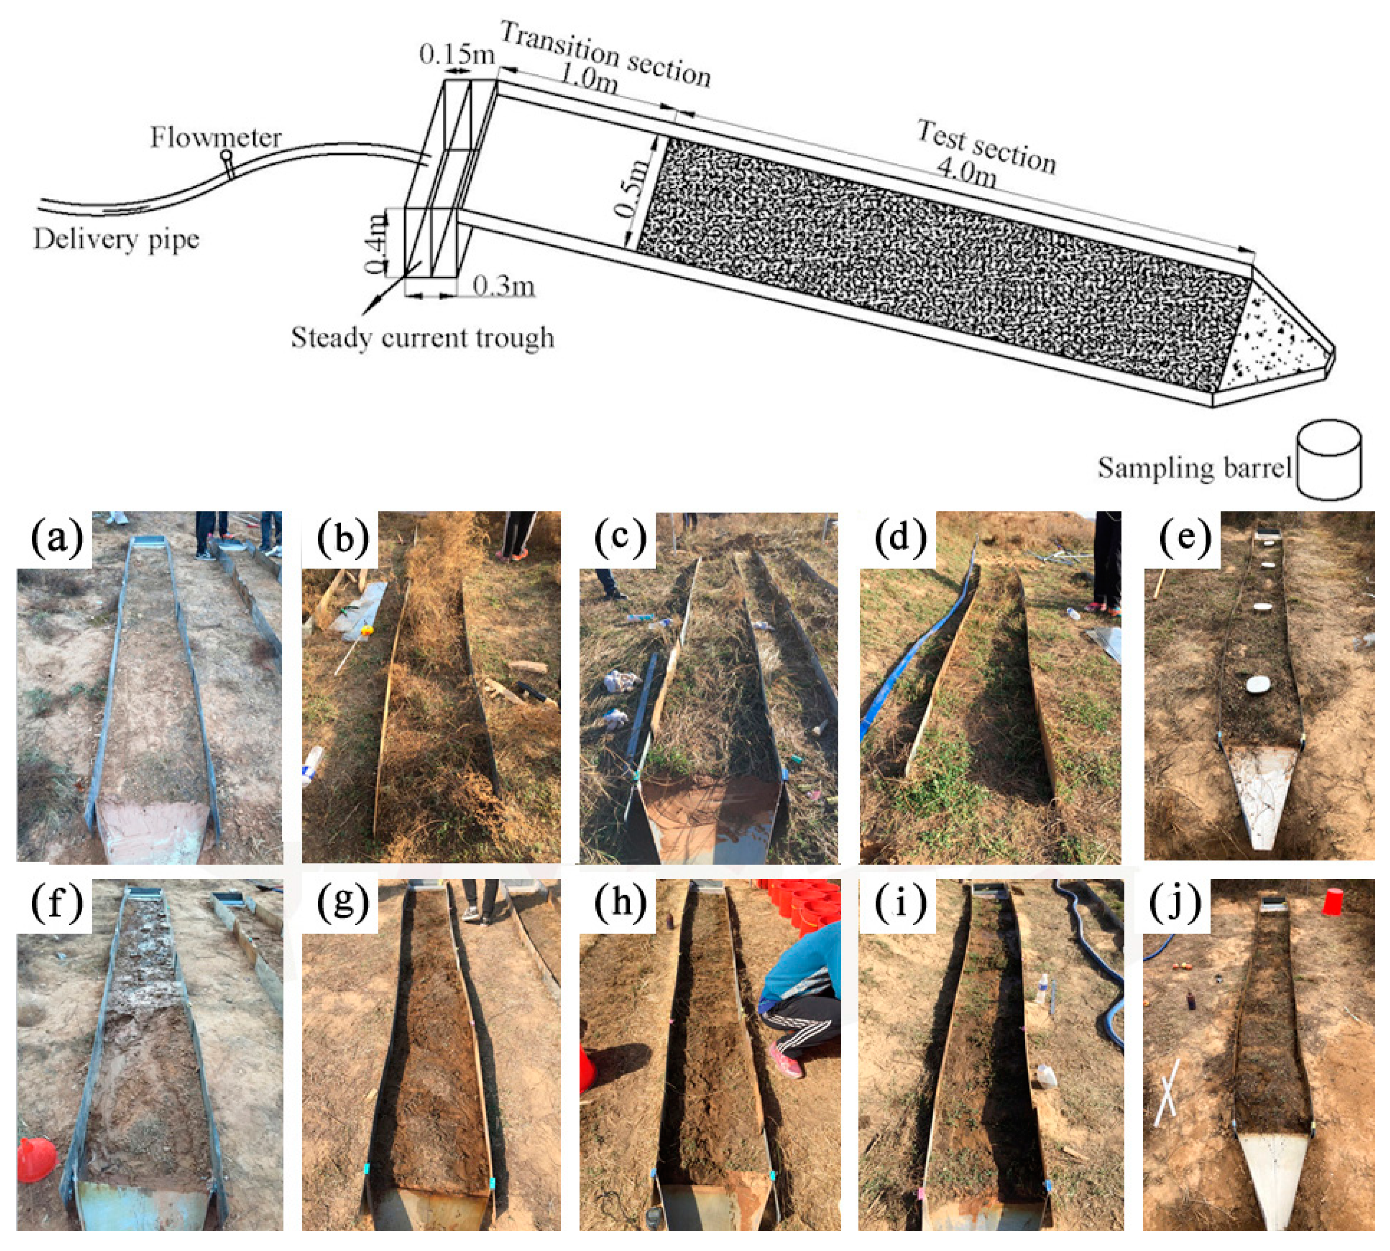
2.2. Experiments and Tests

The five experimental plot areas were 4 m × 0.5 m, and slope steepness ranged from 8 to 9°. In order to prevent lateral seepage of the slope flow during the test, plots were separated by a 2-mm thick steel plate. We installed flow-stabilizing devices and jet grooves at either ends of the plots, and dug a circular pit under the catchment groove where the sample collecting barrel was placed (Figure 2). Each scouring experiment lasted for 30 min, and the observation sections were set at 1, 2, 3, and 4 m of the plots to observe the runoff in sections. According to the series of precipitation data of the hydrological station in the past 30 years, the P–III frequency of rainstorms was calculated for each duration (10, 20, and 60 min; 3, 6, 12, and 24 h; and 3 d). In the torrential rains of different durations, the 20-year return period short-duration (60, 20, and 10 min) rainstorm intensities reached 0.9, 1.9, and 2.7 mm/min, respectively (Figure 3). As such, we used a flow rate of 4, 8, and 16 L/min for scouring, which is similar to a rain intensity of 2, 4, and 8 mm/min according to the catchment area of the plot.
Runoff and sediment samples were collected every minute, and runoff data was measured every 2 min. Sediment samples were left to settle first, then dried, and measured for sediment yield. We cut off the vegetation on the ground in each plot, retaining the stem of a certain height (5 cm) and the root system (Figure 2). We used the potassium permanganate stain tracing method to measure the runoff velocity on the slope. Runoff depth and width were measured using an artificial ruler. Runoff depth was used as a reference, and the hydrodynamic calculation uses the formula derivation value. Each experimental plot was scoured three times with different flow rates. A total of 45 experiments were conducted in this study.

2.3. Vegetation Community Survey and Sample Collection

In addition to experimental plots, three 2 × 2 m vegetation survey plots were established at each site. We sampled the vegetation by documenting the number of plants, estimating the percent ground cover, vegetation height, and humus layer thickness (Table 1). We harvested all aboveground plant tissue to measure aboveground vegetation biomass. We collected litter and humus layers for mass calculation. Root samples were collected using a root drill that was 9 cm in diameter with a barrel length of 10 cm from 0–20-, 20–40-, 40–60-, 60–80-, and 80–100-cm soil layers, based on previous reports of the root systems of vegetation on the Loess Plateau [1,28]. We used an iron box with an area of 0.2 × 0.15 m buckled into the soil to obtain undisturbed soil for measuring soil aggregates. A soil wreath knife with a volume of 100 cm3 was used to obtain undisturbed soil for measuring the saturated hydraulic conductivity.

2.4. Sample Testing

All root samples were cleaned and scanned using a root scanner (EPSON, TWAIN PRO, Suwa City, Japan). We used the root-system analysis program WinRHIZO (QC., Quebec City, Canada) to analyze output from the root scanner. The program was used to estimate the root length, surface area, root tips, and diameter. Root biomass was measured by weighing the dried roots. Soil aggregate samples were air-dried naturally and then sifted into three grain classes to calculate the percentage, which were 0–0.25, 0.25–2, and >2 mm, respectively. Soils extracted from the drill core were used to measure the soil particle size using a laser particle size analyzer (Malvern, Mastersizer 2000, Birmingham, Britain). We only utilized soil median diameter d50 data in the grey correlation analysis. The saturated hydraulic conductivity of undisturbed soils collected with a wreath knife was measured by the constant head method.

2.5. Data Analysis

2.5.1. Vegetation Community Index

We measured the root length density (RLD), root weight density (RWD), and root tip density (RTD) for all samples according to Equations (1)–(3):
R L D = L V s ,
R W D = M V s ,
R T D = N V s ,
where L is the sum of all root lengths per unit soil volume (mm); M is the dry weight of all roots per unit soil volume (mg); N is the sum of all the root tips per unit soil volume; and Vs is the volume per unit of soil.
Next, we measured the soil saturated hydraulic conductivity as an indicator of soil permeability. The higher the saturated hydraulic conductivity, the higher the soil permeability. Increases in soil permeability can increase the infiltration of runoff and play a better role in soil and water conservation. This was calculated according to Equation (4):
K = 10 Q L A Δ H T ,
where K is the soil saturated hydraulic conductivity (mm/min); Q is the outflow (mL) in time T; L is the linear distance (cm) of the water flow path; A is the cross-sectional area (cm2) through which the water flows; ΔH is the total head difference (cm) of the start and end sections of the percolation path; and T is the outflow time (min). We only used the soil saturated hydraulic conductivity as one of the factors of the correlation analysis and did not analyze the results in this study.
We used the Shannon–Wiener index (H), Margalef index (R), and the vegetation importance value (Z) as three ecological indicators that can reflect the aboveground structure of vegetation communities. The Z reflects the ecological status of a certain plant in a vegetation community and can play a normalization role for the study of more complex vegetation communities. Equations (5)–(7) were as follows:
H = i = 1 s N i N ( ln N i N ) ,
R = S 1 ln N ,
Z = R D + R F + R C ,
where N is the sum of the number of plots; Ni is the number of plants of the i-th species; S is the total number of species per plot; and RD = (density of a species/total density of all species) × 100%; RF = (frequency of a species/total frequency of all species) × 100%; RC = (cover of a species/total coverage of all species) × 100%.

2.5.2. Calculation of Hydrodynamic Parameters

Hydrodynamic parameters included the Darcy–Weisbach (f), runoff shear (τ), runoff power (P), Reynolds number (Re), and Froude number (Fr) following Equations (8)–(15):
f = 8 R · J · g / v 2 ,
J = [ L · sin θ ( v 2 / 2 g ) ] / L ,
h = Q d v ,
R e = v R γ ,
γ = 0.01775 1 + 0.0337 t + 0.000221 t 2 ,
F r = v / g h ,
τ = ρ R J ,
ω = τ v ,
where R is the hydraulic radius in m; J is the hydraulic gradient in m/m; g is the gravitational acceleration constant of 9.8 m/s2; v is the runoff velocity in m/s; θ is the slope in degrees; L is the slope length in m; h is the depth of runoff in m; Q is the flow rate in m3/s; d is the runoff width in m; R is the hydraulic radius in m, which is approximately equal to the runoff depth, h; t is the water flow temperature in °C; and ρ is the water flow density in kg/m3.

2.5.3. Grey Correlation Analysis

The gray correlation analysis formula is as follows, Equations (16) and (17):
ξ 0 i = min i min k | x 0 ( k ) x i ( k ) | + ρ max i max k | x 0 ( k ) x i ( k ) | x 0 ( k ) x i ( k ) + ρ max i max k | x 0 ( k ) x i ( k ) | ,
γ ( x 0 , x i ) = 1 n i = 1 n ξ 0 i ,
where ξ 0 i is the correlation coefficient, γ ( x 0 , x i ) is the correlation degree, x 0 ( k ) x i ( k ) is the difference sequence, max i max k | x 0 ( k ) x i ( k ) | is the maximum difference, and min i min k | x 0 ( k ) x i ( k ) | is the minimum difference.

3. Results

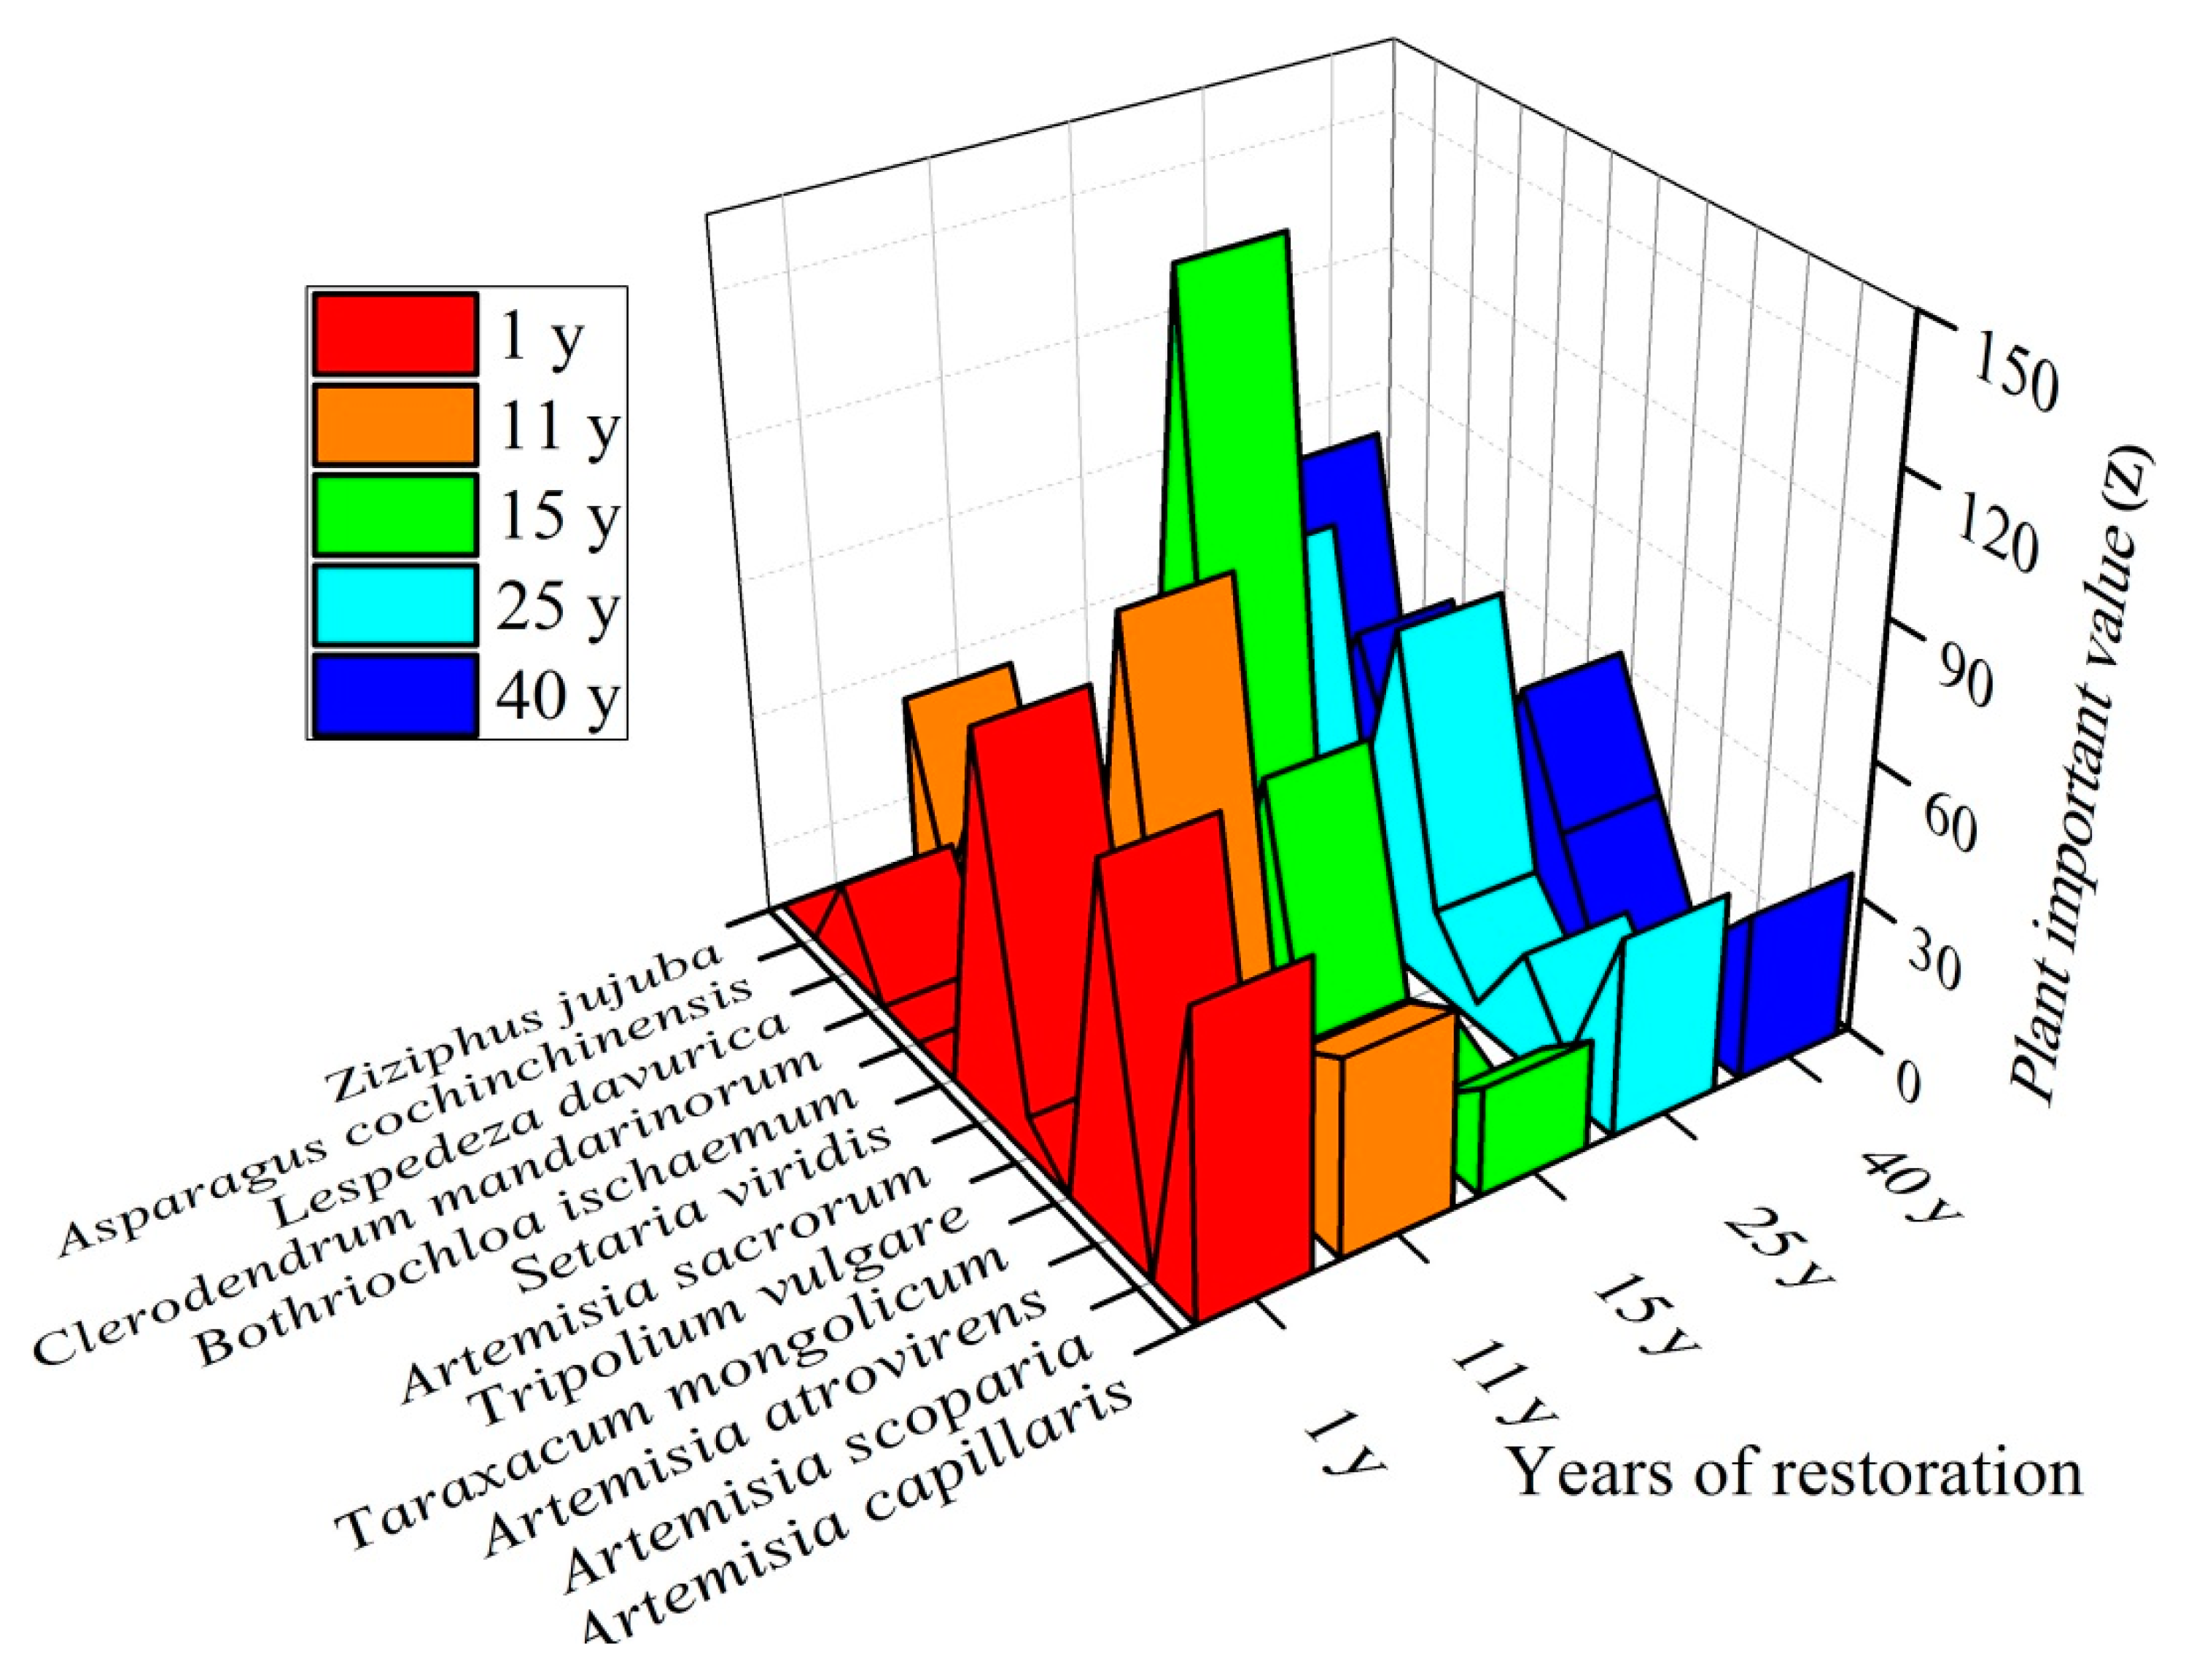
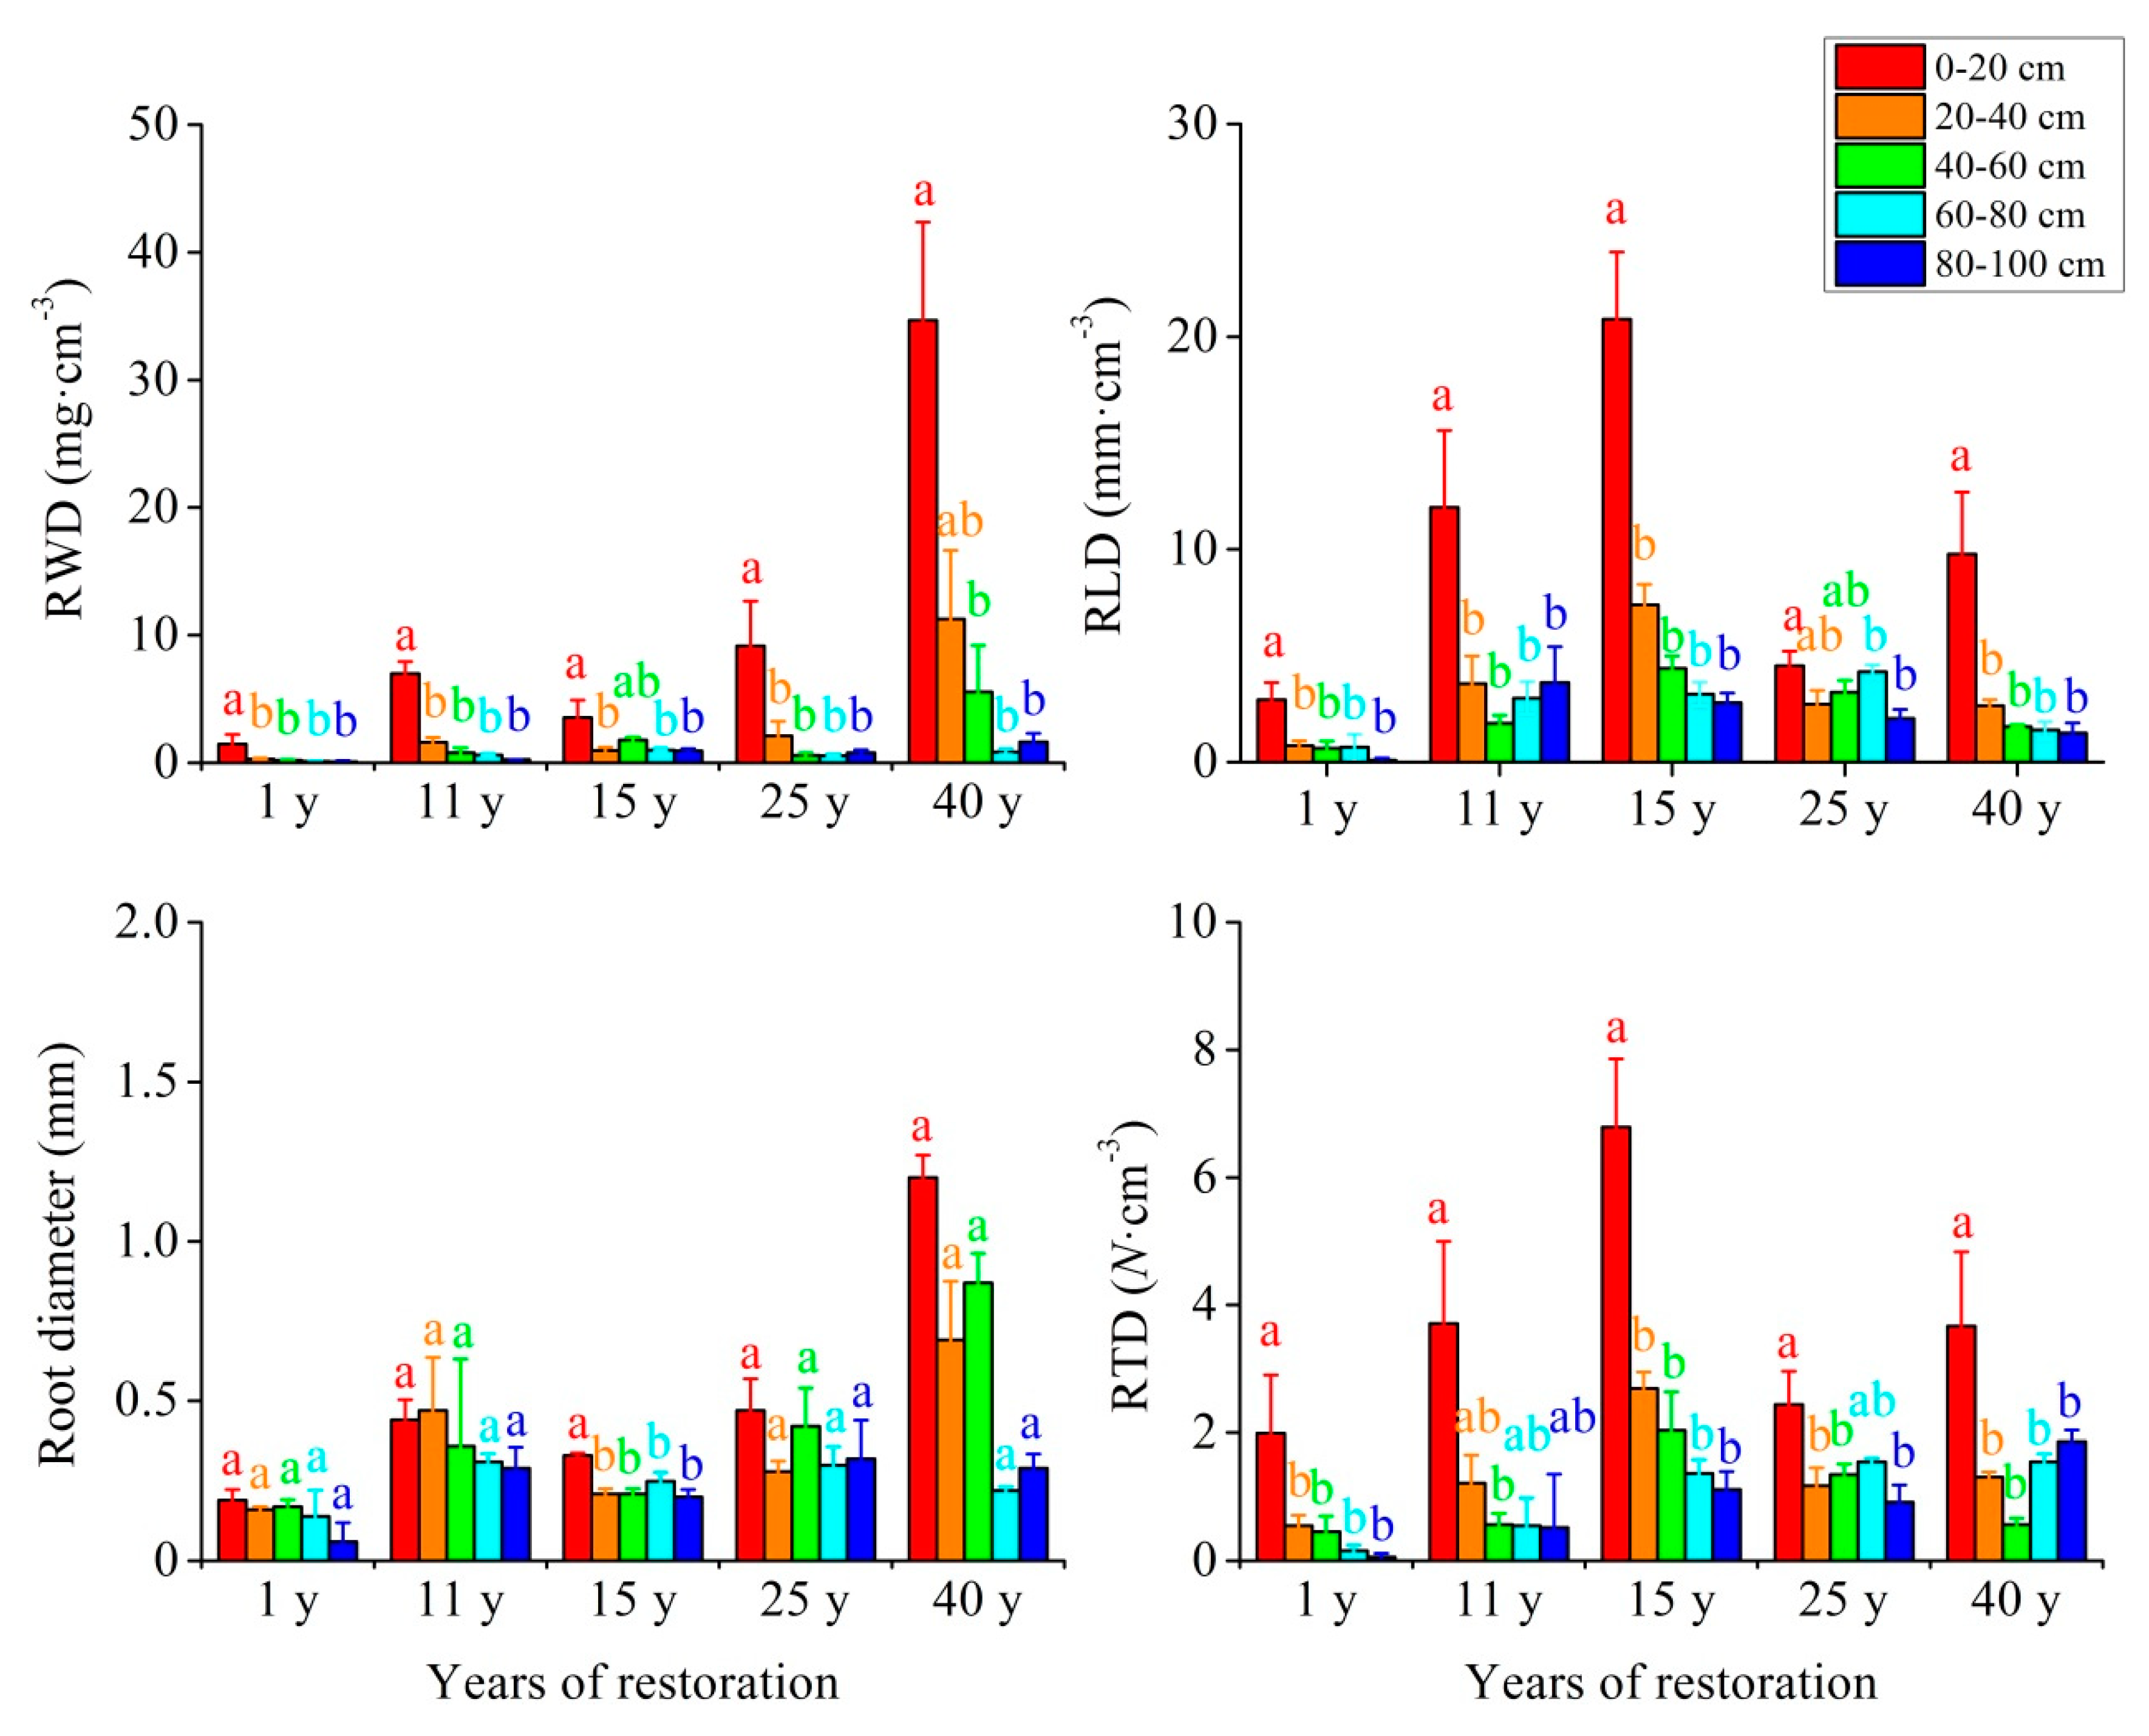
3.1. Vegetation Succession Sequence and Structural Characteristics of Ground/Underground Parts

We showed the distribution of Z for each species (Figure 4). We also summed the Z of each species in the five experimental plots. The rankings of the plant species in terms of Z across the experimental plots was: Artemisia sacrorum (356.72) > Artemisia capillaris (214.36) > Bothriochloa ischaemum (189.31) > Lespedeza davurica (177.97) > Artemisia atrovirens (123.67) > Ziziphus jujuba (100.74) > Artemisia scoparia (81.39) > Tripolium vulgare (58.32) > Setaria viridis (36.34) > Taraxacum mongolicum (10.27) > Clerodendrum mandarinorum (9.66) > Asparagus cochinchinensis (5.36). The sum of Z of annual plants was 419.42, mainly Artemisia capillaris, Artemisia scoparia, and Artemisia atrovirens. Perennial herbaceous plants had a Z of 665.98, mainly Bothriochloa ischaemum, Artemisia sacrorum, and Tripolium vulgare. Small trees and semi-shrub plants had a Z of 278.71, which was primarily driven by Lespedeza davurica and Ziziphus jujuba. Therefore, it can be explained that perennial herbaceous plants are the main biological species for the natural restoration of vegetation in the area.
The Z across all species increased from 260.72 to 283.06 during the 40 years of succession that we analyzed. The Z of annual plants was 147.11, the perennial herbaceous plants was 93.12, and semi-shrubs and small trees was 20.49 in the 1-year vegetation community. Thus, annual plants were dominant in the 1-year vegetation community. Perennial herbaceous plants were dominant (153.23) in the 11- and 15-year vegetation communities by the same calculation method. Semi-shrubs and small trees were dominant (81.02) in the 25- and 40-year vegetation communities. It can be concluded that annual plants are the dominant species in the early stage of vegetation community succession, perennial grasses are the dominant species in the middle stage, and semi-shrubs and small trees are the dominant species in the later stage.
The species density gradually increased from 2.5 to 4.5/m2 from 1 to 40 years of succession (Table 2). Plant density increased first and then decreased and then stabilized. Plants density peaked at 135.5/m2 at 15 years of succession, and then stabilized between 25 and 40 years (Table 2). Plant height increased from 25.25 to 159.32 cm/m2 over the 40 years. Aboveground biomass increased from 28.83 to 753.33 g/m2. The amount of litter and humus increased from 24.50 to 605.00 g/m2.
Roots are highly sensitive to the soil environment and occupy an important position in the succession of vegetation communities. The more closely the root system is integrated with the soil, the more obvious its effect on the soil’s physical and chemical properties, and the stronger the soil erosion resistance [29]. RWD and root diameter gradually increased from 1 to 40 years of succession (Figure 5). At 40 years, the maximum RWD and root diameter were 10.80 mg/cm3 and 0.65 mm, respectively. RLD and RTD increased from 1 to 15 years, then decreased from 15 to 25 years before stabilizing. The average RLD and RTD reached a maximum of 7.72 mm/cm3 and 2.80/cm3 in the 15-year successional community. According to the results above, it can be explained that slender and thin are the main root morphology of the vegetation community in early succession. Perennial plants, however, increased in dominance with increasing successional age. Specifically, we found an increase in the dominance of semi-shrubs and small trees after 25 years. At this time, the RWD and root diameter was bigger. The RWD, RLD, root diameter, and RTD decreased with soil depth at each successional stage, and there were significant differences in the root index between some soil layers (p < 0.05) (Figure 5).

3.2. Dynamic Characteristics of Slope Runoff in Different Vegetation Communities

Soil erosion of vegetation communities on slopes is primarily affected by the hydrodynamic characteristics of runoff and by the composition of the underlying material. Runoff velocity ranged from 0.078 to 0.266 m/s across the whole experiment (Table 3). The runoff velocity range was 0.203 to 0.266 m/s under different flow conditions during the 1 to 15 years of succession. Runoff velocity ranged from 0.078 to 0.180 m·S−1 under different flow conditions during the 25 to 40 years of succession. In the later stage of succession, the runoff velocity was 52.37%, 38.77%, and 52.52% lower under the condition that the discharge rate was 4, 8, and 16 L/min, respectively. It can be concluded that vegetation community succession is a vegetation self-restoration process that can effectively reduce runoff velocity.
The Darcy–Weisbach (f) metric is used to indicate the resistance of the underpad to runoff. Generally, the larger the resistance coefficient, the more energy that is required for the water to overcome the resistance, and the smaller the sediment yield. The resistance coefficients ranged from 0.462 to 21.792 in the whole experiment (Table 3). The average resistance coefficient under different flow conditions was 0.827 in the 1 to 15 years of vegetation succession. The resistance coefficient was 11.223 during the 25 to 40 years of succession. The resistance coefficient of the slope runoff increased from 0.458 to 16.166 during the 25 to 40 years of vegetation succession.
Generally, the greater the flow shear stress, the greater the effective shear stress acting on the soil surface, and the greater the soil erosion intensity on the slope. The runoff shear stress increases with the increase of the discharge flow. When the scouring flow increased by 2.00 times, the shear stress increased by 1.63 times correspondingly in the whole experiment process. The runoff shear stress, however, also showed an increasing trend with the increase of the vegetation community succession years. The shear stress increased from 3.560 to 8.177 Pa during 1 to 40 years of vegetation community succession.
The runoff power can reflect the comprehensive influence of hydrodynamic characteristics on slope erosion. With the same trend of the shear stress, the runoff power of each vegetation community increased with the increase of the scouring flow (Table 3). This change in runoff power was due to the greater scouring force, faster runoff velocity, and greater shear stress, and the susceptibility to rill erosion. The maximum runoff power was 0.788 to 1.327 N/(m/s) in the 1-year vegetation community, and the minimum was 0.589 to 1.108 N/(m/s) in the 40-year vegetation community (Table 3).

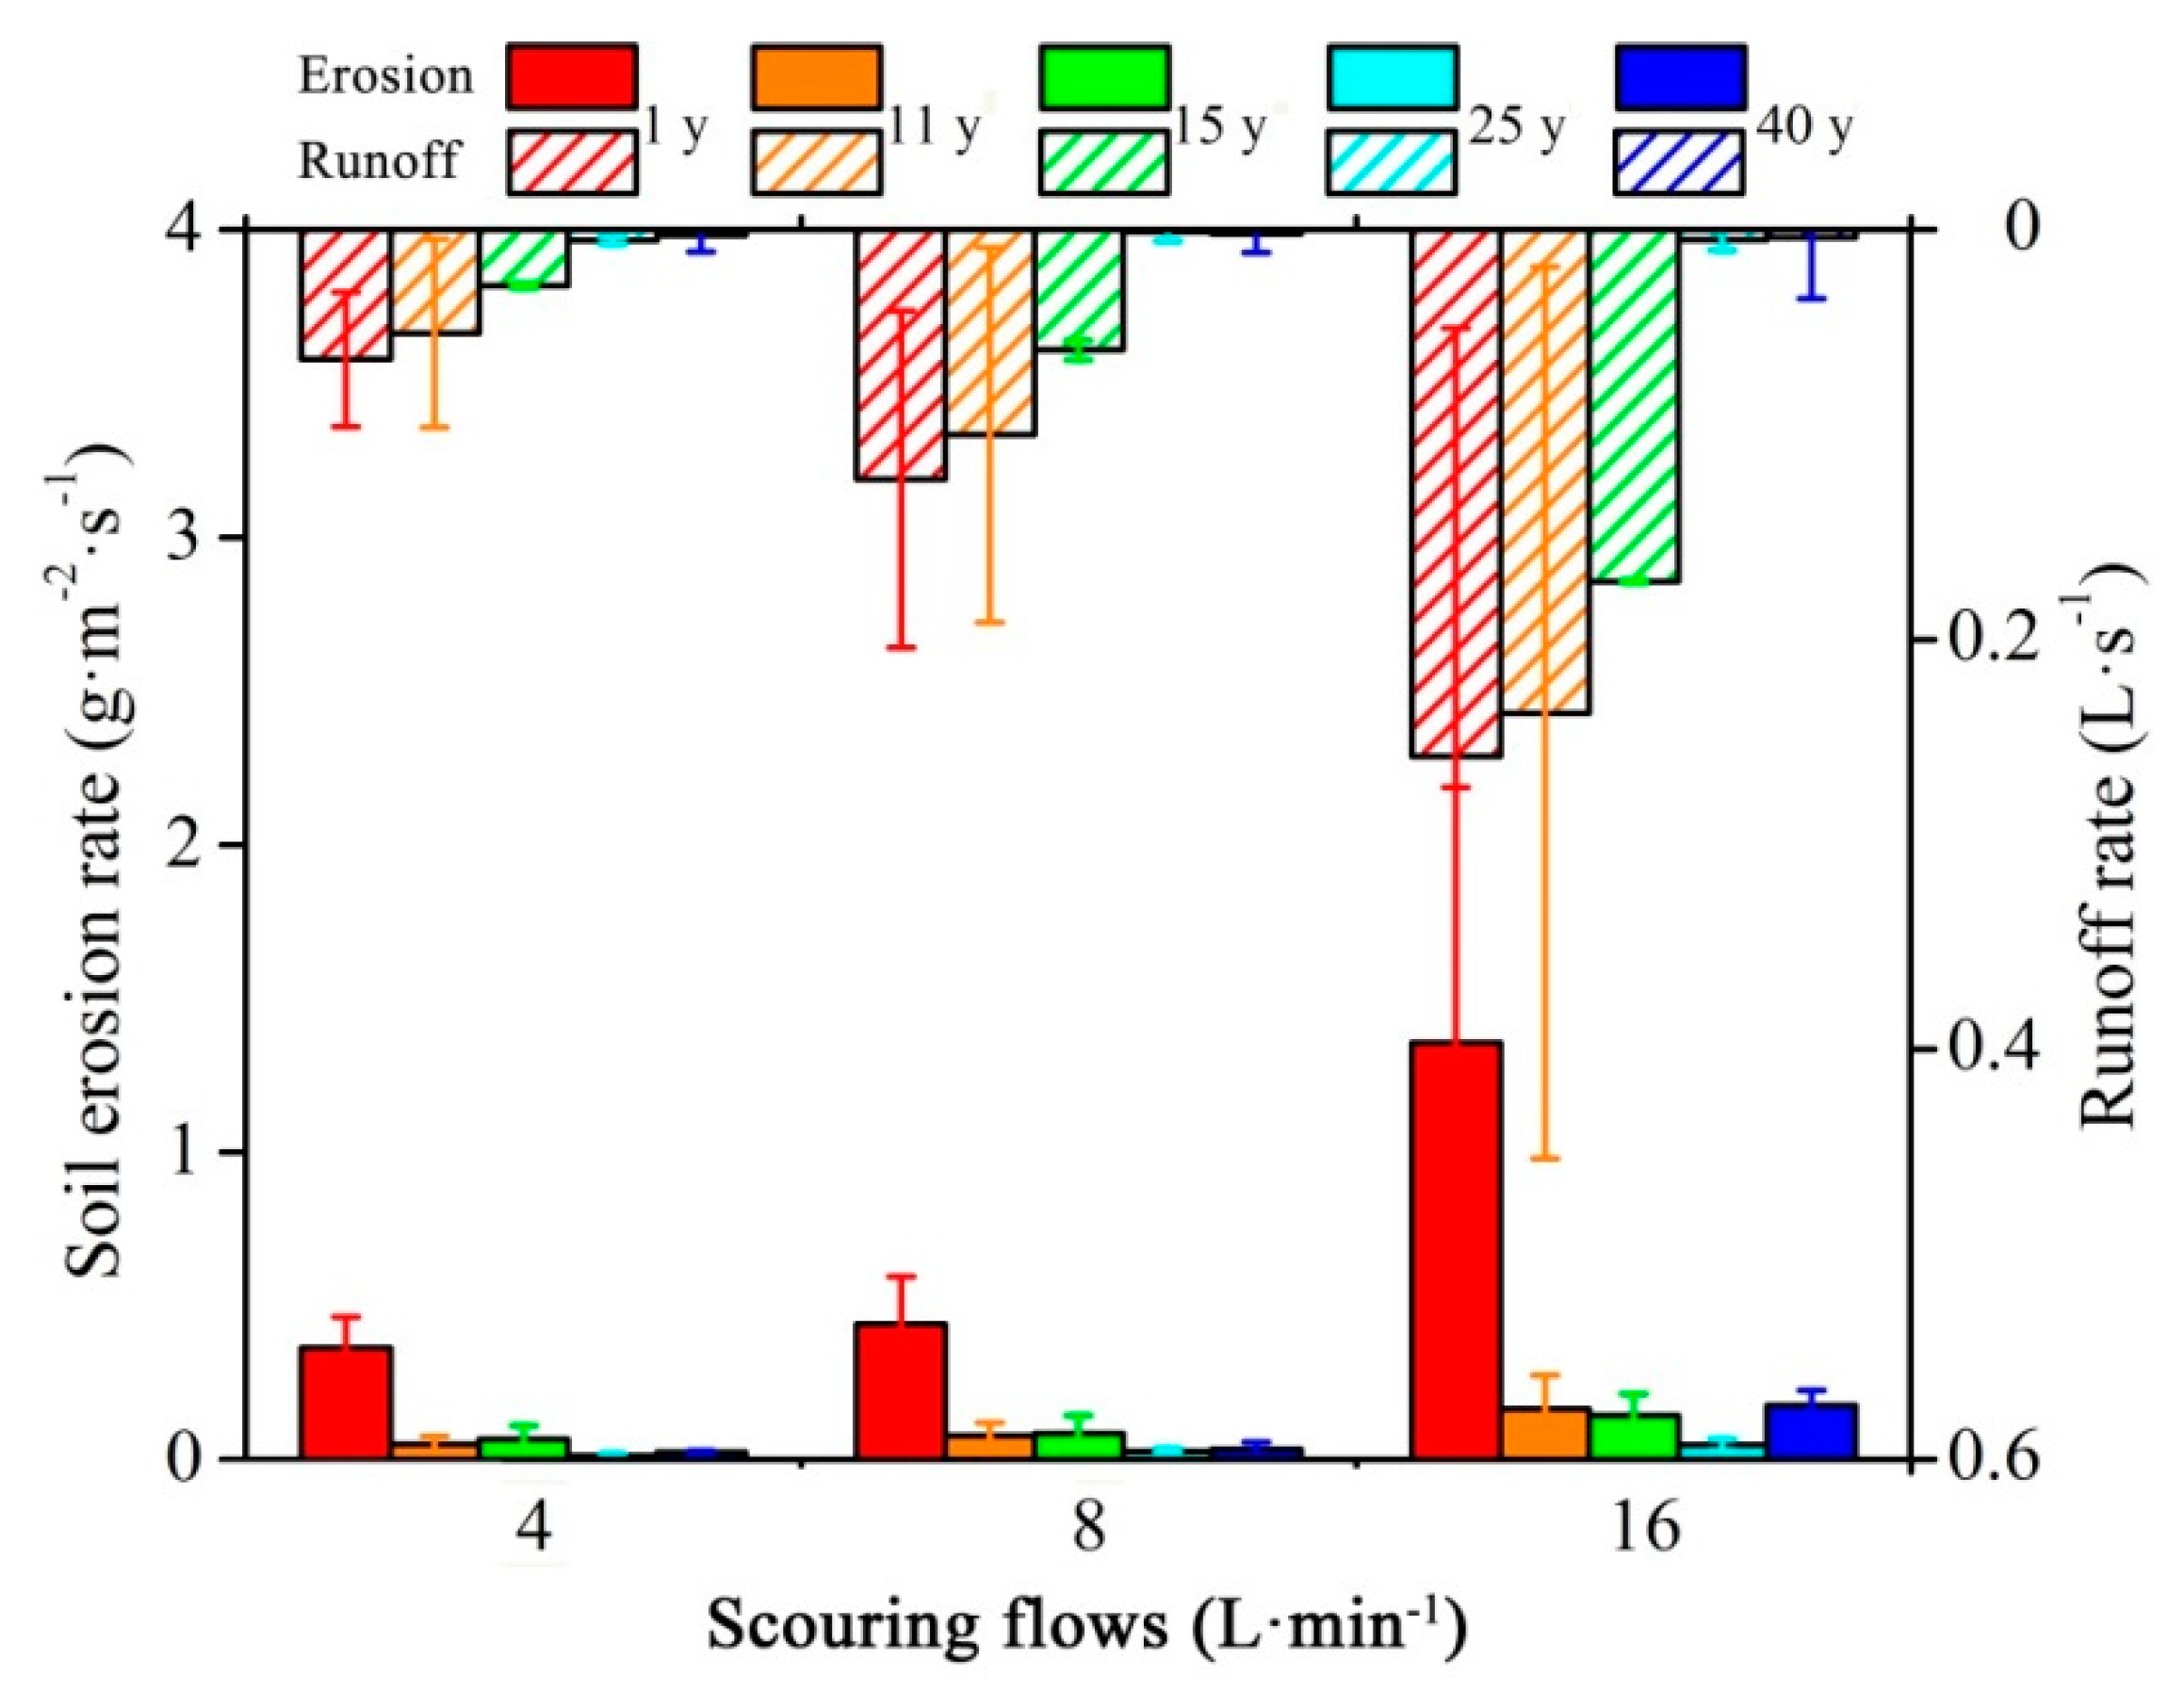
3.3. Runoff and Sediment Yield under Different Vegetation Communities

The runoff volume and sediment yield on the slopes of the different vegetation communities were significantly different. Both the runoff volume and sediment yield decreased significantly with increasing successional age at a scouring flow of 4, 8, and 16 L/min (Table 4). Compared with the early successional community, the total runoff volume at 40 years decreased 3.52, 2.74, and 2.29 times, respectively, under the scouring flow of 4, 8, and 16 L·min−1. The total sediment yield decreased 16.83, 9.31 and 11.65 times on average. It can be seen from the multiple of reducing runoff and sediment that the effect of vegetation restoration on reducing runoff and sediment decreases with the increase of the erosion discharge. In addition, the total runoff volume and sediment yield under different scouring flows were averaged and the following results were calculated: During 1 to 40 years of vegetation succession, the runoff volume decreased by an average of 2.52 times and the sediment yield decreased by an average of 11.60 times. Therefore, it can be concluded that the contribution of Loess slope vegetation succession to sediment reduction during water erosion is much greater than that for runoff reduction.
The soil erosion rate of the 1-year vegetation community reached a maximum value of 1.35 g/(m2·s) when the scouring flow rate was 16 L/min. The minimum soil erosion rate was 0.01 g/(m2·s) in the 25-year vegetation community under a scouring flow rate of 4 L/min, followed by the 40-year vegetation community at 0.02 g/(m2·s) (Figure 6). The soil erosion rate decreased by 25.36 times from 1 to 40 years of succession under the same scouring flow rate. This indicates that the successional status of vegetation in the Loess Plateau has a significant effect on reducing the erosion rate of runoff.

3.4. Grey Correlation Analysis between Hydrodynamic Parameters and Ecological Factors of Vegetation Communities

The correlation between these hydrodynamic parameters and soil erosion rate can be illustrated (Table 5). The erosion rate was positively correlated with runoff velocity and power (p < 0.01). In contrast, the erosion rate was negatively correlated with resistance (p < 0.01), and was not correlated with shear force (p > 0.05).
The hydrodynamic parameters and the soil erosion rate showed a significant Pearson correlation, but the correlation coefficient does not indicate which hydrodynamic factors are most relevant to the erosion rate. Therefore, we identified the hydrodynamic factors most closely related to the erosion rate by the grey correlation analysis method: Runoff power (Table 6).
In order to establish the relationship between the hydrodynamic parameters with the vegetation characteristics, we chose the hydrodynamic parameters as the characteristic indicators, and selected the vegetation community as the sequence index. The correlation degree of the total slope runoff volume and ecological factors of the vegetation community were ranked as follows: Underground part (0.74) > aboveground part (0.69) = soil structure (0.69) (Table 7). From the grey correlation analysis of the slope runoff power, it can be concluded that the aboveground part (0.74) > soil texture (0.73) > underground part (0.69) (Table 8). The grey correlation analysis of the slope runoff velocity shows that the aboveground part (0.76) > soil texture (0.70) > underground part (0.68) (Table 9). The grey correlation analysis of the runoff resistance shows that soil texture (0.71) > underground part (0.70) > aboveground part (0.65) (Table 10).

4. Discussion

4.1. Effects of Vegetation Community Restoration on Soil Structure and Erosion

Vegetation construction is an important measure for soil erosion control on the Loess Plateau. Specifically, it plays an important role in controlling soil erosion and reducing sediment along the Yellow River. Vegetation restoration can effectively improve soil properties, affecting the relationship between the plant–soil interface through various factors, such as stems, leaves, roots, and root exudates [30]. Improving soil properties takes time, and there are differences in the degree and efficiency of soil improvement between different succession development directions and different vegetation types [31]. Therefore, the growth and decline of dominant species is the basic unit of the succession and development of a vegetation community. The composition of the community and the spatial distribution of individuals constitute the structural characteristics of the vegetation community. Vegetation community structure includes diversity, species composition, community floristic composition, and community age structure [32]. The natural restoration process of abandoned farmland vegetation on the Loess Plateau can be roughly divided into the rapid recovery period, primary succession period, advanced succession period, and stable period [33].
Vegetation communities have the ability to control soil erosion, in part because they increase soil anti-erodibility [34]. The soil erodibility is affected by vegetation as they can increase soil organic matter and soil aggregate stability. In this study, the shear stress increased from 3.560 to 8.177 Pa from 1 to 40 years of vegetation succession (Table 3). At the same time, the erosion rate decreased from 1.35 to 0.02 g/(m2·s) (Figure 5). This demonstrates that communities at later stages of succession have better anti-erosion properties than younger communities. The effects of vegetation on soil erosion reduction can be divided into three parts, namely, the aboveground interception of vegetation, the fixation of underground roots, and the resistance of the soil interface [35]. The vegetation types and cover on the Loess Plateau have changed dramatically over the past 30 years [36], and the regional vegetation ecosystem has been significantly improved. These improvements have effectively alleviated the serious effects of soil erosion in this area. Jiao et al. showed that the average soil erosion intensity in the early stages of vegetation succession was between 3087.6 and 4408.4 t/km2/a, and the vegetation succession period was between 1245.2 and 1827.8 t/km2/a [37]. This is consistent with the finding that vegetation restoration can effectively reduce the rate of soil erosion (Figure 5). However, with the occurrence of extreme rainstorm events or the increase of scouring intensity, places with better vegetation coverage are more prone to small gravity erosion, such as landslides and collapses. [38]. It can be assumed that when the scouring flow rate is great enough, the vegetation will gradually lose its effectiveness in reducing flow and reducing sediment, and can even induce extreme soil erosion events, such as landslides and collapses. Previous studies have shown that when grasslands on slopes scour under 5 L/min of discharge, the effect of sediment reduction on vegetated slopes is significantly greater than that on bare slopes while when the scouring flow increases to 8 L/min, the difference of sediment reduction between different grasslands is small, which indicates that the ability of vegetation to prevent and control runoff erosion on slopes is weakened with the increased discharge [39]. The total runoff volume decreased by an average of 3.52, 2.74, and 2.29 times at 4, 8, and 16 L/min of the scouring flow and the total sediment yield decreased by 16.83, 9.31, and 11.65 times on average in our data report (Figure 5). It was also just starting from the scouring flow of 8 L/min, and the difference in the control effect of vegetation communities on soil erosion became smaller. Therefore, the predecessors and our research can at least prove that when the scouring flow is large enough, the soil and water conservation of the vegetation gradually decreases. Whether it will aggravate slope erosion or induce gravity erosion remains to be further studied.

4.2. Effects of Vegetation Community Restoration on the Hydrodynamics of Slope Runoff

Vegetation can effectively reduce water erosion on slopes. and some of the more important reasons are the hydrodynamic parameters affecting the runoff, which will change the runoff velocity, flow regime, and erosion energy of the slope, thus affecting the soil erosion process [25,40]. Vegetation can increase the critical conditions of slope erosion by increasing runoff resistance, and reducing runoff velocity and power to improve the critical conditions of slope erosion [41]. Their research shows that among many hydrodynamic factors, the runoff power on the slope is the most closely related to the average sediment transport rate of runoff, and the runoff power is the factor that can best reflect the soil erosion rate. It is easier to analyze and simulate the soil erosion process by using runoff kinetic energy and power theory [42,43]. Previous studies have shown that vegetation type, vegetation coverage, vegetation litter, humus, and roots are important factors affecting soil erosion on slopes. Vegetation communities regulate the runoff of slopes through the interaction of aboveground and underground parts [44]. On the one hand, the ecological structure of aboveground plants and underground roots in vegetation communities can increase runoff resistance and reduce runoff power [45]. On the other hand, the correct succession of vegetation communities can improve the soil properties, greatly enhance the soil anti-erodibility, so that the formation of rills cannot be fully developed, and the runoff hydraulic energy slope always changes little [46,47]. In view of this problem, we continue to discuss the correlation degree of slope runoff volume, velocity, resistance coefficient, power, and other factors that affect the soil erosion rate. The average slope runoff volume decreased by 2.85 times with the succession and development of the vegetation community (1–40 years) (Table 4). This contribution came primarily from the root system of the vegetation community, and the average correlation degree was 0.74 (Table 7). The RLD was the most effective indicator of the runoff volume for roots. Runoff power was reduced by 19.75% from 1 to 40 years of succession (Table 3). The contribution came primarily from aboveground vegetation, with an average correlation degree of 0.74 (Table 8). The litter and humus quality were the most effective factors affecting the aboveground part. Vegetation community succession reduced the slope runoff velocity by 47.89%, and its deceleration effect came primarily from aboveground tissue, with the average correlation degree reaching 0.76 (Table 9). The vegetation importance value (0.87), species density (0.84), and Shannon–Wiener index (0.76) played key roles in the aboveground part. Therefore, the vegetation community complicates the composition of species through the development of succession, which is more effective in controlling soil erosion than the vegetation coverage of a single species [44]. The succession and development of the vegetation community also increased the content of soil aggregates, improved soil structure, and thus increased the resistance of surface soil to slope runoff. The correlation degree of soil structure, a series of the sequence index, to runoff resistance reached 0.71 (Table 10). Among them, the content of soil micro-aggregate was a key factor for the increased runoff resistance, and the correlation degree reached 0.8.

4.3. Implications for the Relationship between Vegetation Community Restoration and Slope Erosion

Around 50 years ago, the main contradiction in China’s Loess Plateau was food production and ecological restoration. Strong soil erosion conditions have not allowed humans to cultivate on slopes [48,49]. Therefore, the Chinese government has adopted a series of eco-economic compensation measures in the hopes of resolving this important problem. However, after seeing significant increases in vegetation cover, the global climate changed, and the Loess Plateau still experiences strong soil erosion under extreme precipitation events [50]. Therefore, the new contradiction points to the benefit and mechanism of vegetation in controlling soil erosion. There were differences in the development direction of vegetation community succession, which leads to differences in the underlying surface. In the future, the difference analysis and quantitative description of slope erosion patterns should be examined more carefully. On the one hand, quantitative discussion of the effects of aboveground parts, underground parts, and soil structure of vegetation communities on slope erosion is required, and on the other hand, it is necessary to deeply analyze the relationship between the anti-erodibility of plant communities and the improved soil anti-erodibility, and to establish an evaluation model. This information will help us to understand the mechanism of a vegetation community regulating runoff and sediment on a slope more comprehensively. At the same time, the coupling and feedback between the slope hydrodynamic process and ecological vegetation processes can also be clarified from a scientific point of view.

5. Conclusions

We comprehensively analyzed the successional development of vegetation community restoration on the Loess Plateau in China. We found that vegetation communities in later stages of succession have the ability to control runoff erosion on slopes. In the early stages of vegetation community succession, communities were dominated by wormwood plants. Perennial grasses were dominant in the middle stages of succession, and semi-shrub and small trees became dominant in the later stages. The plant aboveground and underground parts, such as plant density, the number of species, root length density, and root biomass, increased gradually with the development of vegetation succession. After 40 years of natural succession of vegetation communities, the slope runoff velocity decreased by 47.89%, the runoff resistance coefficient increased by approximately 35.30 times, the runoff power decreased by approximately 19.75%, the total runoff volume decreased by approximately 2.52 times, and the total sediment yield was reduced by approximately 11.60 times. On the one hand, the role of vegetation in preventing and controlling slope water erosion indicated that the vegetation important value, number of species, vegetation diversity (Shannon–Wiener index), and litter humus layer of the aboveground part significantly reduced the runoff velocity and power. The total amount of runoff was significantly reduced by the development of vegetation roots. On the other hand, vegetation communities improved the soil structure, in which runoff resistance was significantly increased by the restoration of soil micro-aggregate. Our results are important for vegetation restoration in the Loess erosion slope. They provide a scientific basis for the study of the influence of the vegetation community on the resistance and control of soil erosion and can be used to benefit an evaluation of water and soil conservation in the “Grain for Green Project” on the Chinese Loess Plateau.

Author Contributions

Conceptualization, E.C. and P.L.; methodology, Z.L. (Zhanbin Li) and Y.S.; formal analysis, Y.Z. and J.Z.; software, Z.L. (Zhan Liu) and Z.L. (Zhineng Li); E.C. wrote the manuscript and all authors contributed to improving the paper.

Funding

This study was supported by the National Key Research and Development Program of China (2016YFC0402407), the National Basic Research Program of China (No. 2016YFC0402404), the Natural Science Foundations of China (No. 51779204, 41701603), Shaanxi Province Innovation Talent Promotion Plan Project Technology Innovation Team (2018TD-037) and Shaanxi Provincial Technology Innovation Guidance Project (2017CGZH-HJ-06).

Acknowledgments

We thank the reviewers for their useful comments and suggestions. We would like to thank Murphy Stephen at Yale University for his assistance with the English language and grammatical.

Conflicts of Interest

The authors declare no conflict of interest.

References

  1. Chang, E.; Li, P.; Li, Z.; Xiao, L.; Zhao, B.; Su, Y.; Feng, Z. Using water isotopes to analyze water uptake during vegetation succession on abandoned cropland on the Loess Plateau, China. CATENA 2019, 181, 104095. [Google Scholar] [CrossRef]
  2. Shi, P.; Zhang, Y.; Ren, Z.; Yu, Y.; Li, P.; Gong, J. Land-use changes and check dams reducing runoff andsediment yield on the Loess Plateau of China. Sci. Total Environ. 2019, 664, 984–994. [Google Scholar] [CrossRef] [PubMed]
  3. Zhao, B.; Li, Z.; Peng, L.; Xu, G.; Gao, H.; Cheng, Y.; Chang, E.; Yuan, S.; Yi, Z.; Feng, Z. Spatial distribution of soil organic carbon and its influencing factors under the condition of ecological construction in a hilly-gully watershed of the Loess Plateau, China. Geoderma 2017, 296, 10–17. [Google Scholar] [CrossRef]
  4. Ministry of Water Resources. Chinese River Sediment Bulletin; China Science Press: Beijing, China, 2018; pp. 3–4.
  5. Yellow River Conservancy Commission of the Ministry of Water Resources. Yellow River Basin Comprehensive Planning (2012–2030); Yellow River Water Conservancy Press: Zhengzhou, China, 2013; pp. 15–25. [Google Scholar]
  6. Chen, Y.P.; Wang, K.B.; Lin, Y.S.; Shi, W.Y.; Song, Y.; He, X.H. Balancing green and grain trade. Nat. Geosci. 2015, 8, 739–741. [Google Scholar] [CrossRef]
  7. Zhang, X.P.; Lin, P.F.; Chen, H.; Yan, R.; Zhang, J.J.; Yu, Y.P.; Liu, E.J.; Yang, Y.H.; Zhao, W.H.; Lv, D.; et al. Understanding land use and cover change impacts on run-off and sediment load at flood events on the Loess Plateau, China. Hydrol. Process. 2018, 32, 576–589. [Google Scholar] [CrossRef]
  8. Gao, P.; Jiang, G.T.; Wei, Y.P.; Mu, X.M.; Wang, F.; Zhao, G.J.; Sun, W.Y. Streamflow regimes of the Yanhe River under climate and land use change, Loess Plateau, China. Hydrol. Process. 2015, 29, 2402–2413. [Google Scholar] [CrossRef]
  9. Chen, H.; Cai, Q. Impact of hillslope vegetation restoration on gully erosion induced sediment yield. Sci. China Ser. D 2006, 49, 176–192. [Google Scholar] [CrossRef]
  10. Zhou, P. A Study on Rainstorm Causing Soil Erosion in the Loess Plateau. J. Soil Water Conserv. 1992, 6, 1–5. [Google Scholar]
  11. Schiavon, S.; Zecchin, R. Climate Change 2007: The Physical Science Basis. South African Geographical Journal Being A Record of the Proceedings of the South African. Geogr. Soc. 2007, 92, 86–87. [Google Scholar]
  12. Gao, H.; Li, Z.; Li, P.; Ren, Z.; Yang, Y.; Wang, J. Paths and prevention of sediment during storm-runoff on the Loess Plateau: Based on the rainstorm of 2017-07-26 in Wuding River. Sci. Soil Water Conserv. 2018, 16, 66–72. [Google Scholar]
  13. Zhang, J.T. Succession analysis of plant communities in abandoned croplands in the eastern Loess Plateau of China. J. Arid Environ. 2005, 63, 458–474. [Google Scholar] [CrossRef]
  14. Zhou, J.; Fu, B.J.; Gao, G.Y.; Lu, Y.H.; Liu, Y.; Lu, N.; Wang, S. Effects of precipitation and restoration vegetation on soil erosion in a semi-arid environment in the Loess Plateau, China. CATENA 2016, 137, 1–11. [Google Scholar] [CrossRef]
  15. Xiao, L.; Yao, K.; Li, P.; Liu, Y.; Chang, E.; Zhang, Y.; Zhu, T. Increased soil aggregate stability is strongly correlated with root and soil properties along a gradient of secondary succession on the Loess Plateau. Ecol. Eng. 2020, 143, 105671. [Google Scholar] [CrossRef]
  16. Xiao, L.; Liu, G.; Li, P.; Xue, S. Direct and indirect effects of elevated CO2 and nitrogen addition on soil microbial communities in the rhizosphere of Bothriochloa ischaemum. J. Soils Sediments 2019, 19, 3679–3687. [Google Scholar] [CrossRef]
  17. Rutigliano, F.A.; D’Ascoli, R.; De Santo, A.V. Soil microbial metabolism and nutrient status in a Mediterranean area as affected by plant cover. Soil Biol. Biochem. 2004, 36, 1719–1729. [Google Scholar] [CrossRef]
  18. Chang, E.; Li, P.; Xiao, L.; Xu, G.; Zhao, B.; Su, Y.; Feng, Z. The characteristics of root system behavior in vegetation succession in Loess Hilly and Gully Region. Acta Ecol. Sin. 2019, 39, 2090–2100. [Google Scholar]
  19. Wang, T.; Li, P.; Liu, Y.; Hou, J.M.; Li, Z.B.; Ren, Z.P.; Cheng, S.D.; Zhao, J.H.; Reinhard, H. Experimental investigation of freeze-thaw meltwater compound erosion and runoff energy consumption on loessal slopes. Catena 2020, 185, 104310. [Google Scholar] [CrossRef]
  20. Wang, B.; Zhang, G.H. Quantifying the Binding and Bonding Effects of Plant Roots on Soil Detachment by Overland Flow in 10 Typical Grasslands on the Loess Plateau. Soil Sci. Soc. Am. J. 2017, 81, 1567–1576. [Google Scholar] [CrossRef]
  21. Shi, P.; Qin, Y.; Liu, Q.; Zhu, T.; Li, Z.; Li, P.; Ren, Z.; Liu, Y.; Wang, F. Soil respiration and response of carbonsource changes to vegetation restoration in the Loess Plateau, China. Sci. Total Environ. 2019, in press. [Google Scholar] [CrossRef]
  22. Jiao, F.; Wen, Z.-M.; An, S.-S. Changes in soil properties across a chronosequence of vegetation restoration on the Loess Plateau of China. Catena 2011, 86, 110–116. [Google Scholar] [CrossRef]
  23. Wang, T.; Li, P.; Hou, J.M.; Li, Z.B.; Ren, Z.P.; Cheng, S.D.; Xu, G.C.; Su, Y.Y.; Wang, F.C. Response of the Meltwater Erosion to Runoff Energy Consumption on Loessal Slopes. Water 2018, 10, 1522. [Google Scholar] [CrossRef] [Green Version]
  24. Martorell, C.; Almanza-Celis, C.A.I.; Pérez-García, E.A.; Sánchez-Ken, J.G. Co-existence in a species-rich grassland: Competition, facilitation and niche structure over a soil depth gradient. J. Veg. Sci. 2015, 26, 674–685. [Google Scholar] [CrossRef]
  25. Meng, K.; Jiao, J.; Yin, Q.; Wang, N.; Wang, Z.; Li, Y.; Yu, W.; Wei, Y.; Yan, F.; Cao, B. Successional Trajectory Over 10 Years of Vegetation Restoration of Abandoned Slope Croplands in the Hill-Gully Region of the Loess Plateau. Land Degrad. Dev. 2016, 27, 919–932. [Google Scholar]
  26. Nearing, M.A.; Simanton, J.R.; Norton, L.D.; Bulygin, S.J.; Stone, J. Soil erosion by surface water flow on a stony, semiarid hillslope. Earth Surf. Process. Landf. 2015, 24, 677–686. [Google Scholar] [CrossRef]
  27. Liu, X.; Wang, F.; Yang, S.; Li, X.; Ma, H.; He, X. Sediment reduction effect of level terrace in the hilly-gully region in the Loess Plateau. J. Hydraul. Eng. 2014, 45, 793–800. [Google Scholar]
  28. Zhang, G.H.; Luo, R.T.; Ying, C.; Shen, R.C.; Zhang, X.C. Correction factor to dye-measured flow velocity under varying water and sediment discharges. J. Hydrol. 2010, 389, 205–213. [Google Scholar] [CrossRef]
  29. Zhang, B.Q.; He, C.S.; Burnham, M.; Zhang, L.H. Evaluating the coupling effects of climate aridity and vegetation restoration on soil erosion over the Loess Plateau in China. Sci. Total Environ. 2016, 539, 436–449. [Google Scholar] [CrossRef]
  30. Peng, X.; Shi, D.; Dong, J.; Wang, S.; Li, Y. Runoff erosion process on different underlying surfaces from disturbed soils in the Three Gorges Reservoir Area, China. CATENA 2014, 123, 215–224. [Google Scholar] [CrossRef]
  31. Zuazo, V.H.D.; Pleguezuelo, C.R.R. Soil-erosion and runoff prevention by plant covers. A review. Agron. Sustain. Dev. 2008, 28, 65–86. [Google Scholar] [CrossRef] [Green Version]
  32. Li, P.; Zhao, Z.; Li, Z. Vertical root distribution characters of Robinia pseudoacacia on the Loess Plateau in China. J. For. Res. 2004, 15, 87–92. [Google Scholar]
  33. Jordan, A.; Zavala, L.M.; Gil, J. Effects of mulching on soil physical properties and runoff under semi-arid conditions in southern Spain. CATENA 2010, 81, 77–85. [Google Scholar] [CrossRef]
  34. Wang, C.; Ouyang, H.; Maclaren, V.; Yin, Y.; Shao, B.; Boland, A.; Tian, Y. Evaluation of the economic and environmental impact of converting cropland to forest: A case study in Dunhua county, China. J. Environ. Manag. 2007, 85, 746–756. [Google Scholar] [CrossRef] [PubMed]
  35. Zhi, D.; Hongli, L.I.; Guoyong, R.E.N.; Gang, L.I.U.; Lin, M.A. Study on Soil Amelioration Effect of Planting Grasses in Wind—Sandy Land of Yellow River Floodplain. Chin. J. Grassl. 2008, 30, 84–87. [Google Scholar]
  36. Bai, Y.F.; Xingguo, H.; Jianguo, W.; Zuozhong, C.; Linghao, L. Ecosystem stability and compensatory effects in the Inner Mongolia grassland. Nature 2004, 431, 181–184. [Google Scholar] [CrossRef]
  37. Li, Y.Y.; Shao, M.A. Change of soil physical properties under long-term natural vegetation restoration in the Loess Plateau of China. J. Arid Environ. 2006, 64, 77–96. [Google Scholar] [CrossRef]
  38. Chen, L.; Huang, Z.; Jie, G.; Fu, B.; Huang, Y. The effect of land cover/vegetation on soil water dynamic in the hilly area of the loess plateau, China. CATENA 2007, 70, 200–208. [Google Scholar] [CrossRef]
  39. Lu, R.; Liu, Y.F.; Jia, C.; Huang, Z.; Liu, Y.; He, H.H.; Liu, B.R.; Wang, Z.J.; Zheng, J.Y.; Wu, G.L. Effects of mosaic-pattern shrub patches on runoff and sediment yield in a wind-water erosion crisscross region. CATENA 2019, 174, 199–205. [Google Scholar] [CrossRef]
  40. Xin, Z.B.; Xu, J.X.; Zheng, W. Spatiotemporal variations of vegetation cover on the Chinese Loess Plateau (1981–2006): Impacts of climate changes and human activities. Sci. China 2008, 51, 67–78. [Google Scholar] [CrossRef]
  41. Jiao, J.; Wang, Z.; Wei, Y.; Yuan, S.; Cao, B.; Li, Y. Characteristics of erosion sediment yield with extreme rainstorms in Yanhe Watershed based on field measurement. Trans. Chin. Soc. Agric. Eng. 2017, 33, 159–167. [Google Scholar]
  42. Sasaki, Y.; Fujii, A.; Asai, K. Soil creep process and its role in debris slide generation—Field measurements on the north side of Tsukuba Mountain in Japan. Eng. Geol. 2000, 56, 163–183. [Google Scholar] [CrossRef]
  43. Wang, L.; Yao, W.; Shen, Z.; Yang, C. Effects of grass coverage on shallow flow hydraulic parameters and sediment reduction. Sci. Soil Water Conserv. 2009, 7, 80–83. [Google Scholar]
  44. Govers, G. Relationship between discharge, velocity and flow area for rills eroding loose, non-layered materials. Earth Surf. Process. Landf. 2010, 17, 515–528. [Google Scholar] [CrossRef]
  45. Quinton, J.N.; Edwards, G.M.; Morgan, R.P.C. The influence of vegetation species and plant properties on runoff and soil erosion: Results from a rainfall simulation study in SE Spain. Soil Use Manag. 2010, 13, 143–148. [Google Scholar] [CrossRef]
  46. Yan, Y.C.; Xin, X.P.; Xu, X.L.; Wang, X.; Yang, G.X.; Yan, R.R.; Chen, B.R. Quantitative effects of wind erosion on the soil structure and soil nutrients under different vegetation coverage in a semiarid steppe of northern China. Plant Soil 2013, 369, 585–598. [Google Scholar] [CrossRef]
  47. Zhang, P.; Yao, W.Y.; Liu, G.B.; Xiao, P.Q. Experimental study on soil erosion prediction model of loess slope based on rill morphology. CATENA 2019, 173, 424–432. [Google Scholar] [CrossRef]
  48. Pimentel, D. Soil Erosion: A Food and Environmental Threat. Environ. Dev. Sustain. 2006, 8, 119–137. [Google Scholar] [CrossRef]
  49. Zhu, L.Q. Study on soil erosion and its effects on agriculture sustainable development in west Henan province loess hilly areas. J. Food Agric. Environ. 2013, 11, 906–908. [Google Scholar]
  50. Zhao, B.H.; Li, Z.B.; Li, P.; Cheng, Y.T.; Gao, B. Effects of ecological construction on the transformation of different water types on Loess Plateau, China. Ecol. Eng. 2019, in press. [Google Scholar] [CrossRef]
Figure 1. (a,b) Study area in Shaanxi Province, China; (c) Digital elevation model; (d) Digital image and sampling sites.
Water 11 02614 g001
Figure 2. Device schematic diagram and field photos of the experimental process in the experimental area. (ae) Before soil erosion; (fj) After soil erosion; (a,f) Artemisia capillaris for 1 year since restoration; (b,g) A. sacrorum for 11 years; (c,h) Bothriochloa ischaemum for 15 years; (d,i) Lespedeza davurica for 25 years; (e,j) Ziziphus jujube for 40 years.
Water 11 02614 g002
Figure 3. Short-term rainstorm frequency P–III curve in the study area.
Water 11 02614 g003
Figure 4. Distribution characteristics of the vegetation importance value.
Water 11 02614 g004
Figure 5. Distribution characteristics of root morphology in vegetation communities. Note: The same letter (a,b,c) indicates that there was no significant difference in the indexes of root system among groups, the significant level P = 0.05.
Water 11 02614 g005
Figure 6. Average soil erosion and runoff rate under different vegetation communities.
Water 11 02614 g006
Table 1. Status of the experimental plots.
Years after Restoration/yDominant SpeciesVegetation TypeAltitude/mSlope AspectSlope/(°)Vegetation Coverage/%Humus Thickness/cmAssociated Species
1Artemisia capillarisSemi-shrub, herb977Shady slope8250.18Artemisia atrovirens, Artemisia scoparia
11Artemisia sacrorumSemi-shrub, herb965Half-sunny slope9730.58Artemisia atrovirens, Artemisia scoparia, Tripolium vulgare, Lespedeza davurica, Ziziphus jujuba
15Bothriochloa ischaemumPerennial herb961Half-sunny slope8860.73Artemisia sacrorum, Lespedeza davurica, Artemisia atrovirens, Taraxacum mongolicum
25Lespedeza davuricaHerbaceous subshrub951Half-shady slope8670.57Artemisia sacrorum, Lespedeza davurica, Bothriochloa ischaemum, Setaria viridis, Tripolium vulgare, Artemisia atrovirens, Artemisia scoparia, Taraxacum mongolicum
40Ziziphus jujubaDeciduous arbors963Half-shady slope9760.69Artemisia sacrorum, Lespedeza davurica, Bothriochloa ischaemum, Setaria viridis, Tripolium vulgare, Clerodendrum mandarinorum, Asparagus cochinchinensis, Artemisia scoparia, Taraxacum mongolicum
Table 2. The ecological structure development of vegetation community succession from 1 to 40 years.
Years after Restoration/YearSpecies Density (n/m2)Plants Density (n/m2)Plant Height (cm/m2)Aboveground Plant Biomass (g/m2)Litter and Humus (g/m2)
12.514.3325.2528.8324.50
113.544.558.33195.83115.33
153135.554.17165.55151.33
25434.6754.67195.33220.5
404.534.35159.32753.33605.00
Table 3. Characteristics of the dynamic parameters of slope runoff in different vegetation communities.
Years after Restoration/YearScouring Flow (L/min)Water Temperature
T (°C)
Runoff Depth
h (m)
Runoff Width
d (m)
Runoff Velocity
v (m/s)
Reynolds Number
Re
Froude Number
Fr
Darcy–Weisbach
f
Runoff Shear Stress
τ (Pa)
Runoff Power
P (N/(m/s))
1480.0020.1240.238409.4551.5670.4623.3180.788
880.0020.3490.218301.6381.5900.4482.6750.580
1680.0010.2820.211689.6931.5810.4634.6861.327
114220.0010.2410.211290.7191.8381.0072.0990.442
8160.0030.2080.260588.8891.6650.9373.9641.025
16140.0030.3580.266676.4531.5530.9094.7421.256
154180.0020.1590.256432.6671.9500.7702.8610.725
8160.0020.2950.203416.9031.3521.1883.2180.654
16160.0040.3380.238751.1111.2781.3384.9541.178
254220.0030.1560.146464.3390.8474.4324.3360.628
8140.0030.2620.180465.6621.0491.8544.2400.759
16160.0070.3710.110670.7530.43012.5549.4571.038
404170.0050.1890.078346.9700.36221.7927.6110.589
8160.0050.3380.094374.9780.46614.9387.2280.652
16160.0060.4120.115636.4820.46711.7679.6931.108
Table 4. Total runoff volume and sediment yield under different vegetation communities.
Scouring Flow/(L/min)Years after Restoration/YearsRunoff Volume/LSediment Yield/kg
41109.592.02
1141.930.36
1593.960.56
2573.390.09
4031.120.12
81202.82.7
11147.290.58
15194.070.73
25171.720.15
4073.970.29
161459.5710.83
11363.731.38
15407.50.99
25399.530.31
40200.780.93
Table 5. Correlations between the soil erosion rate and hydrodynamic factors.
Scouring Flow/(L/min)Sample SizeRunoff VelocityRunoff ResistanceRunoff PowerShear Stress
4500.456 *−0.319 *0.412 **−0.246
8750.285 *−0.213 *0.235 *−0.394 **
16700.491 **−0.367 **0.376 **−0.388 **
Total1950.414 **−0.217 **0.326 **−0.112
* Indicates a significant correlation at p < 0.05; ** Indicates a significant correlation at p < 0.01.
Table 6. Correlation coefficient between the soil erosion rate and hydrodynamic factors and grey correlation degree.
Characteristic IndicatorsCorrelation Coefficient1 Year11 Years15 Years25 Years40 YearsCorrelation Degree γ (x0, xi)
Runoff velocityξ10.370.650.670.721.000.68
Runoff resistanceξ20.380.991.000.700.430.70
Shear stressξ30.391.000.990.670.620.73
Runoff powerξ40.480.961.000.860.990.86
Table 7. Grey correlation between the total slope runoff volume and vegetation communities.
Sequence IndexCorrelation Coefficient1 Year11 Years15 Years25 Years40 YearsCorrelation DegreeMean
Underground partRWDξ50.660.990.811.000.420.780.74
RLDξ60.501.000.631.000.930.81
Root diameterξ70.470.930.641.000.370.68
RTDξ80.421.000.550.920.540.69
Aboveground partVegetation important valueξ90.520.960.701.000.400.720.69
Number of speciesξ100.460.970.631.000.380.69
Number of plantsξ110.461.000.370.700.940.69
Shannon–Wiener indexξ120.570.770.421.000.350.62
Margalef indexξ130.411.000.380.700.760.65
Plant biomassξ140.581.000.790.900.390.73
Litter and humusξ150.520.751.000.800.670.75
Soil structuresaturated hydraulic conductivityξ160.520.791.000.560.330.640.69
d50ξ170.360.660.681.000.360.61
Macro-aggregateξ180.481.000.650.970.360.69
Micro-aggregateξ190.690.990.881.000.520.82
Table 8. Grey correlation between the slope runoff power and vegetation communities.
Sequence IndexCorrelation Coefficient1 Year11 Years15 Years25 Years40 YearsCorrelation DegreeMean
Underground partRWDξ200.630.820.791.000.400.730.69
RLDξ210.430.940.400.941.000.74
Root diameterξ220.431.000.600.910.340.66
RTDξ230.390.640.361.000.700.62
Aboveground partVegetation important valueξ240.520.671.000.610.480.660.74
Number of speciesξ250.481.000.760.670.460.67
Number of plantsξ260.641.000.430.940.960.79
Shannon–Wiener indexξ270.721.000.380.790.370.65
Margalef indexξ280.580.930.410.941.000.77
Plant biomassξ290.620.910.881.000.410.76
Litter and humusξ300.620.900.910.961.000.88
Soil structuresaturated hydraulic conductivityξ310.640.801.000.650.400.700.73
d50ξ320.370.901.000.610.580.69
Macro-aggregateξ331.000.570.860.600.670.74
Micro-aggregateξ340.670.990.861.000.500.80
Table 9. Grey correlation between the slope runoff velocity and vegetation communities.
Sequence IndexCorrelation Coefficient1 Year11 Years15 Years25 Years40 YearsCorrelation DegreeMean
Underground partRWDξ350.560.650.641.000.340.640.68
RLDξ360.370.900.461.000.660.68
Root diameterξ370.630.990.741.000.450.76
RTDξ380.460.620.601.000.540.65
Aboveground partVegetation important valueξ391.000.860.940.940.620.870.76
Number of speciesξ400.811.000.910.910.590.84
Number of plantsξ410.500.690.391.000.960.71
Shannon–Wiener indexξ420.911.000.550.890.480.76
Margalef indexξ430.540.690.681.000.350.65
Plant biomassξ440.540.690.681.000.350.65
Litter and humusξ450.500.991.001.000.600.82
Soil structuresaturated hydraulic conductivityξ460.580.651.000.690.350.660.70
d50ξ470.711.000.980.850.590.82
Macro-aggregateξ481.000.480.740.550.520.66
Micro-aggregateξ490.501.000.550.960.340.67
Table 10. Grey correlation between the slope runoff resistance and vegetation communities.
Sequence IndexCorrelation Coefficient1 Year11 Years15 Years25 Years40 YearsCorrelation DegreeMean
Underground partRWDξ501.000.440.570.380.680.610.70
RLDξ511.000.620.470.840.380.66
Root diameterξ520.930.600.821.000.450.76
RTDξ531.000.810.530.980.430.75
Aboveground partVegetation important valueξ540.680.700.721.000.400.700.65
Number of speciesξ550.680.610.681.000.370.67
Number of plantsξ561.000.760.400.780.380.66
Shannon–Wiener indexξ570.640.600.951.000.410.72
Margalef indexξ581.000.790.460.860.400.70
Plant biomassξ591.000.350.430.360.410.51
Litter and humusξ601.000.420.440.570.350.56
Soil structuresaturated hydraulic conductivityξ611.000.750.490.450.680.670.71
d50ξ620.720.640.681.000.390.69
Macro-aggregateξ630.630.710.681.000.390.68
Micro-aggregateξ641.000.620.970.910.520.80

