Riverbank Stability Assessment under River Water Level Changes and Hydraulic Erosion

Abstract
1. Introduction
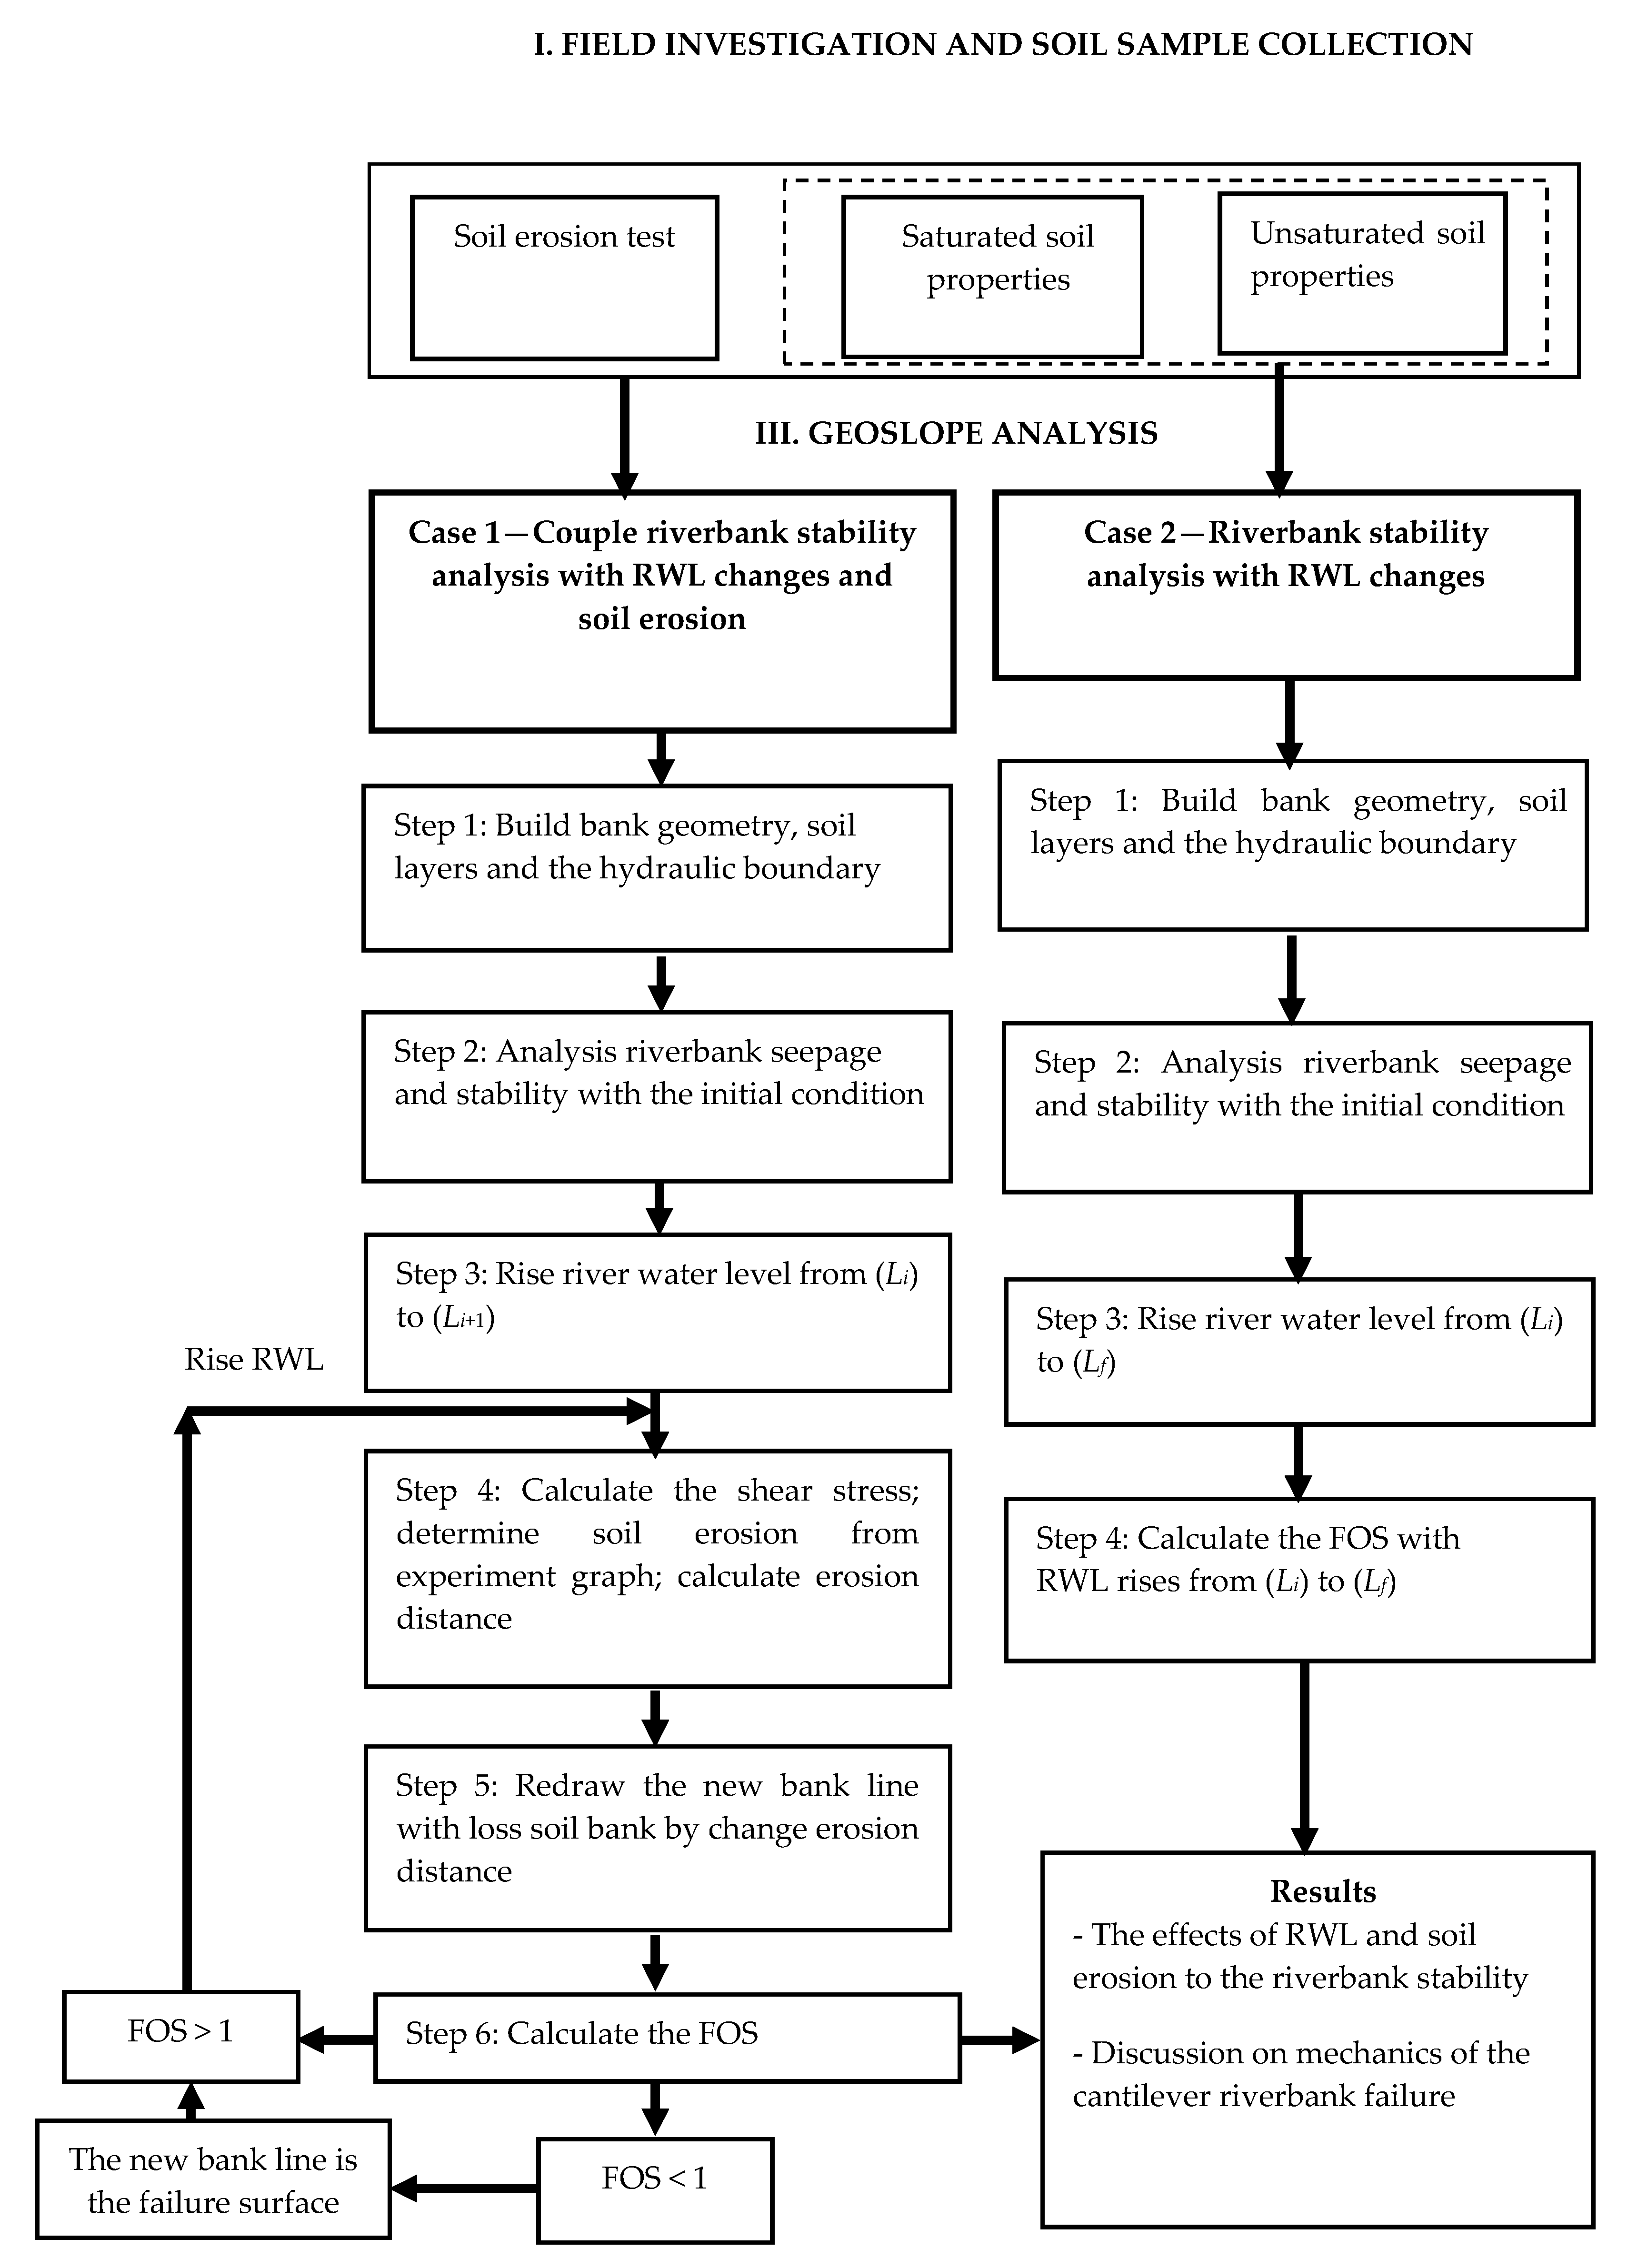
2. Methods
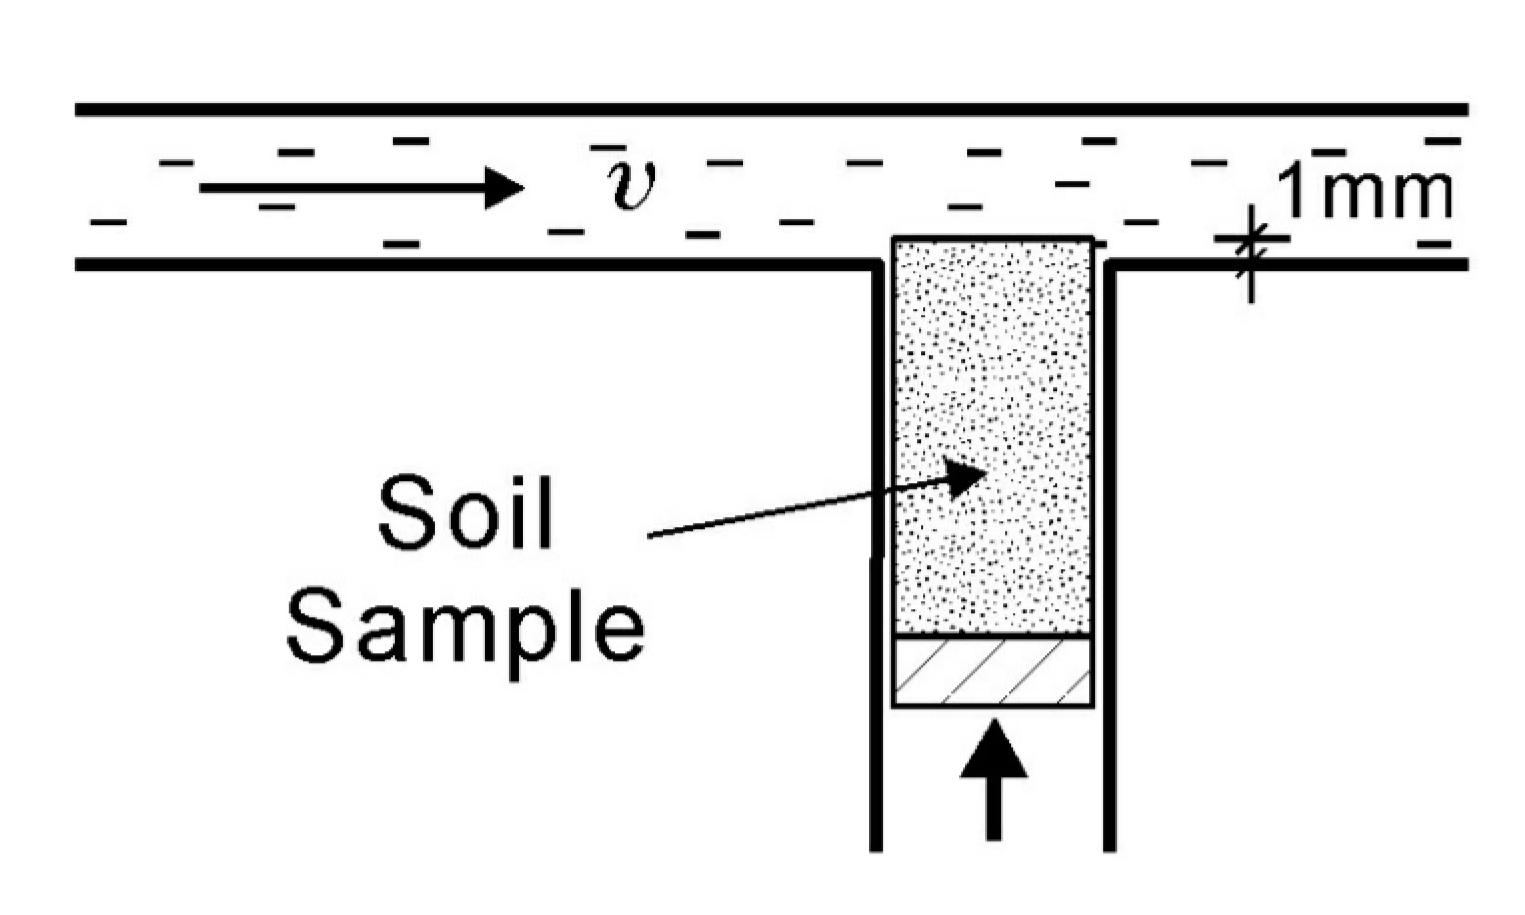
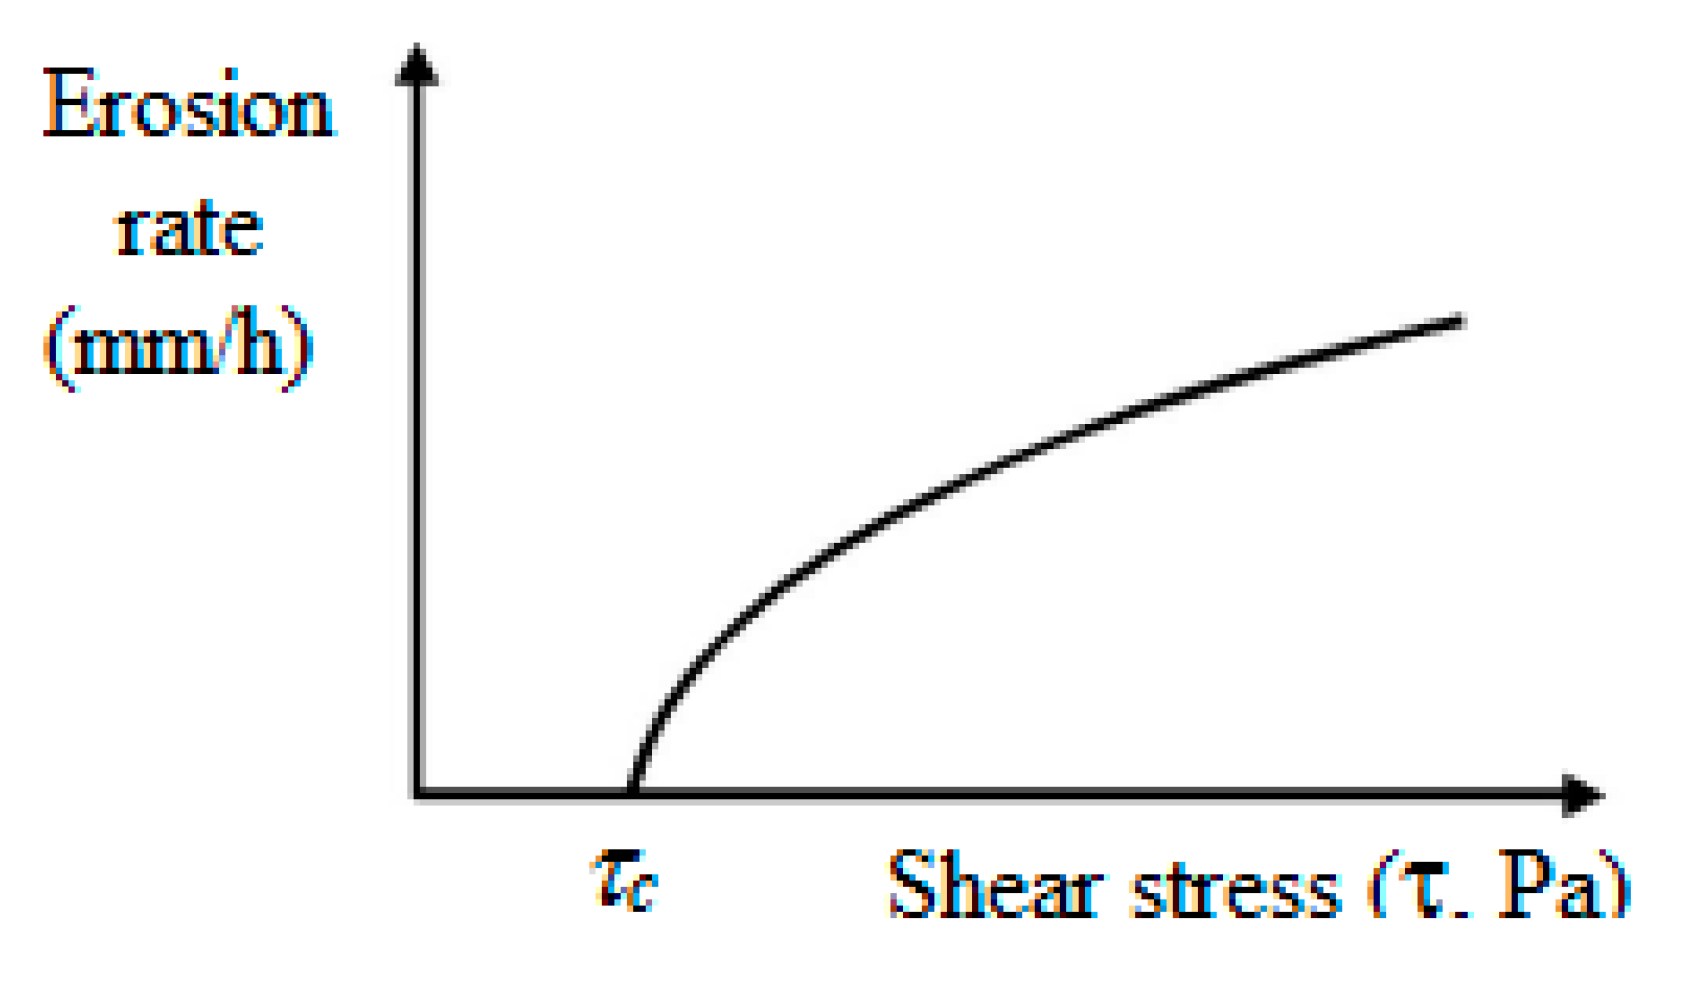
2.1. Determining Soil Erosion Rate in Laboratory
2.2. Riverbank Erosion Simulation
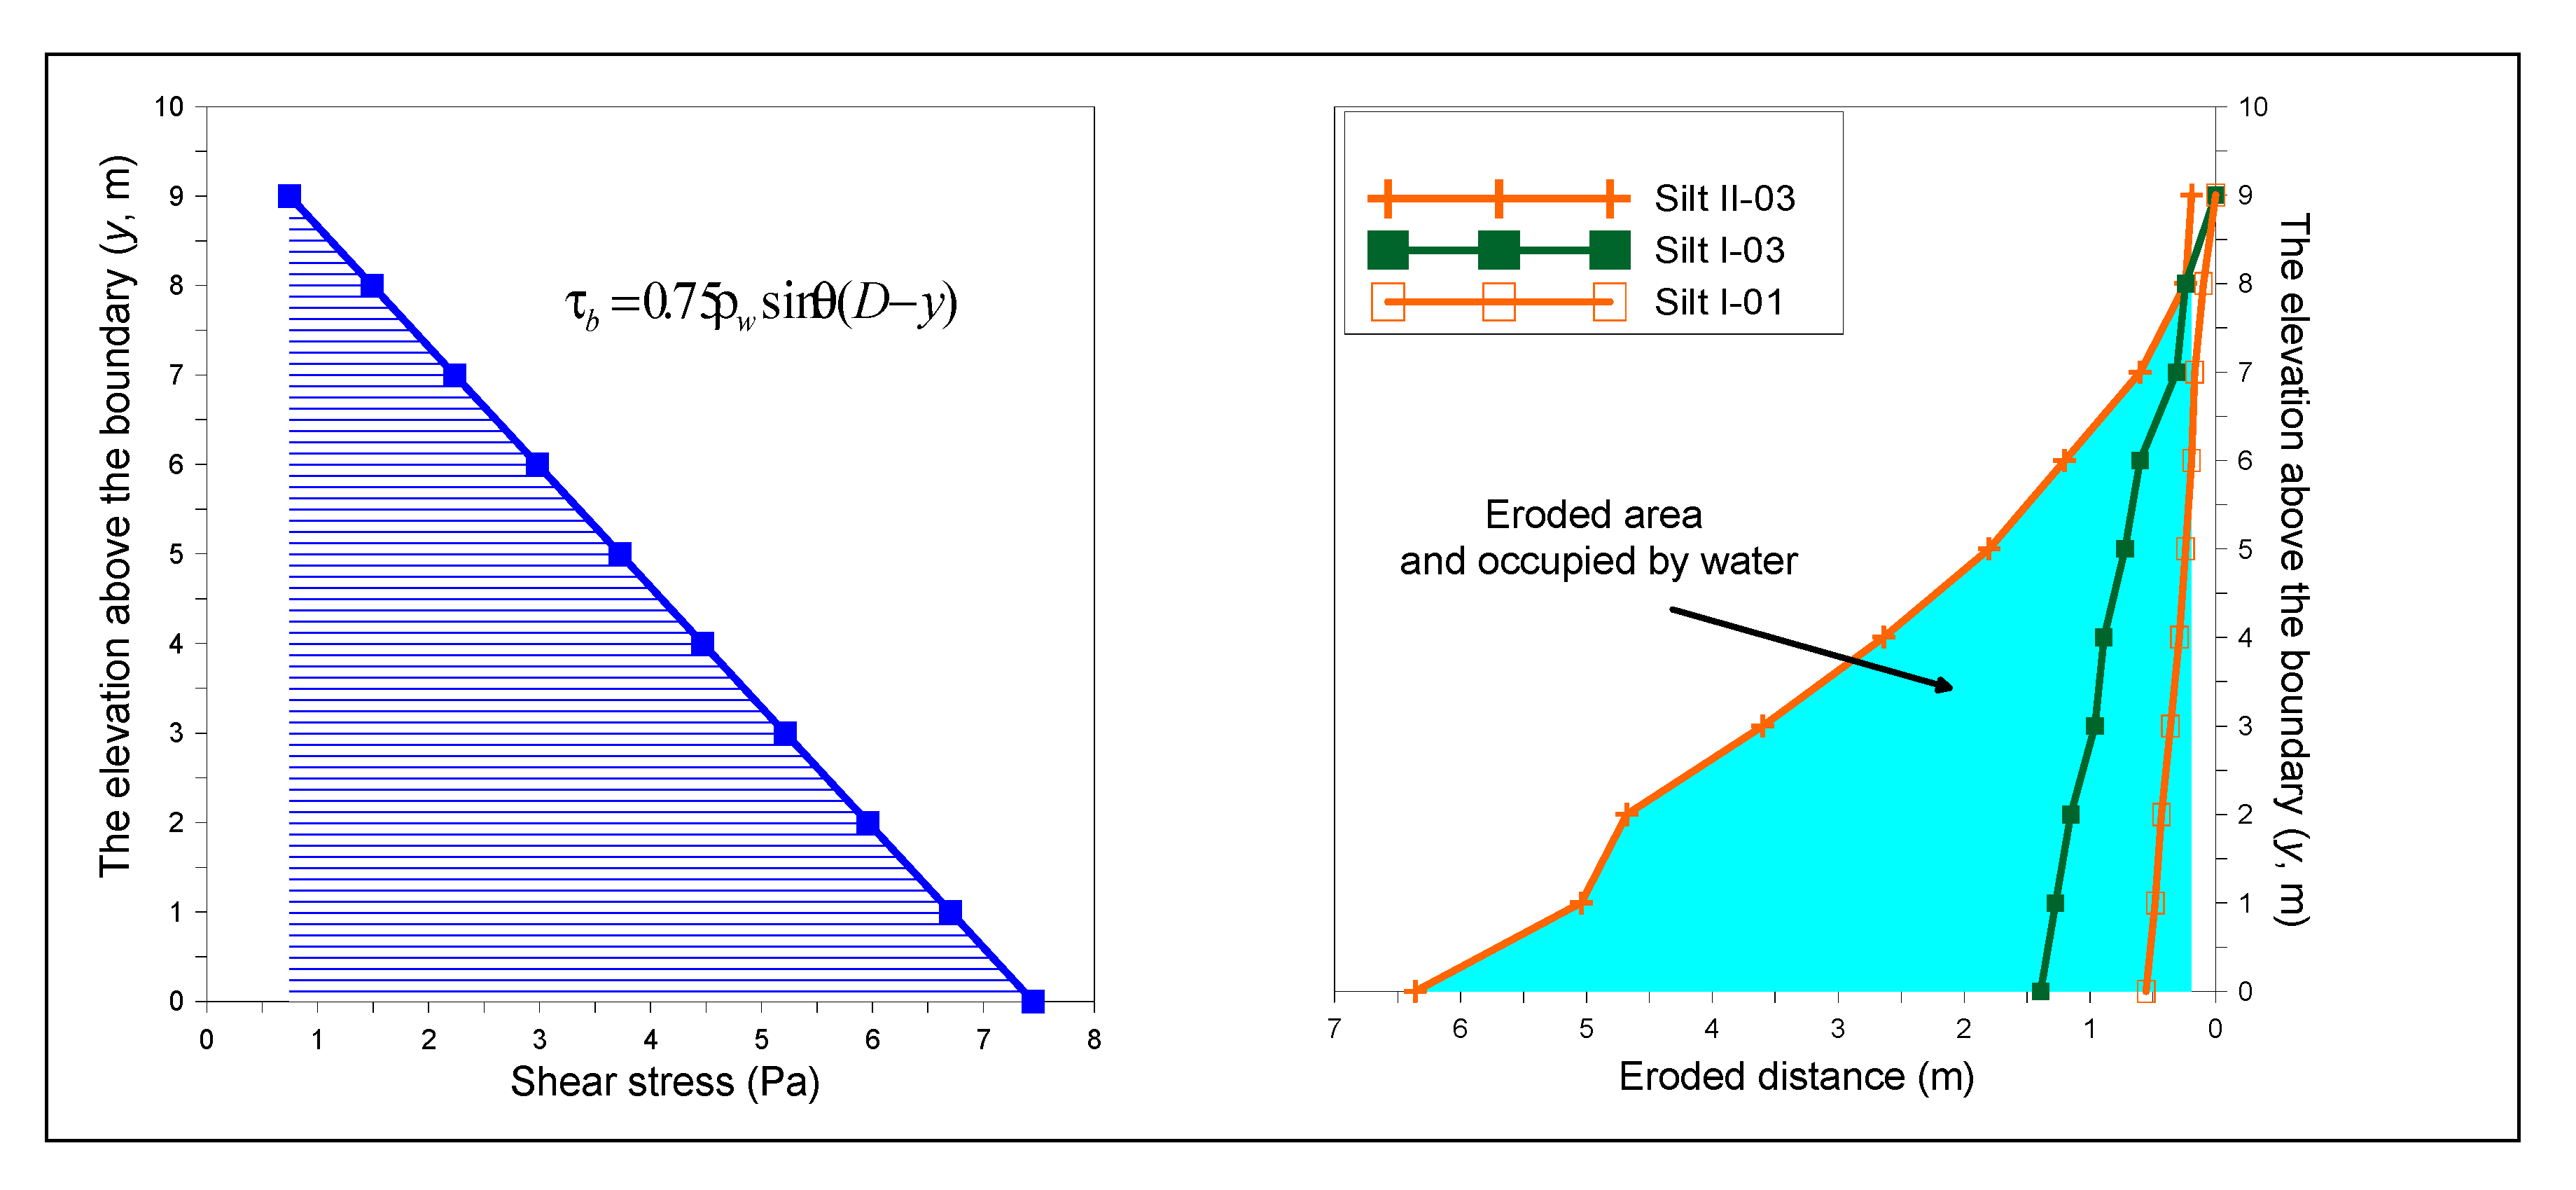
2.2.1. The Boundary Shear Stress Causing Soil Erosion
2.2.2. Soil Erosion and Riverbank Erosion Width
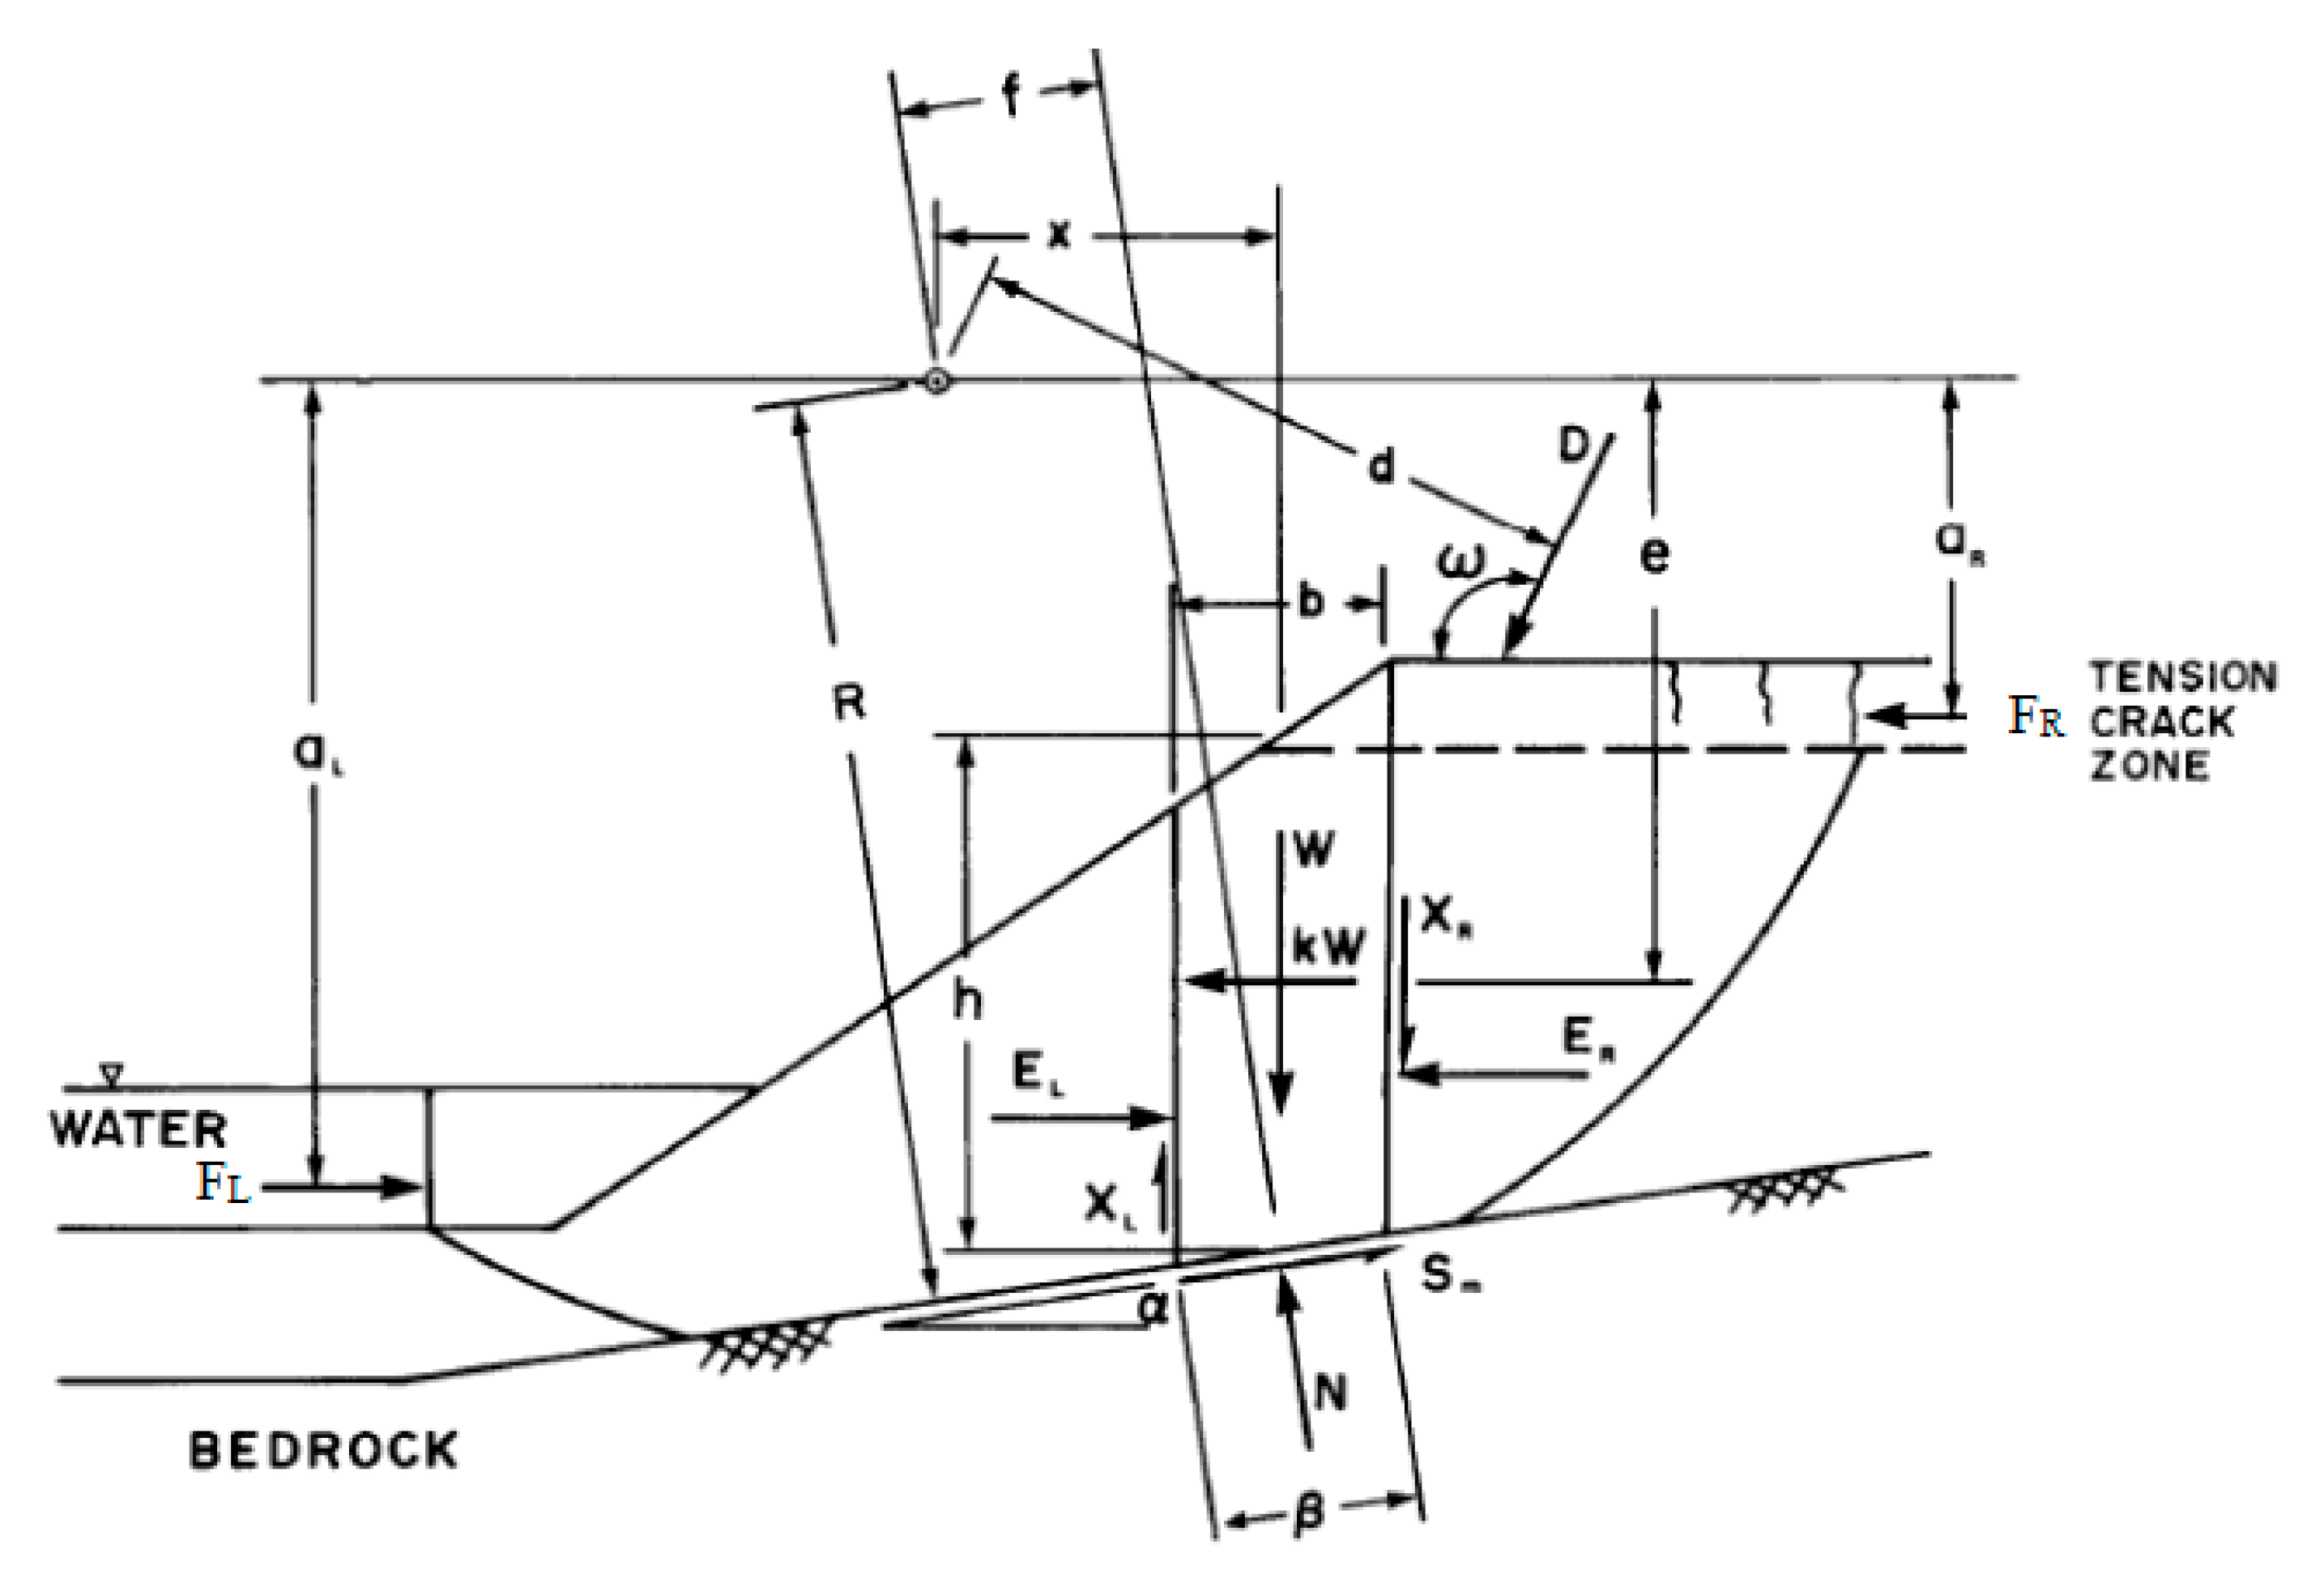
2.3. Model Analysis of Riverbank Stability with Seepage and Soil Erosion
3. Study Area Conditions
4. Results and Discussion
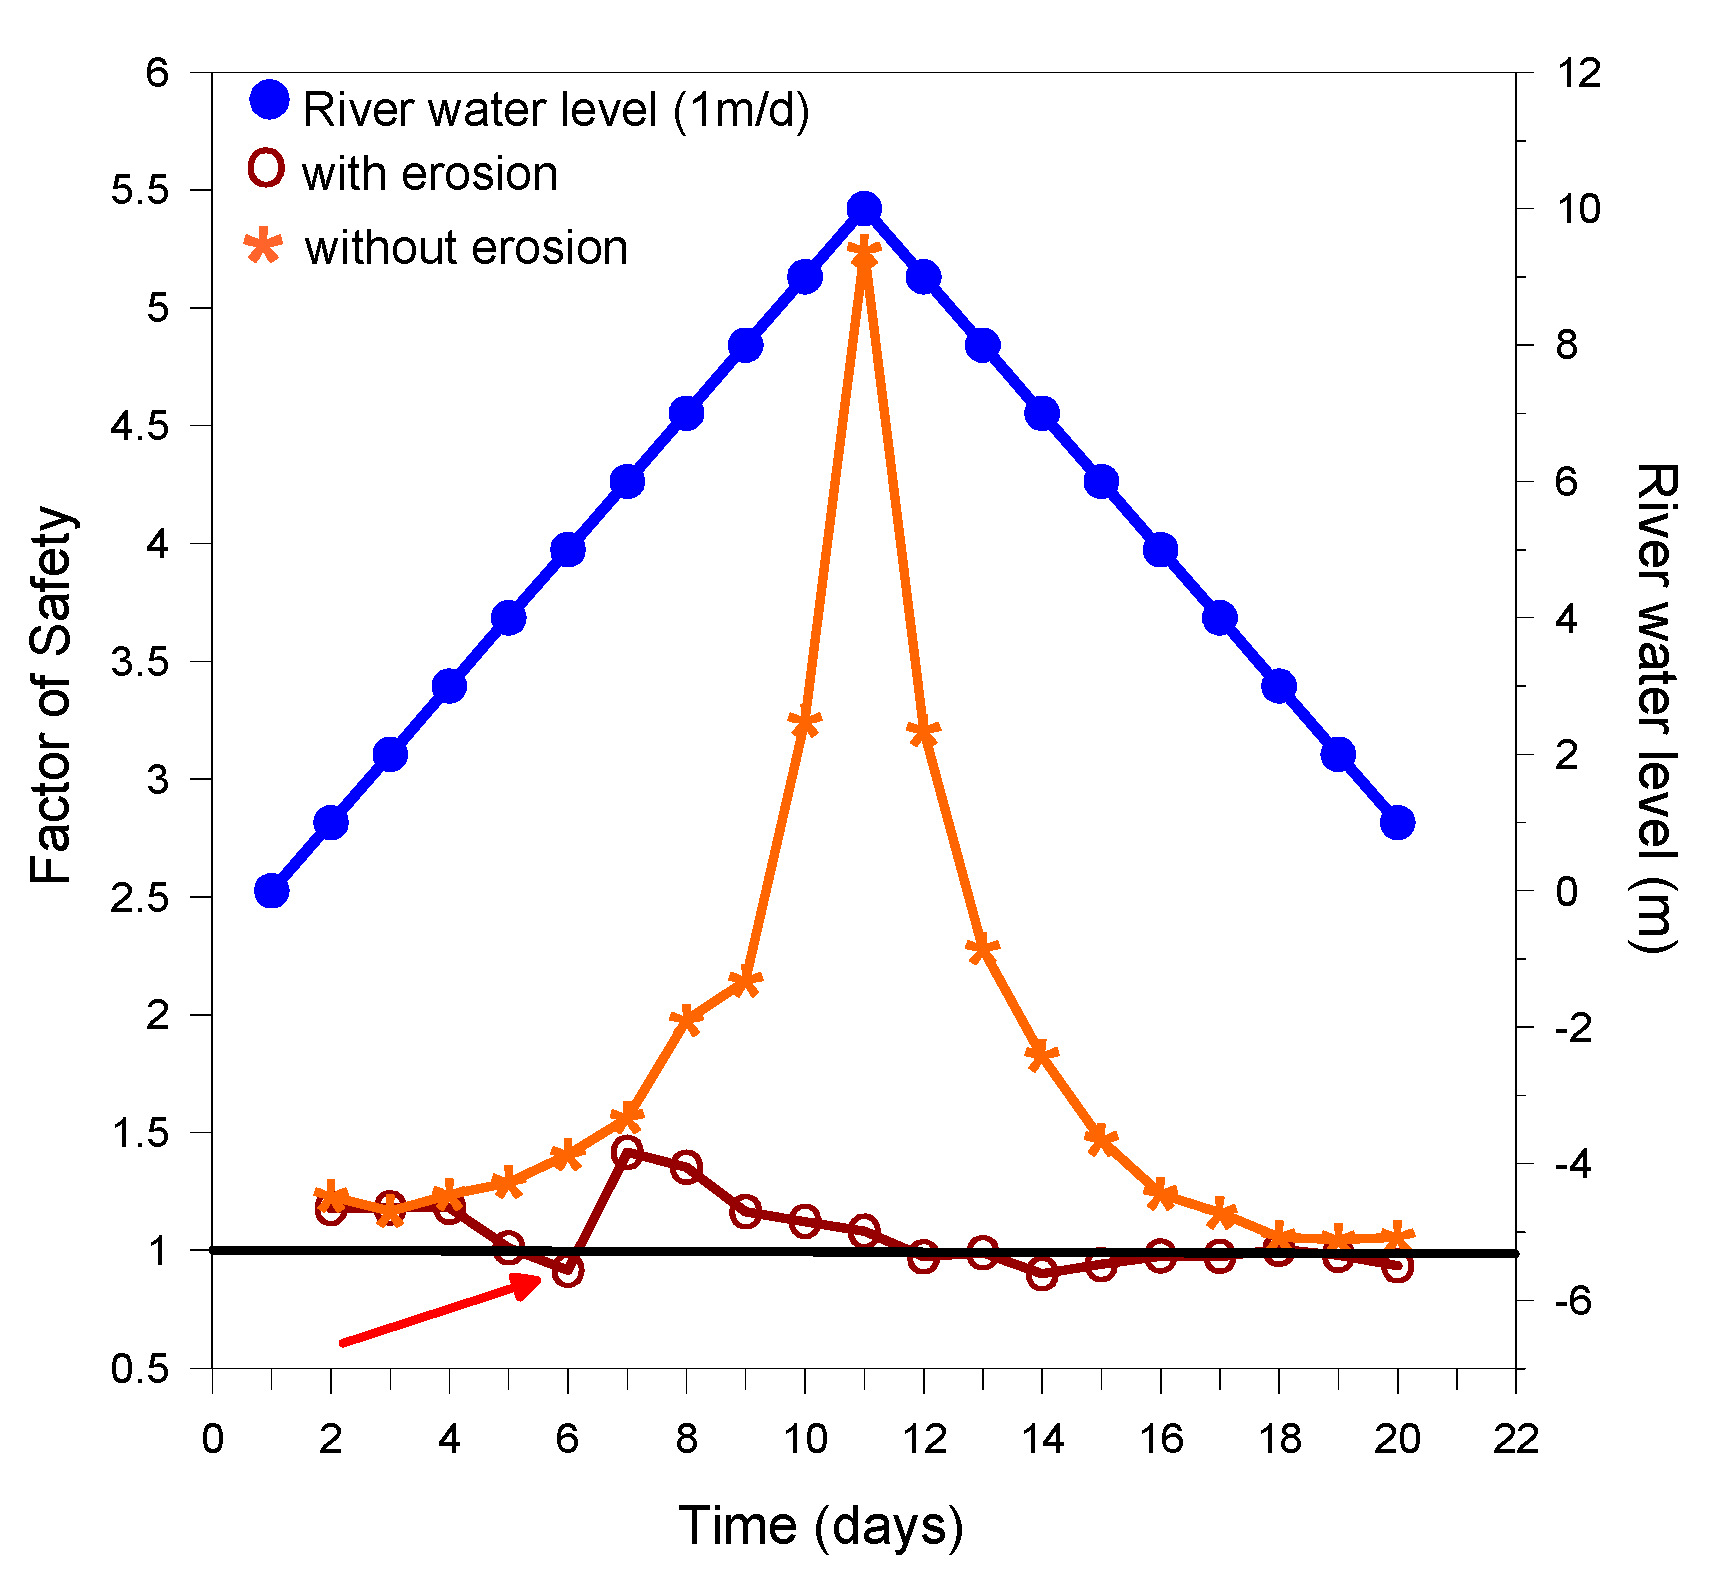
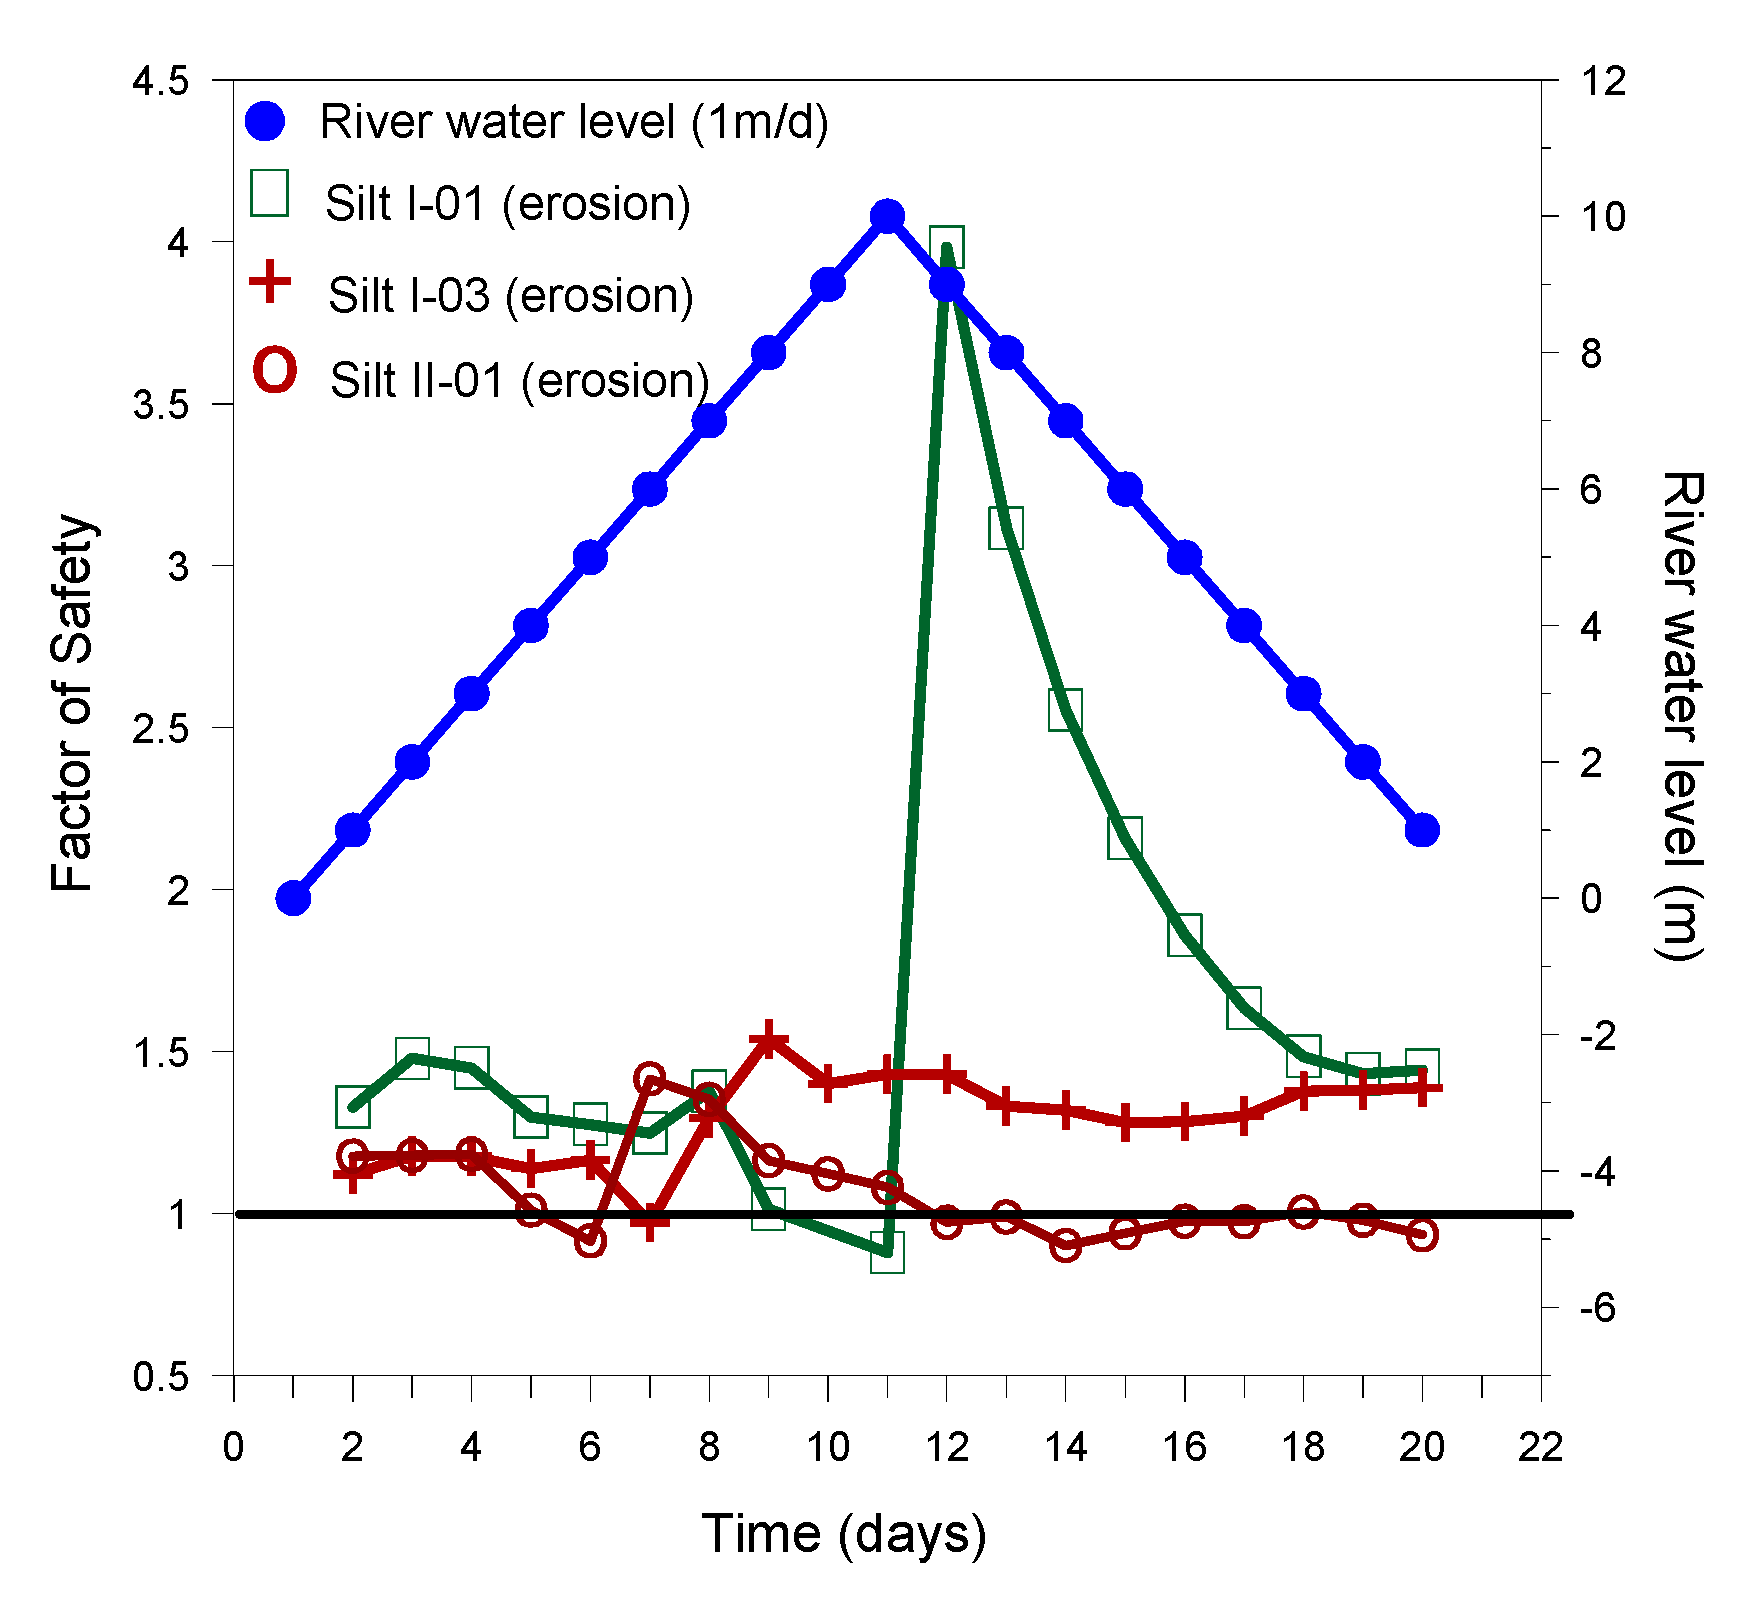
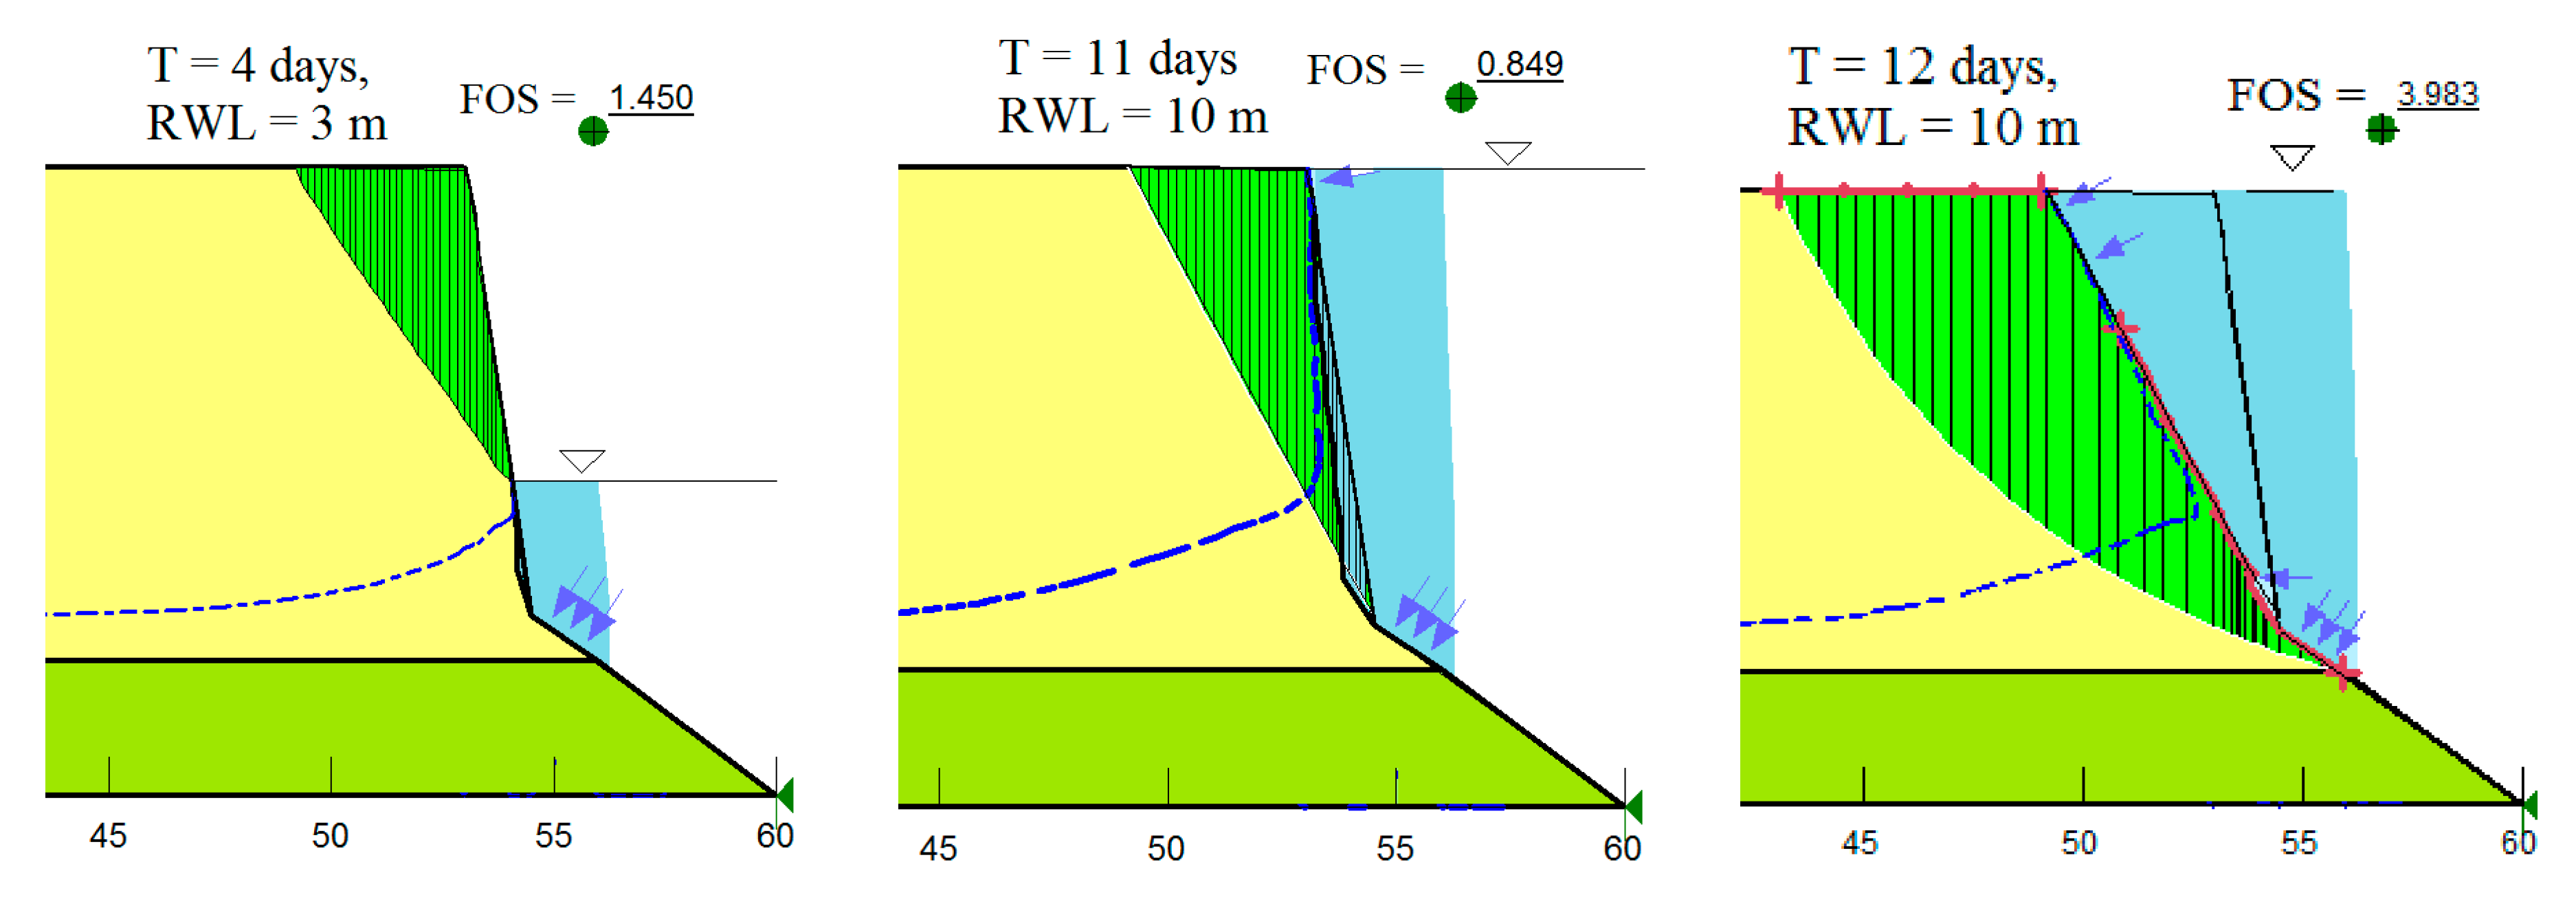
4.1. Effects of Soil Erosion to Riverbank Stability
4.2. Complexity of Factors in Riverbank Stability Analysis
5. Conclusions
Author Contributions
Funding
Acknowledgments
Conflicts of Interest
References
- Watson, A.; Basher, L. Stream bank erosion: A review of processes of bank failure, measurement and assessment techniques, and modelling approaches. In A Report Prepared for Stakeholders of the Motueka Integrated Catchment Management Programme and the Raglan Fine Sediment Study; Landcare Research: Hamilton, New Zealand, 2006. [Google Scholar]
- Casagli, N.; Rinaldi, M.; Gargini, A.; Curini, A. Pore water pressure and streambank stability: Results from a monitoring site on the Seive River, Italy. Earth Surf. Process. Landf. 1990, 24, 1095–1114. [Google Scholar] [CrossRef]
- Dapporto, S.; Rinaldi, M.; Casagli, N. Failure mechanisms and pore pressure condition analysis of Riverbank along the Arno River (Central Italy). Eng. Geol. 2001, 61, 221–242. [Google Scholar] [CrossRef]
- Rinaldi, M.; Casagli, N.; Dapporto, S.; Gargini, A. Monitoring and modeling of pore water pressure changes and river-bank stability during flow events. Earth Surf. Process. Landf. 2004, 29, 237–254. [Google Scholar] [CrossRef]
- Rinaldi, M.; Mengoni, B.; Luppi, L.; Darby, S.E.; Mosselman, E. Numerical simulation of hydrodynamics and bank erosion in a river bend. Water Resour. Res. 2008, 44, 1–17. [Google Scholar] [CrossRef]
- Duong, T.T.; Komine, H.; Do, M.D.; Murakami, S. Riverbank stability assessment under flooding conditions in the Red River of Hanoi, Vietnam. Comput. Geotech. 2014, 61, 178–189. [Google Scholar] [CrossRef]
- Hui, L. Yangtze Riverbank Slope Stability by Water Level Change in the Three Gorges Reservoir. Electron. J. Geotech. Eng. 2015, 20, 1847–1856. [Google Scholar]
- Liang, C.; Jaksa, M.; Ostendorf, B.; Kuo, Y. Influence of river level fluctuations and climate on riverbank stability. Comput. Geotech. 2015, 63, 83–98. [Google Scholar] [CrossRef]
- Chen, C.-H.; Hsieh, T.-Y.; Yang, J.-C. Investigating effect of water level variation and surface tension crack on riverbank stability. J. Hydro-Environ. Res. 2017, 15, 41–53. [Google Scholar] [CrossRef]
- Langendoen, E.J. Concepts: Conservational Channel Evolution and Pollutant Transport System Software Manual; Research Report No. 16; USDA-ARS National Sedimentation: Oxford, MS, USA, 2000.
- Simon, A.; Collison, A.J.C. Quantifying the mechanical and hydrological effects of riparian vegetation on stream-bank stability. Earth Surf. Process. Landf. 2002, 27, 527–546. [Google Scholar] [CrossRef]
- Simon, A.; Curini, A.; Darby, S.; Langendoen, E. Stream-bank mechanics and the role of bank and nearbank processes in incised channels. In Incised River Channels; Darby, S., Simon, A., Eds.; John Wiley and Sons: New York, NY, USA, 1999; pp. 123–152. [Google Scholar]
- Simon, A.; Curini, A.; Darby, S.E.; Langendoen, E.J. Bank and near-bank processes in an incised channel. Geomorphology 2000, 35, 193–217. [Google Scholar] [CrossRef]
- Simon, A.; Pollen, N.; Langendoen, E.J. Influence of two woody riparian species on critical conditions for streambank stability: Upper Truckee River, California. J. Am. Water Resour. Assoc. 2006, 42, 99–113. [Google Scholar] [CrossRef]
- Simon, A.; Pollen-Bankhead, N.; Thomas, R.E. Development and application of a deterministic bank stability and toe erosion model for stream restoration. In Stream Restoration in Dynamic Fluvial Systems: Scientific Approaches, Analyses and Tools; Geophysical Monograph Series; American Geophysical Union: Washington, DC, USA, 2011; Volume 194, pp. 453–474. [Google Scholar]
- Simon, A.; Pollen-Bankhead, N.; Mahacek, V.; Langendoen, E.J. Quantifying reductions of mass failure frequency and sediment loadings from streambanks using toe protection and other means: Lake Tahoe, United States. J. Am. Water Resour. Assoc. 2009, 45, 170–186. [Google Scholar] [CrossRef]
- Darby, S.E.; Rinaldi, M.; Dapporto, S. Coupling simulations of fluvial erosion and mass wasting for cohesive river banks. J. Geophys. Res. 2007, 112, 1–15. [Google Scholar] [CrossRef]
- Luppi, L.; Rinaldi, M.; Teruggi, L.B.; Darby, S.E.; Nardi, L. Monitoring and numerical model of river-bank erosion processes: A case study along the Cecina River (central Italy). Earth Surf. Process. Landf. 2008, 34, 530–546. [Google Scholar] [CrossRef]
- Samadi, A.; Davoudi, M.H.; Amiri-Tokaldany, E. Experimental Study of Cantilever Failure in the Upper Part of Cohesive Riverbanks. Res. J. Environ. Sci. 2011, 5, 444–460. [Google Scholar] [CrossRef]
- Samadi, A.; Amiri-Tokaldany, E.; Davoudi, M.H.; Darby, S.E. Experimental and numerical investigation of the stability of overhanging riverbanks. Geomorphology 2013, 184, 1–19. [Google Scholar] [CrossRef]
- Bo, N.I.; Wu, S.Q.; Tan, Y.F.; Xie, X.H.; Jun, Y.A.; Yan, Z.M.; Geng, Y.Q. Coupling effect of seepage flow and river flow on bank failure. J. Hydrodyn. 2011, 23, 834–840. [Google Scholar]
- Yong, G.L.; Robert, E.; Thomas, Y.O.; Simon, A.; Blair, P.; Greimann, K.W. Modeling of multilayer cohesive bank erosion with a coupled bank stability and mobile-bed mode. Geomorphology 2014, 243, 116–129. [Google Scholar]
- Yu, M.-H.; Wei, H.-Y.; Wu, S.-B. Experimental study on the bank erosion and interaction with near-bank bed evolution due to fluvial hydraulic force. Int. J. Sediment Res. 2015, 30, 81–89. [Google Scholar] [CrossRef]
- Patsinghasanee, S.; Kimura, I.; Shimizu, Y. Experimental and Numerical Study on Overhanging Failure Of River Bank. J. Jpn. Soc. Civ. Eng. Ser. B1 Hydraul. Eng. 2015, 71, 127–132. [Google Scholar] [CrossRef]
- Patsinghasanee, S.; Kimura, I.; Shimizu, Y.; Nabi, M. Cantilever failure investigations for cohesive riverbanks. In Proceedings of the Institution of Civil Engineers-Water Management; Thomas Telford Ltd.: London, UK, 2015; Volume 2, pp. 93–108. [Google Scholar]
- Kimiaghalam, N.; Goharrokhi, M.; Clark, S.P.; Ahmari, H. A comprehensive fluvial geomorphology study of riverbank erosion on the Red River in Winnipeg, Manitoba. Can. J. Hydrol. 2015, 529, 1488–1498. [Google Scholar] [CrossRef]
- Daly, E.R.; Miller, R.B.; Fox, G.A. Modeling streambank erosion and failure along protected and unprotected composite streambanks. Adv. Water Resour. 2015, 81, 114–127. [Google Scholar] [CrossRef]
- El Kadi Abderrezzak, K.; Die Moran, A.; Tassi, P.; Ata, R.; Hervouet, J.-M. Modelling river bank erosion using a 2D depth-averaged numerical model of flow and non-cohesive, non-uniform sediment transport. Adv. Water Resour. 2016, 93, 75–88. [Google Scholar] [CrossRef]
- Klavon, K.; Fox, G.; Guertault, L.; Langendoen, E.; Enlow, H.; Miller, R.; Khanal, A. Evaluating a process-based model for use in streambank stabilization: Insights on the Bank Stability and Toe Erosion Model (BSTEM). Earth Surf. Process. Landf. 2017, 42, 191–213. [Google Scholar] [CrossRef]
- Patsinghasanee, S.; Kimura, I.; Shimizu, Y.; Nabi, M.; Chub-Uppakarn, T. Coupled studies of fluvial erosion and cantilever failure for cohesive riverbanks: Case studies in the experimental flumes and U-Tapao River. J. Hydro-Environ. Res. 2017, 16, 13–26. [Google Scholar] [CrossRef]
- Jugie, M.; Gob, F.; Virmoux, C.; Brunstein, D.; Tamisier, V.; Le Coeur, C.; Grancher, D. Characterizing and quantifying the discontinuous bank erosion of a small low energy river using Structure-from-Motion Photogrammetry and erosion pins. J. Hydrol. 2018, 563, 418–434. [Google Scholar] [CrossRef]
- Patsinghasanee, S.; Kimura, I.; Shimizu, Y.; Nabi, M. Experiments and modelling of cantilever failures for cohesive riverbanks. J. Hydraul. Res. 2018, 56, 76–95. [Google Scholar] [CrossRef]
- Dutta, S.; Karmakar, T. Erosion Processes in Composite Riverbanks: Experiments and Modelling. Int. J. Res. Eng. Technol. 2015, 4, 85–92. [Google Scholar]
- Cancienne, R.M.; Fox, G.A.; Simon, A. Influence of seepage undercutting on the stability of root-reinforced streambanks. Earth Surf. Process. Landf. 2008, 33, 1769–1786. [Google Scholar] [CrossRef]
- Fox, G.A.; Wilson, G.V.; Periketi, R.K.; Cullum, R.F. Sediment transport model for seepage erosion of streambank sediment. J. Hydrol. Eng. 2006, 11, 603–611. [Google Scholar] [CrossRef]
- Fox, G.A.; Wilson, G.V.; Simon, A.; Langendoen, E.J.; Akay, O.; Fuchs, J.W. Measuring streambank erosion due to ground water seepage: Correlation to bank pore water pressure, precipitation and stream stage. Earth Surf. Process. Landf. 2007, 32, 1558–1573. [Google Scholar] [CrossRef]
- Chu-Agor, M.L.; Fox, G.A.; Cancienne, R.M.; Wilson, G.V. Seepage caused tension failures and erosion undercutting of hill slopes. J. Hydrol. 2008, 359, 247–259. [Google Scholar] [CrossRef]
- Chu-Agor, M.L.; Fox, G.A.; Wilson, G.V. Empirical sediment transport function predicting seepage erosion undercutting for cohesive bank failure prediction. J. Hydrol. 2009, 377, 155–164. [Google Scholar] [CrossRef]
- Chu-Agor, M.L.; Wilson, G.V.; Fox, G.A. Numerical modeling of bank instability by seepage erosion undercutting of layered streambanks. J. Hydrol. Eng. 2008, 13, 1133–1145. [Google Scholar] [CrossRef]
- Fox, G.A.; Heeren, D.M.; Wilson, G.V.; Langendoen, E.J.; Fox, A.K.; Chu-Agor, M.L. Numerically predicting seepage gradient forces and erosion: Sensitivity to soil hydraulic properties. J. Hydrol. 2010, 389, 354–362. [Google Scholar] [CrossRef]
- Masoodi, A.; Majdzadeh Tabatabai, M.; Noorzad, A.; Samadi, A. Effects of soil physico-chemical properties on stream bank erosion induced by seepage in northeastern. Iran Hydrol. Sci. J. 2017, 62, 2597–2613. [Google Scholar] [CrossRef]
- Masoodi, A.; Noorzad, A.; Majdzadeh Tabatabai, M.R.; Samadi, A. Application of short-range photogrammetry for monitoring seepage erosion of riverbank by laboratory experiments. J. Hydrol. 2018, 558, 380–391. [Google Scholar] [CrossRef]
- Briaud, J.L. Case histories in soil and rock erosion: Woodrow Wilson Bridge, Brazos River Meander, Normandy Cliffs, and New Orleans Levees. J. Geotech. Geoinviron. Eng. ASCE 2008, 134, 1424–1447. [Google Scholar] [CrossRef]
- GEO-SLOPE International Ltd. Seepage Modeling with SEEP/W. Available online: http://www.geo-slope.com (accessed on 9 December 2019).
- GEO-SLOPE International Ltd. Stability Modeling with SLOPE/W. Available online: http://www.geo-slope.com (accessed on 9 December 2019).
- Jepsen, R.; Roberts, J.; Lick, W. Effects of Bulk Density on Sediment Erosion Rates Water. Air Soil Pollut. 1997, 99, 21–31. [Google Scholar] [CrossRef]
- Roberts, J.; Jepsen, R.; Gotthard, D.; Lick, W. Effects of particle size and bulk density on erosion of quartz particles. J. Hydraul. Eng. ASCE 1998, 24, 1261–1267. [Google Scholar] [CrossRef]
- Lick, W.; McNeil, J. Effects of sediment bulk properties on erosion rates. Sci. Total Environ. 2001, 266, 41–48. [Google Scholar] [CrossRef]
- Couper, P. Effects of silt—clay content on the susceptibility of river banks to subaerial erosion. Geomorphology 2003, 56, 95–108. [Google Scholar] [CrossRef]
- Ahmad, M.F.; Dong, P.; Mamat, M.; Wan Nik, W.B.; Mohd, M.H. The Critical Shear Stresses for Sand and Mud Mixture. Appl. Math. Sci. 2011, 5, 53–71. [Google Scholar]
- Wang, Y.-C. Effects of Physical Properties and Rheological Characteristics on Critical Shear Stress of Fine Sediments. Ph.D. Thesis, Georgia Institute of Technology, Atlanta, GA, USA, 2013. [Google Scholar]
- Guo, Y.; Yang, Y.; Yu, X. Influence of particle shape on the erodibility of non-cohesive soil: Insights from coupled CFD–DEM simulations. Particuology 2018, 39, 12–24. [Google Scholar] [CrossRef]
- Briaud, J.L.; Ting, F.; Chen, H.C.; Gudavalli, R.; Perugu, S.; Wei, G. SRICOS: Prediction of scour rate in cohesive soils at bridge piers. J. Geotech. Geoenviron. Eng. ASCE 1999, 125, 237–246. [Google Scholar] [CrossRef]
- Briaud, J.L.; Ting, F.; Chen, H.C.; Cao, Y.; Han, S.W.; Kwak, K.W. Erosion function apparatus for scour rate predictions. J. Geotech. Geoenviron. Eng. ASCE 2001, 127, 105–113. [Google Scholar] [CrossRef]
- Briaud, J.L.; Chen, H.C.; Kwak, K.W.; Han, S.W.; Ting, F. Multifood and multilayer method for scour rate prediction at bridge piers. J. Geotech. Geoenviron. Eng. ASCE 2001, 127, 114–125. [Google Scholar] [CrossRef]
- Briaud, J.L.; Chen, H.C.; Li, Y.; Nurtjahyo, P.; Wang, J. SRICOS-EFA method for complex piers in fine-grained soils. J. Geotech. Geoenviron. Eng. ASCE 2004, 130, 1180–1191. [Google Scholar] [CrossRef]
- Duong, T.T. Assessment of Riverbank Stability—The Perspectives of Unsaturated Soils and Erosion Function. Ph.D. Thesis, Ibaraki University, Mito, Japan, 2014. [Google Scholar]
- Julien, P.Y. River Mechanics; Cambridge University Press: New York, NY, USA, 2002. [Google Scholar]
- Chow, V.T. Open-Channel Hydraulic; McGraw-Hill: New York, NY, USA, 1959. [Google Scholar]
- Hickin, E.J. River Hydraulics and Channel Form; Wiley: Chichester, UK, 2004. [Google Scholar]
- Goharrokhi, M. Effect of Hydraulic Shear Stress on the Banks of the Red River. Master’s Thesis, The University of Manitoba, Winnipeg, MB, Canada, 2015. [Google Scholar]
- Thomas, J.M. Erodibility Testing of Cohesion Soil. Master’s Thesis, Auburn University, Auburn, Alabama, 2009. [Google Scholar]


| Riverbank Properties | Unit | Descriptions |
|---|---|---|
| Bank surface elevation (H) | (m) | 10 |
| Bank slope | (°) | 81 |
| Soil layer and elevation of surface soil layer | (m) | Layer 1: from 10 m to (−1) m soil bank Layer 2: from (−1) m down bed sand |
| Initial elevation of RWL | (m) | 0 |
| Initial pore pressure (Maximum negative head) | (m) | 7 m |
| Rate of water level change | (m/d) | 1 |
| River slope | (m/m) | 0.0001 |
| Soil Properties | Silt I-01 (NT 03) | Silt I-03 (HB21) | Silt II-03 (XC) | |
|---|---|---|---|---|
| Sand | 0.25–0.075 mm | 5 | 15 | 35 |
| Silt | 0.075–0.005 mm | 70 | 70 | 55 |
| Clay | <0.005 mm | 25 | 15 | 10 |
| Saturated volumetric water content (%) | 30 | 42 | 45 | |
| Air-entry value (kPa) | 27 | 20 | 10 | |
| Hydraulic conductivity (m/s) | 4.32 × 10⁻⁷ | 7.39 × 10⁻⁷ | 2.24 × 10⁻⁶ | |
| Cohesion force (kPa) | 7.5 | 5.0 | 5.0 | |
| Internal friction angle (°) | 32 | 32 | 30 | |
| Critical erosion shear stresses. (kPa) | 1.5 | 1.1 | 1.0 | |
© 2019 by the authors. Licensee MDPI, Basel, Switzerland. This article is an open access article distributed under the terms and conditions of the Creative Commons Attribution (CC BY) license (http://creativecommons.org/licenses/by/4.0/).
Share and Cite
Duong Thi, T.; Do Minh, D. Riverbank Stability Assessment under River Water Level Changes and Hydraulic Erosion. Water 2019, 11, 2598. https://doi.org/10.3390/w11122598
Duong Thi T, Do Minh D. Riverbank Stability Assessment under River Water Level Changes and Hydraulic Erosion. Water. 2019; 11(12):2598. https://doi.org/10.3390/w11122598
Chicago/Turabian StyleDuong Thi, Toan, and Duc Do Minh. 2019. "Riverbank Stability Assessment under River Water Level Changes and Hydraulic Erosion" Water 11, no. 12: 2598. https://doi.org/10.3390/w11122598
APA StyleDuong Thi, T., & Do Minh, D. (2019). Riverbank Stability Assessment under River Water Level Changes and Hydraulic Erosion. Water, 11(12), 2598. https://doi.org/10.3390/w11122598