Effects of Thermal Discharge from Coastal Nuclear Power Plants and Thermal Power Plants on the Thermocline Characteristics in Sea Areas with Different Tidal Dynamics


Abstract
1. Introduction
2. Materials and Methods
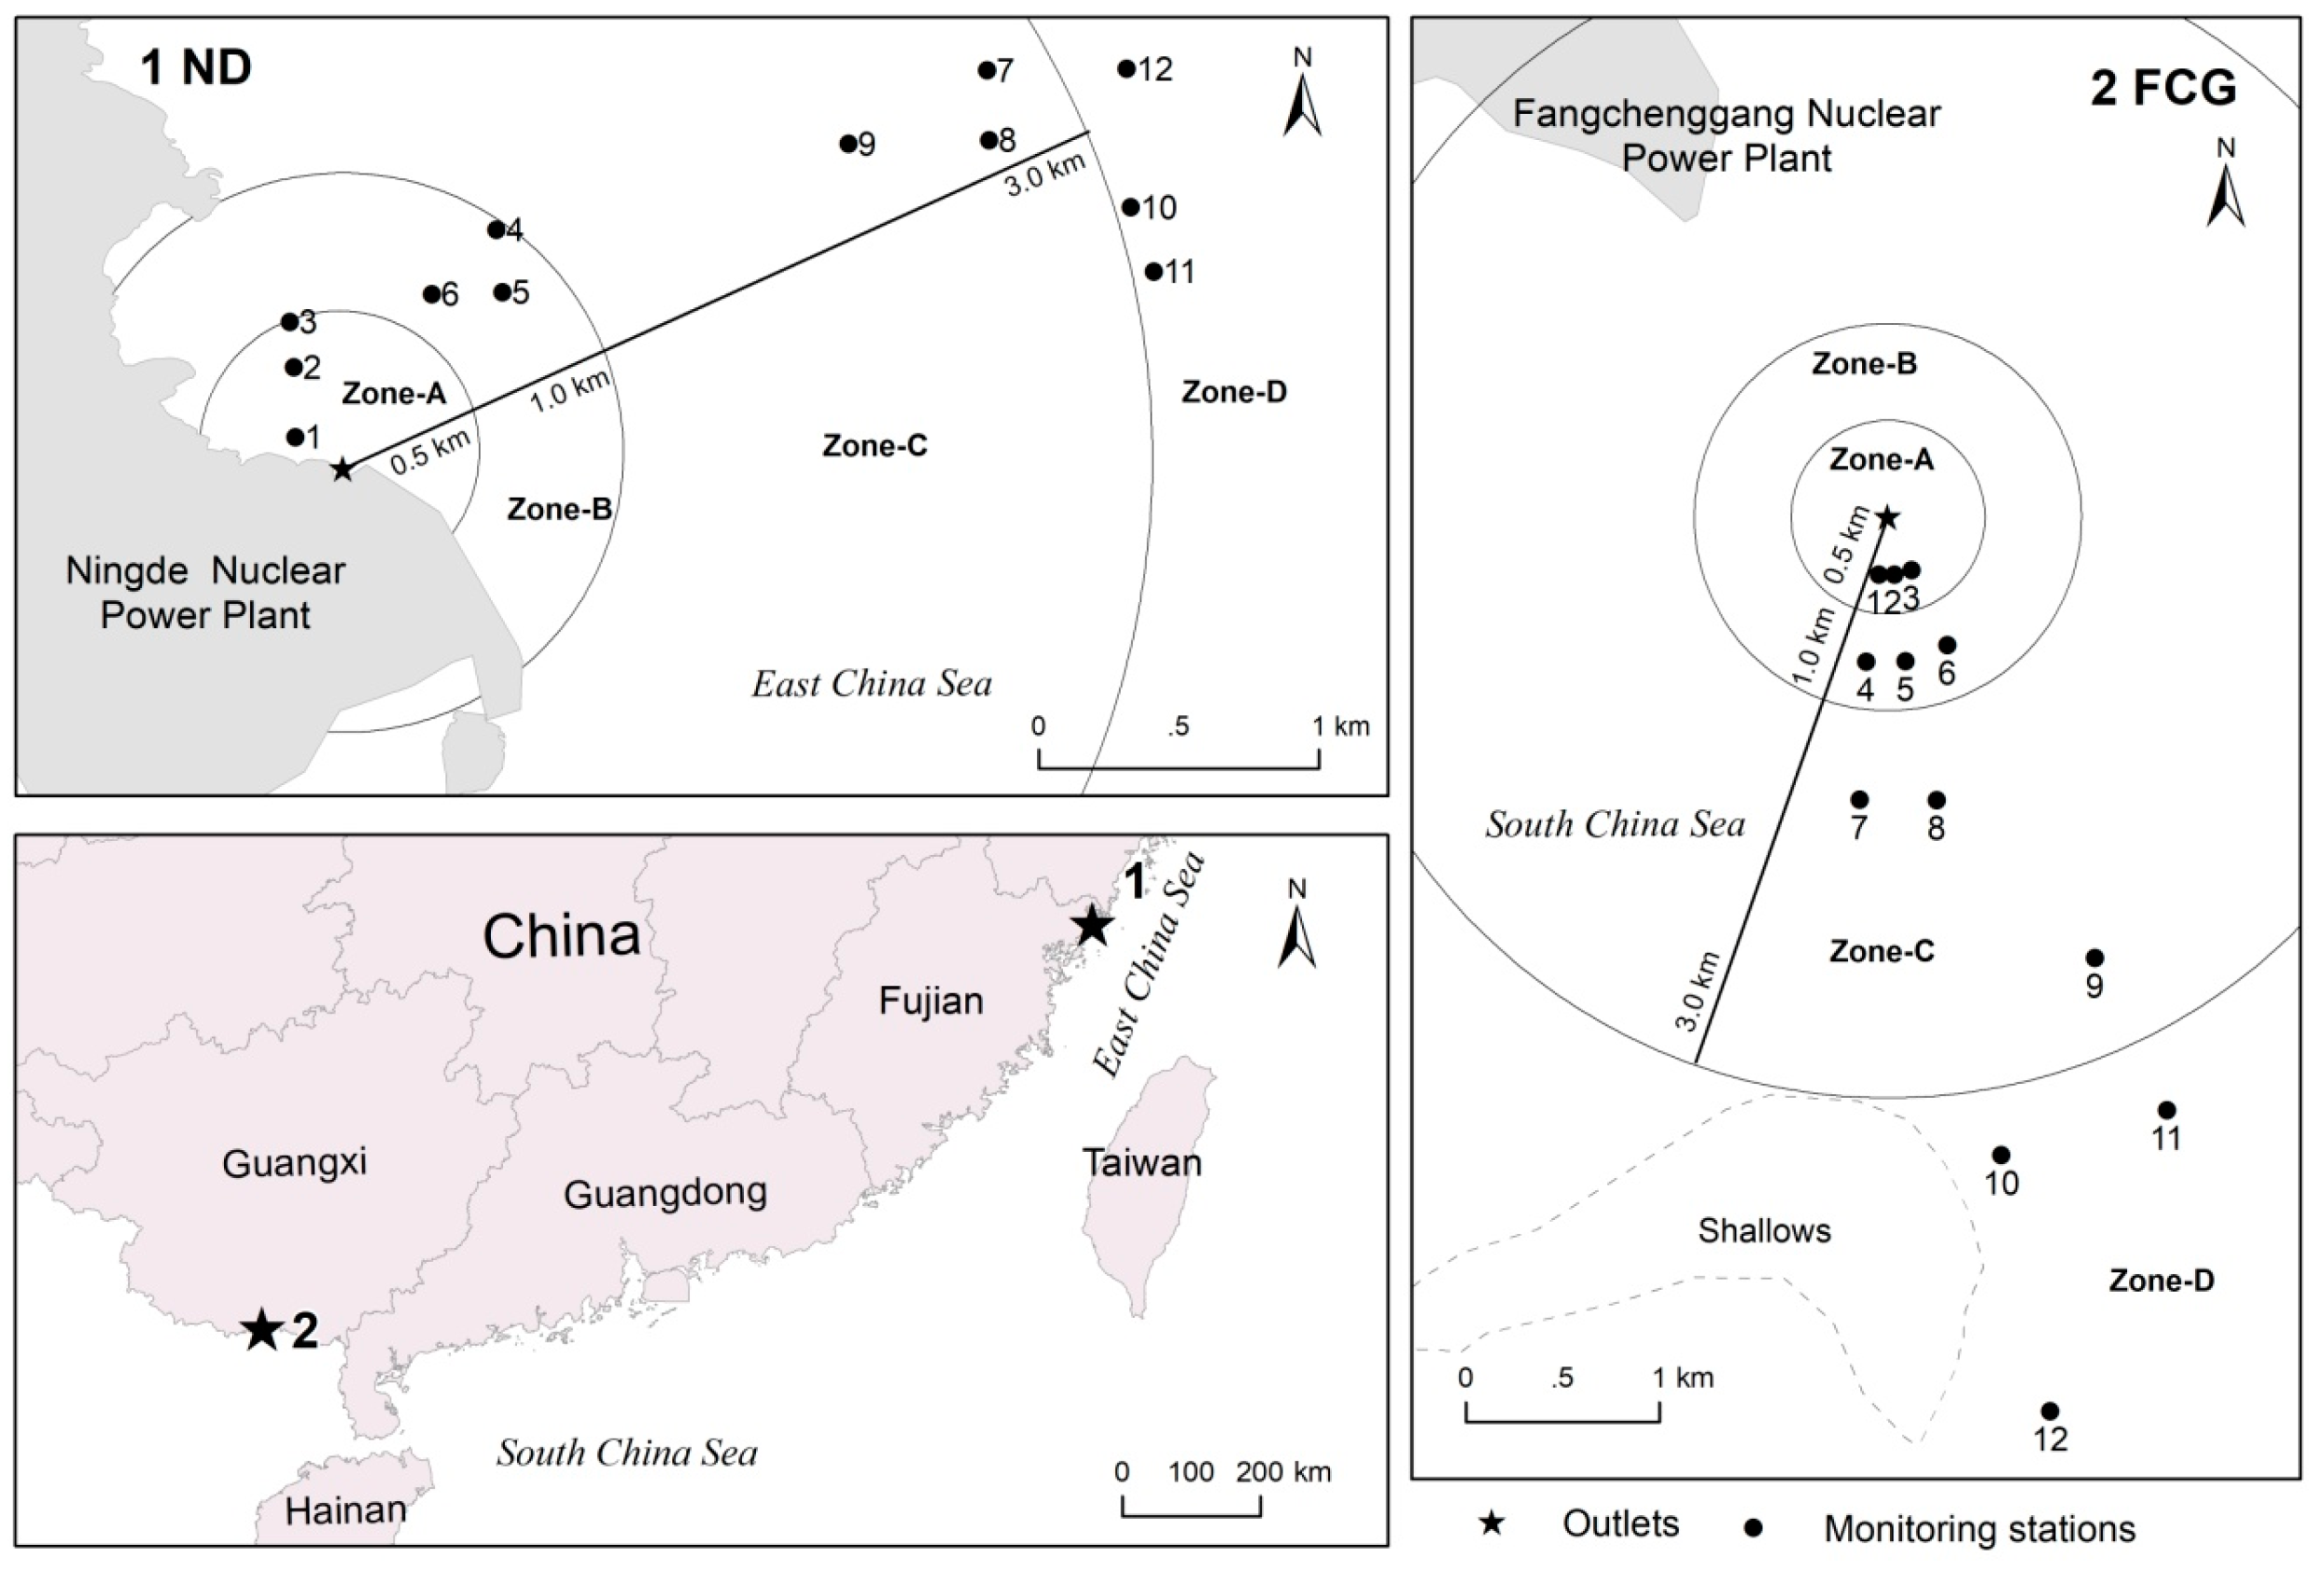
2.1. Study Area and Sites
2.2. Sampling Methods
2.3. Data Analysis
3. Results
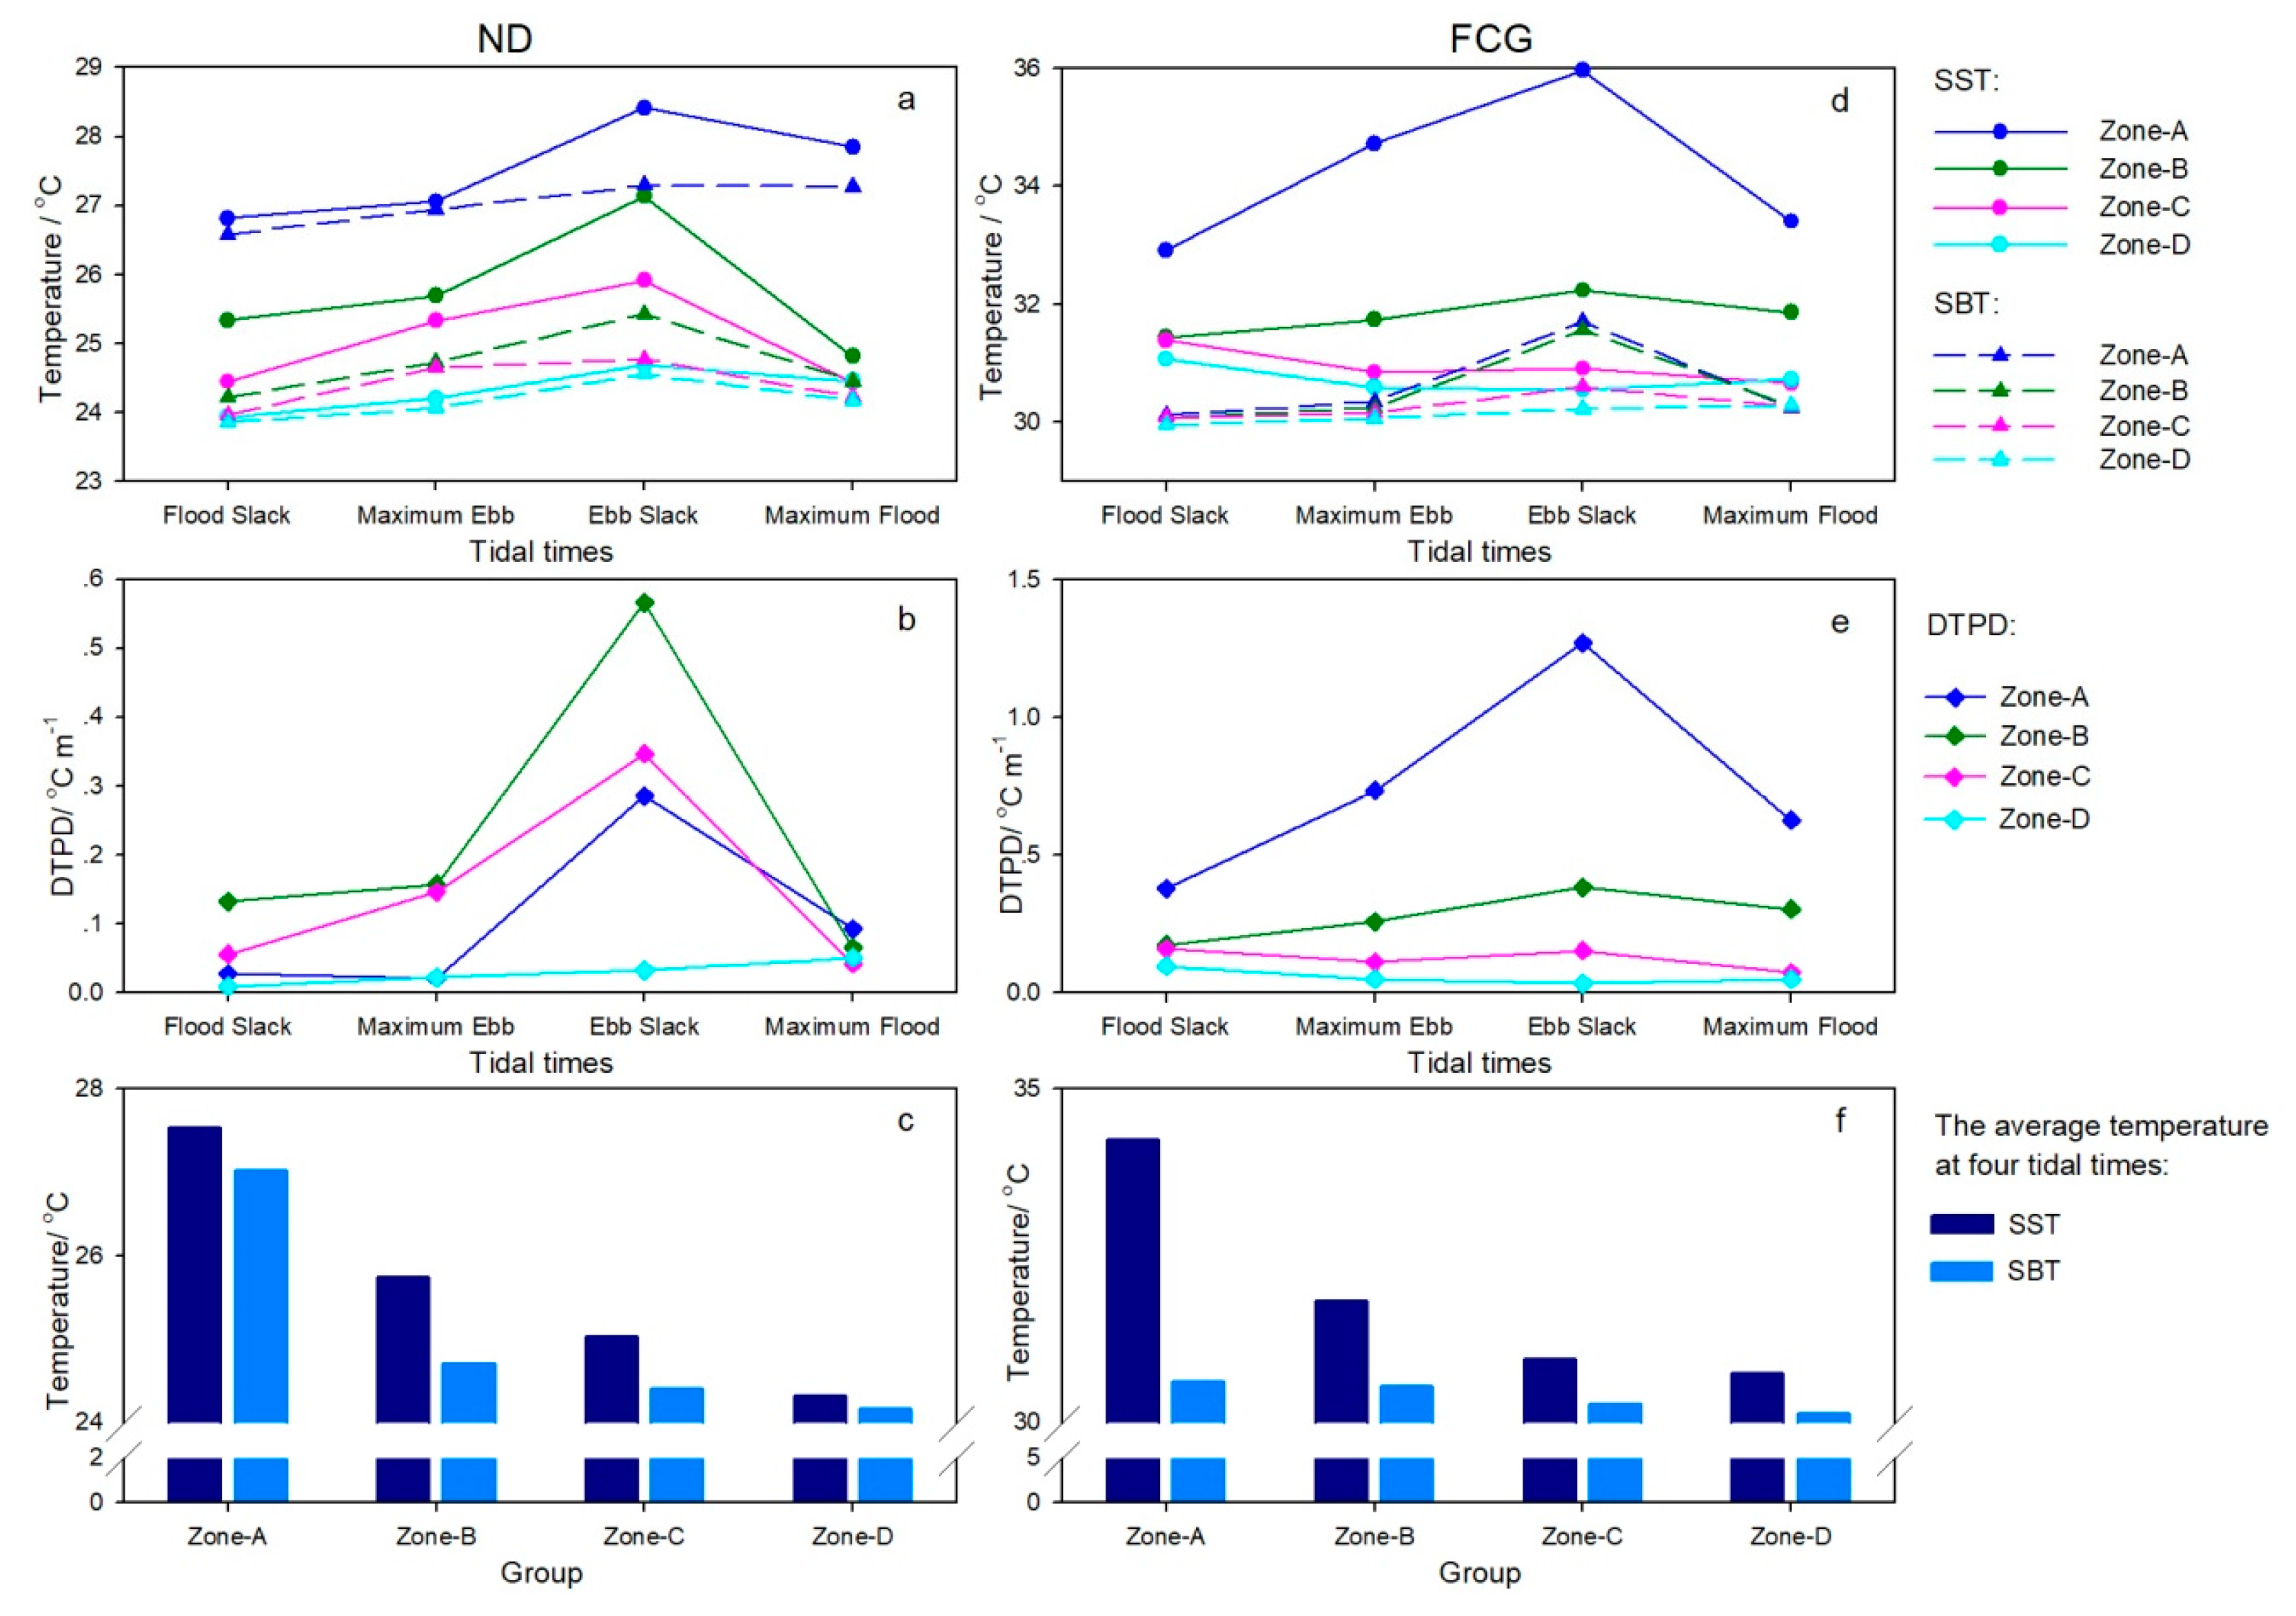
3.1. Differences between the SST and SBT
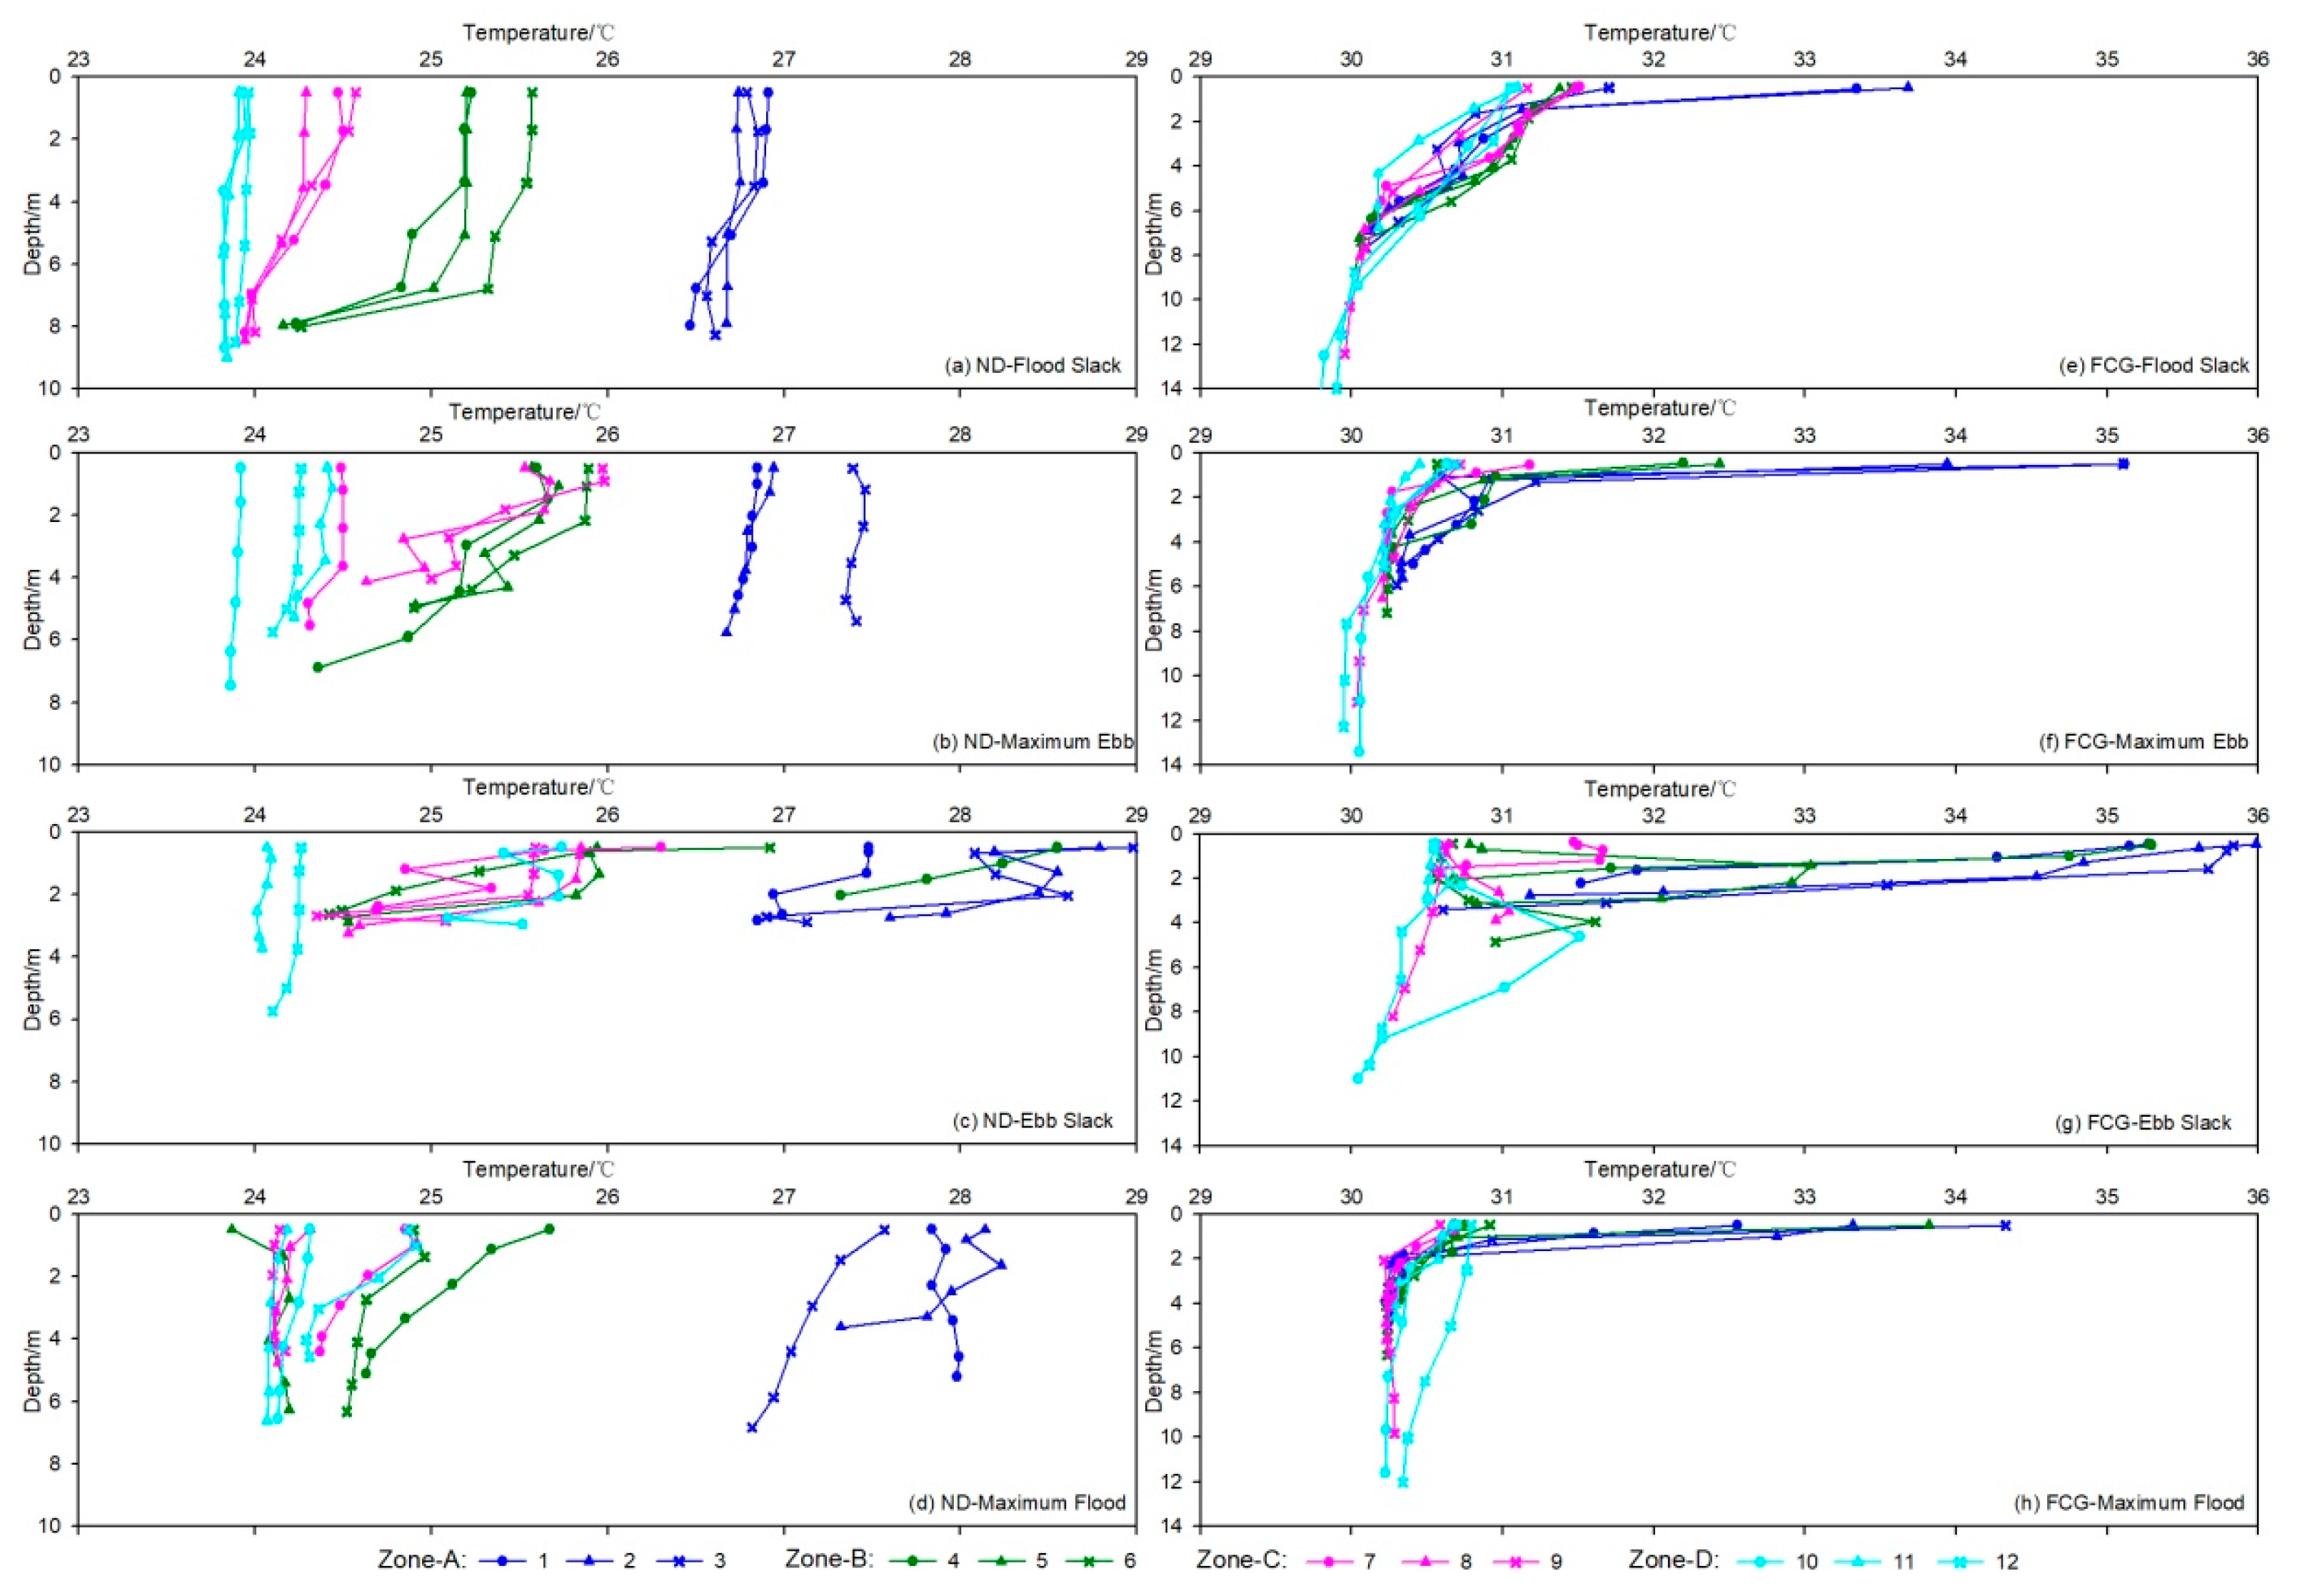
3.2. Where Stratification Occurred
4. Discussion
4.1. Comparison between the SSTs and SBTs in Sea Areas with Different Tidal Dynamics
4.2. Comparisons between the Positions and Extents of the Thermoclines in Sea Areas with Different Tidal Dynamics
- (1)
- The depth of the thermocline gradually moved upward with increasing distance from the outlet. In the ND, no stratification phenomenon appeared at flood slack or maximum flood within 0.5 km from the outlet. Moreover, although there was no stratification phenomenon at ebb slack and maximum ebb within 0.5 km from the outlet, the extent of stratification was not as significant as that within 0.5 km to 3.0 km from the outlet. Except during ebb slack, the depth of the thermocline increased with the distance from the outlet, which contrasts with the result in the ND. The ND is located in the East China Sea and it has strong tidal dynamics that result in uniform vertical mixing. Therefore, the SSTs and the SBTs near the outlet both significantly increased, which is why there was no stratification or there was only weak stratification near the outlet in the ND. This result is consistent with both the study by Zhang [25] in Longkou at the junction of the Bohai Sea and the Yellow Sea and the study by Zhang [25] in Luoyuan Bay in the East China Sea. In contrast, the FCG is located in the South China Sea, where the tidal dynamics are weak and vertical mixing is poor; thus, it takes warm water a longer time to undergo downward mixing. Therefore, the thermocline appeared at deeper water depths as the distance from the outlet increased, which is consistent with the study of Zhou [34] in Daya Bay in the South China Sea. The extent of stratification in the FCG was larger than that in the ND because of the poor downward mixing ability of warm water in the FCG; additionally, the average temperature difference was 5.44 °C m−1 and the maximum temperature difference was 7.47 °C m−1 at water depths ranging from 0.5 m to 1/5 h.
- (2)
- From the comparison among the four tidal times, the average temperature of the seawater affected by the thermal discharge was the lowest at flood slack and highest at ebb slack. The water level is lowest at ebb slack and the dilution effect on the thermal discharge is weaker; therefore, the average seawater temperature was the highest at ebb slack. The water level is highest at flood slack and the dilution effect on the thermal discharge is greater; therefore, the average seawater temperature was lowest at flood slack. In the ND, the thermocline mostly appeared in the upper seawater layers during flood tide and in the lower water layers during ebb tide, while, in the FCG, the thermocline mostly appeared in the upper seawater layers, except during ebb slack. The depth of the thermocline gradually moved upward from flood slack → maximum ebb → ebb slack; in contrast, the depth of the thermocline gradually moved downward from ebb slack to maximum flood, which contrasts with the patterns found in the FCG. This difference is mainly due to the strong tidal dynamics and strong vertical mixing in the ND. The water depth was greater at flood slack, and most of the water column could be fully mixed with the warm water; only the bottom water did not mix evenly, so the thermocline appeared in the lower layer. At ebb tide, the water depth gradually decreased, which was conducive to the diffusion of warm water downward from the surface. Therefore, the thermocline appeared throughout the whole water column, and the thermocline gradually moved upward. At flood tide, the water depth gradually increased and it was not conducive to the diffusion of warm water from the surface; thus, the thermocline moved downward because of the downward diffusion of warm water. In the FCG, the tidal dynamics are weak, and the diffusion of thermal discharge is weak in the vertical direction. At the same time, the FCG is located in the South China Sea, where a weak stratification phenomenon appears in summer, which confines the warm thermal plume within the upper few meters of water. The discharge of warm water further increases the surface water temperature, which enhances stratification [37]. Therefore, the warm water usually diffused in the surface layer, and the most serious stratification occurred at depths of 0.5 m−1/5 h, except at ebb slack. The thermal plume can only reach the bottom at ebb slack, when the depth is relatively shallow and the conditions are most conducive to vertical diffusion. Generally, the thermocline caused by thermal discharge is distributed at water depths shallower than 7 m, which is consistent with the results of Wang et al. [36], Cui [23], Zhang et al. [21], and Han [39], who studied CNATPP in China, and Suh et al. [35], who studied CNATPP in Korea.
5. Conclusions
Author Contributions
Funding
Conflicts of Interest
References
- Briand, F.J.P. Effects of power-plant cooling systems on marine phytoplankton. Mar. Biol. 1975, 33, 135–146. [Google Scholar]
- Brook, A.J.; Baker, A.L. Chlorination at power plants: Impact on phytoplankton productivity. Science 1972, 176, 1414–1415. [Google Scholar] [CrossRef] [PubMed]
- Li, X.Y.; Li, B.; Sun, X.L. Effects of a coastal power plant thermal discharge on phytoplankton community structure in Zhanjiang Bay, China. Mar. Pollut. Bull. 2014, 81, 210–217. [Google Scholar] [CrossRef] [PubMed]
- Jiang, Z.B.; Liao, Y.B.; Liu, J.J.; Shou, L.; Chen, Q.Z.; Yan, X.J.; Zhu, F.H.; Zeng, J.N. Effects of fish farming on phytoplankton community under the thermal stress caused by a power plant in a eutrophic, semi-enclosed bay: Induce toxic dinoflagellate (Prorocentrum minimum) blooms in cold seasons. Mar. Pollut. Bull. 2013, 76, 315–324. [Google Scholar]
- Chew, L.L.; Chong, V.C.; Wong, R.C.; Lehette, P.; Ng, C.C.; Loh, K.H. Three decades of sea water abstraction by Kapar power plant (Malaysia): What impacts on tropical zooplankton community? Mar. Pollut. Bull. 2015, 101, 69–84. [Google Scholar]
- Li, G.G.; Shi, H.W.; Xu, Z.H. Path analysis of thermal discharge near power plant on estuarine copepods community structure in Xiangshan bay in summer. Mar. Environ. Sci. 2017, 36, 706–711. [Google Scholar]
- Vandysh, O.I. The effect of thermal flow of large power facilities on zooplankton community under subarctic conditions. Water Resour. 2009, 36, 310–318. [Google Scholar] [CrossRef]
- Worthington, T.A.; Shaw, P.J.; Daffern, J.R.; Langford, T.E.L. The effects of a thermal discharge on the macroinvertebrate community of a large British river: Implications for climate change. Hydrobiologia 2015, 753, 81–95. [Google Scholar] [CrossRef]
- Durance, I.; Ormerod, S.J. Climate change effects on upland stream macroinvertebrates over a 25-year period. Glob. Chang. Biol. 2007, 13, 942–957. [Google Scholar] [CrossRef]
- Jiang, Z.P. The Distribution Pattern of Fish in the Sea Area of Thermal Discharge of Qinshan Nuclear Plan. Ph.D. Thesis, Shanghai Ocean University, Shanghai, China, 2016. [Google Scholar]
- Teixeira, T.P.; Neves, L.M.; Araújo, F.G. Effects of a nuclear power plant thermal discharge on habitat complexity and fish community structure in Ilha Grande Bay, Brazil. Mar. Environ. Res. 2009, 68, 188–195. [Google Scholar]
- Reutter, J.M.; Herdendorf, C.E. Thermal discharge from a nuclear power plant: Predicted effects on Lake Erie fish. Ohio J. Sci. 1976, 76, 39–45. [Google Scholar]
- Wei, X.Y.; Wang, Y.C.; Zhang, Q.; Dang, Y.Q.; Xiong, X.W.; Shang, Z.R. Review of the impact assessment of thermal discharges from power plants on aquatic biota. J. Hydroecol. 2018, 39, 1–10. [Google Scholar]
- Shiers, P.F.; Marks, D.H. Thermal Pollution Abatement Evaluation Model for Power Plant Siting; MIT Energy Lab.: Boston, MA, USA, 1973. [Google Scholar]
- Zhang, A.L.; Wang, S.W.; Zhao, Y.J.; Yuan, J. Analysis of Key Issues in Environmental Impact Assessment of Thermal Discharge from Coastal Nuclear Power Plant. Environ. Impact Assess. 2015, 37, 57–60. [Google Scholar]
- Zeng, J.N. Ecological Effect by Thermal Discharged Water from Subtropical Coastal Power Plants. Ph.D. Thesis, Zhejiang University, Hangzhou, China, 2008. [Google Scholar]
- Poornima, E.H.; Rajadurai, M.; Rao, T.S.; Anupkumarb, B.; Rajamohanb, R.; Narasimhanb, S.V.; Raoa, V.N.R.; Venugopalanb, V.P. Impact of thermal discharge from a tropical coastal power plant on phytoplankton. J. Therm. Biol. 2005, 30, 307–316. [Google Scholar] [CrossRef]
- Han, X. Prelimimary Study on Damage Assessment and Ecological Compensation of Coastal Power Plant Thermal Discharge Pollution. Ph.D. Thesis, East China Normal University, Shanghai, China, 2012. [Google Scholar]
- Yin, J.P.; Wang, Y.S.; Xu, J.R.; Sun, C.C.; Zhang, F.Q. Seasonal thermocline in the Daya Bay and its influence on the environmental factors of seawater. Mar. Sci. Bull. 2006, 25, 1–8. [Google Scholar]
- Lin, J.; Zou, X.Q.; Huang, F.M. Effects of the thermal discharge from an offshore power plant on plankton and macrobenthic communities in subtropical China. Mar. Pollut. Bull. 2018, 131, 106–114. [Google Scholar] [CrossRef]
- Zhang, Z.J.; Li, Y.Q.; Hao, R.X.; Han, L.J. Application of ECOMSED model in calculation of power plant thermal discharge of tidal water. Water Resour. Power 2015, 33, 55–61. [Google Scholar]
- Wu, Y.F.; Zhu, J.R. Numerical simulation of transport and diffusion of thermal discharge water from the power plants in the Changjiang estuary. J. East China Norm. Univ. 2017, 2, 127–137. [Google Scholar]
- Cui, D. 3D Numerical Simulation on Thermal Discharge of Coastal Thermal Power Plant; Yangtze River Scientific Research Institute: Wuhan, China, 2008. [Google Scholar]
- Zhu, Z.C. Numerical Simulation of Three-Dimensional Seawater Temperature Field in Meizhou Bay Based on Fvcom and Controlled Analysis with Observational Material; First Institute of Oceanography, State Oceanic Administration: Qingdao, China, 2014. [Google Scholar]
- Zhang, W.J. Three-Dimensional Numerical Simulation of Cooling Water in Longkou Northern Waters; First Institute of Oceanography, State Oceanic Administration: Qingdao, China, 2015. [Google Scholar]
- Raithby, G.D.; Elliott, R.V.; Hutchinson, B.R. Prediction of three-dimensional thermal discharge flows. J. Hydraul. Eng. 1988, 114, 720–737. [Google Scholar] [CrossRef]
- Salgueiro, D.V.; de Pablo, H.; Neves, R.; Mateus, M. Modelling the thermal effluent of a near coast power plant (Sines, Portugal). Rev. Gest. Costeira Integr. 2015, 15, 533–544. [Google Scholar] [CrossRef]
- Råman, V.L.; Wuest, A.; Bouffard, D. Physical effects of thermal pollution in lakes. Water Resour. Res. 2017, 53, 3968–3987. [Google Scholar] [CrossRef]
- Kirillin, G.; Shatwell, T.; Kasprzak, P. Consequences of thermal pollution from a nuclear plant on lake temperature and mixing regime. J. Hydrol. 2013, 496, 47–56. [Google Scholar] [CrossRef]
- Roenunich, D.; MdGowan, J. Climate warming and the decline of zooplankton in the Califomia Current. Science 1995, 267, 1324–1326. [Google Scholar]
- Zhao, L.L.; Zhu, G.W.; Chen, Y.F.; Li, W.; Zhu, M.Y.; Yao, X.; Cai, L.L. Thermal stratification and its influence factors in a large-sized and shallow Lake Taihu. Adv. Water Sci. 2011, 22, 844–850. [Google Scholar]
- Rao, R.R.; Sivakumar, R. Seasonal variability of near-surface isothermal layer and thermocline characteristics of the Tropical Indian Ocean. Meteorol. Atmos. Phys. 1996, 61, 201–212. [Google Scholar] [CrossRef]
- Feng, S.Z.; Li, F.Q.; Li, S.Q. Introduction to Ocean Science; Higher Education Press: Beijing, China, 2015; pp. 484–486. [Google Scholar]
- Zhou, Q.J. Study on Thermal Pollution in Daya Bay. Ph.D. Thesis, East China Normal University, Shanghai, China, 2007. [Google Scholar]
- Suh, S.W. A hybrid near-field/far-field thermal discharge model for coastal areas. Mar. Pollut. Bull. 2001, 43, 225–233. [Google Scholar] [CrossRef]
- Wang, X.; Zhang, A.J.; Geng, X.; Zheng, L.; Liu, S.H. Study of impact of the discharged cooling water from Huangdao coastal power plant on the thermohaline distribution. Mar. Sci. Bull. 2013, 32, 389–394. [Google Scholar]
- Tang, D.L.; Kester, D.R.; Wang, Z.D.; Lian, J.S.; Kawamura, H. AVHRR satellite remote sensing and shipboard measurements of the thermal plume from the Daya Bay, nuclear power station, China. Remote Sens. Environ. 2003, 84, 506–515. [Google Scholar] [CrossRef]
- Tang, S.M.; Yan, Y.; Chen, B. Impacts of thermal effluent on the phytoplankton community structures nearby Dayawan Nuclear Power Station in spring and summer. J. Appl. Oceanogr. 2013, 32, 373–382. [Google Scholar]
- Han, L.J. Three-Dimensional Numerical Simulation on Thermal Discharge of Coastal Power Plant. Ph.D. Thesis, Taiyuan University of Technology, Taiyuan, China, 2014. [Google Scholar]


| Period | Zone | Station No. | Temperature Differences Per Unit Depth in the ND (°C m−1) | Temperature Differences Per Unit Depth in the FCG (°C m−1) | ||||||||
|---|---|---|---|---|---|---|---|---|---|---|---|---|
| 0.5 m−1/5 h | 1/5 h−2/5 h | 2/5 h−3/5 h | 3/5 h−4/5 h | 4/5 h−0.5 m up | 0.5 m−1/5 h | 1/5 h−2/5 h | 2/5 h−3/5 h | 3/5 h−4/5 h | 4/5 h−0.5 m up | |||
| Flood Slack | Zone-A | 1 | 0.01 | 0.01 | 0.11 | 0.12 | 0.03 | 2.311 | 0.26 | 0.14 | 0.26 | 0.18 |
| 2 | 0.01 | −0.01 | 0.04 | 0.00 | 0.01 | 2.63 | 0.28 | −0.02 | 0.33 | 0.13 | ||
| 3 | −0.05 | 0.01 | 0.14 | 0.02 | −0.04 | 0.77 | 0.16 | −0.04 | 0.20 | 0.19 | ||
| Zone-B | 4 | 0.03 | 0.00 | 0.18 | 0.04 | 0.51 | 0.31 | 0.10 | 0.10 | 0.38 | 0.31 | |
| 5 | 0.00 | 0.00 | 0.01 | 0.11 | 0.71 | 0.18 | 0.09 | 0.14 | 0.43 | 0.10 | ||
| 6 | 0.00 | 0.02 | 0.11 | 0.02 | 0.88 | 0.20 | 0.06 | 0.21 | 0.33 | 0.03 | ||
| Zone-C | 7 | −0.02 | 0.06 | 0.10 | 0.14 | 0.03 | 0.24 | −0.04 | 0.17 | 0.54 | 0.05 | |
| 8 | 0.01 | 0.01 | 0.07 | 0.10 | 0.03 | 0.28 | 0.11 | 0.31 | 0.21 | 0.03 | ||
| 9 | 0.03 | 0.12 | 0.10 | 0.10 | −0.02 | 0.21 | 0.17 | 0.07 | 0.04 | 0.02 | ||
| Zone-D | 10 | −0.01 | 0.07 | −0.01 | 0.00 | 0.00 | 0.11 | 0.10 | 0.13 | 0.07 | 0.01 | |
| 11 | 0.01 | 0.03 | 0.02 | −0.01 | −0.01 | 0.31 | 0.26 | 0.18 | 0.00 | 0.00 | ||
| 12 | −0.01 | 0.01 | 0.01 | 0.02 | 0.02 | 0.05 | 0.17 | 0.14 | 0.03 | 0.01 | ||
| Ebb Maximum | Zone-A | 1 | 0.00 | 0.03 | 0.00 | 0.05 | 0.06 | 7.47 | −0.20 | 0.11 | 0.19 | 0.13 |
| 2 | 0.03 | 0.10 | 0.01 | 0.05 | 0.07 | 4.01 | 0.08 | 0.34 | 0.04 | −0.02 | ||
| 3 | −0.10 | 0.01 | 0.06 | 0.03 | −0.09 | 4.84 | 0.30 | 0.21 | 0.19 | 0.03 | ||
| Zone-B | 4 | −0.06 | 0.31 | 0.03 | 0.20 | 0.52 | 2.17 | 0.07 | 0.08 | 0.49 | 0.02 | |
| 5 | −0.26 | 0.10 | 0.29 | −0.12 | 0.90 | 2.21 | 0.40 | 0.10 | 0.02 | 0.00 | ||
| 6 | 0.02 | 0.01 | 0.36 | 0.22 | 0.55 | 0.05 | 0.09 | 0.07 | 0.02 | 0.00 | ||
| Zone-C | 7 | −0.01 | 0.00 | 0.00 | 0.17 | −0.01 | 0.96 | 0.63 | 0.03 | 0.01 | 0.00 | |
| 8 | −0.33 | 0.03 | 0.86 | −0.13 | 0.77 | 0.10 | 0.21 | 0.04 | 0.00 | 0.01 | ||
| 9 | −0.02 | 0.62 | 0.35 | −0.04 | 0.34 | 0.17 | 0.05 | 0.09 | 0.01 | 0.01 | ||
| Zone-D | 10 | 0.00 | 0.01 | 0.01 | 0.02 | 0.00 | 0.15 | 0.06 | 0.02 | 0.00 | 0.00 | |
| 11 | −0.05 | 0.06 | −0.03 | 0.14 | 0.03 | 0.17 | 0.09 | 0.04 | 0.01 | 0.01 | ||
| 12 | 0.01 | 0.00 | 0.01 | 0.05 | 0.11 | 0.19 | 0.03 | 0.10 | 0.00 | 0.00 | ||
| Ebb Slack | Zone-A | 1 | 0.00 | 0.02 | 0.80 | −0.08 | 0.85 | 0.29 | 1.47 | 0.68 | 2.53 | 3.50 |
| 2 | 4.00 | −0.55 | 0.17 | 0.80 | 2.13 | 2.02 | 1.16 | 0.50 | 3.59 | 5.74 | ||
| 3 | 5.06 | −0.18 | −0.60 | 2.52 | −1.29 | 0.17 | 0.15 | 2.93 | 2.36 | 3.41 | ||
| Zone-B | 4 | 0.00 | 0.61 | 0.85 | 0.96 | 0.00 | −0.20 | 0.72 | 2.34 | 6.25 | 1.80 | |
| 5 | 0.22 | −0.07 | 0.19 | 1.92 | −0.06 | −0.56 | −0.59 | −2.25 | 1.00 | 0.68 | ||
| 6 | 8.13 | 0.97 | 0.75 | 0.49 | 0.55 | 0.05 | 0.10 | 0.00 | −0.73 | −0.53 | ||
| Zone-C | 7 | 6.60 | 1.32 | −0.82 | 1.07 | 0.10 | −0.19 | −0.69 | 0.04 | 3.57 | 1.63 | |
| 8 | 0.04 | 0.03 | 0.28 | 1.36 | 0.24 | 0.09 | −0.13 | −0.26 | −0.08 | 0.23 | ||
| 9 | 0.06 | 0.00 | 0.04 | 1.79 | −4.24 | −0.02 | 0.05 | 0.03 | 0.06 | 0.05 | ||
| Zone-D | 10 | 1.74 | −0.45 | 0.00 | 0.91 | −2.26 | −0.09 | −0.34 | 0.22 | 0.36 | 0.09 | |
| 11 | −0.06 | 0.19 | 0.07 | −0.01 | −0.06 | 0.02 | 0.03 | 0.02 | 0.01 | 0.01 | ||
| 12 | 0.01 | 0.00 | 0.01 | 0.05 | 0.11 | −0.06 | 0.15 | 0.00 | 0.06 | 0.05 | ||
| Flood Maximum | Zone-A | 1 | −0.12 | 0.07 | −0.11 | −0.03 | 0.02 | 2.39 | 1.37 | 0.01 | 0.05 | 0.19 |
| 2 | 0.34 | −0.24 | 0.34 | 0.17 | 1.51 | 1.01 | 2.59 | 0.01 | 0.01 | 0.03 | ||
| 3 | 0.26 | 0.11 | 0.08 | 0.07 | 0.12 | 5.34 | 0.62 | 0.01 | 0.00 | 0.00 | ||
| Zone-B | 4 | 0.53 | 0.19 | 0.24 | 0.17 | 0.05 | 0.28 | 0.30 | −0.06 | 0.19 | 0.13 | |
| 5 | −0.34 | −0.02 | 0.08 | −0.07 | −0.02 | 5.55 | 0.25 | 0.19 | 0.00 | 0.00 | ||
| 6 | −0.07 | 0.24 | 0.04 | 0.02 | 0.03 | 0.38 | 0.12 | 0.14 | −0.01 | 0.00 | ||
| Zone-C | 7 | −0.12 | 0.28 | 0.16 | 0.10 | 0.19 | 0.03 | 0.33 | 0.14 | 0.01 | −0.08 | |
| 8 | 0.19 | 0.19 | 0.06 | 0.00 | −0.02 | 0.15 | 0.22 | 0.06 | 0.00 | 0.00 | ||
| 9 | 0.06 | 0.01 | −0.01 | 0.00 | −0.13 | 0.15 | 0.07 | −0.02 | −0.01 | 0.00 | ||
| Zone-D | 10 | 0.01 | 0.04 | 0.06 | 0.01 | 0.01 | 0.17 | 0.02 | 0.04 | 0.00 | 0.00 | |
| 11 | 0.05 | 0.03 | 0.01 | 0.00 | 0.01 | 0.14 | 0.03 | 0.25 | 0.02 | 0.01 | ||
| 12 | −0.08 | 0.21 | 0.34 | 0.07 | −0.04 | 0.01 | 0.04 | 0.07 | 0.05 | 0.02 | ||
© 2019 by the authors. Licensee MDPI, Basel, Switzerland. This article is an open access article distributed under the terms and conditions of the Creative Commons Attribution (CC BY) license (http://creativecommons.org/licenses/by/4.0/).
Share and Cite
Huang, F.; Lin, J.; Zheng, B. Effects of Thermal Discharge from Coastal Nuclear Power Plants and Thermal Power Plants on the Thermocline Characteristics in Sea Areas with Different Tidal Dynamics. Water 2019, 11, 2577. https://doi.org/10.3390/w11122577
Huang F, Lin J, Zheng B. Effects of Thermal Discharge from Coastal Nuclear Power Plants and Thermal Power Plants on the Thermocline Characteristics in Sea Areas with Different Tidal Dynamics. Water. 2019; 11(12):2577. https://doi.org/10.3390/w11122577
Chicago/Turabian StyleHuang, Faming, Jie Lin, and Binxin Zheng. 2019. "Effects of Thermal Discharge from Coastal Nuclear Power Plants and Thermal Power Plants on the Thermocline Characteristics in Sea Areas with Different Tidal Dynamics" Water 11, no. 12: 2577. https://doi.org/10.3390/w11122577
APA StyleHuang, F., Lin, J., & Zheng, B. (2019). Effects of Thermal Discharge from Coastal Nuclear Power Plants and Thermal Power Plants on the Thermocline Characteristics in Sea Areas with Different Tidal Dynamics. Water, 11(12), 2577. https://doi.org/10.3390/w11122577