An Experimental Study of Focusing Wave Generation with Improved Wave Amplitude Spectra

Abstract
:1. Introduction
2. Generating Principle of Focusing Waves in a Physical Wave Tank
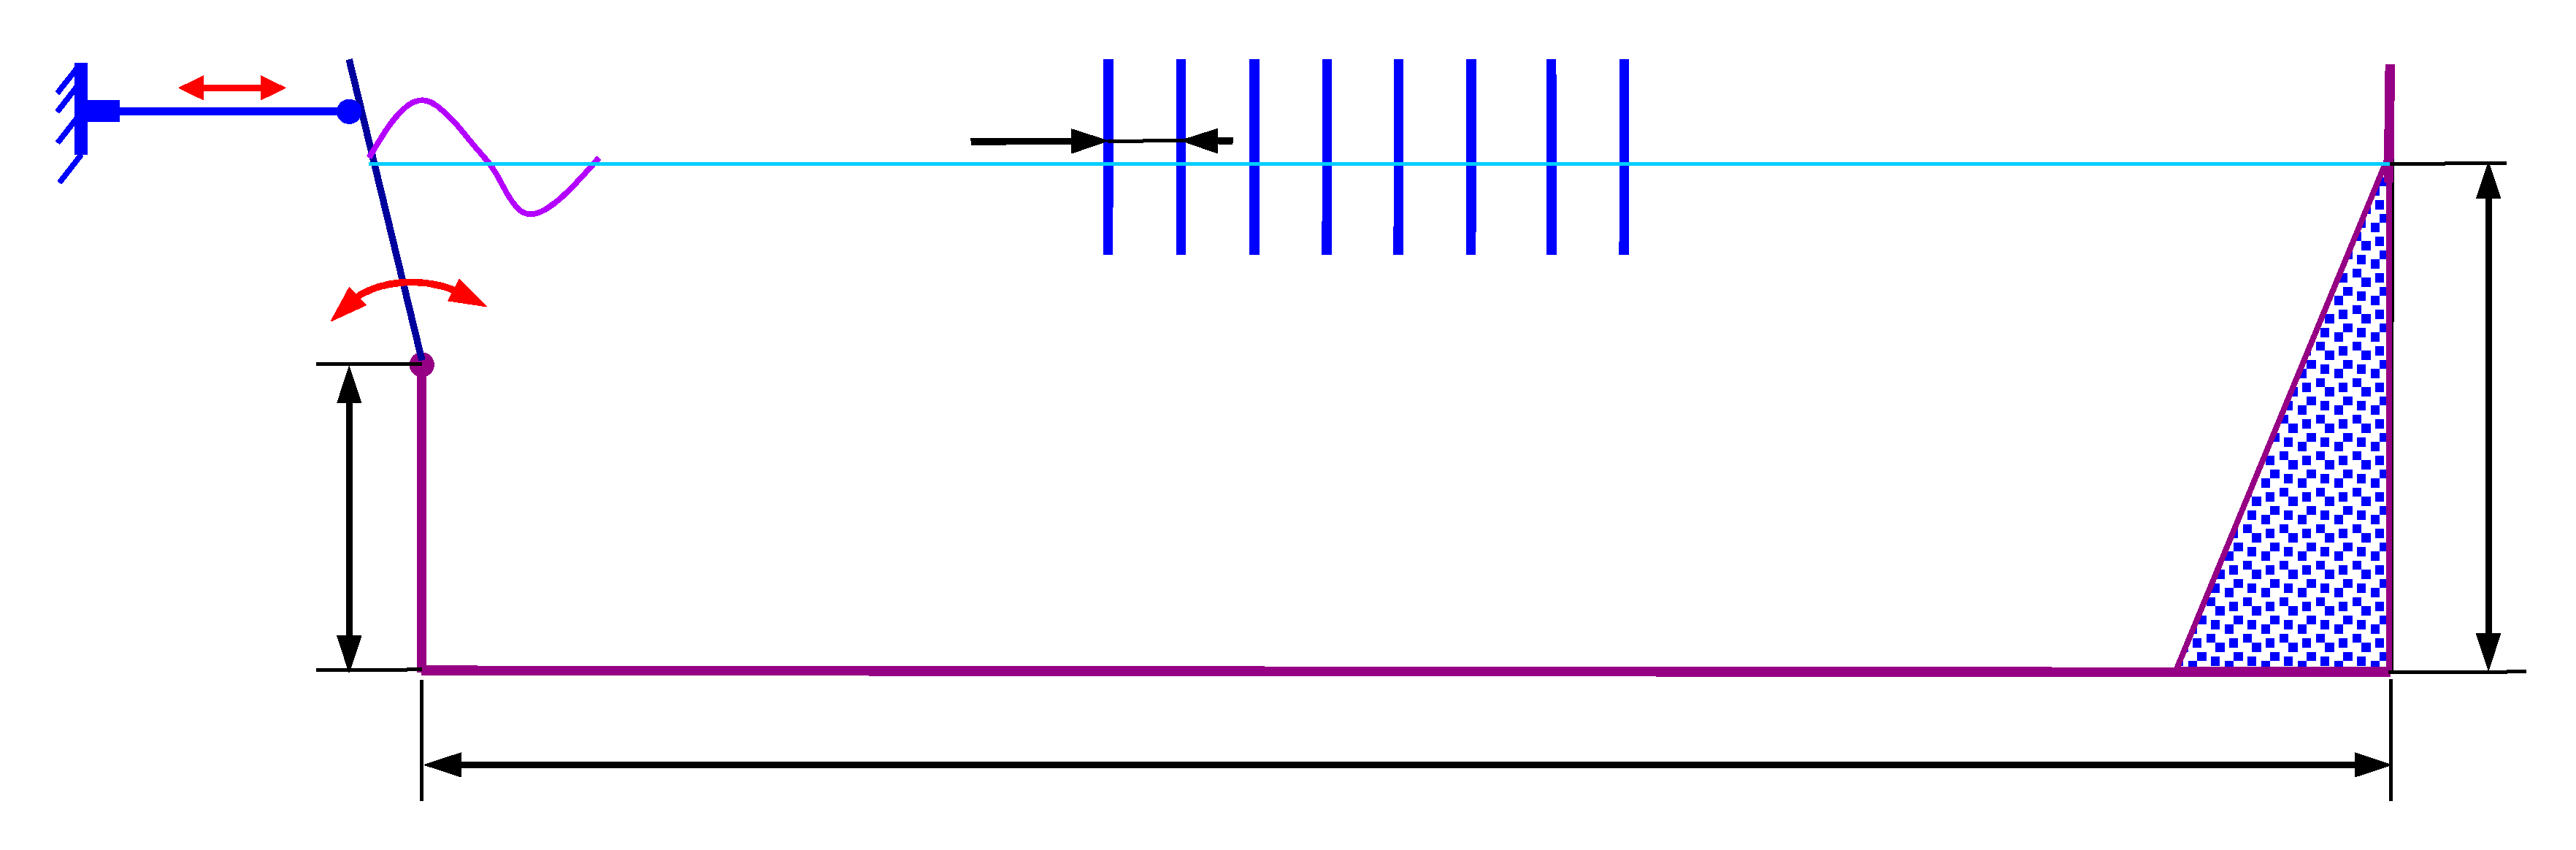
2.1. Experimental Setup
2.2. Theoretical Wave-Making Signal
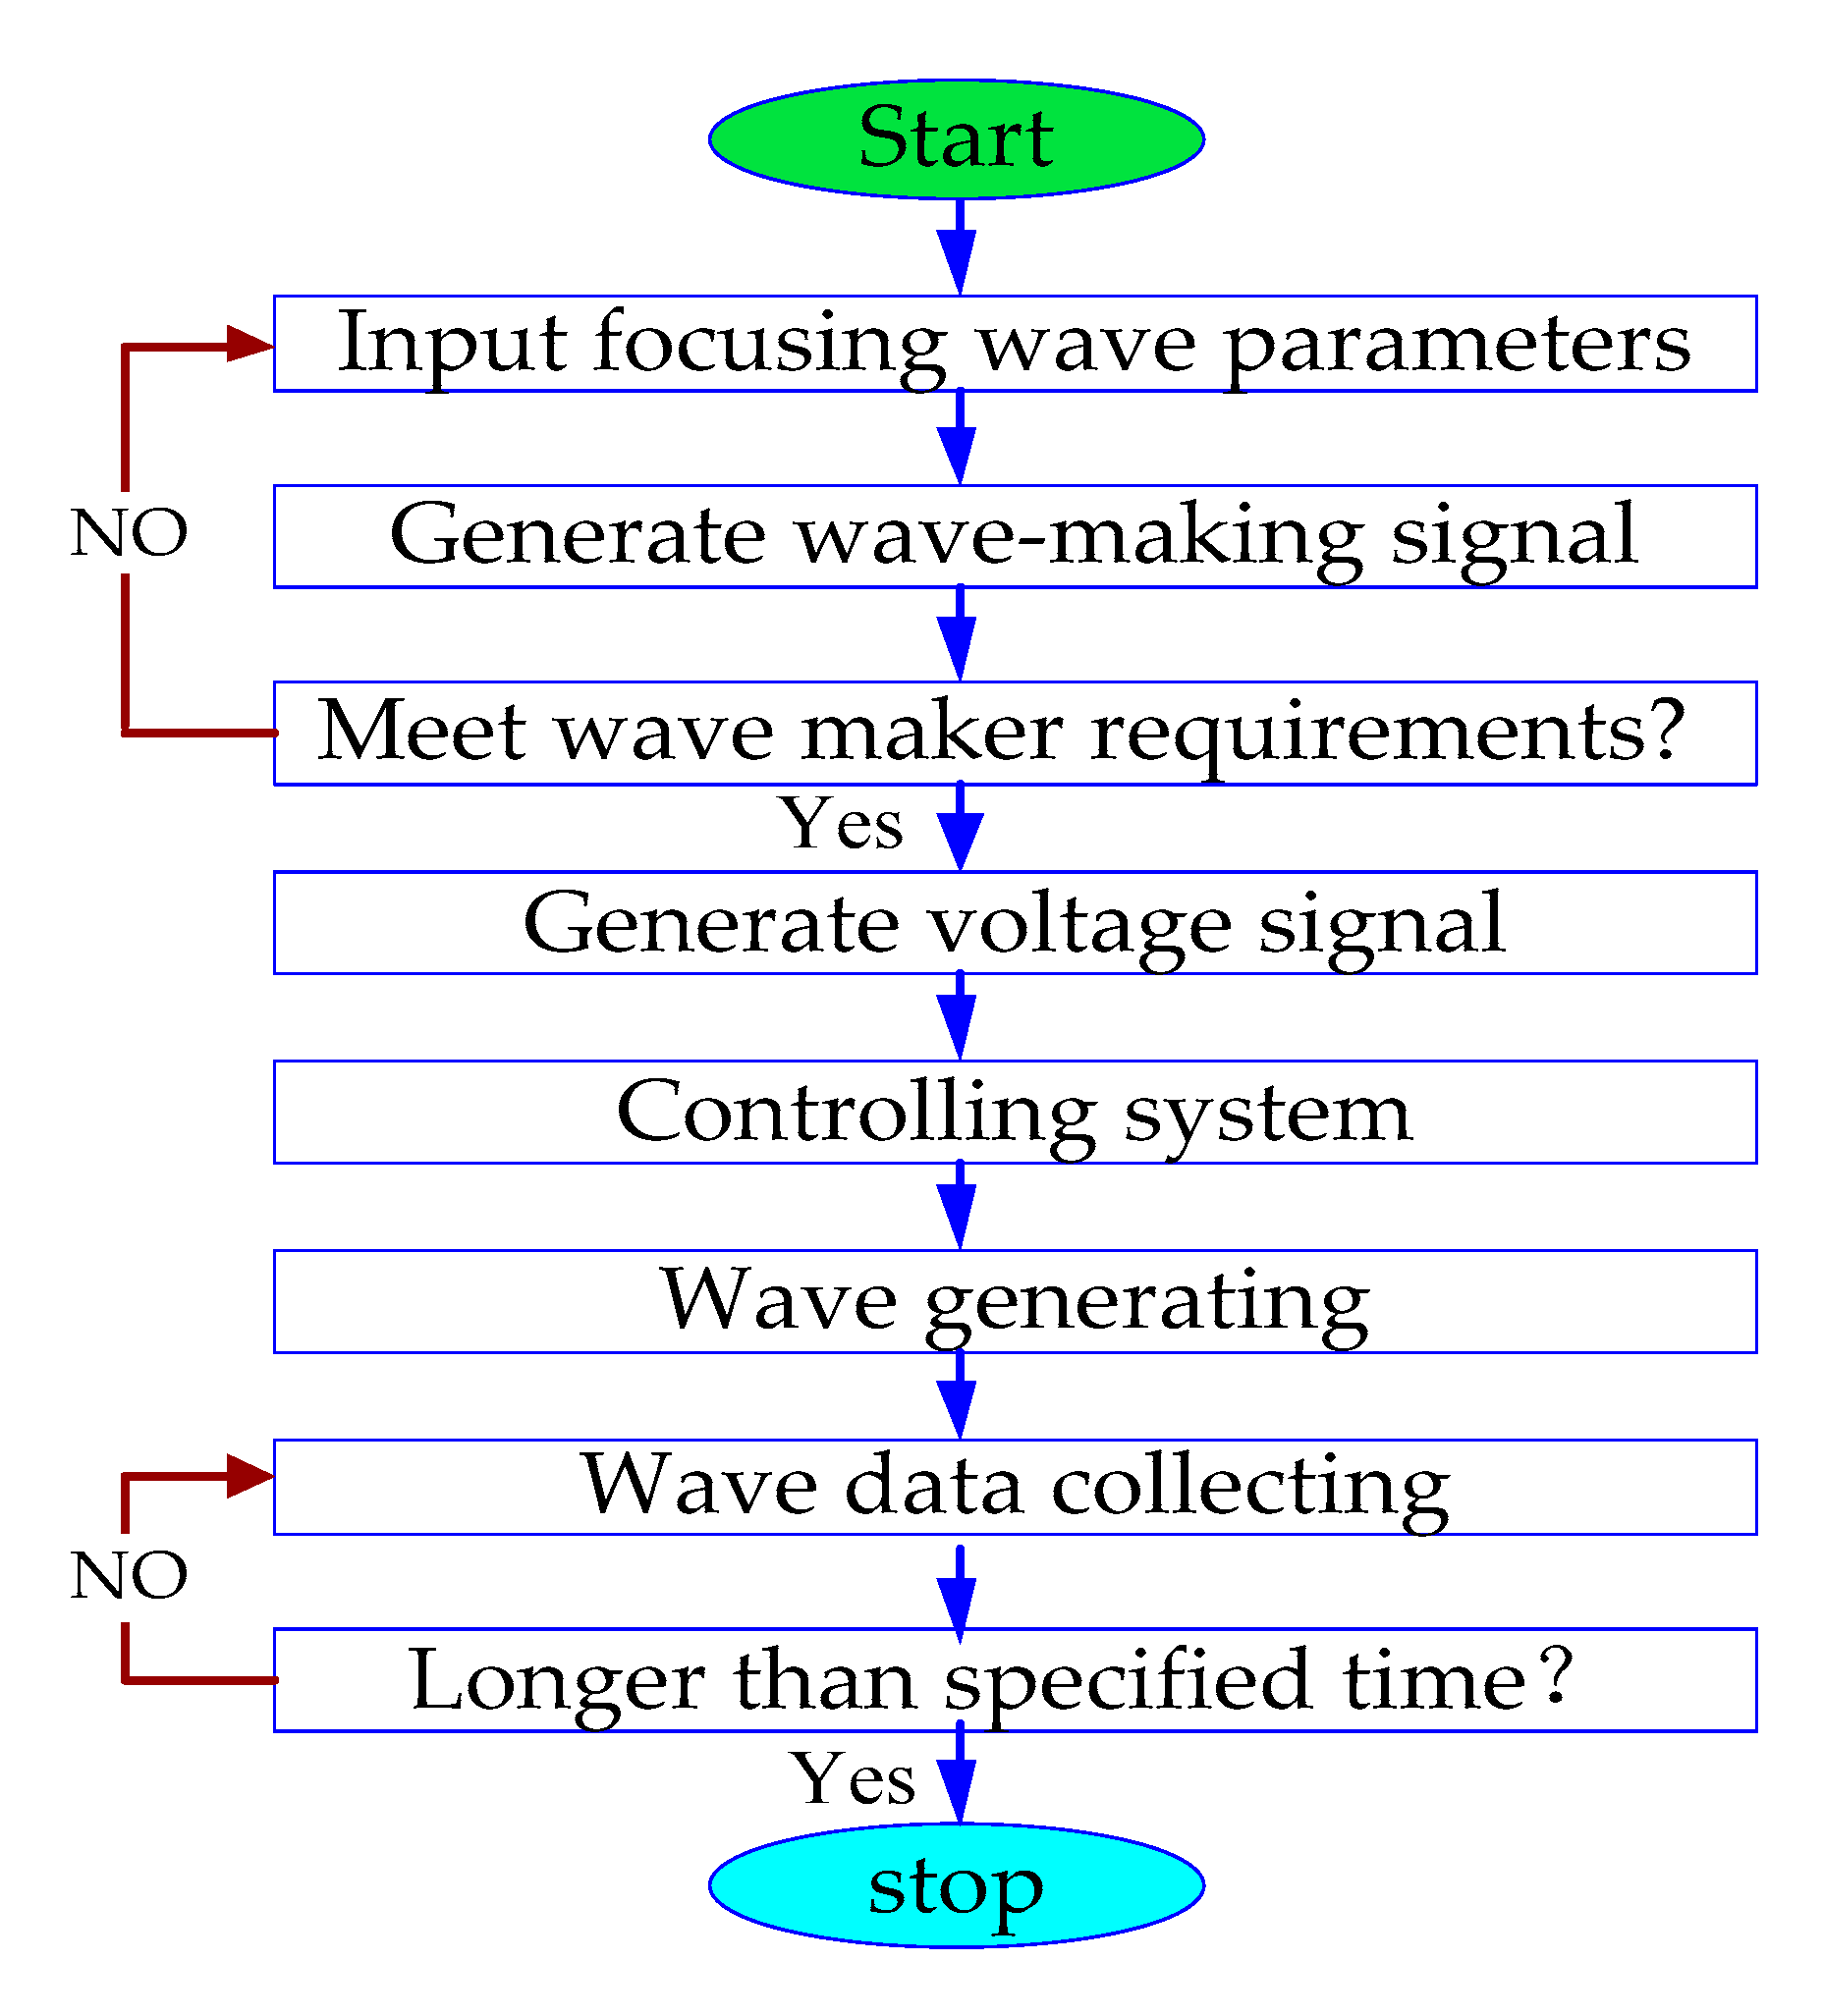
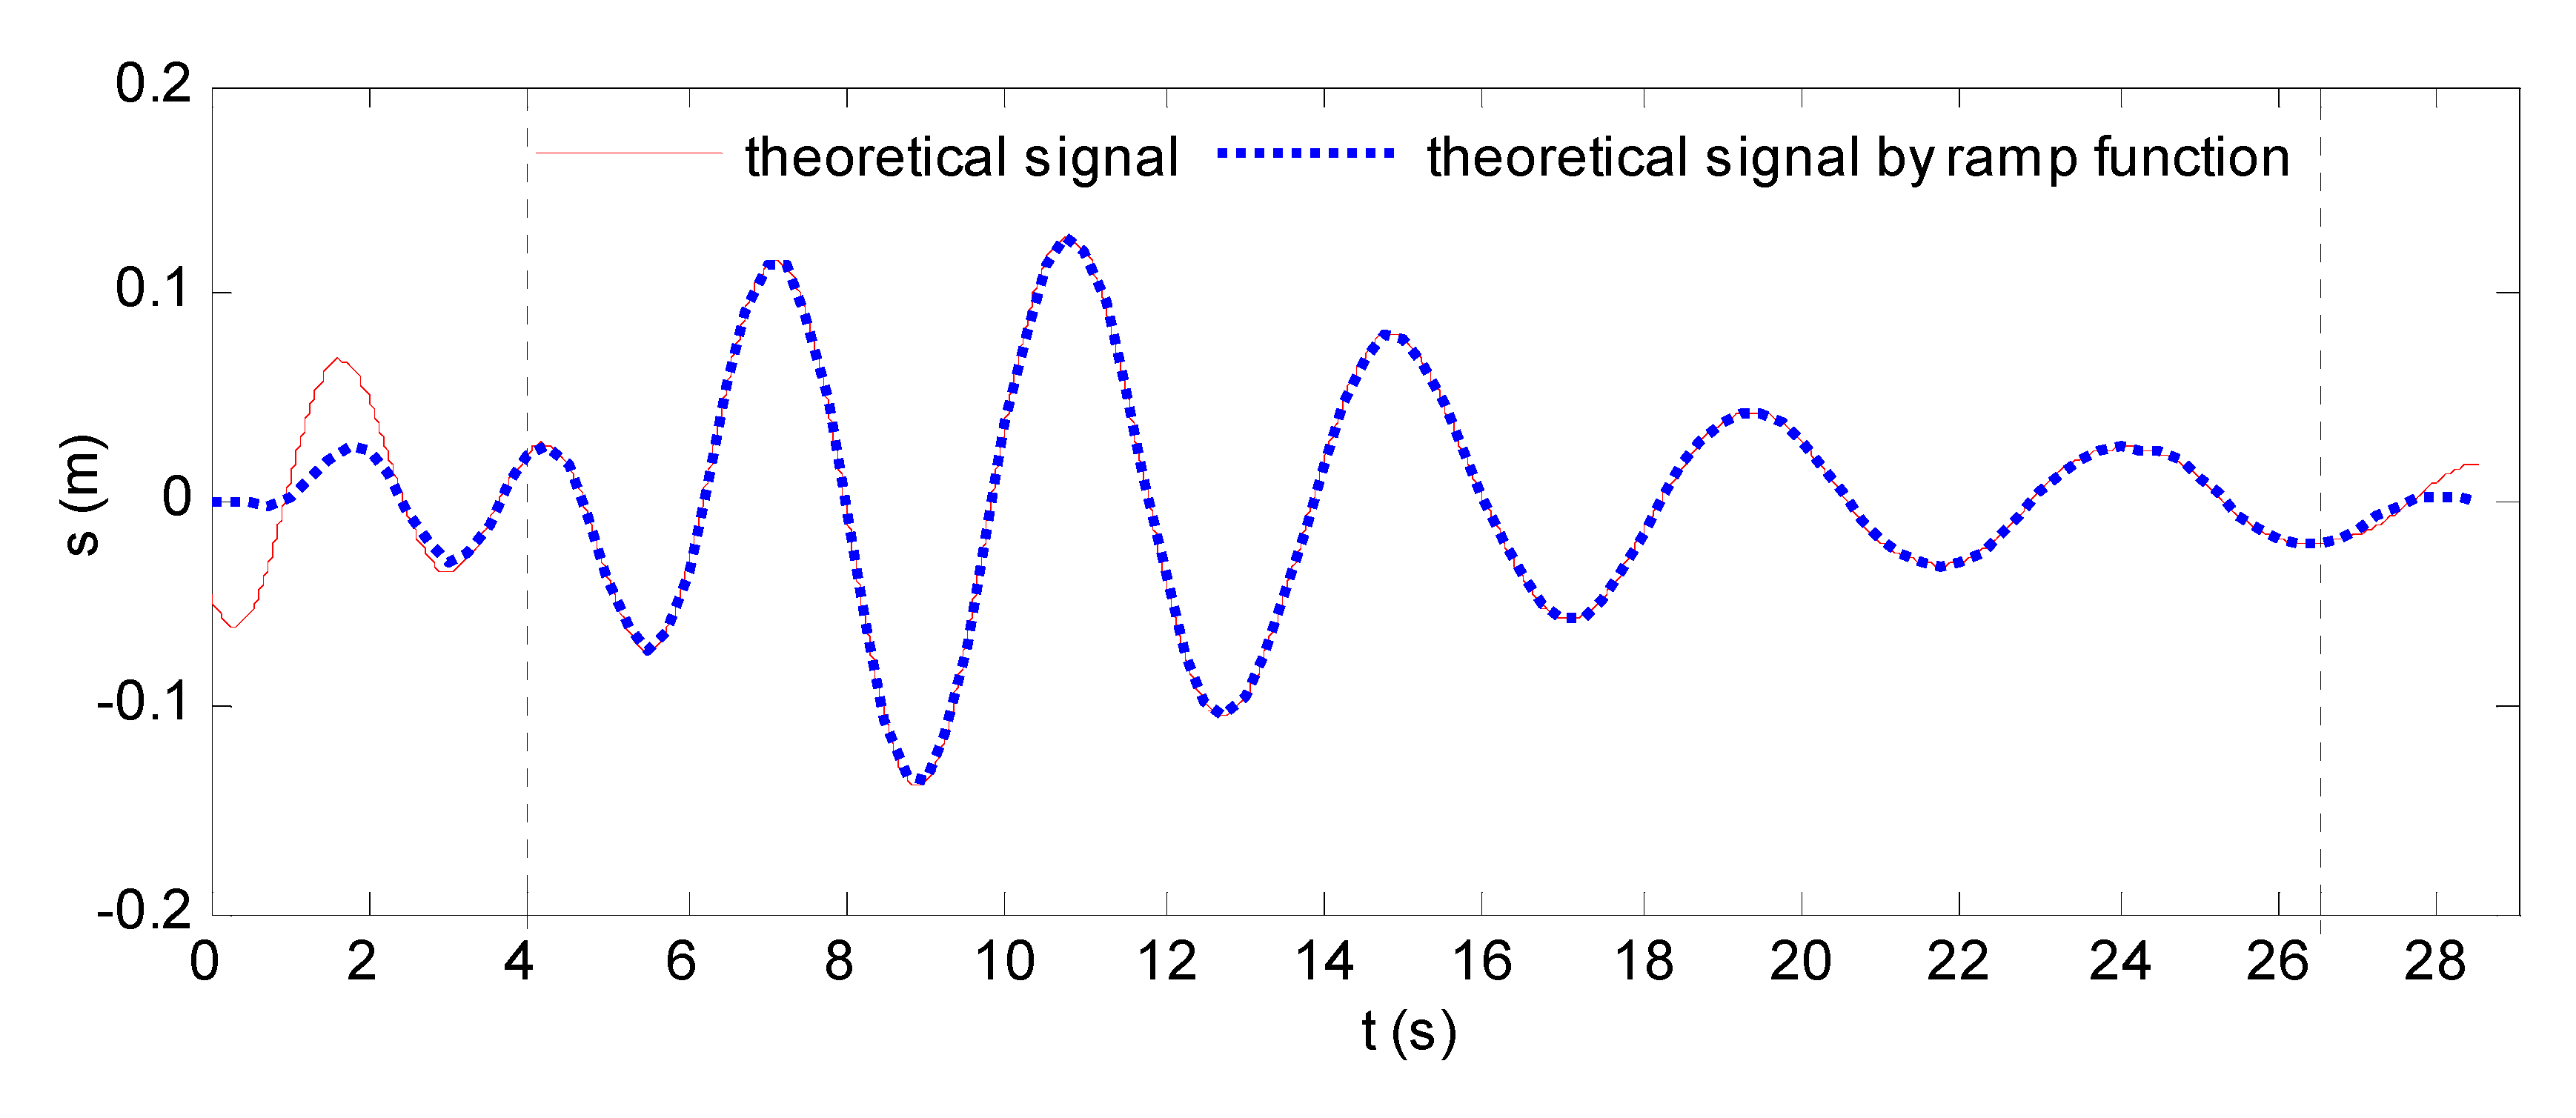
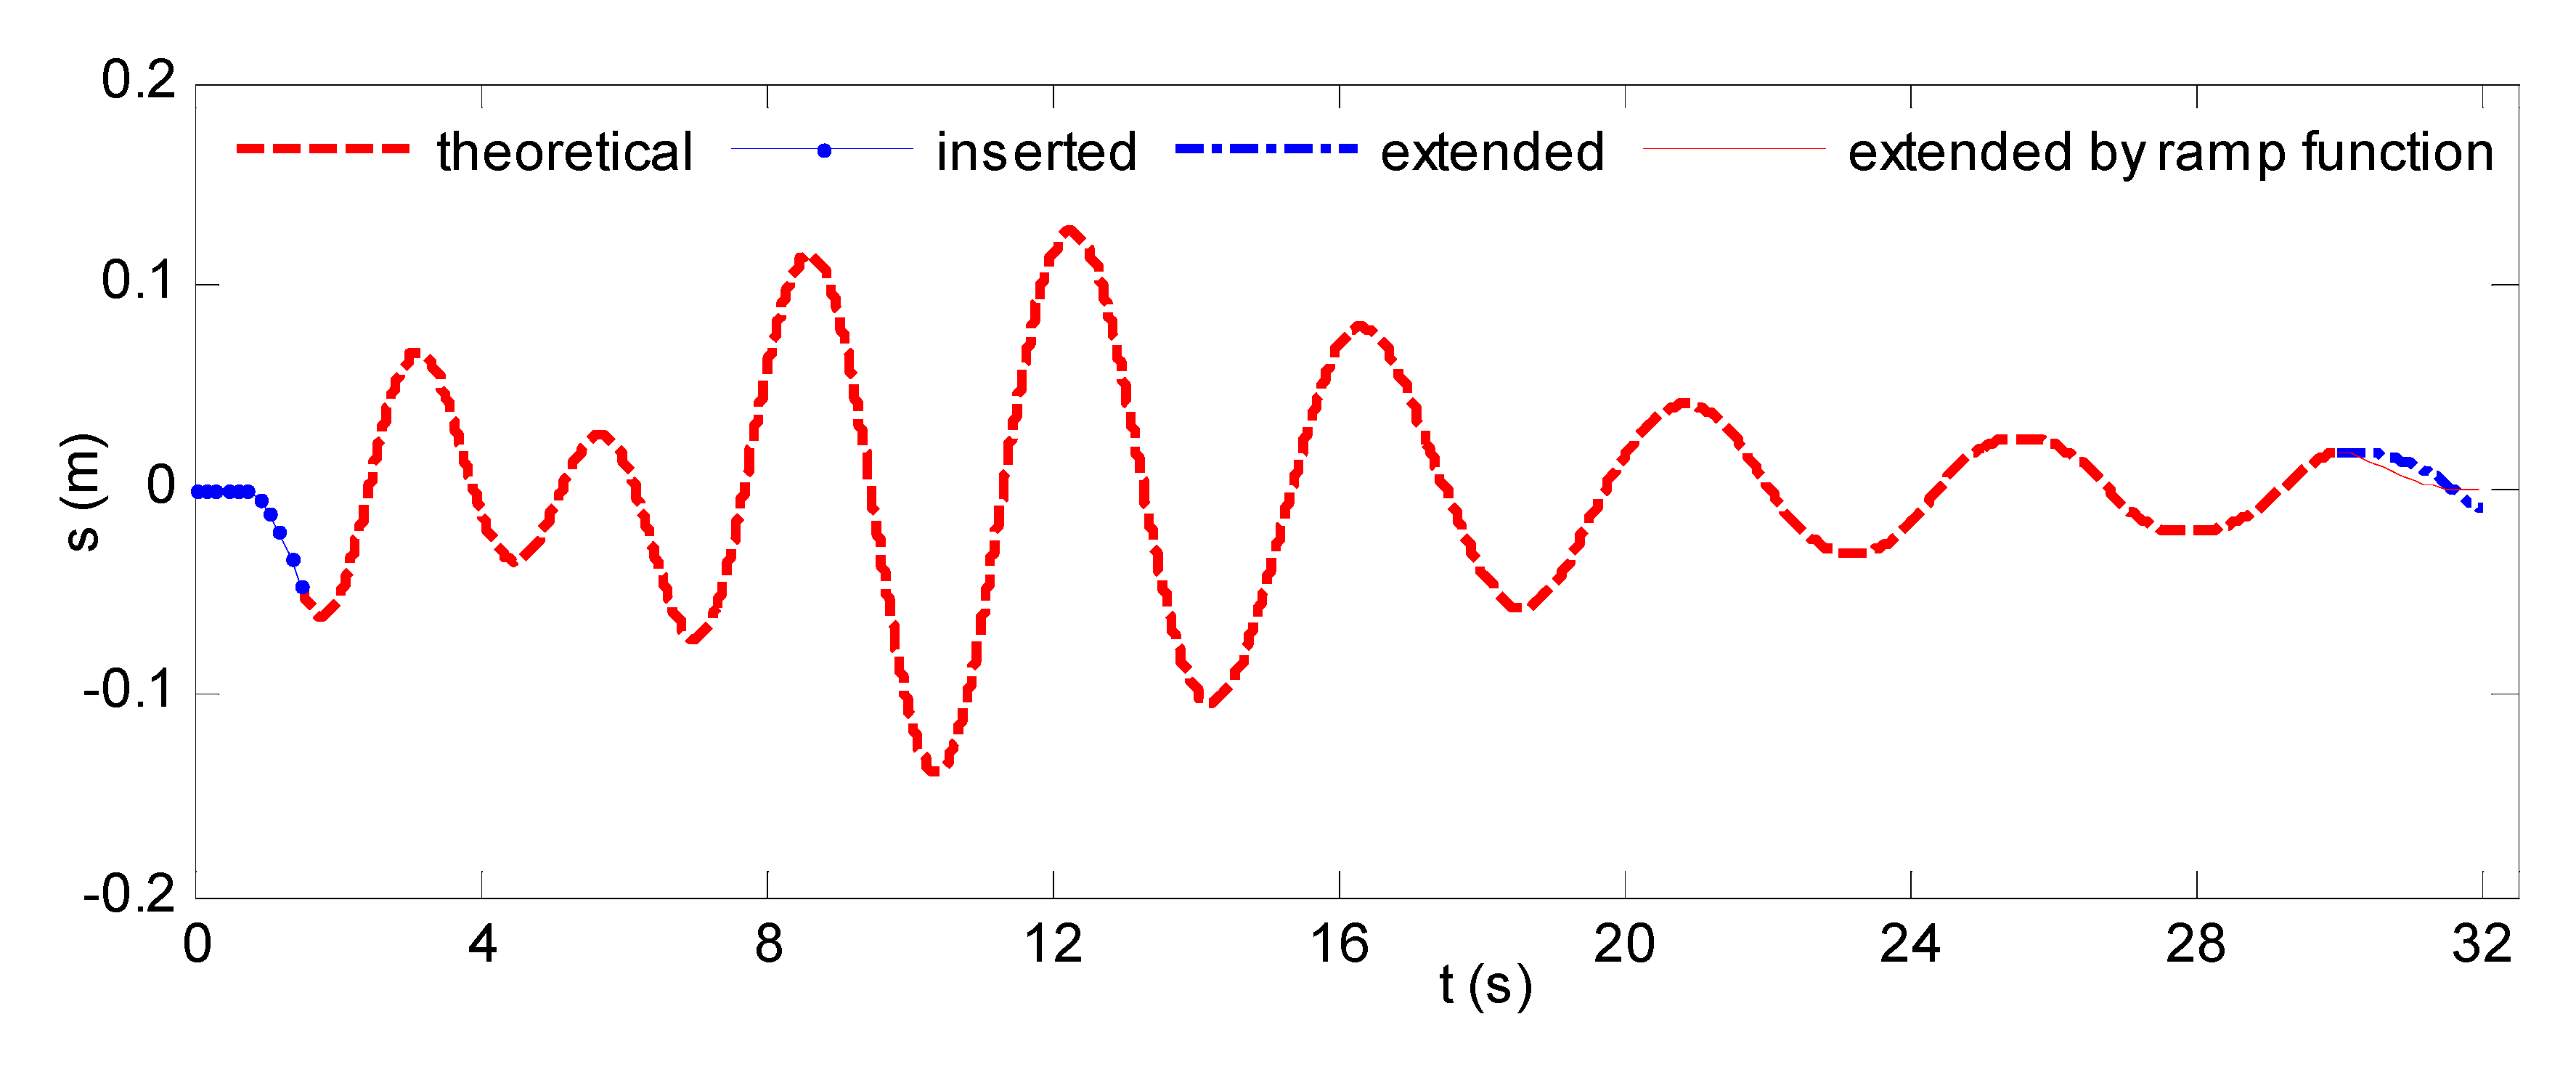
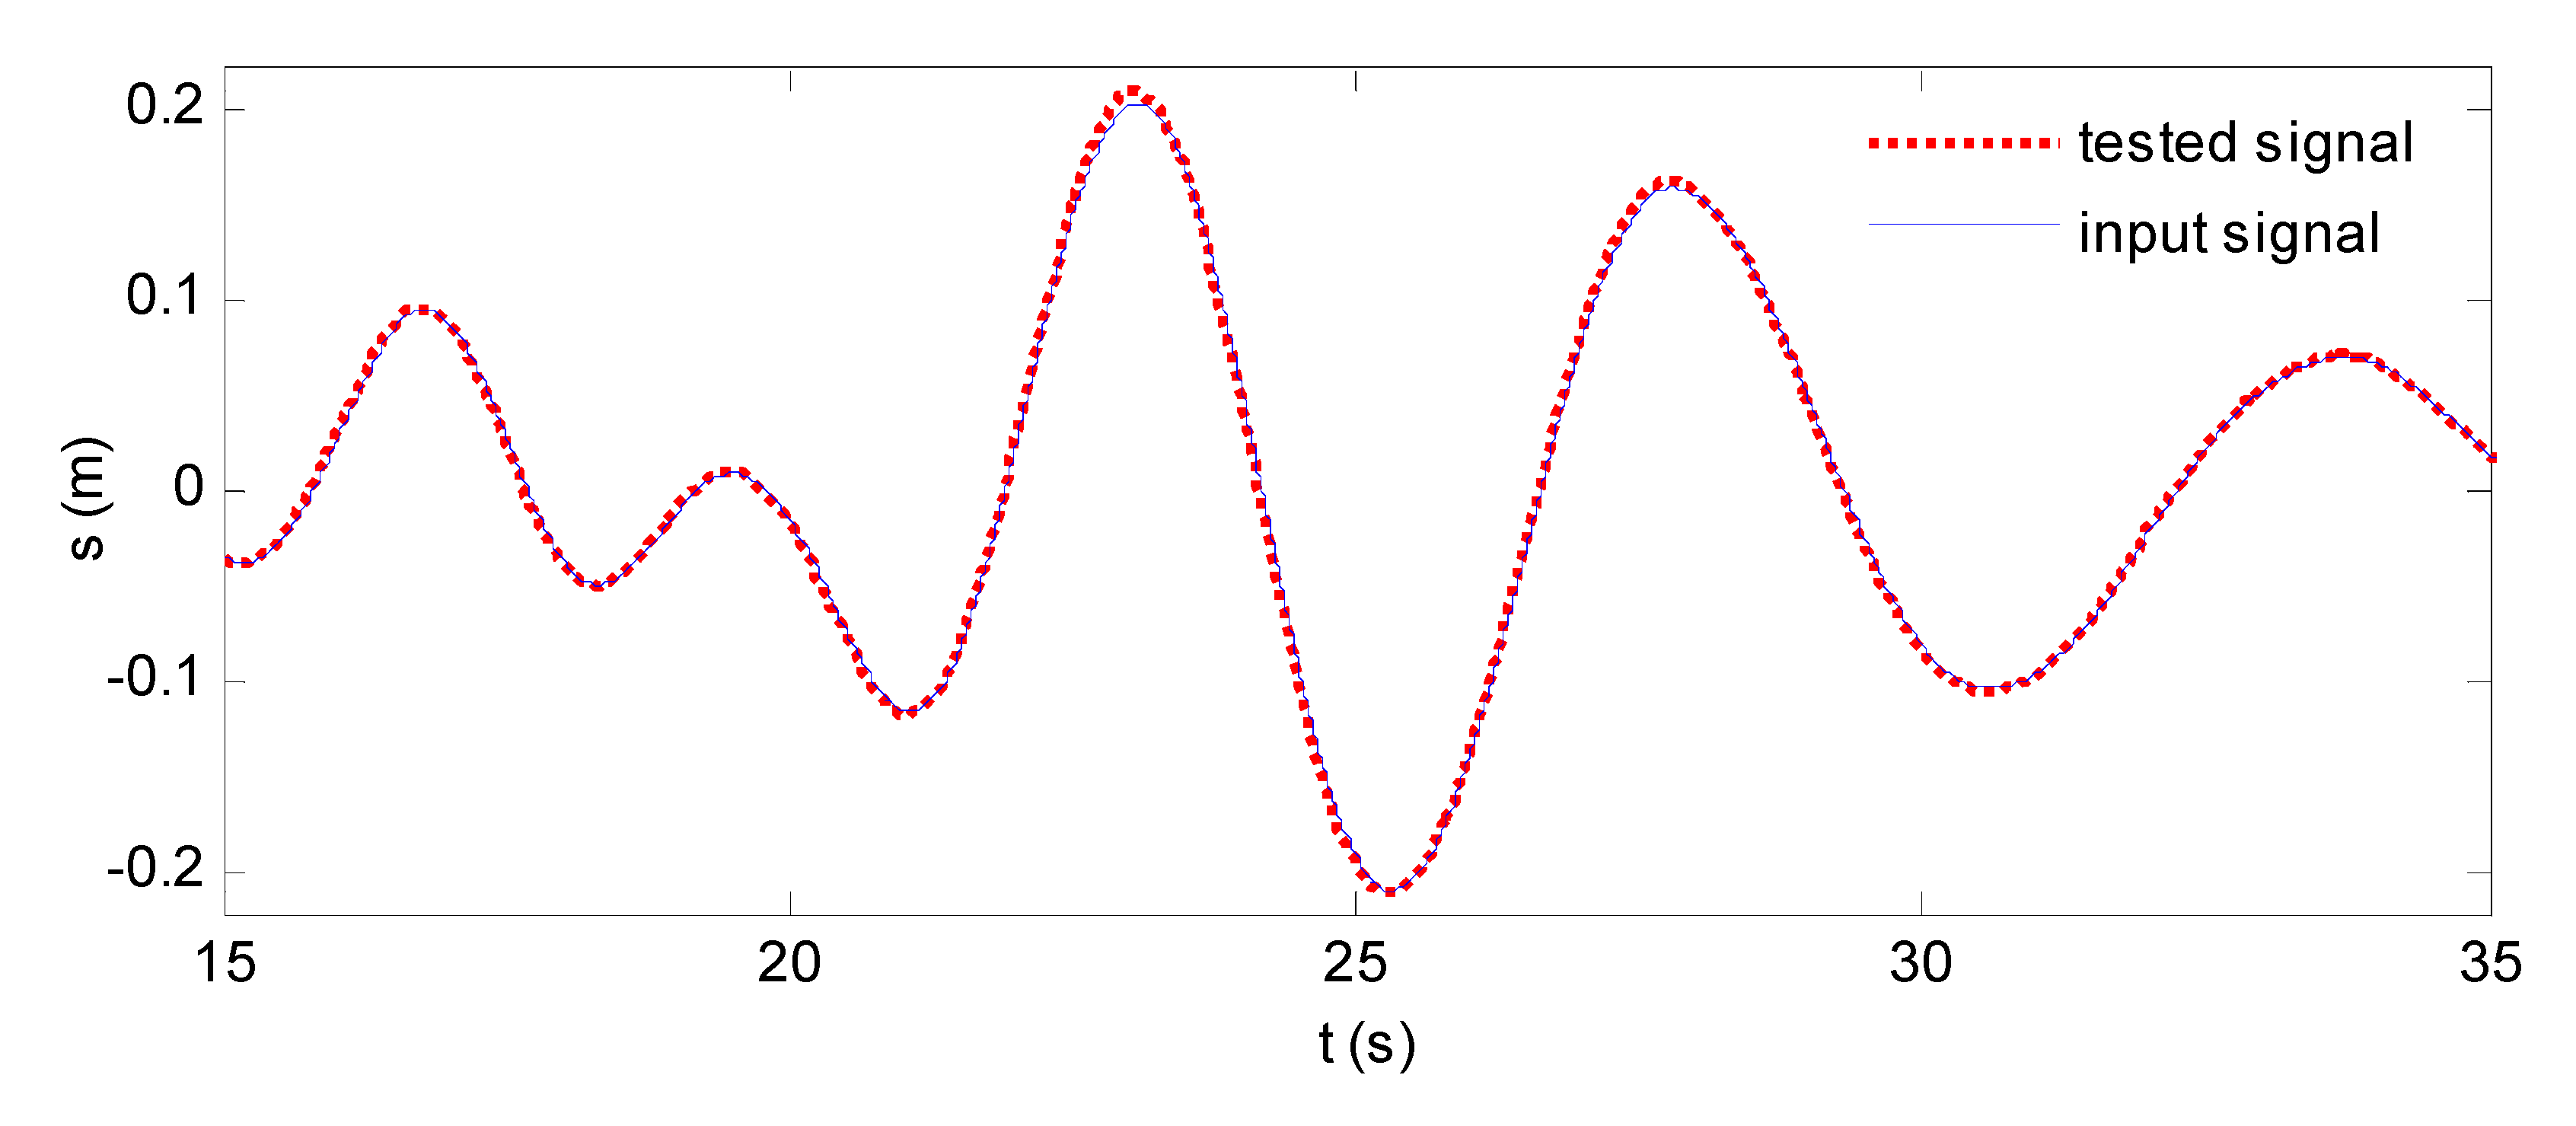
2.3. Implementing Wave-Making Signal
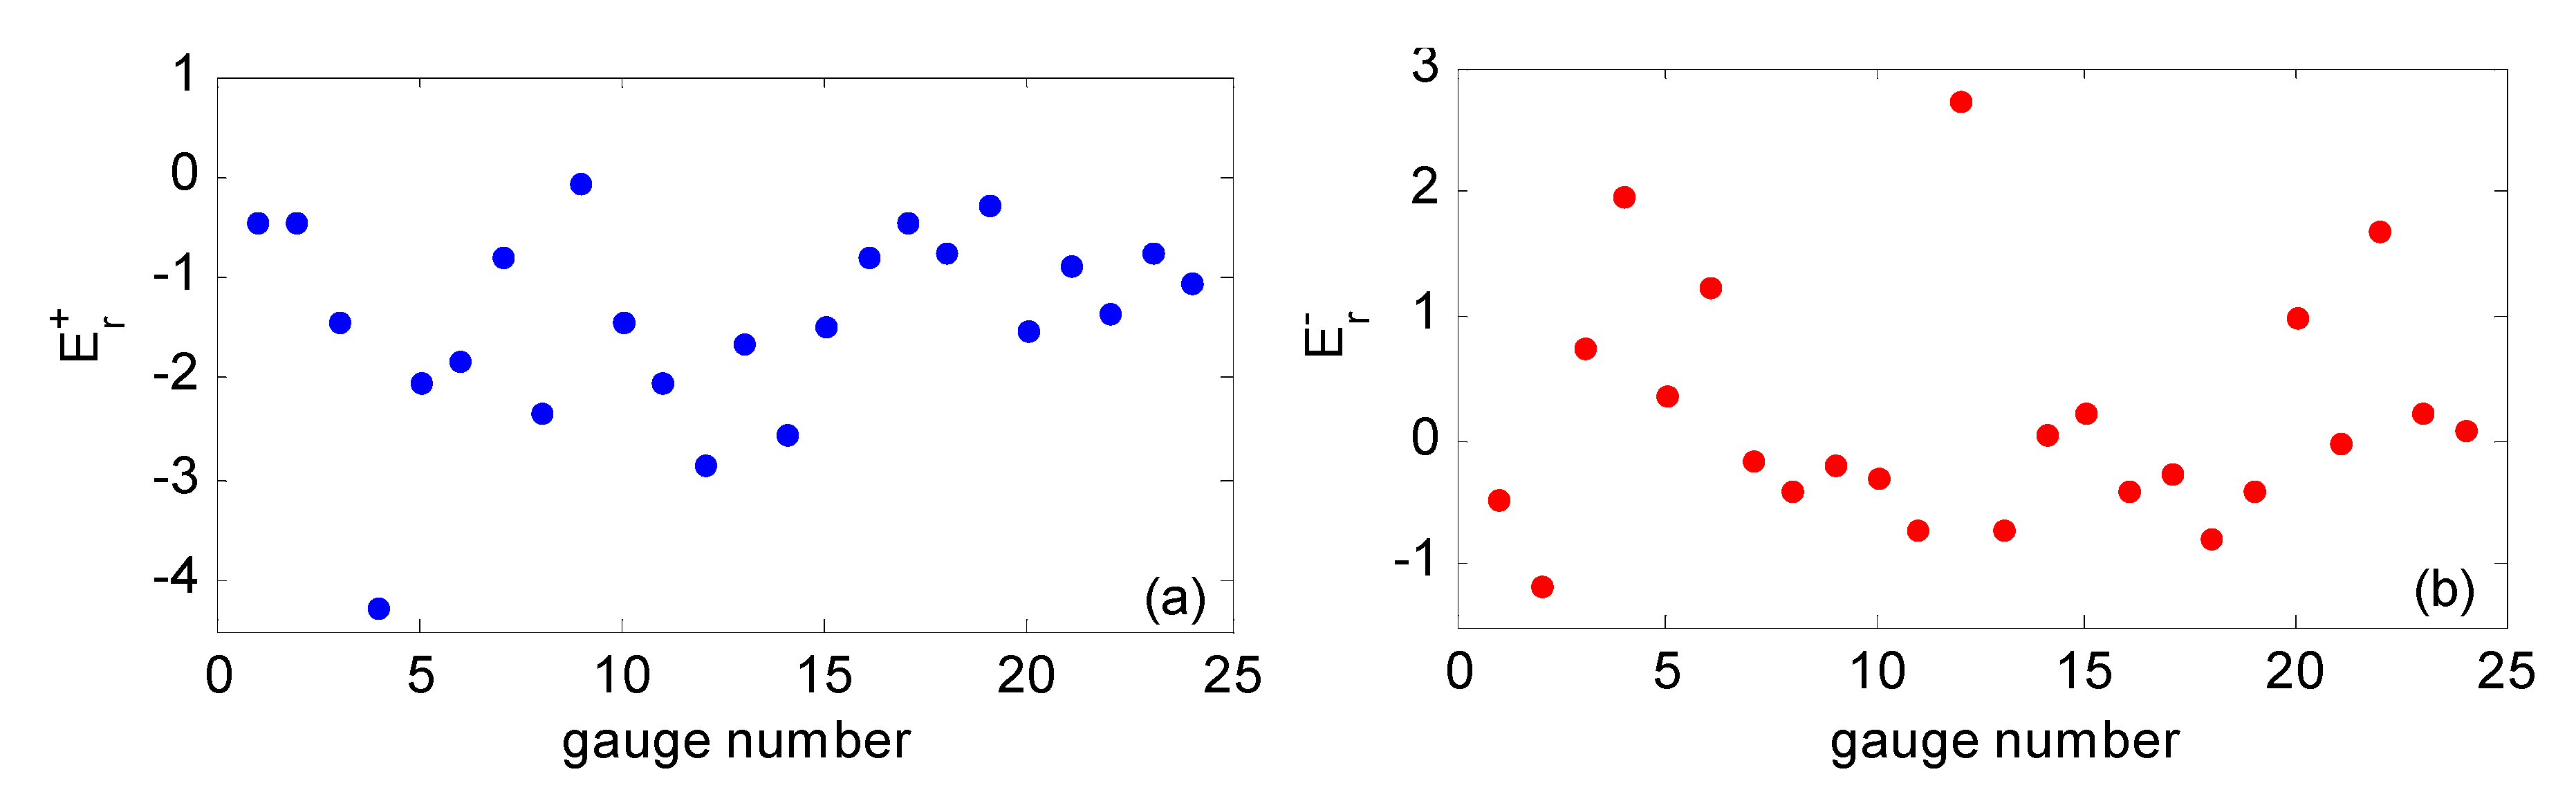
3. Experimental Results and Discussions
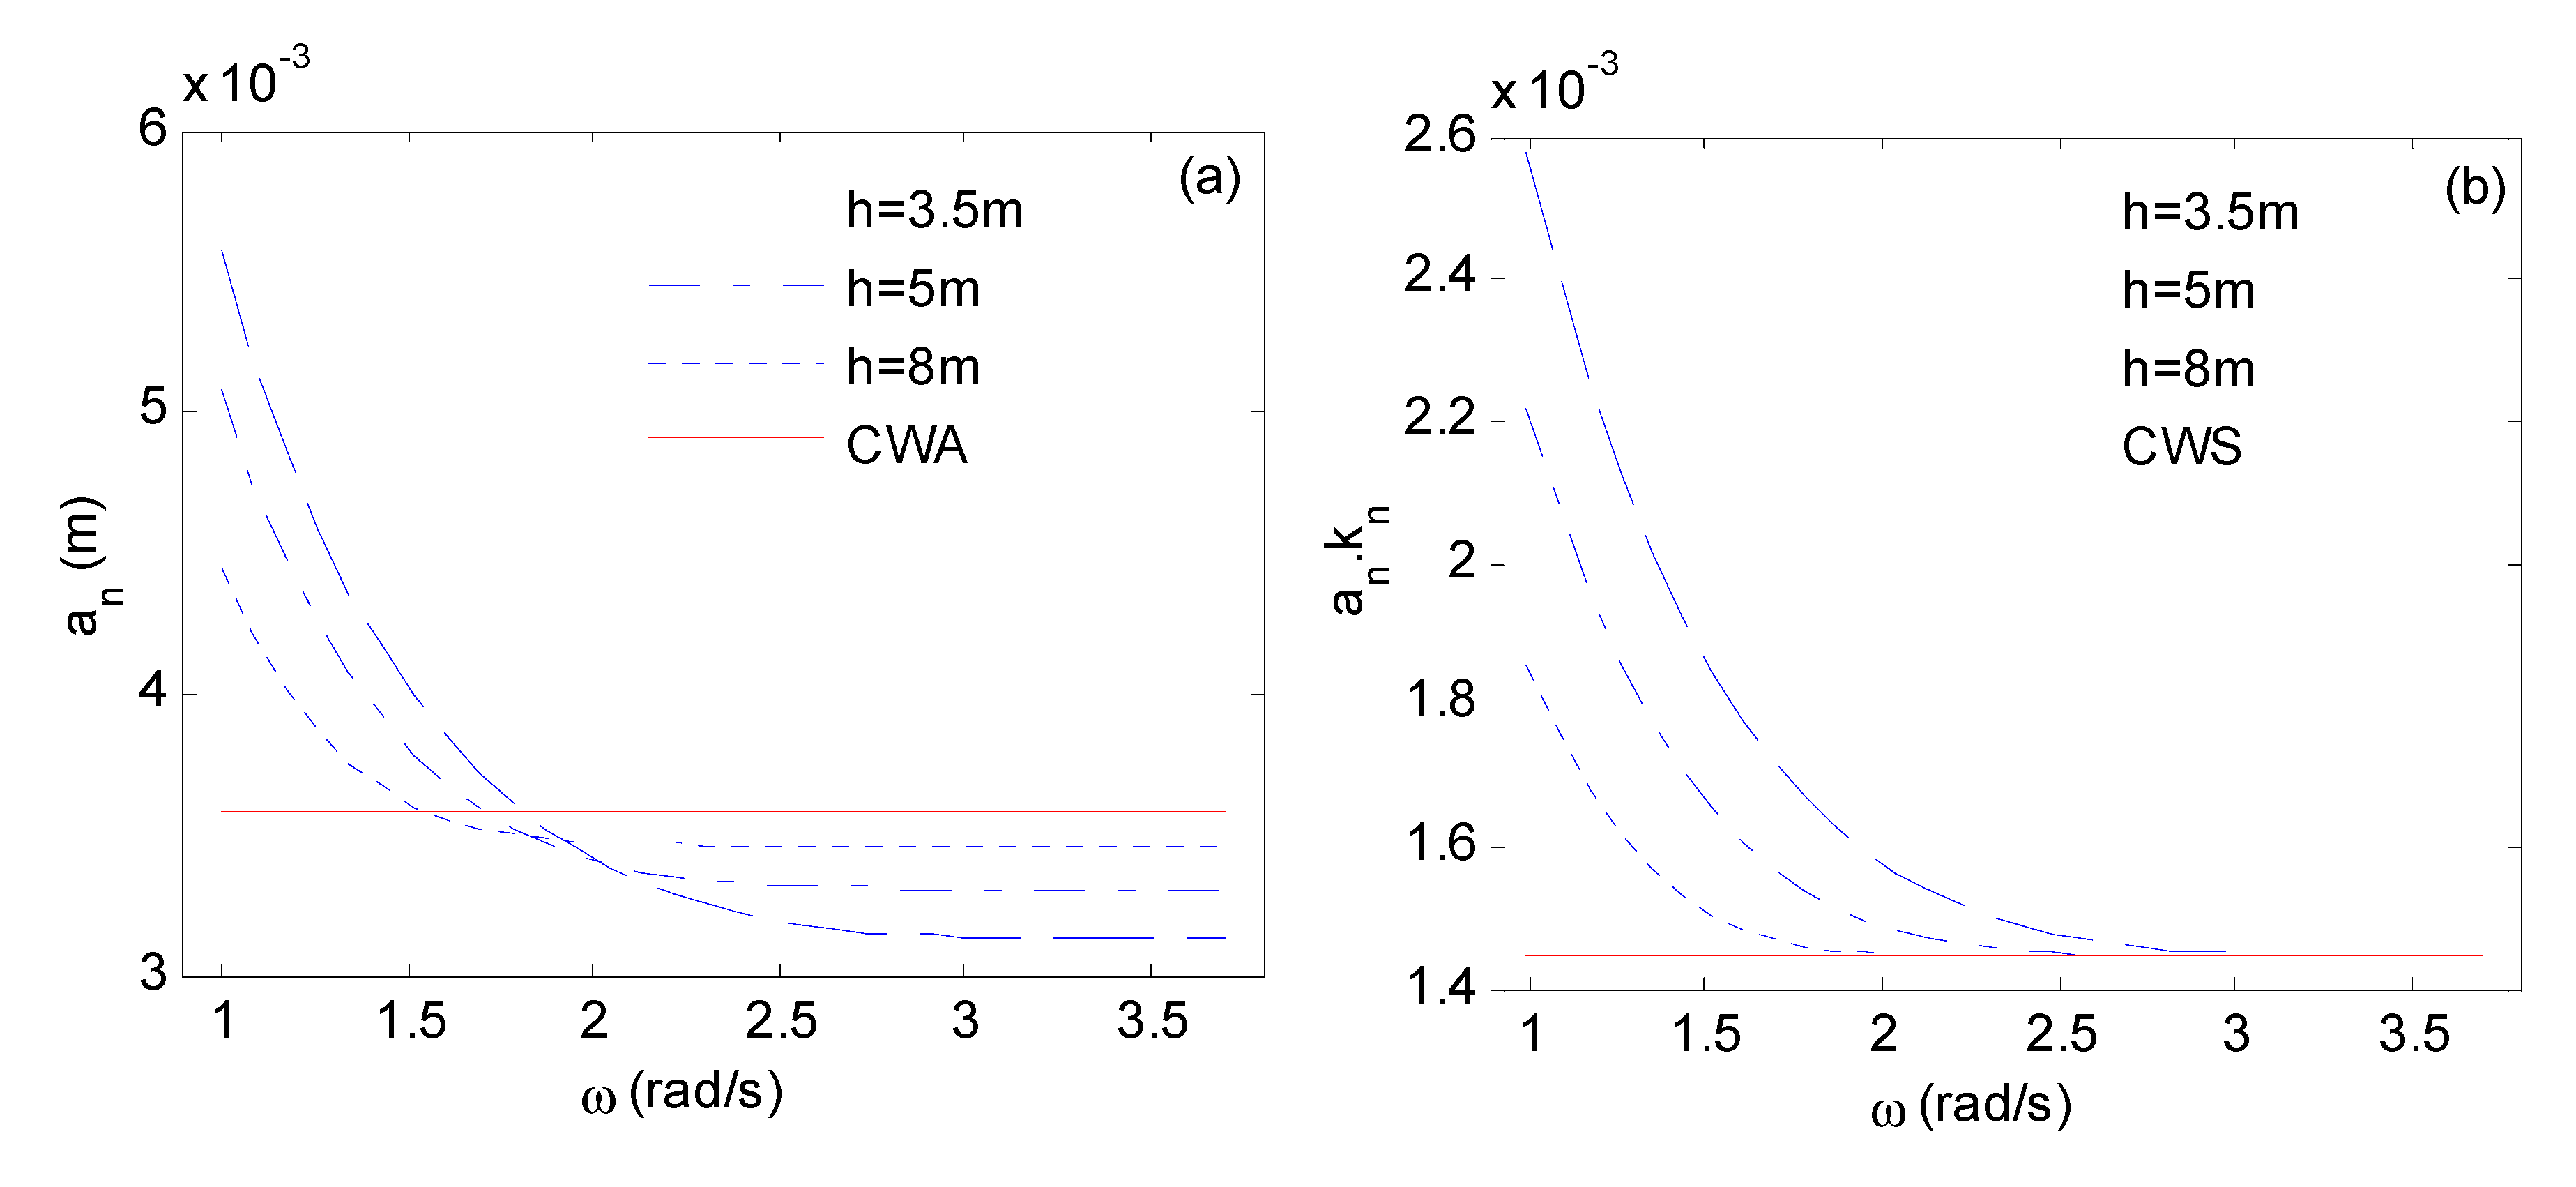
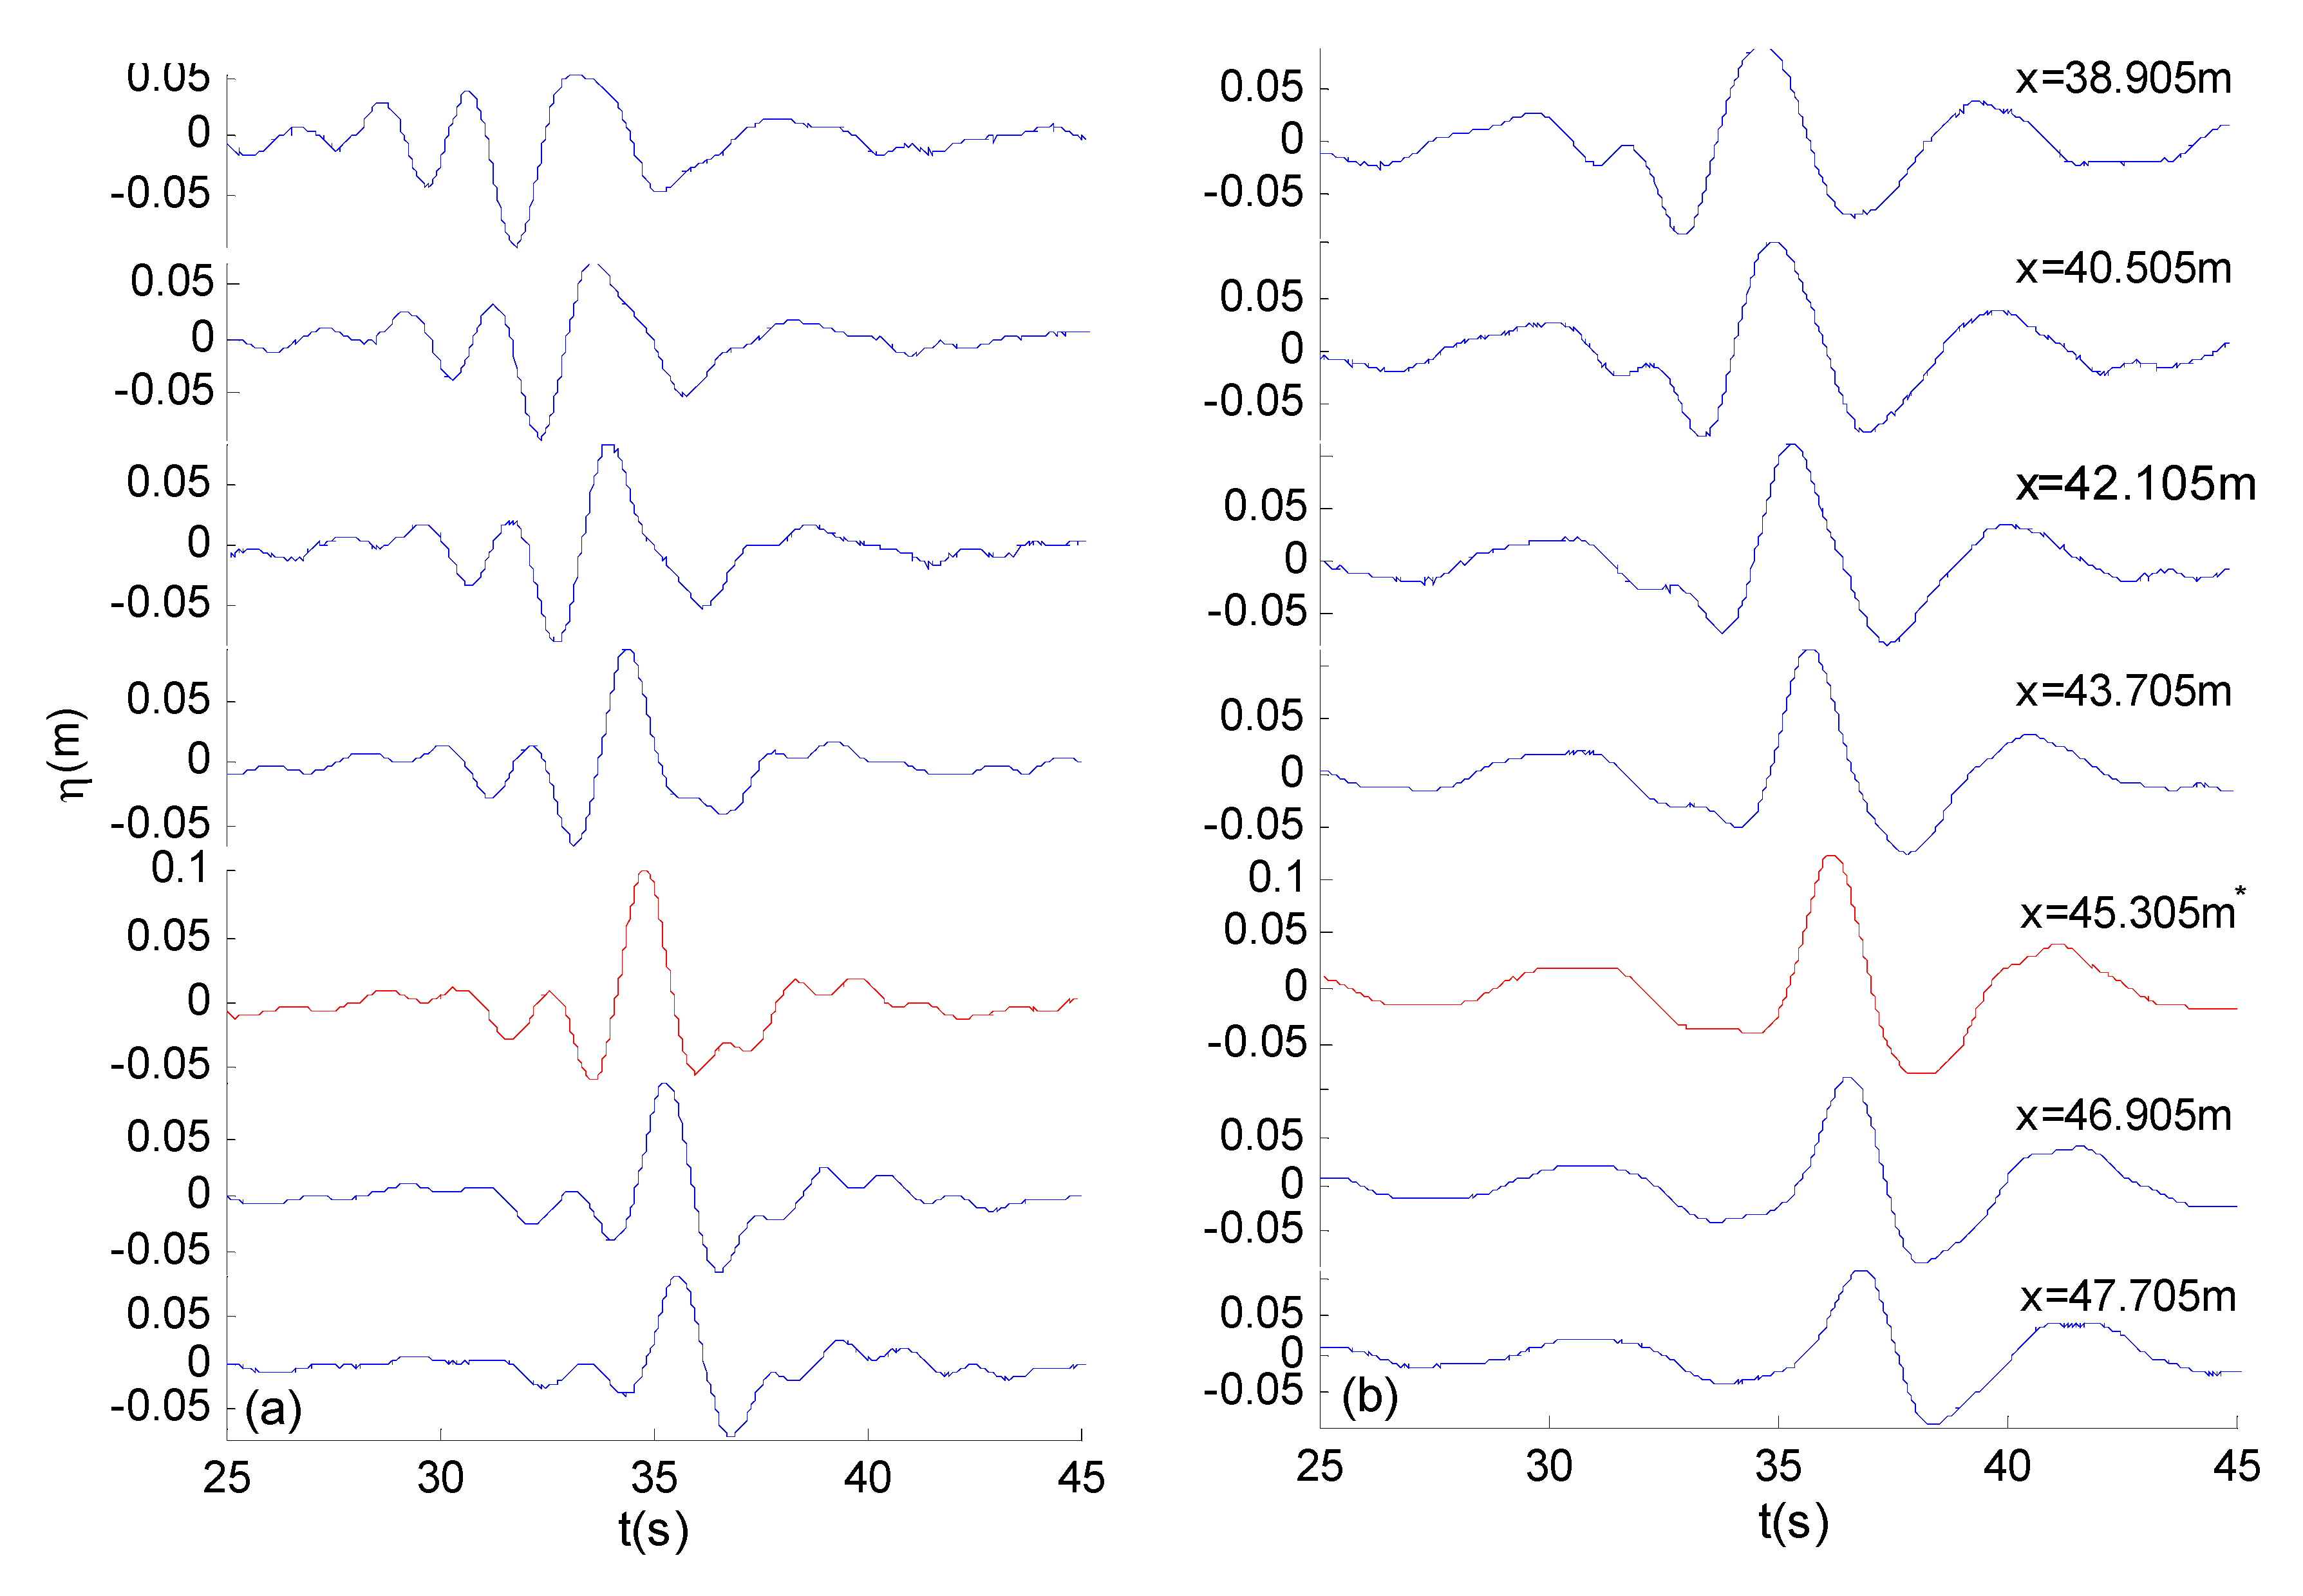
3.1. Wavefree Surface Evolution for QCWA and QCWS Focusing Waves
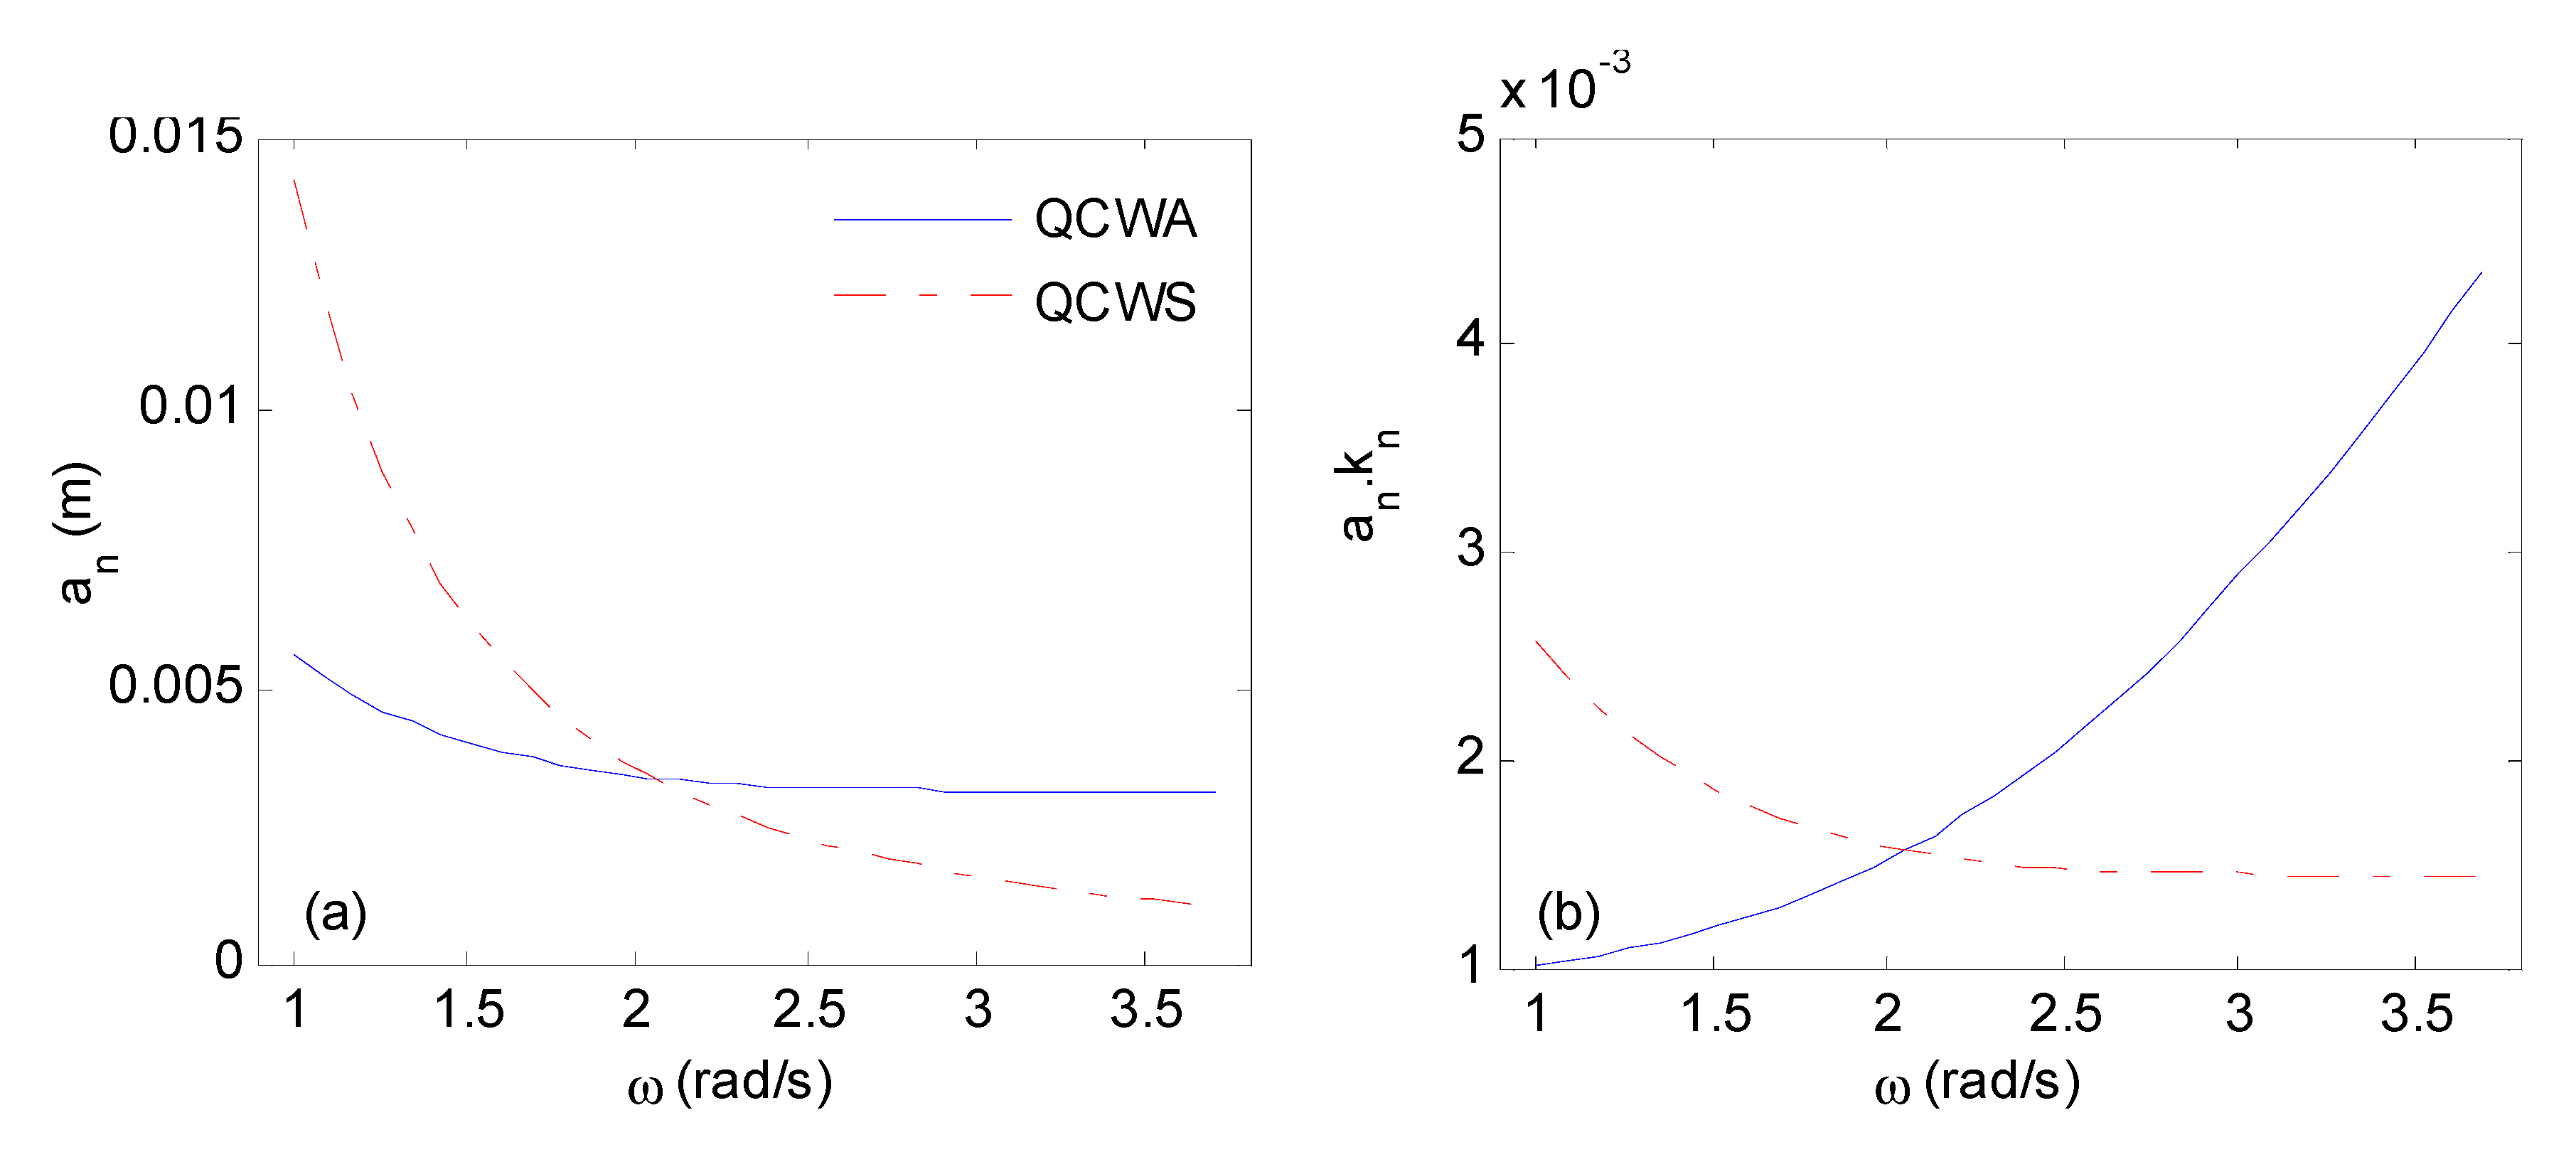
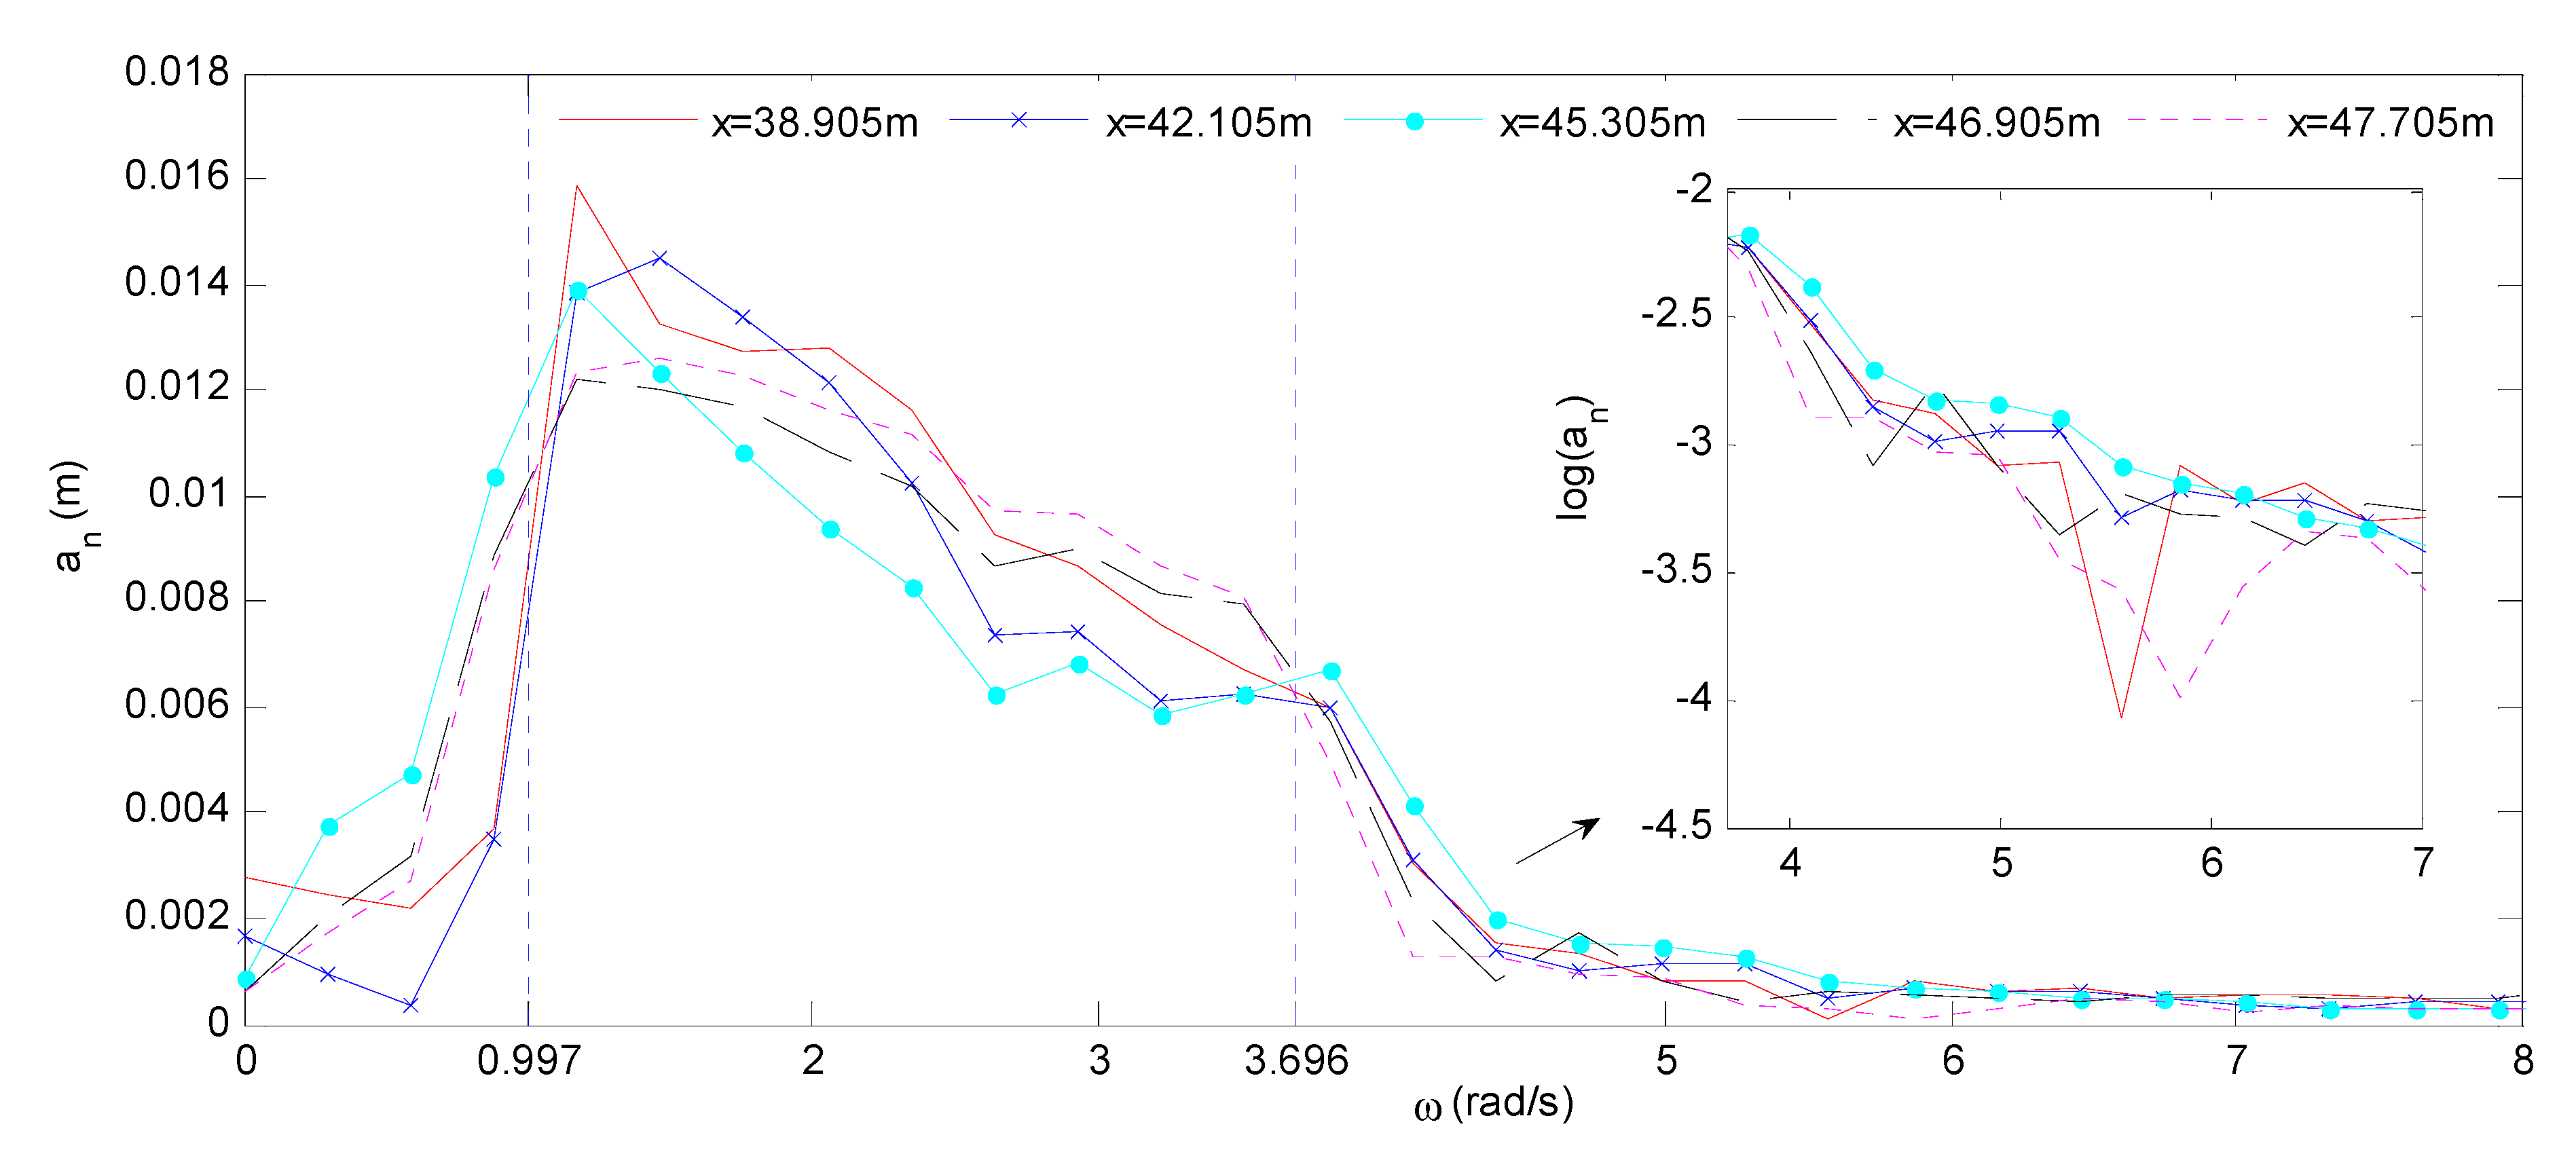
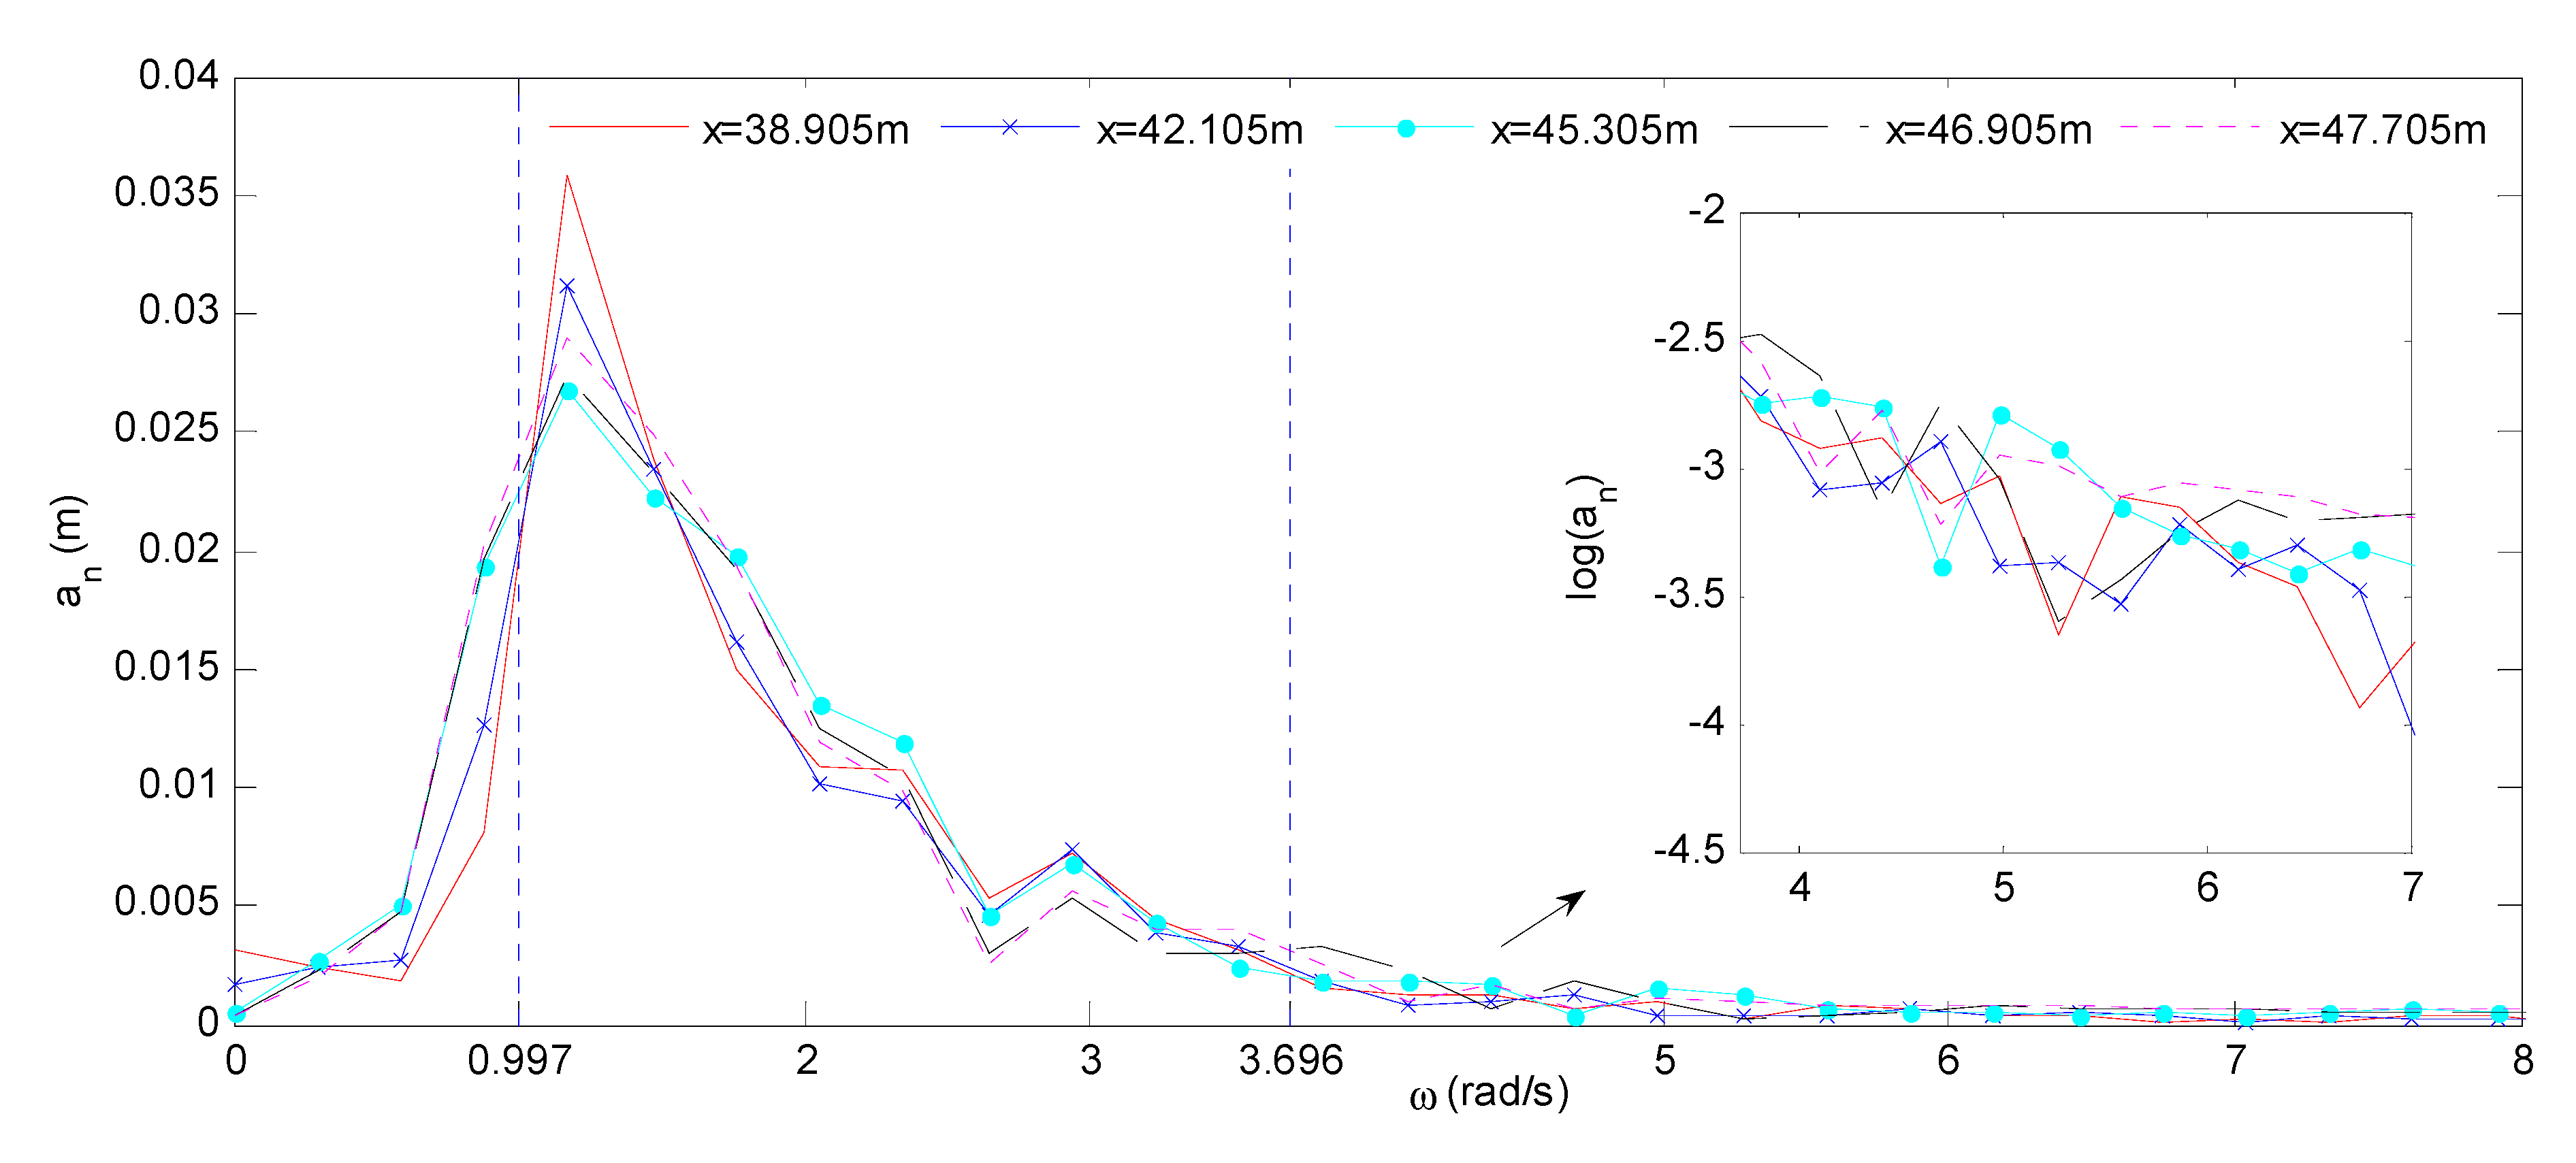
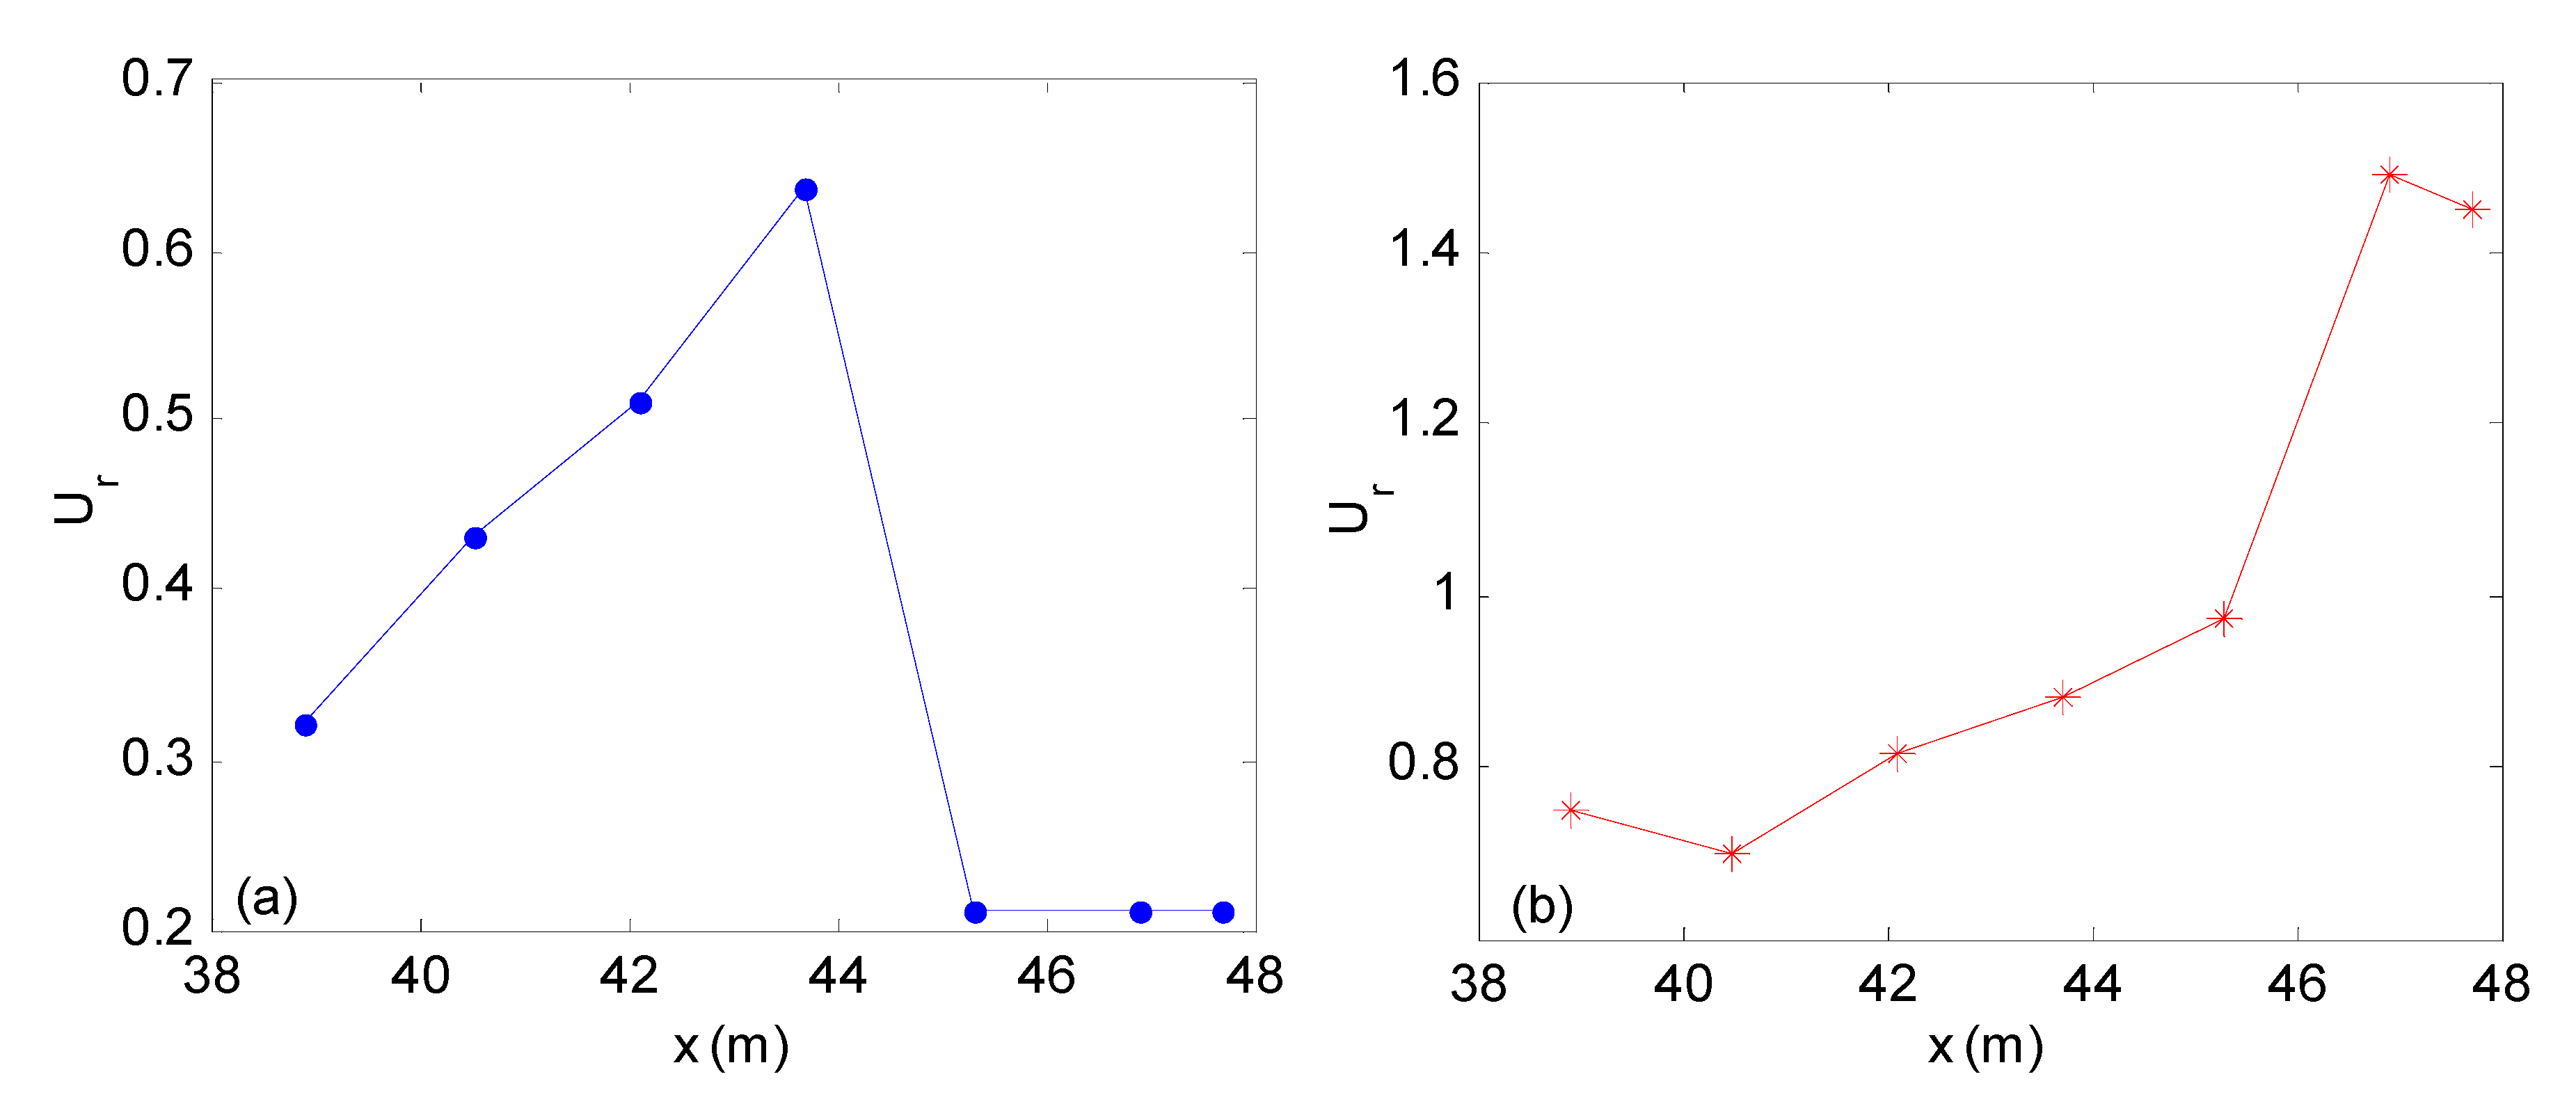
3.2. Focusing Wave Generation under Different an and ωn Parameters
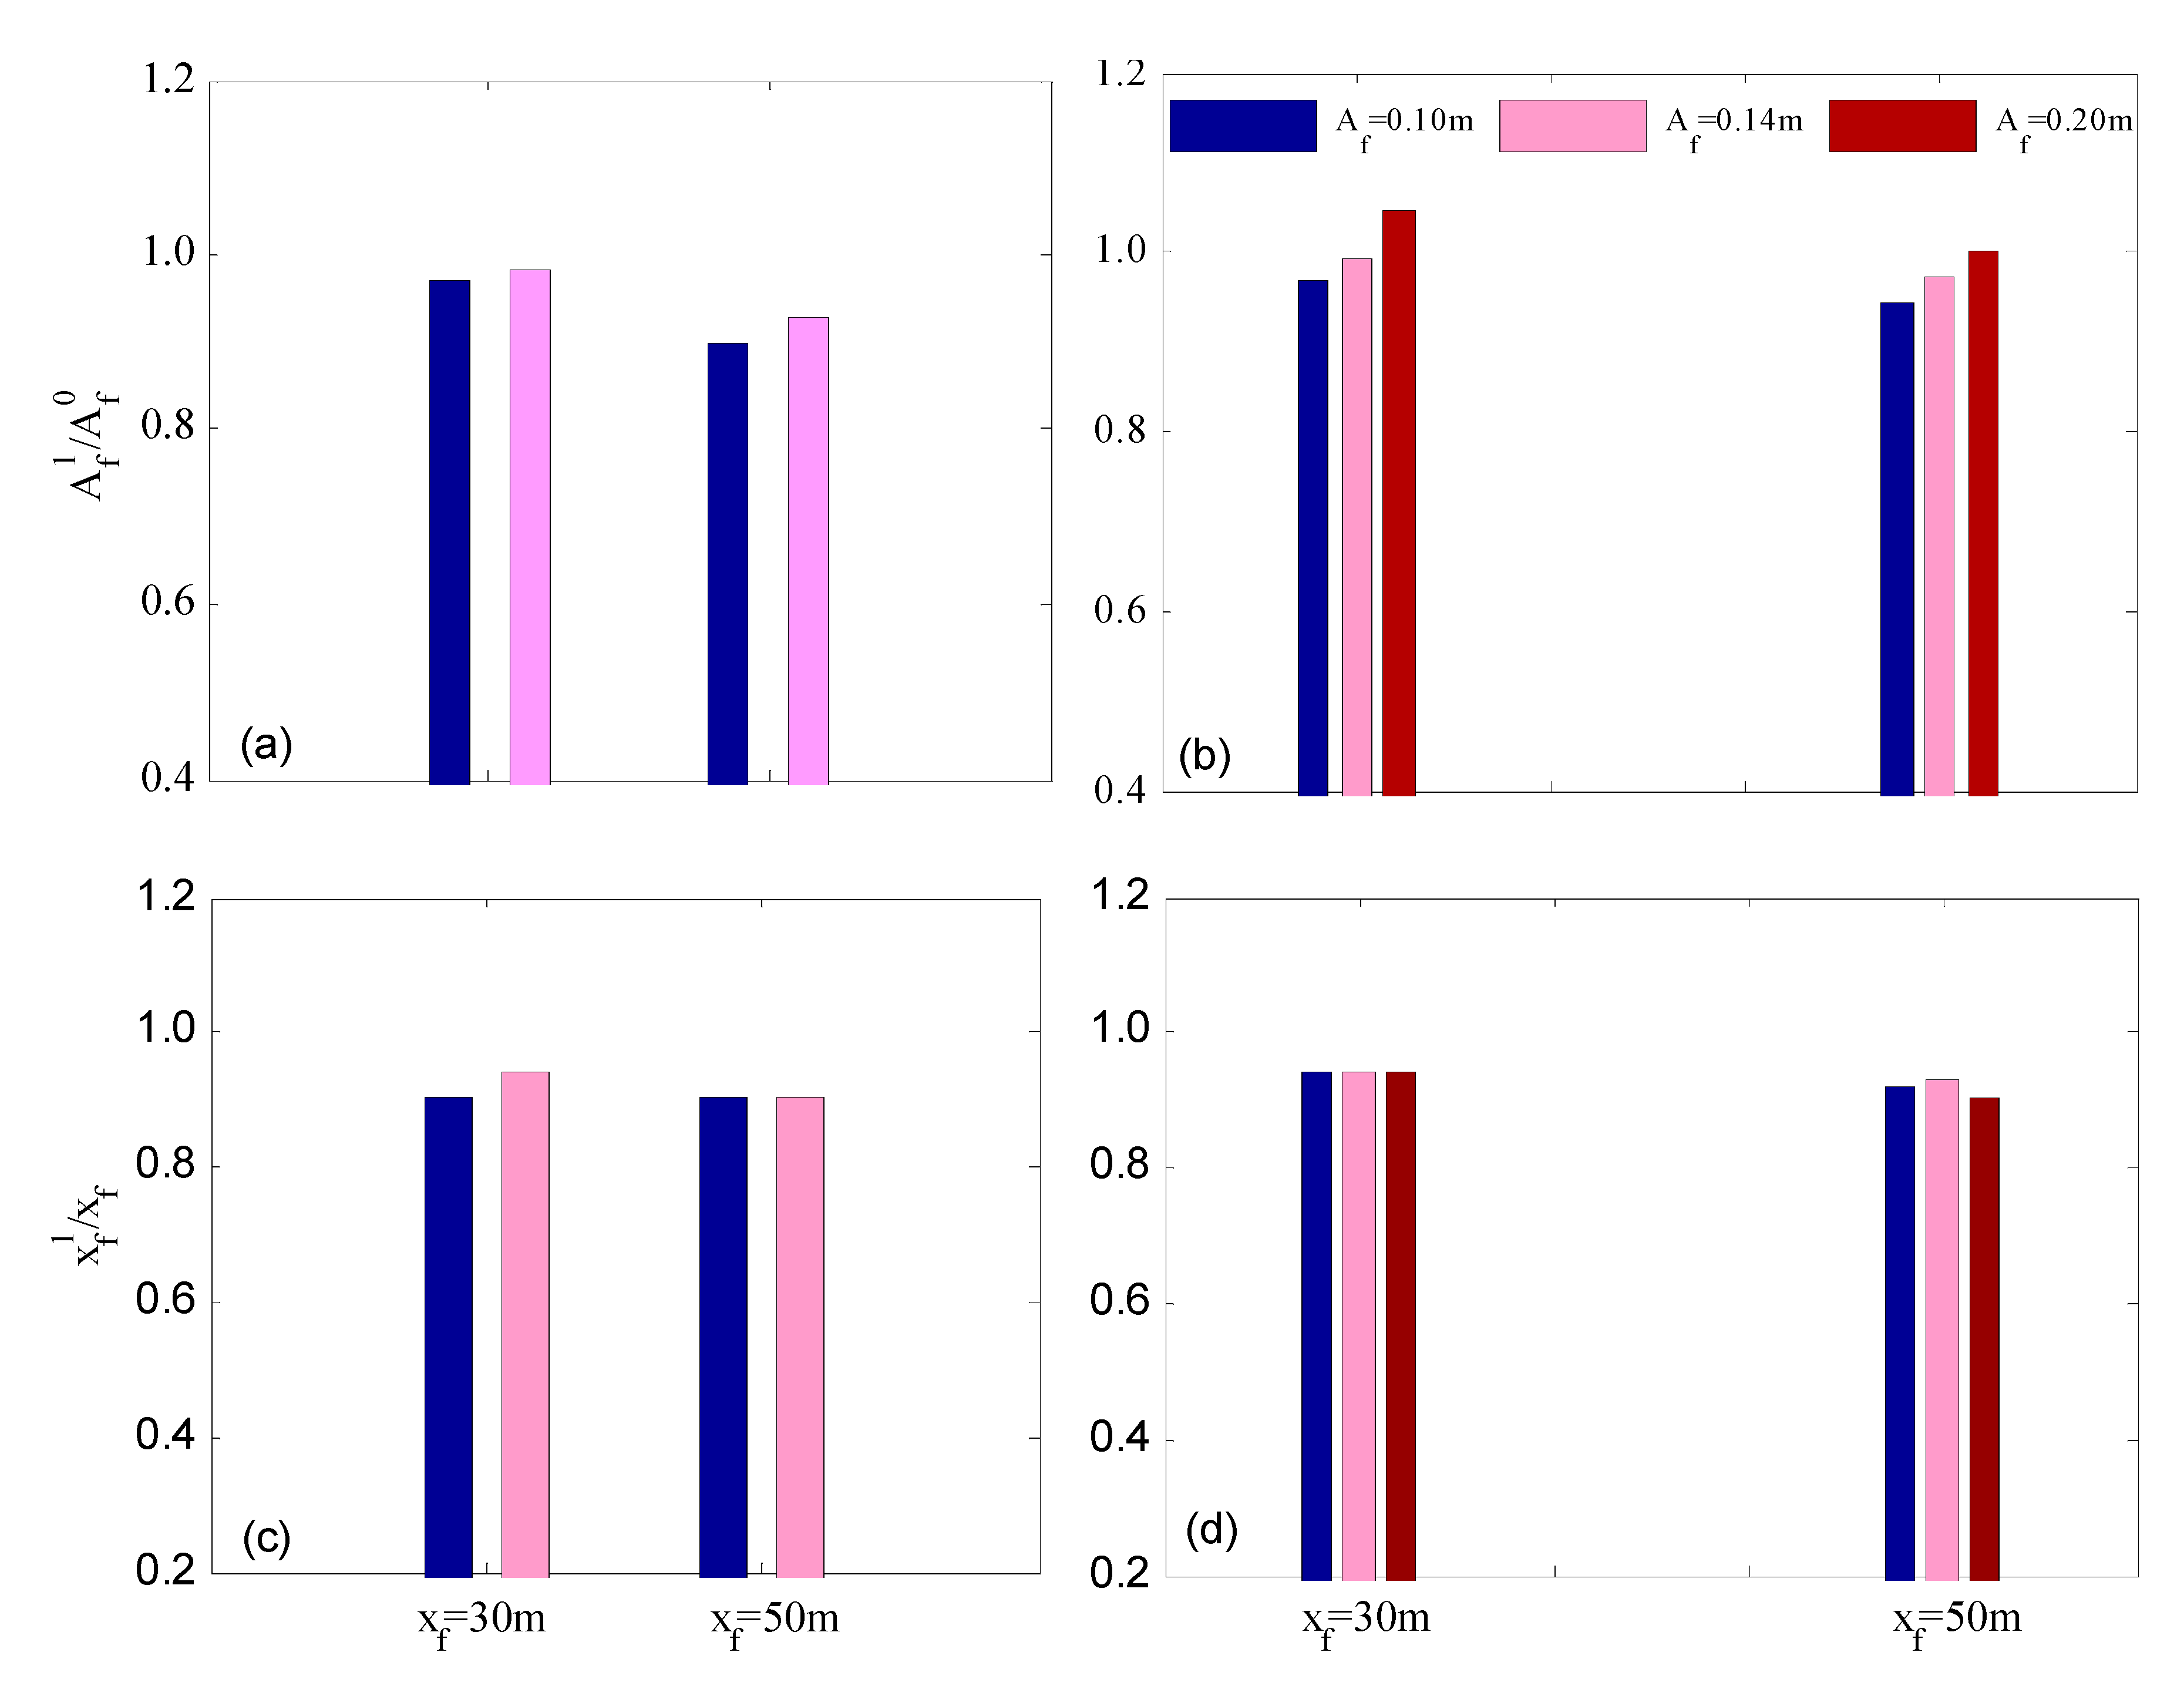
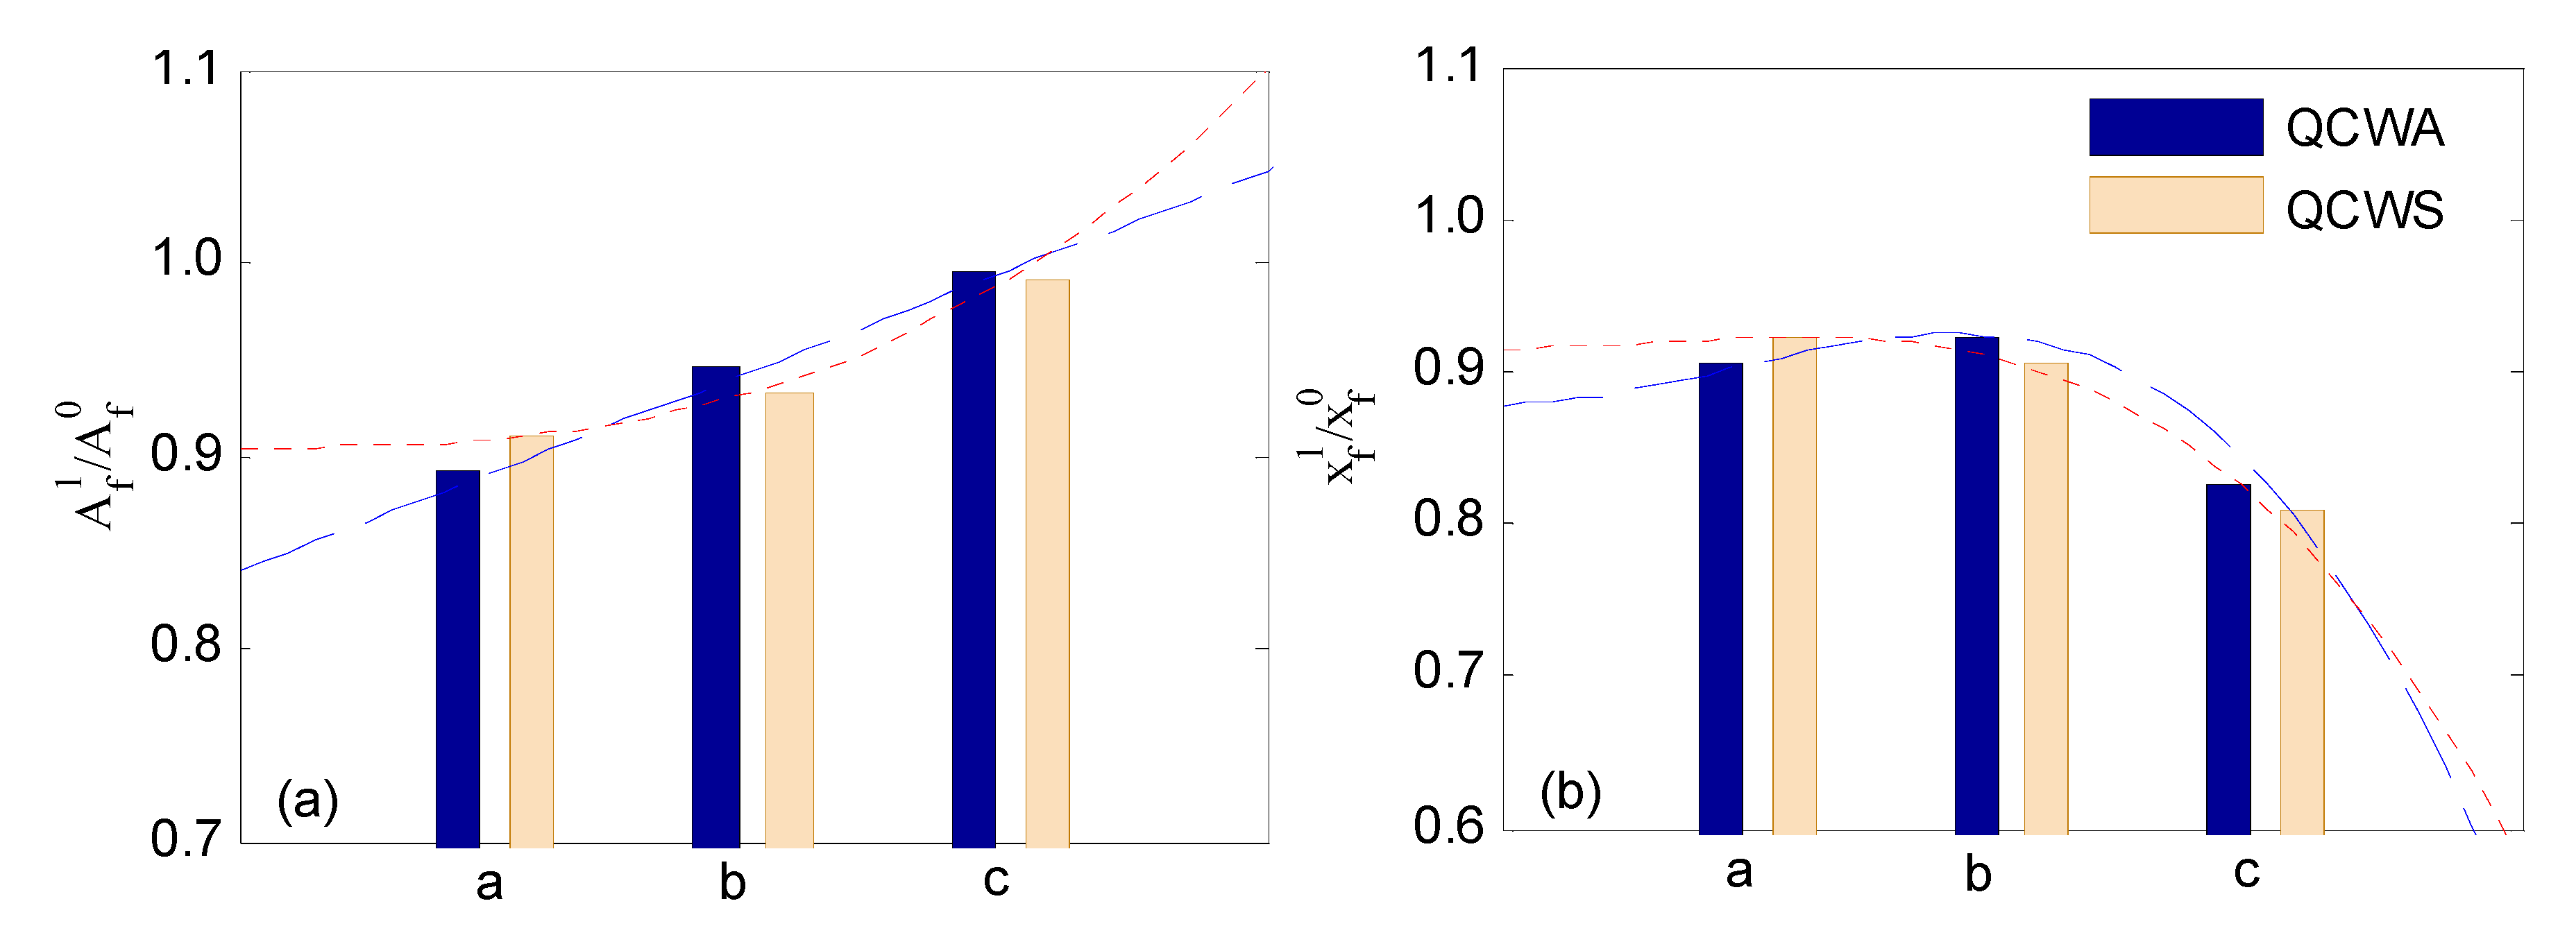
3.3. Focusing Wave Generation under Different Af and xf Parameters
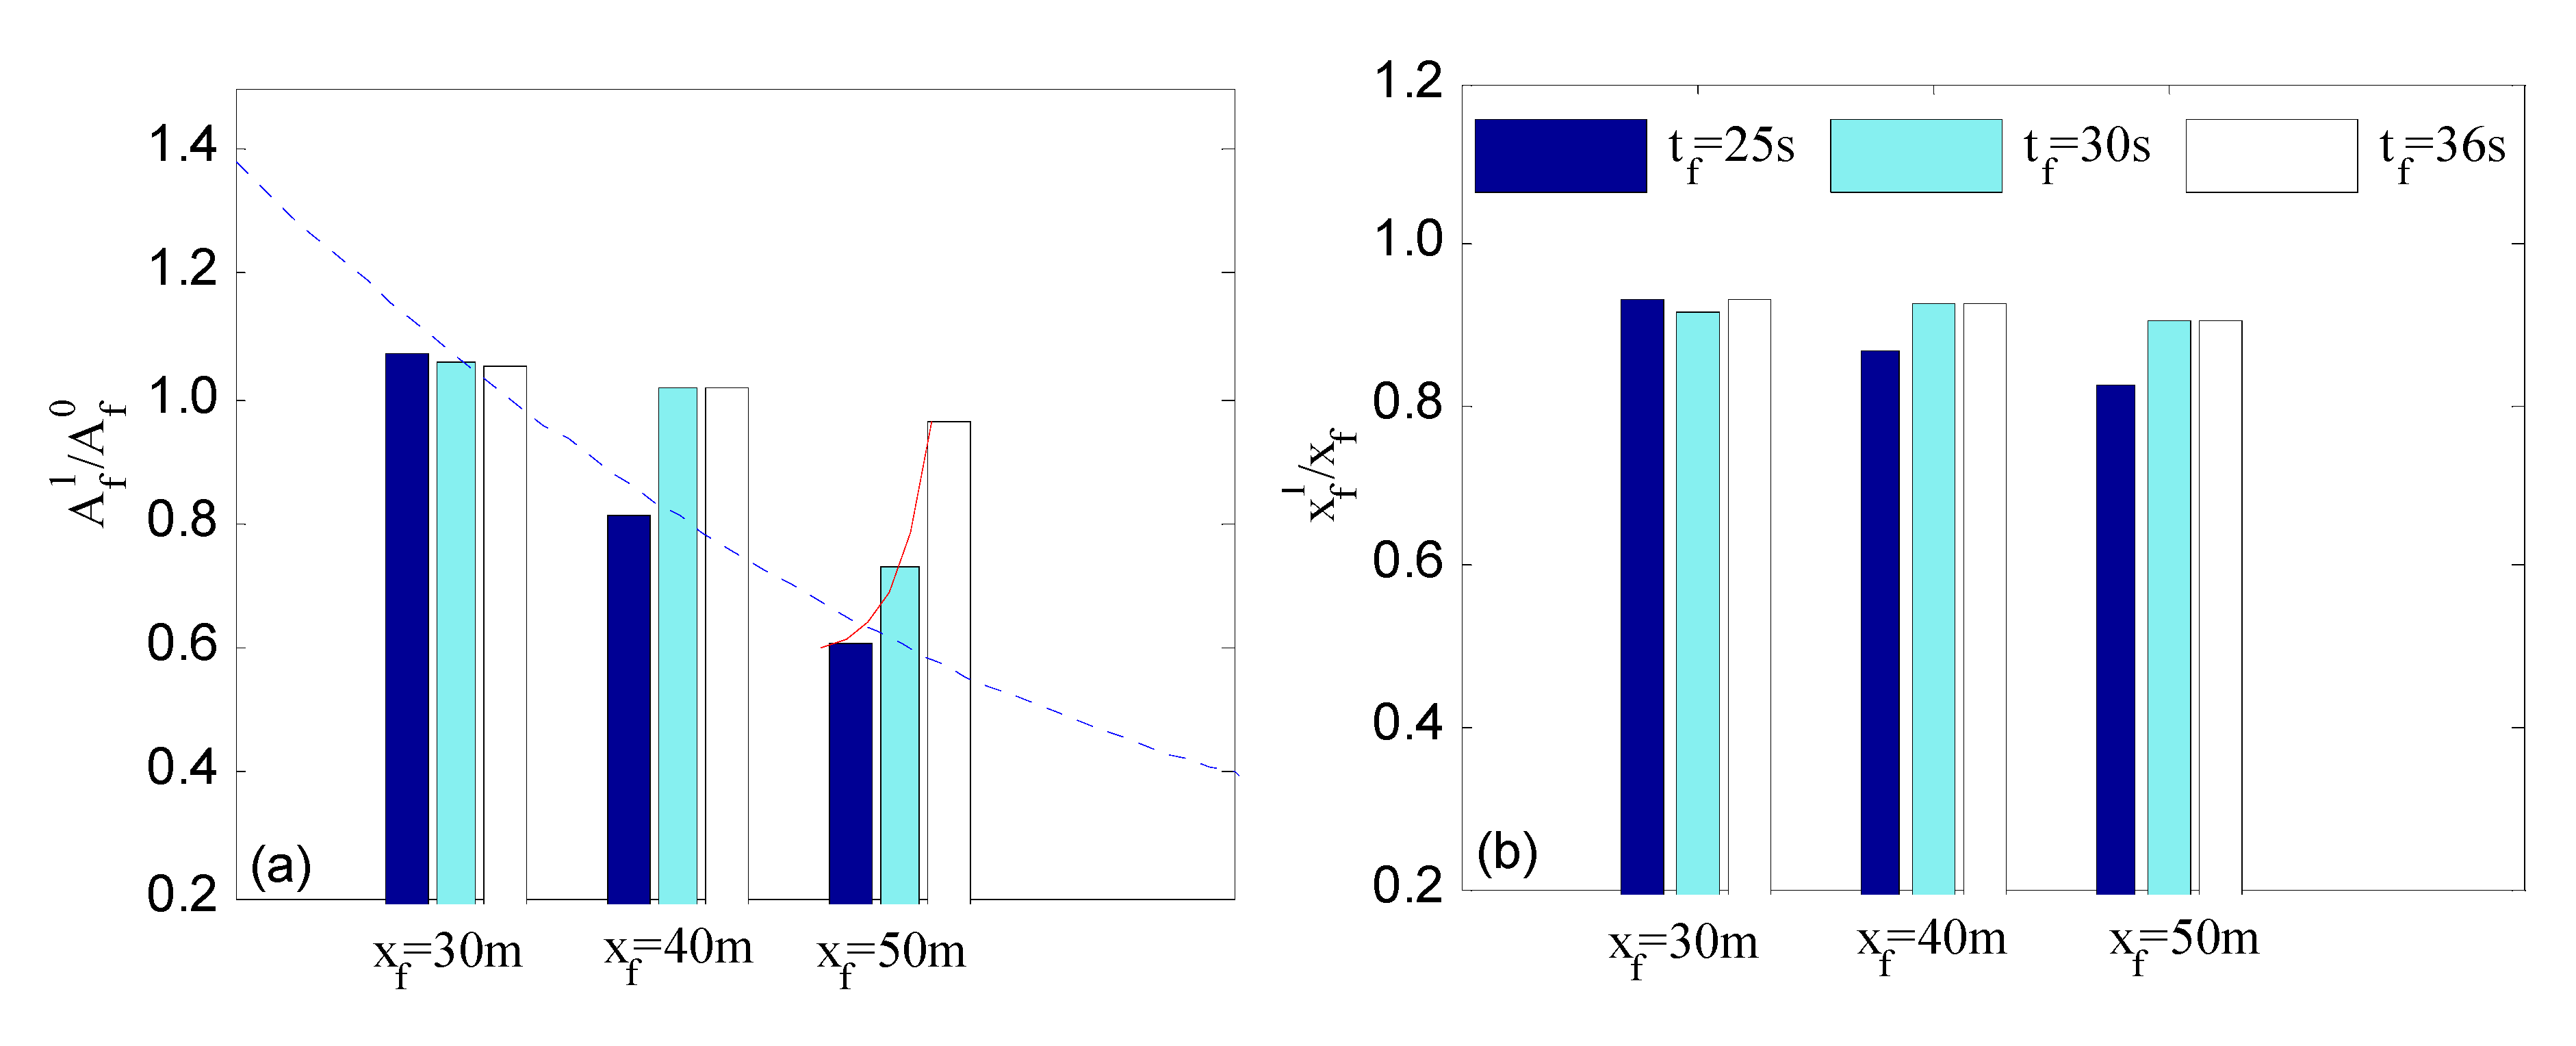
3.4. Focusing Wave Generation under Different xf and tf Parameters
4. Conclusions
Author Contributions
Funding
Acknowledgments
Conflicts of Interest
Nomenclature
| H | water depth | g | gravitational acceleration |
| kn | wave number | s0(t) | the inserted auxiliary signal |
| t0 | time length of s0(t) | an | wave component amplitude |
| μj | base function of s0(t) | η | wave-free surface elevation |
| tf | focusing time parameter | xf1 | the tested focusing position |
| N | wave component number | xf | focusing position parameter |
| χ | the coefficient matrix of s0(t) | ωN | the maximum wave frequency |
| tcr | the minimum focusing time | S(t) | Hydraulic piston stroke signal |
| ωn | wave component frequency | γ | the controlling parameter of s0(t) |
| ω1 | the minimum wave frequency | Af | focusing wave elevation parameter |
| Af1 | the tested focusing wave crest elevation | ||
| Er+(−) | the percentage error between η1+(−) and η2+(−) | ||
| s′0(t0)/s″0(t0) | the first- and second-order derivatives of s0(t) | ||
| ηmax | local maximum wave crest of tested focusing wave | ||
| s(0)/s′(0)/s″(0) | initial displacement, velocity, and acceleration of hydraulic piston | ||
| Af0 | focusing wave crest elevation predicted by linear wave theory | ||
| H0 | distance from hydraulic piston to wavemaker flap rotating shaft | ||
| H1 | distance from still water surface to wavemaker flap rotating shaft | ||
| Fn | transfer function between wave component and hydraulic polar stroke | ||
| η1+(−)/η2+(−) | the first and second tested focusing wave elevation (+, maximum; −, minimum) | ||
| λ | local wavelength computed by local wave period of tested focusing wave | ||
| CWS | constant wave steepness | QCWS | quasi constant wave steepness |
| CWA | constant wave amplitude | QCWA | quasi constant wave amplitude |
Appendix A

| No | Name | Inputting Parameters of Focusing Waves | |||||||
|---|---|---|---|---|---|---|---|---|---|
| Af (m) | Af0 (m) | tf (s) | Tf (s) | ωn (rad/s) | Xf (m) | BFI | |||
| 1 | A101f61X30t36 | 0.1 | 0.1145 | 36 | 1.7~6.3 | 0.997~3.696 | 30 | QCWA | 0.0057 |
| 2 | A101f41X30t36 | 0.1 | 0.1078 | 36 | 1.7~4.7 | 1.336~3.696 | 30 | QCWA | 0.00891 |
| 3 | A101f42X30t36 | 0.1 | 0.1099 | 36 | 2.0~4.7 | 1.336~3.142 | 30 | QCWA | 0.00898 |
| 4 | A101f41X30t25 | 0.1 | 0.1078 | 25 | 1.7~4.7 | 1.336~3.696 | 30 | QCWA | 0.00891 |
| 5 | A101f41X30t30 | 0.1 | 0.1078 | 30 | 1.7~4.7 | 1.336~3.696 | 30 | QCWA | 0.00891 |
| 6 | A141f61X30t36 | 0.14 | 0.1603 | 36 | 1.7~6.3 | 0.997~3.696 | 30 | QCWA | 0.0080 |
| 7 | A141f42X30t36 | 0.14 | 0.1539 | 36 | 2.0~4.7 | 1.336~3.142 | 30 | QCWA | 0.01257 |
| 8 | A201f42X30t40 | 0.2 | 0.2199 | 36 | 2.0~4.7 | 1.336~3.142 | 30 | QCWA | 0.01796 |
| 9 | A101f41X40t36 | 0.1 | 0.1078 | 36 | 1.7~4.7 | 1.336~3.696 | 40 | QCWA | 0.00891 |
| 10 | A101f41X40t25 | 0.1 | 0.1078 | 25 | 1.7~4.7 | 1.336~3.696 | 40 | QCWA | 0.00891 |
| 11 | A101f41X40t30 | 0.1 | 0.1078 | 30 | 1.7~4.7 | 1.336~3.696 | 40 | QCWA | 0.00891 |
| 12 | A101f61X50t36 | 0.1 | 0.1145 | 36 | 1.7~6.3 | 0.997~3.696 | 50 | QCWA | 0.0057 |
| 13 | A101f41X50t36 | 0.1 | 0.1078 | 36 | 1.7~4.7 | 1.336~3.696 | 50 | QCWA | 0.00891 |
| 14 | A101f42X50t36 | 0.1 | 0.1099 | 36 | 2.0~4.7 | 1.336~3.142 | 50 | QCWA | 0.00898 |
| 15 | A101f43X50t36 | 0.1 | 0.1201 | 36 | 3.0~4.7 | 1.336~2.094 | 50 | QCWA | 0.01160 |
| 16 | A101f41X50t25 | 0.1 | 0.1078 | 25 | 1.7~4.7 | 1.336~3.696 | 50 | QCWA | 0.00891 |
| 17 | A101f41X50t30 | 0.1 | 0.1078 | 30 | 1.7~4.7 | 1.336~3.696 | 50 | QCWA | 0.00891 |
| 22 | A141f61X50t36 | 0.14 | 0.1603 | 36 | 1.7~6.3 | 0.997~3.696 | 50 | QCWA | 0.0080 |
| 23 | A141f42X50t36 | 0.14 | 0.1539 | 36 | 2.0~4.7 | 1.336~3.142 | 50 | QCWA | 0.01257 |
| 24 | A201f42X50t36 | 0.2 | 0.2199 | 36 | 2.0~4.7 | 1.336~3.142 | 50 | QCWA | 0.01797 |
| 18 | A101f61X50t36c | 0.1 | 0.1270 | 36 | 1.7~6.3 | 0.997~3.696 | 50 | QCWS | 0.0140 |
| 19 | A101f41X50t36c | 0.1 | 0.1132 | 36 | 1.7~4.7 | 1.336~3.696 | 50 | QCWS | 0.0148 |
| 20 | A101f42X50t36c | 0.1 | 0.1145 | 36 | 2.0~4.7 | 1.336~3.142 | 50 | QCWS | 0.0141 |
| 21 | A101f43X50t36c | 0.1 | 0.1219 | 36 | 3.0~4.7 | 1.336~2.094 | 50 | QCWS | 0.0158 |
References
- Adcock, T.; Taylor, P. Focusing of unidirectional wave groups on deep water: An approximate nonlinear Schrödinger equation-based model. Proc. R. Soc. A 2009, 465, 3083–3120. [Google Scholar] [CrossRef]
- Schmittner, C.; Brouwer, J.; Henning, J. Application of focusing wave groups in model testing practice. In Proceedings of the 33rd International Conference on Ocean, Offshore and Arctic Engineering, San Francisco, CA, USA, 8–13 June 2014. [Google Scholar]
- Kharif, C.; Pelinovsky, E. Physical mechanisms of the rogue wave phenomenon. Eur. J. Mech. B Fluids 2003, 22, 603–634. [Google Scholar] [CrossRef]
- Manolidis, M.; Orzech, M.; Simeonov, J. Rogue Wave Formation in Adverse Ocean Current Gradients. J. Mar. Sci. Eng. 2019, 7, 26. [Google Scholar] [CrossRef]
- Steer, N.; McAllister, L.; Borthwick, G.; Van den Bremer, S. Experimental Observation of Modulational Instability in Crossing Surface Gravity Wavetrains. Fluids 2019, 4, 105. [Google Scholar] [CrossRef]
- Yan, S.; Ma, Q. Numerical simulation of interaction between wind and 2D freak waves. Eur. J. Mech. B Fluids 2010, 29, 18–31. [Google Scholar] [CrossRef]
- Mori, N.; Liu, P.C.; Yasuda, T. Analysis of freak wave measurements in the Sea of Japan. Ocean Eng. 2002, 29, 1399–1414. [Google Scholar] [CrossRef]
- Kokorina, A.; Slunyaev, A. Lifetimes of Rogue Wave Events in Direct Numerical Simulations of Deep-Water Irregular Sea Waves. Fluids 2019, 4, 70. [Google Scholar] [CrossRef]
- Cui, C.; Zhang, N.; Yu, Y.; Li, J. Numerical Study on the Effects of Uneven Bottom Topography on Freak Waves. Ocean Eng. 2012, 54, 132–141. [Google Scholar] [CrossRef]
- Clauss, G.; Stempinski, F.; Stuck, R. On Modelling Kinematics of Steep Irregular Seaway and Freak Waves. In Proceedings of the 27th International Conference on Offshore Mechanics and Arctic Engineering, Berlin, Germany, 15–20 June 2008. [Google Scholar]
- Pang, H.; An, Z. Wavelet transform analysis of freak waves and the ringing response of vertical cylinder in a numerical wave tank. In Proceedings of the 19th International Offshore and Polar Engineering Conference, Osaka, Japan, 26 June 2009. [Google Scholar]
- Fonseca, N.; Soares, C.; Pascoal, R. Global loads on a FPSO induced by a set of freak waves. J. Offshore Mech. Arct. Eng. Trans. ASME 2009, 131, 011103. [Google Scholar] [CrossRef]
- Yan, B.; Luo, M.; Bai, W. An Experimental and Numerical Study of Plunging Wave Impact on a Box-Shape Structure. Mar. Struct. 2019, 66, 272–287. [Google Scholar] [CrossRef]
- Hu, Z.; Tang, W.; Xue, H. A Probability-Based Superposition Model of Freak Wave Simulation. Appl. Ocean Res. 2014, 47, 284–290. [Google Scholar] [CrossRef]
- Yan, S.; Ma, Q. Improved Model for Air Pressure Due to Wind On 2D Freak Waves in Finite Depth. Eur. J. Mech. B Fluids 2011, 30, 1–11. [Google Scholar] [CrossRef]
- Dyachenko, A.; Zakharov, V. On the Formation of Freak Waves on the Surface of Deep Water. JETP Lett. 2009, 88, 307–311. [Google Scholar] [CrossRef]
- Rapp, R.; Melville, W. Laboratory measurements of deep water breaking waves. Philos. Trans. R. Soc. A Math. Phys. Eng. Sci. 1990, A331, 735–800. [Google Scholar] [CrossRef]
- Pei, Y.; Zhang, N.; Zhang, Y. Efficient Generation of Freak Waves in Laboratory. China Ocean Eng. 2007, 3, 515–523. [Google Scholar]
- Baldock, T.; Swan, C.; Taylor, P. A laboratory study of nonlinear surface waves on water. Philos. Trans. R. Soc. A Math. Phys. Eng. Sci. 1996, 354, 649–676. [Google Scholar]
- Li, J.; Wang, Z.; Liu, S. Experimental Study of Interactions between Multi-Directional Focused Wave and Vertical Circular Cylinder, Part I: Wave Run-Up. Coast Eng. 2012, 64, 151–160. [Google Scholar] [CrossRef]
- Ma, Q. Numerical Generation of Freak Waves Using MLPG_R and QALE-FEM Methods. CMES-Comp. Model. Eng. Sci. 2007, 18, 223–234. [Google Scholar]
- Ning, D.; Zang, J.; Liu, S.; Eatock, T.; Teng, B.; Taylor, P. Free-Surface Evolution and Wave Kinematics for Nonlinear Uni-Directional Focused Wave Groups. Ocean Eng. 2009, 36, 1226–1243. [Google Scholar] [CrossRef]
- Fochesato, C.; Grilli, S.; Dias, F. Numerical Modeling of Extreme Rogue Waves Generated by Directional Energy Focusing. Wave Motion 2007, 44, 395–416. [Google Scholar] [CrossRef]
- Ai, C.; Ding, W.; Jin, S. A General Boundary-Fitted 3D Non-Hydrostatic Model for Nonlinear Focusing Wave Groups. Ocean Eng. 2014, 89, 134–145. [Google Scholar] [CrossRef]
- Benjamin, T.; Feir, J. The disintegration of wave trains on deep water Part 1—Theory. J. Fluid Mech. 1967, 27, 417–430. [Google Scholar] [CrossRef]
- Janssen, P. Nonlinear Four-Wave Interactions and Freak Waves. J. Phys. Oceanogr. 2003, 33, 863–884. [Google Scholar] [CrossRef]
- Onorato, M.; Osborne, A.; Serio, M.; Cavaleri, L.; Brandini, C.; Stansberg, C. Extreme Waves, Modulational Instability and Second Order Theory: Wave Flume Experiments on Irregular Waves. Eur. J. Mech. B Fluids 2006, 25, 586–601. [Google Scholar] [CrossRef]
- Manzetti, S. Mathematical Modeling of Rogue Waves: A Survey of Recent and Emerging Mathematical Methods and Solutions. Axioms 2018, 7, 42. [Google Scholar] [CrossRef]
- Deng, Y.; Yang, J.; Li, X.; Xiao, L. Experimental and numerical investigation on kinematics of freak waves. In Proceedings of the 25th International Ocean and Polar Engineering Conference, Kona, Big Island, HI, USA, 21–26 June 2015. [Google Scholar]
- Deng, Y.; Yang, J.; Zhao, W.; Xiao, L.; Li, X. An efficient focusing model of focusing wave generation considering wave reflection effects. Ocean Eng. 2015, 105, 125–135. [Google Scholar] [CrossRef]
- Whittaker, C.; Fitzgerald, C.; Raby, A.; Taylor, P.; Borthwick, A. Extreme coastal responses using focused wave groups: Overtopping and horizontal forces exerted on an inclined seawall. Coast Eng. 2018, 140, 292–305. [Google Scholar] [CrossRef]
- Touboul, J.; Giovanangeli, J.; Kharif, C.; Pelinovsky, E. Freak waves under the action of wind: Experiments and simulations. Eur. J. Mech. B Fluids 2006, 25, 662–676. [Google Scholar] [CrossRef]
- Li, J.; Yang, J.; Liu, S.; Ji, X. Wave Groupiness Analysis of the Process of 2D Freak Wave Generation in Random Wave Trains. Ocean Eng. 2015, 104, 480–488. [Google Scholar] [CrossRef]
- Chabchoub, A.; Hoffmann, N.; Onorato, M.; Akhmediev, N. Super rogue waves: Observation of a higher-order breather in water waves. Phys. Rev. X 2012, 2, 11015. [Google Scholar] [CrossRef]
- Chabchoub, A.; Peri, R.; Hoffmann, N. Dynamics of Unstable Stokes Waves: A Numerical and Experimental Study. In Proceedings of the 33rd International Conference on Ocean, Offshore and Arctic Engineering, San Francisco, CA, USA, 8–13 June 2014. [Google Scholar]
- Onorato, M.; Residori, S.; Bortolozzo, U.; Montina, A.; Arecchi, F. Rogue Waves and their Generating Mechanisms in Different Physical Contexts. Phys. Rep. 2013, 528, 47–89. [Google Scholar] [CrossRef]
- Clauss, G.; Schmittner, C.; Klein, M. Generation of rogue waves with predefined steepness. In Proceedings of the 25th International Conference on Offshore Mechanics and Arctic Engineering, Hamburg, Germany, 4–9 June 2006. [Google Scholar]
- Fernández, H.; Sriram, V.; Schimmels, S.; Oumeraci, H. Extreme wave generation using self correcting method—Revisited. Coast Eng. 2014, 93, 15–31. [Google Scholar]
- Deng, Y.; Yang, J.; Tian, X.; Li, X.; Xiao, L. An experimental study on deterministic freak waves: Generation, propagation and local energy. Ocean Eng. 2016, 118, 83–92. [Google Scholar] [CrossRef]
- Liu, S.; Sun, Y.; Li, J.; Zang, J. Experimental Study on 2-D Focusing Wave Run-up on A Vertical Cylinder. China Ocean Eng. 2010, 24, 499–512. [Google Scholar]
- Ma, Y.; Dong, G.; Liu, S.; Zang, J.; Li, J.; Sun, Y. Laboratory study of unidirectional focusing waves in intermediate depth water. J. Eng. Mech. 2010, 136, 78–90. [Google Scholar] [CrossRef]
- Wu, C.; Yao, A. Laboratory measurements of limiting freak waves on currents. J. Geophys. Res. 2004, 109, C12002. [Google Scholar] [CrossRef]
- Clauss, G.; Klein, M. Experimental investigation on the vertical bending moment in extreme sea states for different hulls. Ocean Eng. 2016, 119, 181–192. [Google Scholar] [CrossRef]
- Liang, S.; Zhang, Y.; Sun, Z.; Chang, Y. Laboratory study on the evolution of waves parameters due to wave breaking in deep water. Wave Motion 2017, 68, 31–42. [Google Scholar] [CrossRef]
- Xu, G. Research on Generation of Freak Wave and Its Effect on Truss SPAR Motions. Ph.D. Thesis, Harbin Engineering University, Harbin, China, 2016. [Google Scholar]
- Gramstad, O. Modulational Instability in JONSWAP Sea States Using the Alber Equation. In Proceedings of the 36th International Conference on Ocean, Offshore and Arctic Engineering, Trondheim, Norway, 25–30 June 2017. [Google Scholar]
- Li, J.; Li, P.; Liu, S. Observations of Freak Waves in Random Wave Field in 2D Experimental Wave Flume. China Ocean Eng. 2013, 5, 659–670. [Google Scholar] [CrossRef]
- Cui, C.; Zhang, N. Research on the time-Frequency energy structure of freak wave generation and evolution. In Proceedings of the 30th International Conference on Ocean, Offshore and Arctic Engineering, Rotterdam, The Netherlands, 19–24 June 2011. [Google Scholar]
- Yan, S.; Ma, Q. Numerical study on significance of wind action on 2-D freak waves with different parameters. J. Mar. Sci. Tech. TAIW 2012, 20, 9–17. [Google Scholar]
- Li, J.; Liu, S. Focused Wave Properties Based on A High Order Spectral Method with A Non-Periodic Boundary. China Ocean Eng. 2015, 29, 1–16. [Google Scholar] [CrossRef]
- Hennig, J.; Schmittner, C. Experimental variation of focusing wave groups for the investigation of their predictability. In Proceedings of the 28th International Conference on Ocean, Offshore and Arctic Engineering, Honolulu, HI, USA, 31 May–5 June 2009. [Google Scholar]


| No | an | ωn (rad/s) | Smax (m) | SQCWSmax/SQCWAmax |
|---|---|---|---|---|
| 1-1 | QCWA | 0.997~3.696 | 0.202 | 1.834 |
| QCWS | 0.371 | |||
| 2-a | QCWA | 1.336~3.696 | 0.127 | 1.772 |
| QCWS | 0.225 | |||
| 3-b | QCWA | 1.336~3.142 | 0.164 | 1.518 |
| QCWS | 0.249 | |||
| 4-c | QCWA | 1.336~2.094 | 0.387 | 1.062 |
| QCWS | 0.411 | |||
| Af = 0.1 m; xf = 50 m; tf = 36 s; N = 32 | ||||
© 2019 by the authors. Licensee MDPI, Basel, Switzerland. This article is an open access article distributed under the terms and conditions of the Creative Commons Attribution (CC BY) license (http://creativecommons.org/licenses/by/4.0/).
Share and Cite
Xu, G.; Hao, H.; Ma, Q.; Gui, Q. An Experimental Study of Focusing Wave Generation with Improved Wave Amplitude Spectra. Water 2019, 11, 2521. https://doi.org/10.3390/w11122521
Xu G, Hao H, Ma Q, Gui Q. An Experimental Study of Focusing Wave Generation with Improved Wave Amplitude Spectra. Water. 2019; 11(12):2521. https://doi.org/10.3390/w11122521
Chicago/Turabian StyleXu, Guochun, Hongbin Hao, Qingwei Ma, and Qinqin Gui. 2019. "An Experimental Study of Focusing Wave Generation with Improved Wave Amplitude Spectra" Water 11, no. 12: 2521. https://doi.org/10.3390/w11122521
APA StyleXu, G., Hao, H., Ma, Q., & Gui, Q. (2019). An Experimental Study of Focusing Wave Generation with Improved Wave Amplitude Spectra. Water, 11(12), 2521. https://doi.org/10.3390/w11122521