Abstract
The assessment of water withdrawals for irrigation is essential for managing water resources in cultivated tropical catchments. These water withdrawals vary seasonally, driven by wet and dry seasons. A land use map is one of the required inputs of hydrological models used to estimate water withdrawals in a catchment. However, land use maps provide typically static information and do not represent the hydrological seasons and related cropping seasons and practices throughout the year. Therefore, this study assesses the value of seasonal land use maps in the quantification of water withdrawals for a tropical cultivated catchment. We developed land use maps for the main seasons (long rains, dry, and short rains) for the semi-arid Kikuletwa catchment, Tanzania. Three Landsat 8 images from 2016 were used to develop seasonal land use land cover (LULC) maps: March (long rains), August (dry season), and October (short rains). Quantitative and qualitative observation data on cropping systems (reference points and questionnaires/surveys) were collected and used for the supervised classification algorithm. Land use classifications were done using 20 land use and land cover classes for the wet season image and 19 classes for the dry and short rain season images. Water withdrawals for irrigated agriculture were calculated using (1) the static land use map or (2) the three seasonal land use maps. Clear differences in land use can be seen between the dry and the other seasons and between rain-fed and irrigated areas. A difference in water withdrawals was observed when seasonal and static land use maps were used. The highest differences were obtained for irrigated mixed crops, with an estimation of 572 million m3/year when seasonal dynamic maps were used and only 90 million m3/year when a static map was used. This study concludes that detailed seasonal land use maps are essential for quantifying annual irrigation water use of catchment areas with distinct dry and wet seasonal dynamics.
1. Introduction
Spatial and temporal distributed information of land use and cover (LULC) is essential in understanding agro-hydrological processes, such as water use, climate change, food security, and plant diseases [1]. Land cover refers to the vegetation and artificial construction covering the land surface [2]. It is generally assumed that land cover is unlikely to change within a single year. The land cover change is usually associated with long-term changes due to developments and land use planning in the area. On the other hand, land use refers to manmade socio-economic activities and management practices on the land [2]. Anthropogenic activities may change during a year depending on the season, especially on cultivated lands. The seasonal change of LULC is referred to as seasonal LULC dynamics.
Information on LULC is needed to quantify water use and withdrawals for irrigated areas, natural ecosystems [3], and water depletion in terms of evapotranspiration [4,5], which can be estimated by using hydrological models, such as the Soil and Water Assessment Tool [6,7], Spatial Tools for River basin Environmental Analysis and Management (STREAM) [8], or via water balance or water accounting techniques using remote sensing data [9,10].
For example, the water used by different crops was estimated by evapotranspiration-precipitation (ET-P) in the Colorado river basin [11]. A static land use map was used for identifying crop areas; however, the authors acknowledge the importance of seasonal land use dynamics.
Identifying the seasonal variability of LULC could help in improving the assessment of water withdrawals. In most studies, the seasonal variability of land use has been studied by analyzing data on the normalized difference vegetation index (NDVI) and leaf area index (LAI) [12,13] and not by seasonal LULC mapping. Different plants or crops may have similar NDVI values and as a result, may fall in the same NDVI classes, making it difficult to differentiate between different crops that might have different water consumption rates and different water requirements [14,15].
In Sub-Saharan Africa, few detailed land use mapping studies have been conducted (e.g., Ethiopia [16,17,18], East Africa [15], Egypt [19], and West Africa [13,20]. Most of these studies produced land use maps lacking detailed information on seasonal agricultural land use change. Currently, global LULC maps exist, with a spatial resolution ranging from 30 to 300 m [21,22], but a medium to high resolution (30 m or finer) is needed to represent the high spatial variability of agricultural land use and their water management practices in Sub-Saharan Africa catchments [23]. Regional and global land use maps that have been used for water resources lack that resolution, for instance, the LULC map of the upper Pangani river basin [15] and Incomati river basin [3].
In this paper, we assessed seasonal land use maps for the quantification of water withdrawals in a tropical catchment. We used Landsat 8 images with a resolution of 30 m and secondary information regarding the cropping calendar and agricultural water management practices in the Kikuletwa catchment to develop seasonal LULC maps. Maps were then used to quantify irrigation water withdrawals using a water balance technique, specifically P-ET. This research addressed the following questions:
- What are the primary land use classes that change seasonally in the Kikuletwa river basin? and
- Is there a difference in the estimated water withdrawals from agricultural land uses when seasonal versus static land use maps are used?
2. Methods
2.1. Study Area
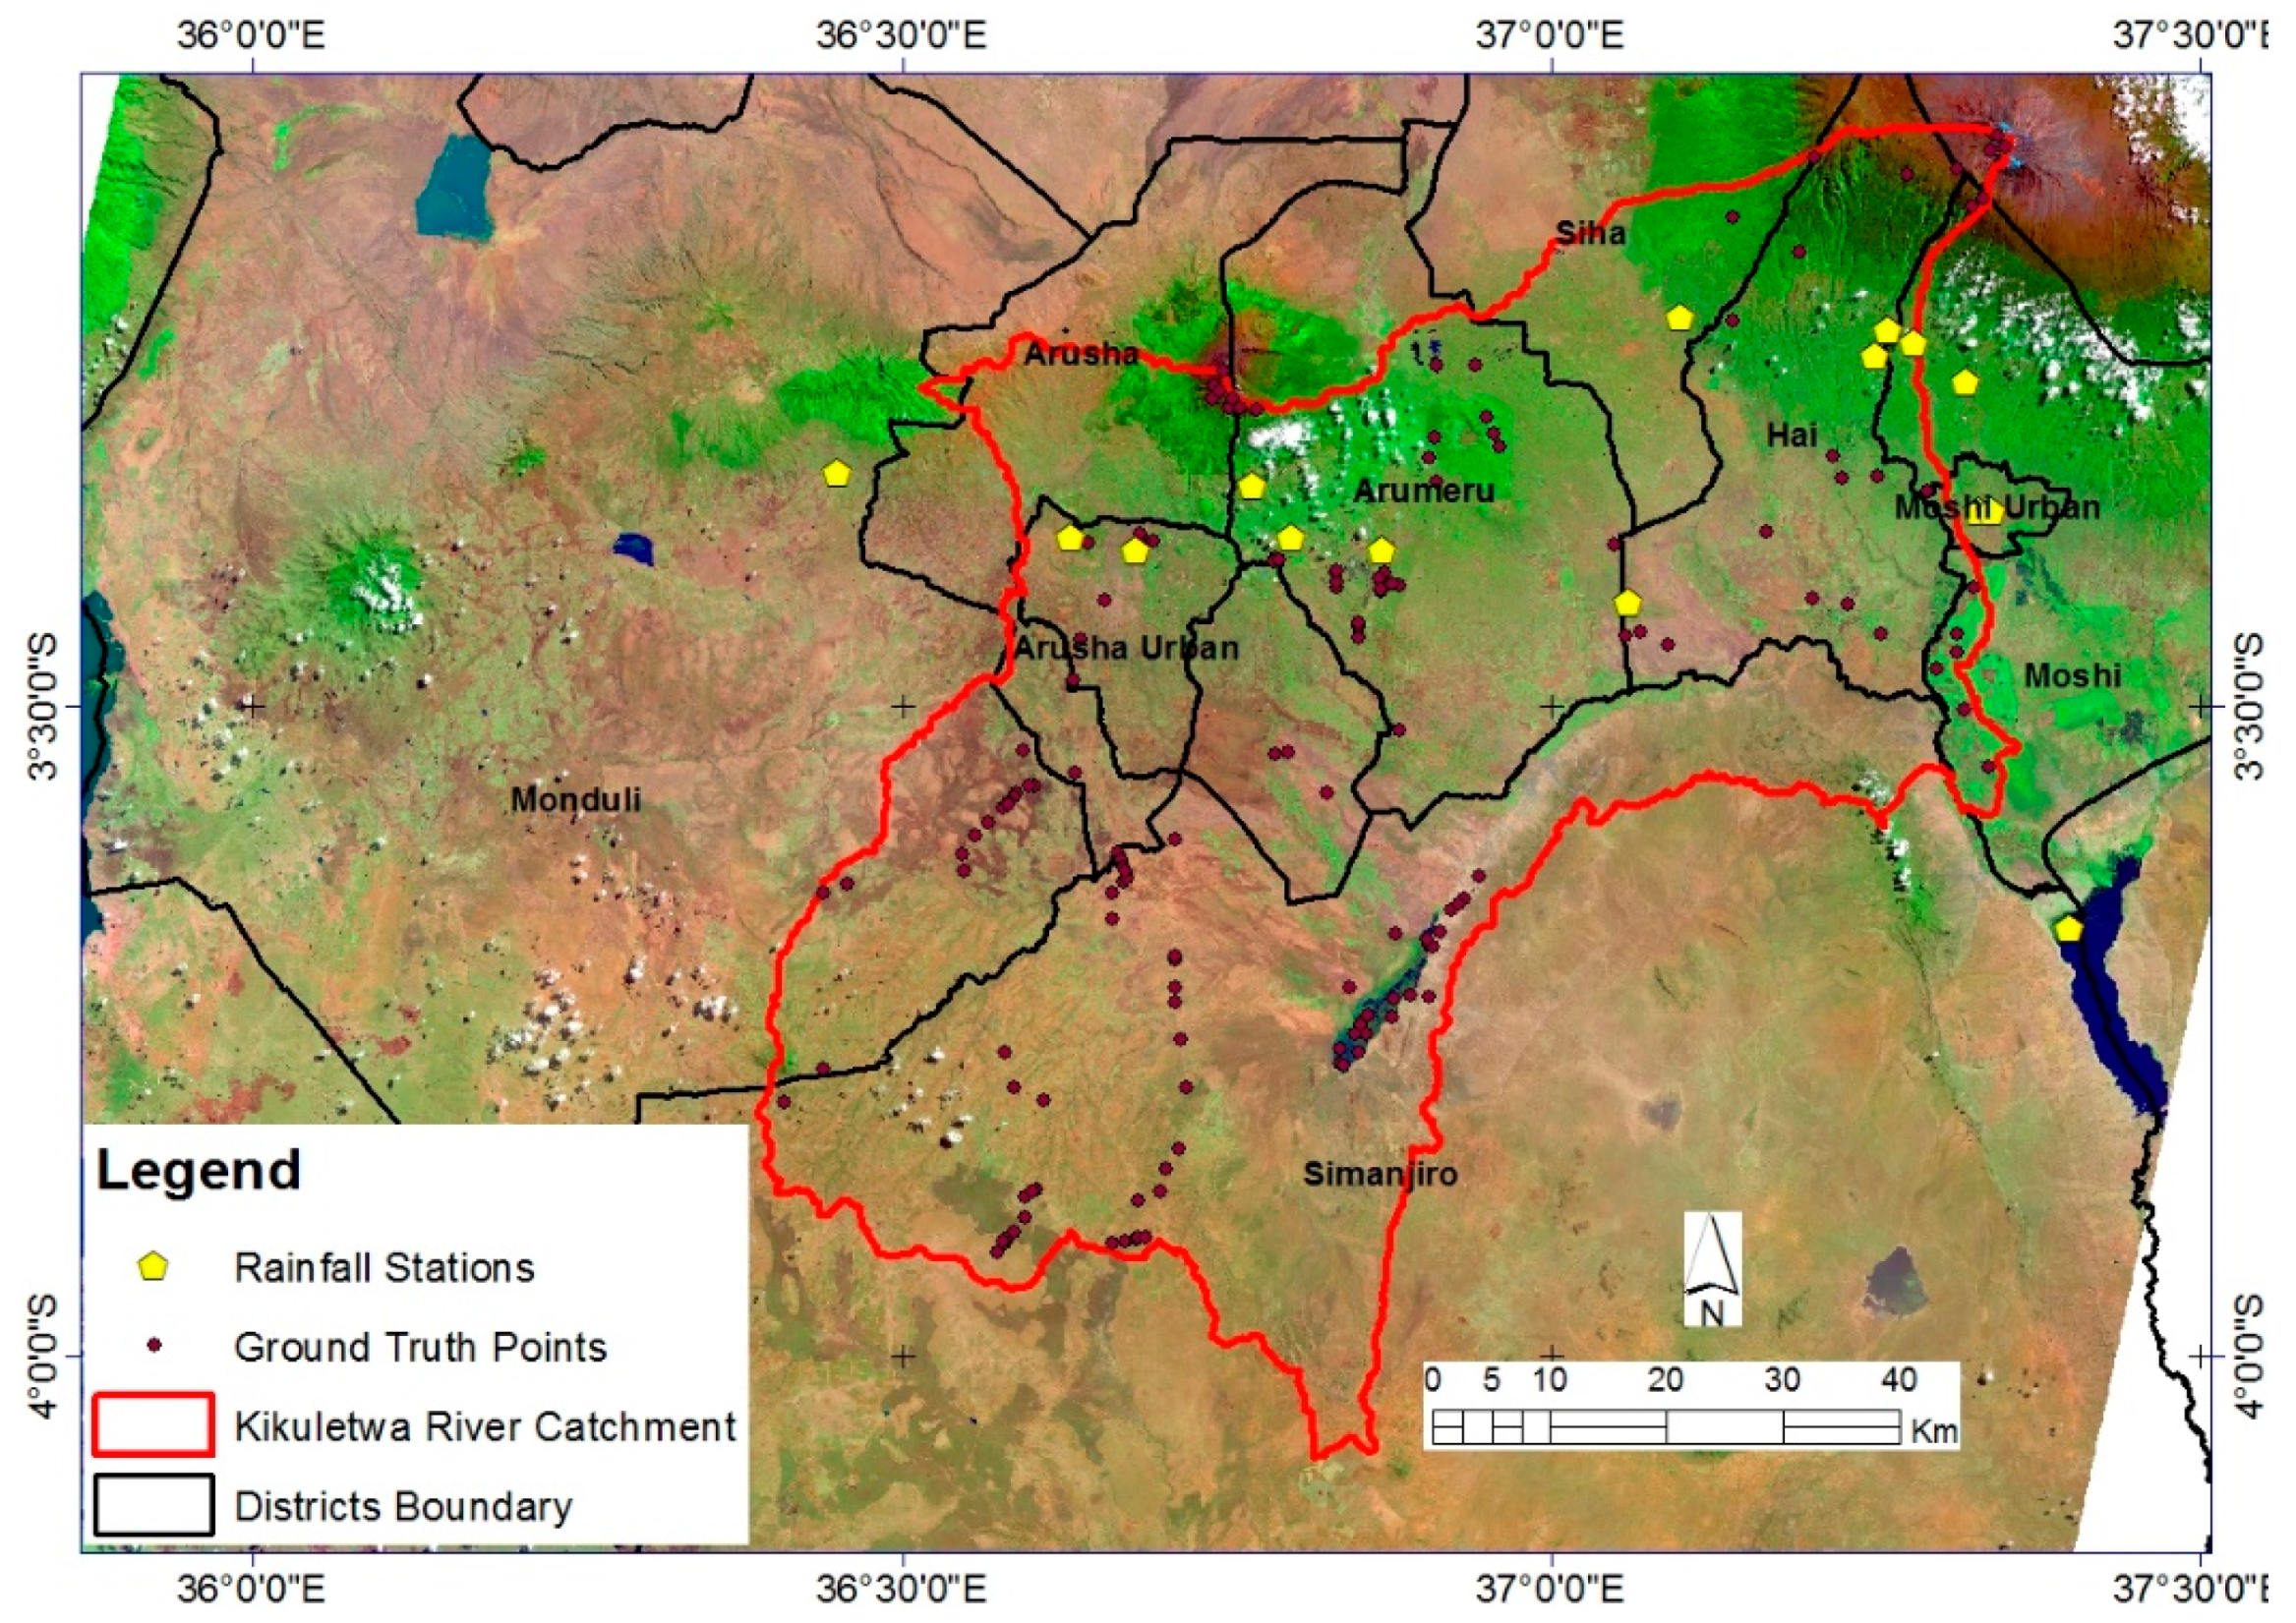
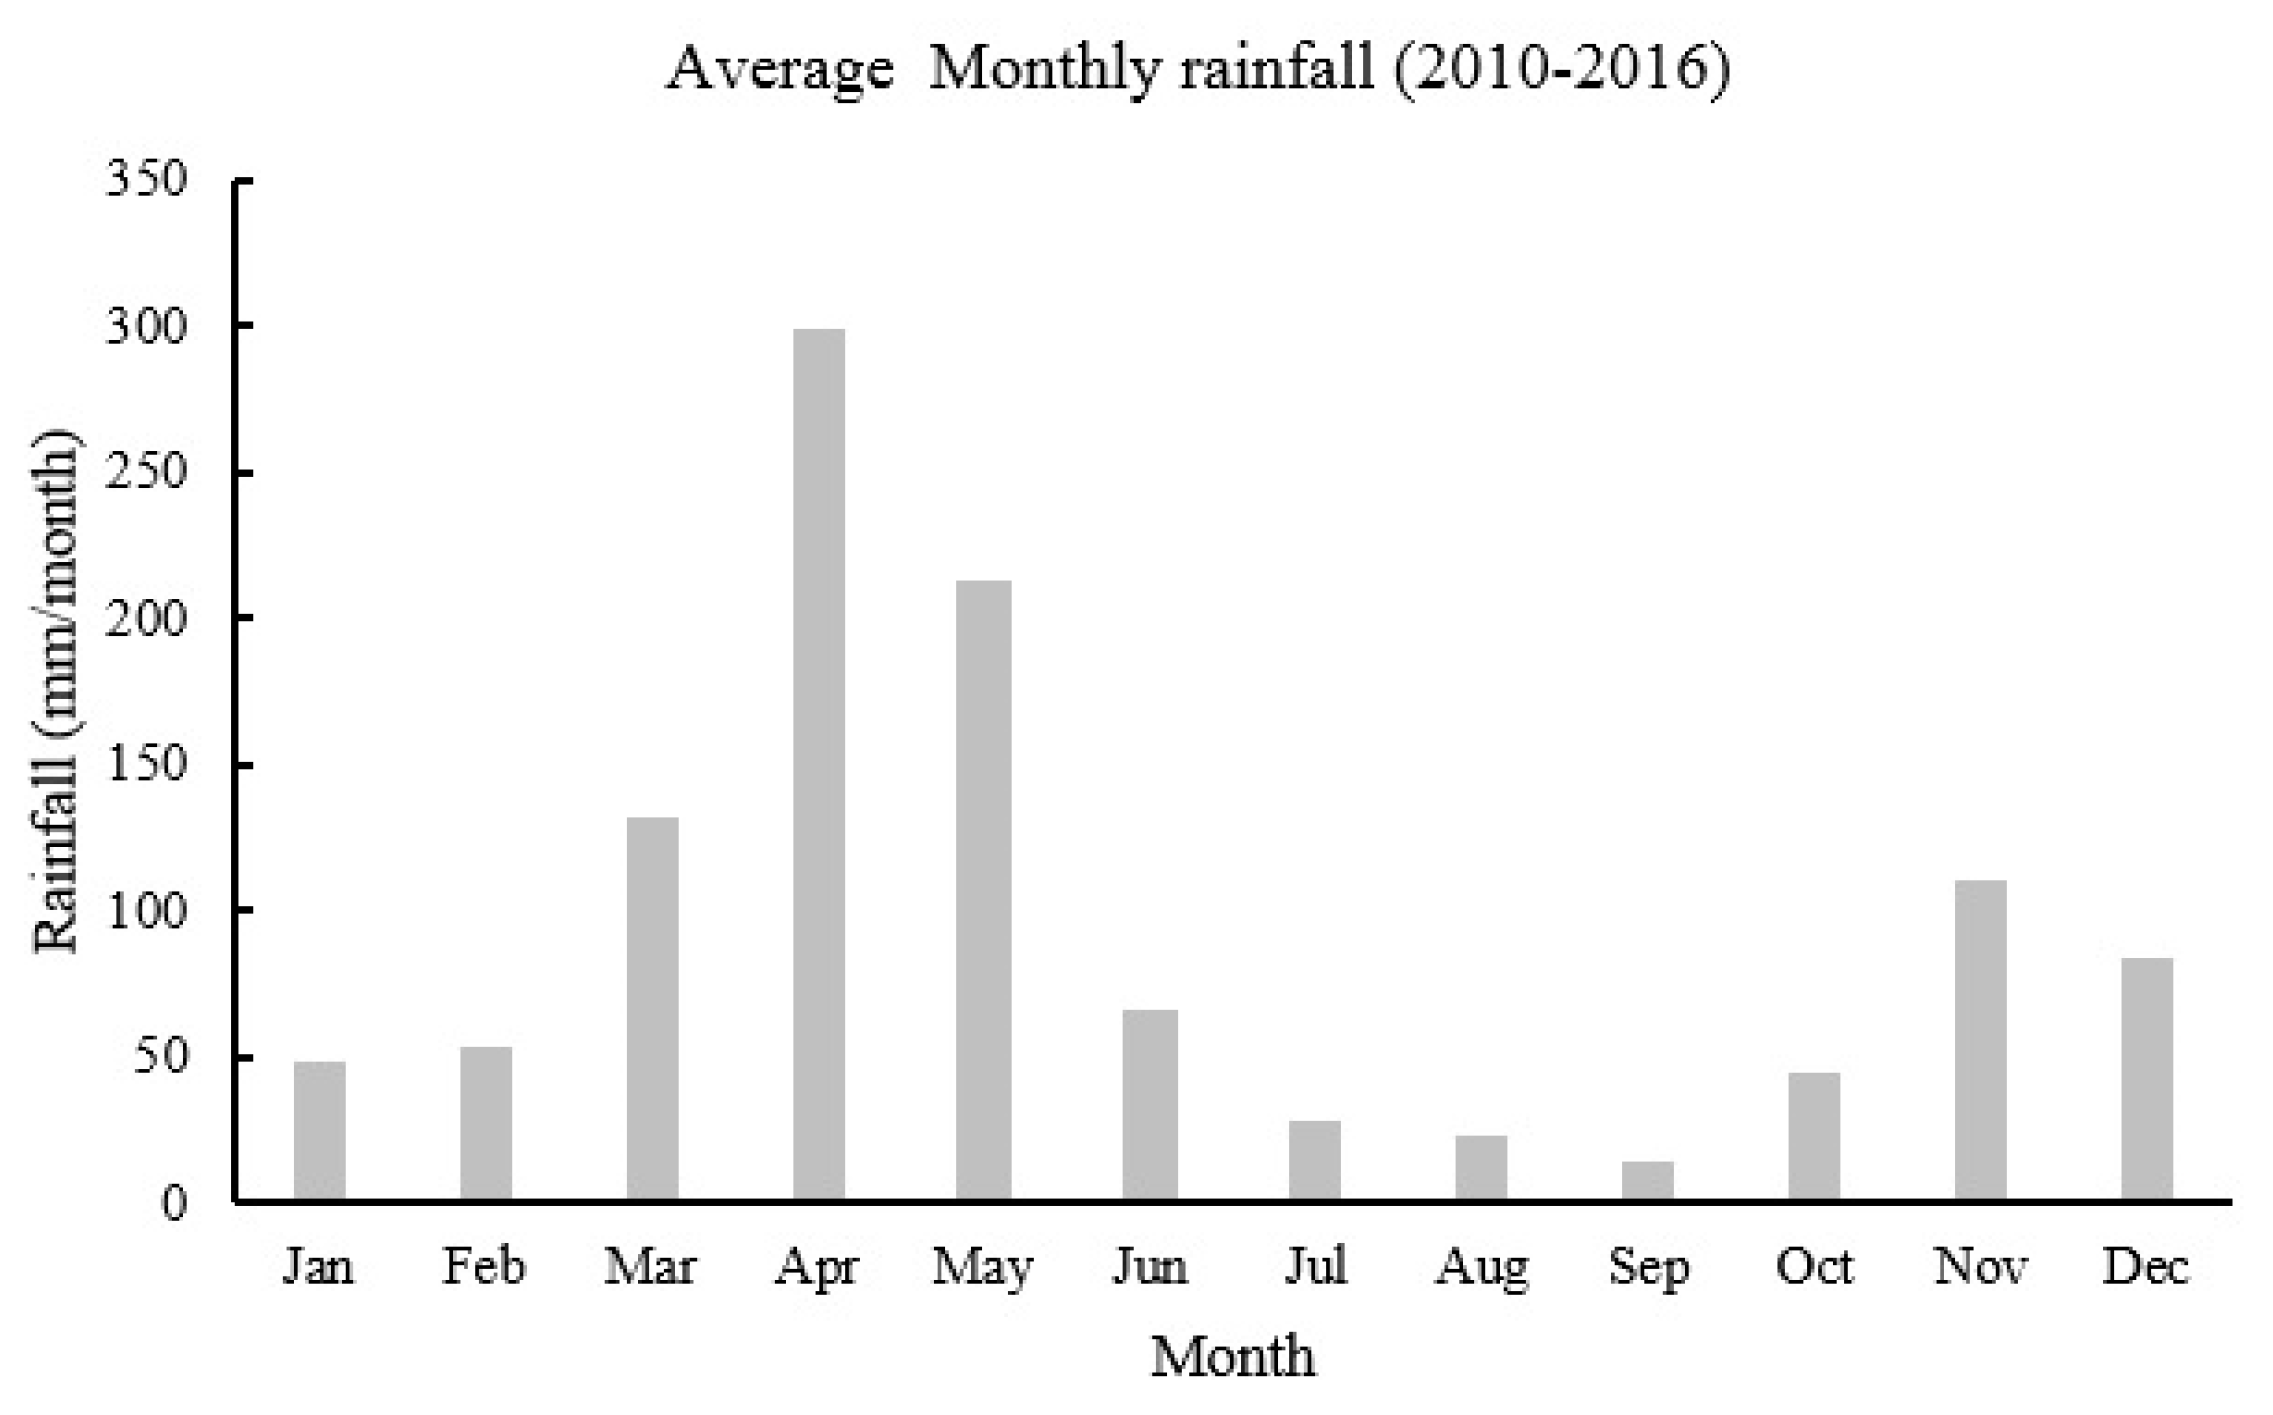
The Kikuletwa catchment is a sub-basin of the Pangani basin that covers 6077 km2 within nine districts that are part of the Arusha, Manyara, and Kilimanjaro regions (Figure 1). Rainfall within the catchment is bi-modal, with long rains (Masika) from March to June and short rains (vuli) from November to December, as shown in Figure 2. Fifteen rain gauges were used to estimate the monthly rainfall from 2010 to 2016 (Figure 1). Data was provided by the Tanzania Meteorological Agency (TMA) and Pangani Basin Water Office (PBWO). Annual rainfall ranges between 300 and 800 mm/year in the lower part of the catchment and 1200 and 2000 mm in the highlands of Mount Meru and Kilimanjaro. The catchment comprises diverse LULC classes of agricultural land, dense forest in the Mount Kilimanjaro (5880 m) and Meru (4562 m), grazed land, mixed urban, and shrubland/thickets. Shrubland and thickets in the study area are found mainly in the lowlands where rain-fed agriculture is dominant. Urban areas concentrate around Arusha. Grazed land is mainly found in the Maasai land of the Monduli and Simanjiro districts. Irrigated agriculture is mainly practiced in the highlands and lowlands along the Kikuletwa river and its distributaries in the Moshi, Moshi urban, Hai, Arumeru, Arusha, and Siha districts. The main crops in the highlands are banana (Musa spp.), coffee (Coffea arabica.), and maize (Zea mays.), while in the lowlands, crops are mainly mixed vegetable crops, such as tomatoes (Solanum lycopersicum.), onions (Allium cepa.), and beans (Phaseolus vulgaris.).
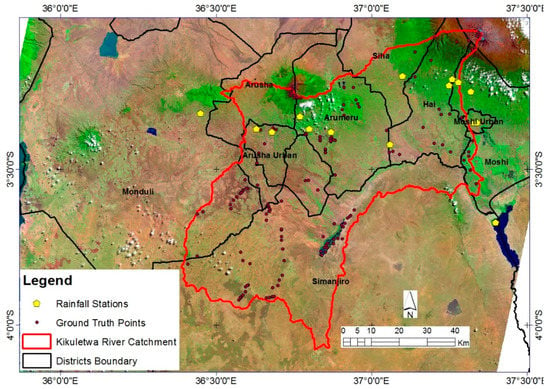
Figure 1.
Location and main features of the Kikuletwa catchment in the eight districts of Tanzania (Landsat 8 image acquired on 3 August 2016). The locations of the rain gauges and ground truth points are also presented in this figure.
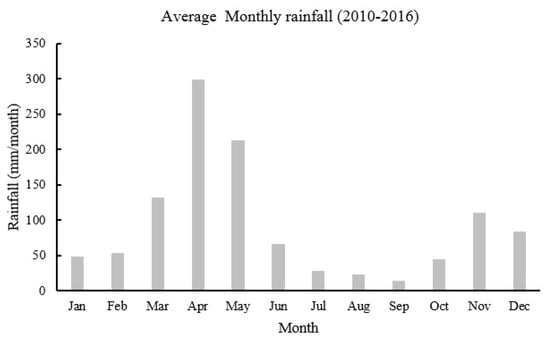
Figure 2.
Monthly average rainfall (mm/month) from 2010 to 2016 of the Kikuletwa catchment from 15 ground rainfall stations from TMA and PBWO.
2.2. Reference Data and Ground Truthing
Ground truthing observations (n = 130) were collected focusing on the irrigated areas during the month of August of the year 2016. The 130 samples included 5 to 12 samples of each of the LULC classes, except for water bodies and the class forest on high altitudes (2000–5895 m) of Mount Meru and Mount Kilimanjaro. The precise locations of the samples were recorded by The Global Positioning System (GPS) in the Universal Transverse Mercator (UTM) and the latitude/longitude coordinate system with a common datum of WGS84 (Figure 1). At each location, information, such as the LULC class, land cover type percentage (shrubs, trees, cropland), crop type, source of water (irrigated or rain fed), and digital photo, were recorded. Additionally, land use maps of the same area from earlier studies [15,24] were digitized and 42 additional training/validation points were extracted, including afro-alpine forest, sub-alpine grassland, and sub-alpine bushlands classes. Ground-truthing observation points (60 of 130) and 21 observations from previous studies [15,24] were used for training the classification algorithm, and the remaining points (70 collected in August and 21 previous studies) for validation.
Water use in the Kikuletwa catchment depends on three influences: Agricultural practices during the growing season, crop type, and water availability for irrigated and rain-fed areas, summarized in a crop calendar. The crop calendar for the Kikuletwa catchment was developed by conducting a questionnaire of 55 household farmers, mostly of irrigated plots, together with the information (irrigation management and types of crops planted) collected from nine districts in the catchment. The farmers were asked to give details on their crop management practices for each month of a calendar year, including the types of crops grown on their plots. Information on crop type and growing periods for areas that were not surveyed were obtained from previous studies [15]. These three information sources, farmers’ interviews, data from local district authorities, and past studies, were analyzed for each crop together with their management practices to produce the crop calendar for the Kikuletwa catchment.
2.3. Pre-Processing of the Landsat Data
Three atmospherically corrected Landsat 8 OLI/TIRS level 2 images for March 2016, August 2016, and October 2016 representing the main seasons for the study area were selected and freely downloaded from the US Geological Survey website [25]. The whole study area is contained in the path/row 168/62 and 168/63. Due to the location of the study area along the mountains of Kilimanjaro and Mount Meru, fully cloud-free images were not available. Therefore, we set a threshold of less than 10% cloud cover for image selection. The images were composited, mosaicked, and then clipped to the study area for computational efficiency during classification.
2.4. NDVI Computation for the Kikuletwa Catchment
NDVI maps were created from the corrected band 4 (RED) and near-infrared band 5 (NIR) of the Landsat 8 surface reflectance high-level data products. A rescaling factor of 0.001 was applied to the bands before direct calculation of the NDVI according to the product guide specifications of the provisional L8 surface reflectance guide version 1.5. This factor was applied to convert surface reflectance of band 4 and band 5 values to a range of 0 to 1 using raster calculator in Geographical information system (GIS). The normal range of surface reflectance is −2000 to 16,000; however, the valid range according to the product guide specifications of the provisional L8 surface reflectance guide version 1.5 is 0 to 10,000.
After band correction, the NDVI was calculated using Equation (1):
2.5. Image Classification and Seasonal Land Use Change
The classification scheme utilized was based on the LULC classification of Anderson et al., Knight et al., Cheema et al., and Biro et al. [2,14,22,26] for the interpretation of remote sensing data. However, for the detailed land use analyses and interpretation, Kiptala et al.’s [15] approach was used to define 20 classes (Table 1).

Table 1.
Characteristics of the LULC of the Kikuletwa catchment.
Different training points for each Landsat 8 image (March, August, and October) were used for classification. Table 2 shows identified land uses that change each season according to farmers’ interviews. Since the ground truthing was conducted in August, the existing agricultural land use was recorded. The farmers’ interview provided the information on the agricultural land use for each month and crop stages at a specific recorded location. This information was used during the classification process. For instance, for the training point 1 of Table 2, the land was found bare when visited in August, but according to the farmers’ interview, the planting of rain-fed maize starts in mid-March and it is harvested in July to August. Afterwards, the land would be left bare till the next planting in the following year. Further, the classification of each land use was refined using the crop calendar for the agricultural land use to reduce the classification error due to seasonal changes. The crop calendar was used to define the changes in the agricultural land uses and its practice in dry, long rains, and short rains seasons. Expert judgement, knowledge of the study area, and farmers’ interviews were also used to refine the classification. Supervised classification using the maximum likelihood algorithm in ArcMap was used to classify the LULC of the three images. The multispectral bands of Landsat 8 were used for classification. Supervised classification is a method that uses training samples of a known identity to identify pixels of an unknown identity [2]. The method is widely used in Sub-Saharan Africa [15,26,27,28] and performs better with known secondary data, such as cropping pattern and knowledge of the study area [29].

Table 2.
Example of a set of training points per LULC of the three main seasons (wet, dry, and short rains) in the Kikuletwa catchment.
Statistics of the seasonal LULC change were generated to determine the increase and/or decrease of the percentage area of each class. The percentage area of the seasonal change of LULC and that of NDVI values were compared to show if there was a similar pattern of change with seasons.
2.6. Classification Accuracy
A confusion matrix representing the classified class versus ground truth points was used to assess the classification accuracy. User and producer overall classification accuracy and kappa coefficient were derived from the confusion matrix [31]. In order to assess the performance of the Landsat classification, the results were visually compared with the previous studies in the same area [15]. These comparisons were only done for a few similar LULC classes, such as forest, water, and agricultural lands, such as banana and coffee.
2.7. Quantifying Irrigation Water Withdrawals Using Seasonal Land Use Maps
The seasonal LULC maps were used to calculate water yield per irrigated agricultural land use. A water balance method was used to estimate the amount of water withdrawn for irrigation (water withdrawals) using P and ET maps. Satellite-derived rainfall maps of the study area were collected from the Climate Hazards Group InfraRed Precipitation with Station data (CHIRPS) [32]. Satellite P estimates were then validated with 15 ground stations data of the study area. Monthly and yearly rainfall for the five-year period (2010–2014) were analyzed. The Nash–Sutcliffe efficiency coefficient (NSE), goodness of fit (R2), and relative bias were computed to compare the monthly remote sensing rainfall CHIRPS estimates and measured rainfall for each station. The station’s data showed good agreement with the satellite data, with an overall NSE, R2, and relative bias of 0.87, 0.83, and 0.954, respectively.
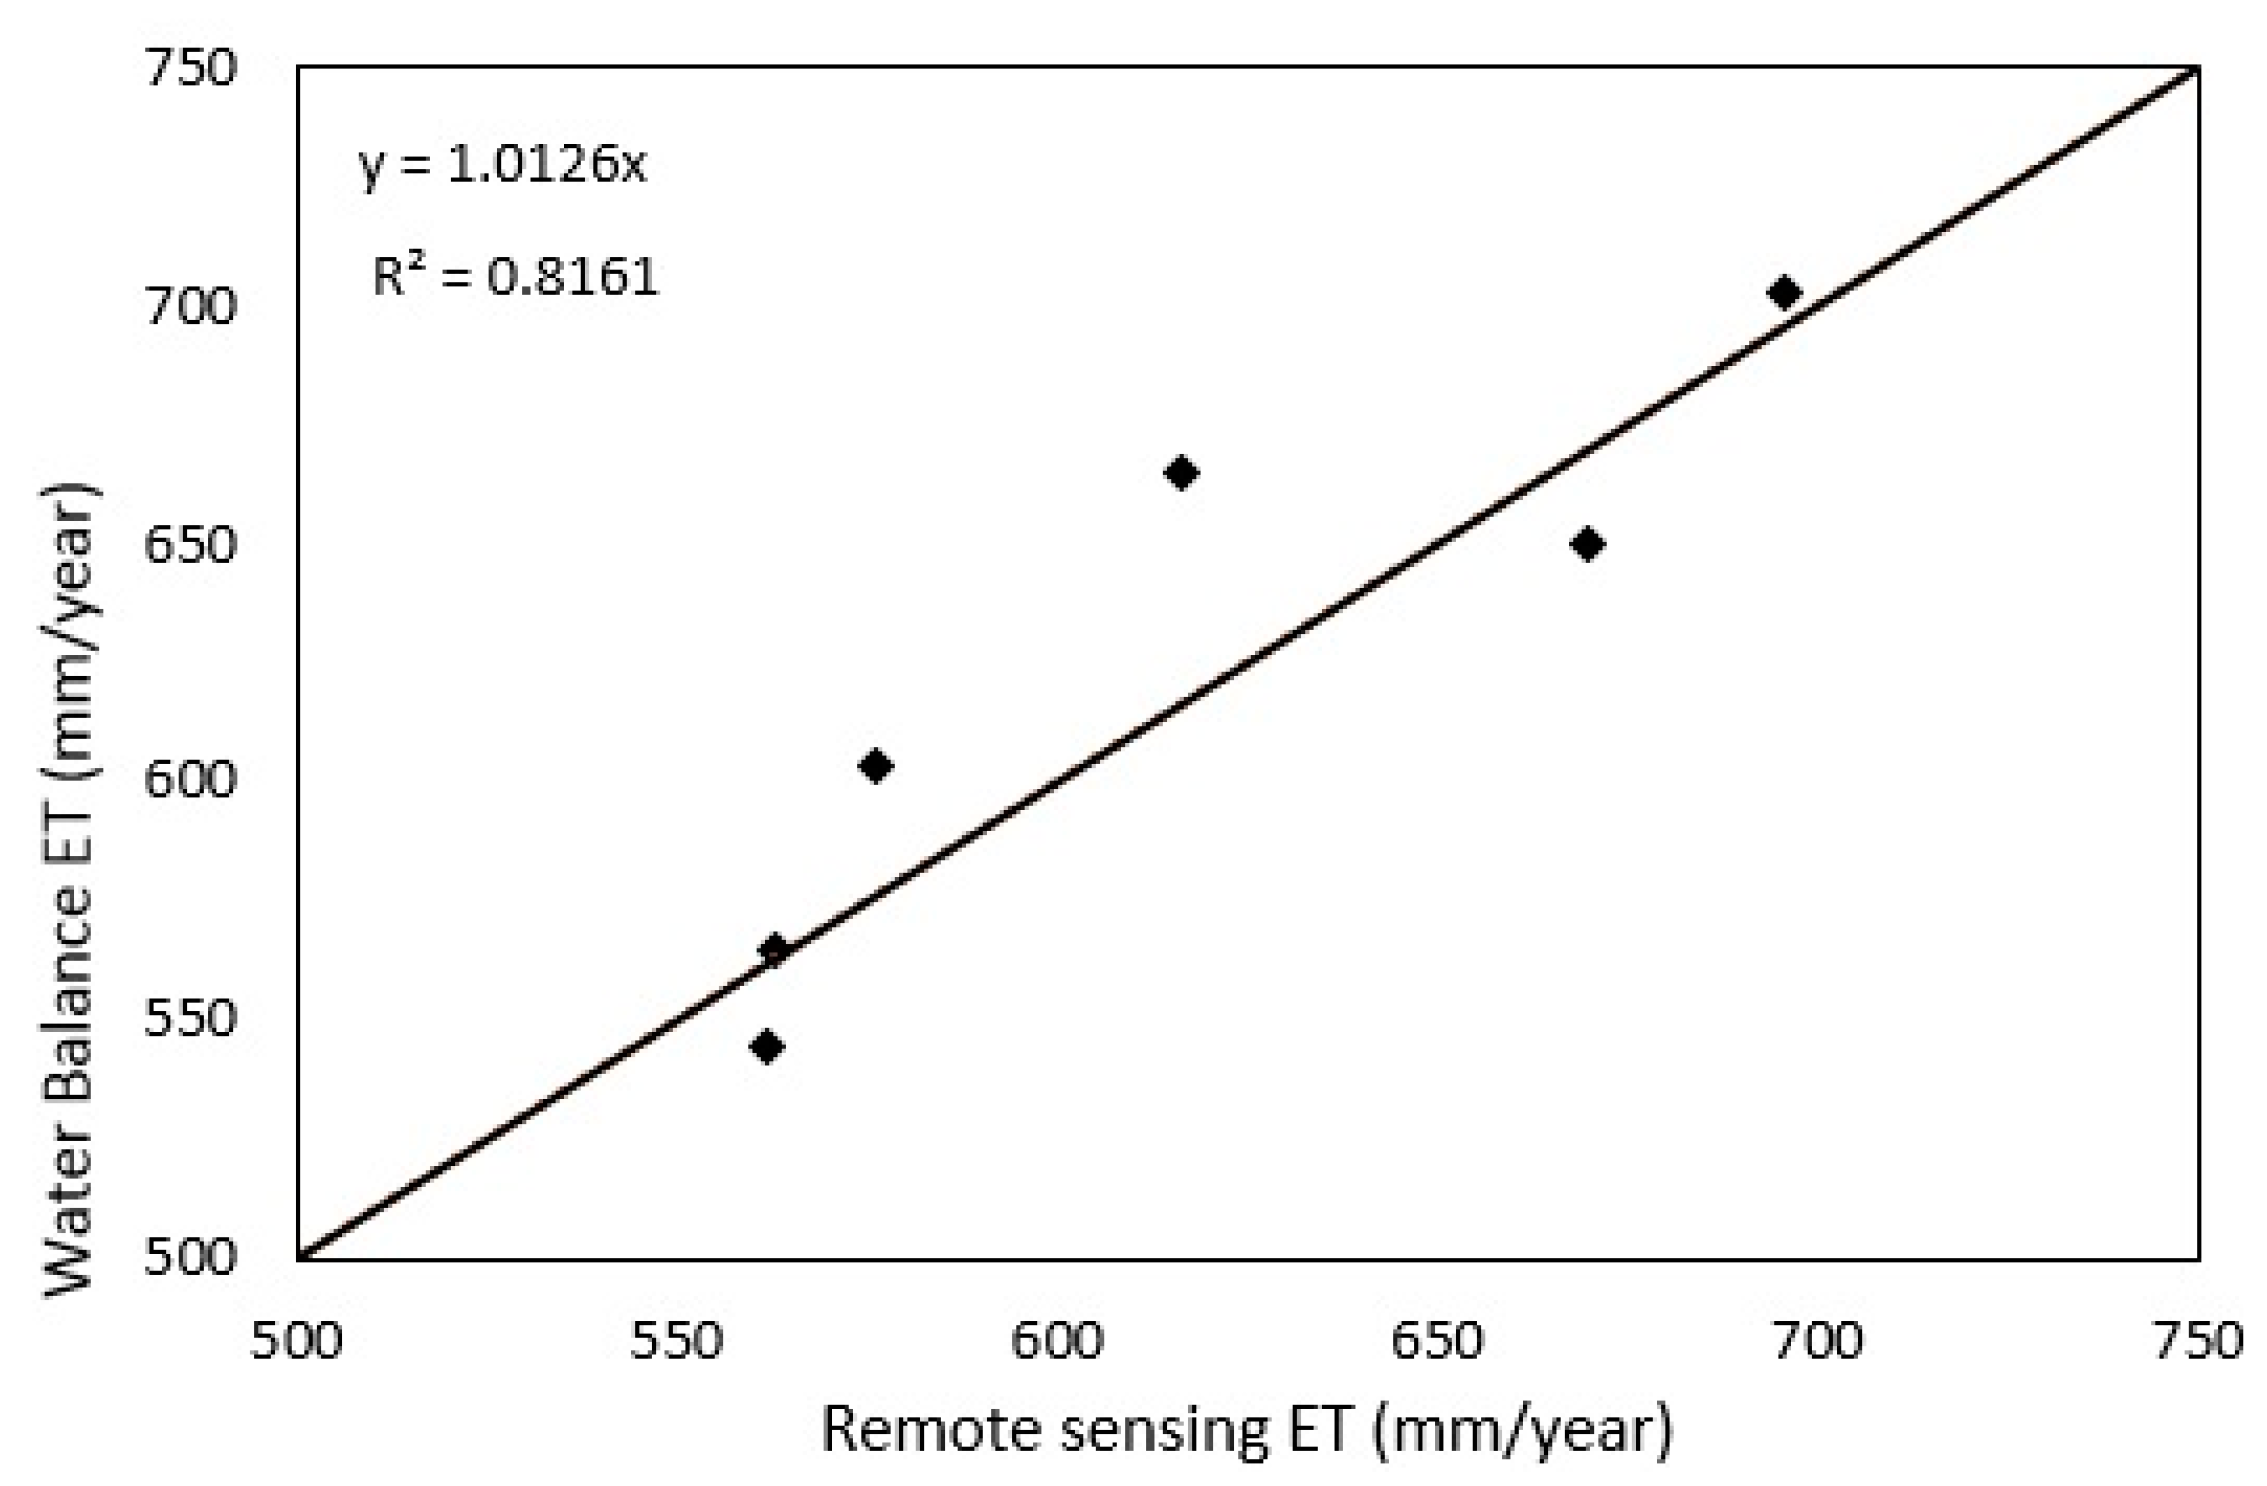
An ensemble evapotranspiration (ET) data product was freely downloaded using the Water Accounting plus GitHub Python repository. The ensemble ET product was created from seven different remote sensing ET products, i.e., SEBS, SSEBop, ETmonitor, MOD16, GLEAM, ALEXI, and CMRSET, at a 250 m × 250 m resolution. The catchment water balance for a drainage area that covers 86% of the entire catchment was used to validate the ensemble ET product for the period of 6 years (2008–2013). We compared the water balance ET (WBET), which was obtained from Equation (2), with the ensemble ET:
where P, Q, and are the annual catchment precipitation, runoff, and change in storage, respectively. The change in storage was assumed to be negligible ().
A good agreement (R2 = 0.82 and bias = 0.92) between the remote sensing ensemble ET and the water balance ET was found, as shown in Figure 3. The validated CHIRPS rainfall maps and ensemble ET maps were then used for the estimation of water withdrawals for irrigated agriculture in the Kikuletwa catchment. The method for estimating water withdrawals was adapted from [3]. In this paper, water withdrawals from irrigated lands are referred to as the direct water extracted from streams, rivers, and aquifers. These withdrawals are an additional source of water to the unsaturated zone apart from natural rainfall. The higher the increase in soil moisture content, the more land surface evaporation. The enhancement of the actual evaporation rate is referred to as incremental ET [3].
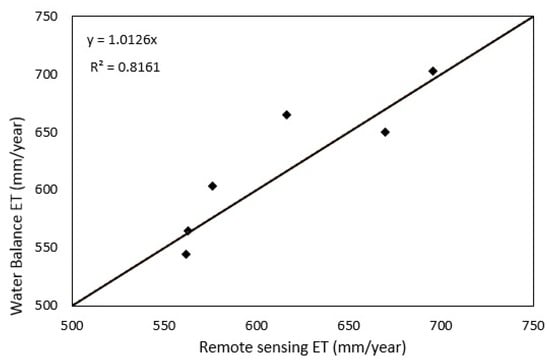
Figure 3.
Comparison between the yearly water balance ET and remote sensing ensemble ET.
The total ET is expressed as:
where is the volume of water evaporated from areas where no additional water was supplied, and is the volume of water evaporated as a result of withdrawals. The withdrawals can either be indirect, meaning they occur naturally by land use change, or direct when water is diverted from the streams by canals or pumps for irrigation. could be approximated as the pixel values of ET in the rain-fed agro-ecosystem. The FEP/R ratio was used to determine the effective rainfall, because not all the annual rainfall will infiltrate and be stored in the unsaturated zone and available for uptake by roots. The incremental ET is the difference between the total ET and :
The FEP/R ratio was determined from the pixel values of ET and P of rain-fed agro-ecosystem LULC classes and averaged to a value of 0.87 based on an analysis using five years of ET and p-values during the growing seasons. The P is the total yearly precipitation (validated CHIRPS data set), while the ET is the total yearly water consumption (validated satellite ensemble evapotranspiration). The incremental ET from the irrigated lands is not the same volume as the one withdrawn from the rivers, streams, or aquifers. The irrigation efficiency accounts for all the conveyance losses from deep percolation, canals, and the soil surface. The default irrigation efficiency for irrigated lands of Pangani basin ranges from 15% to 25% [33,34]. This study adopted a 25% irrigation efficiency as the ratio of ET incremental and water withdrawals (Equation (5)):
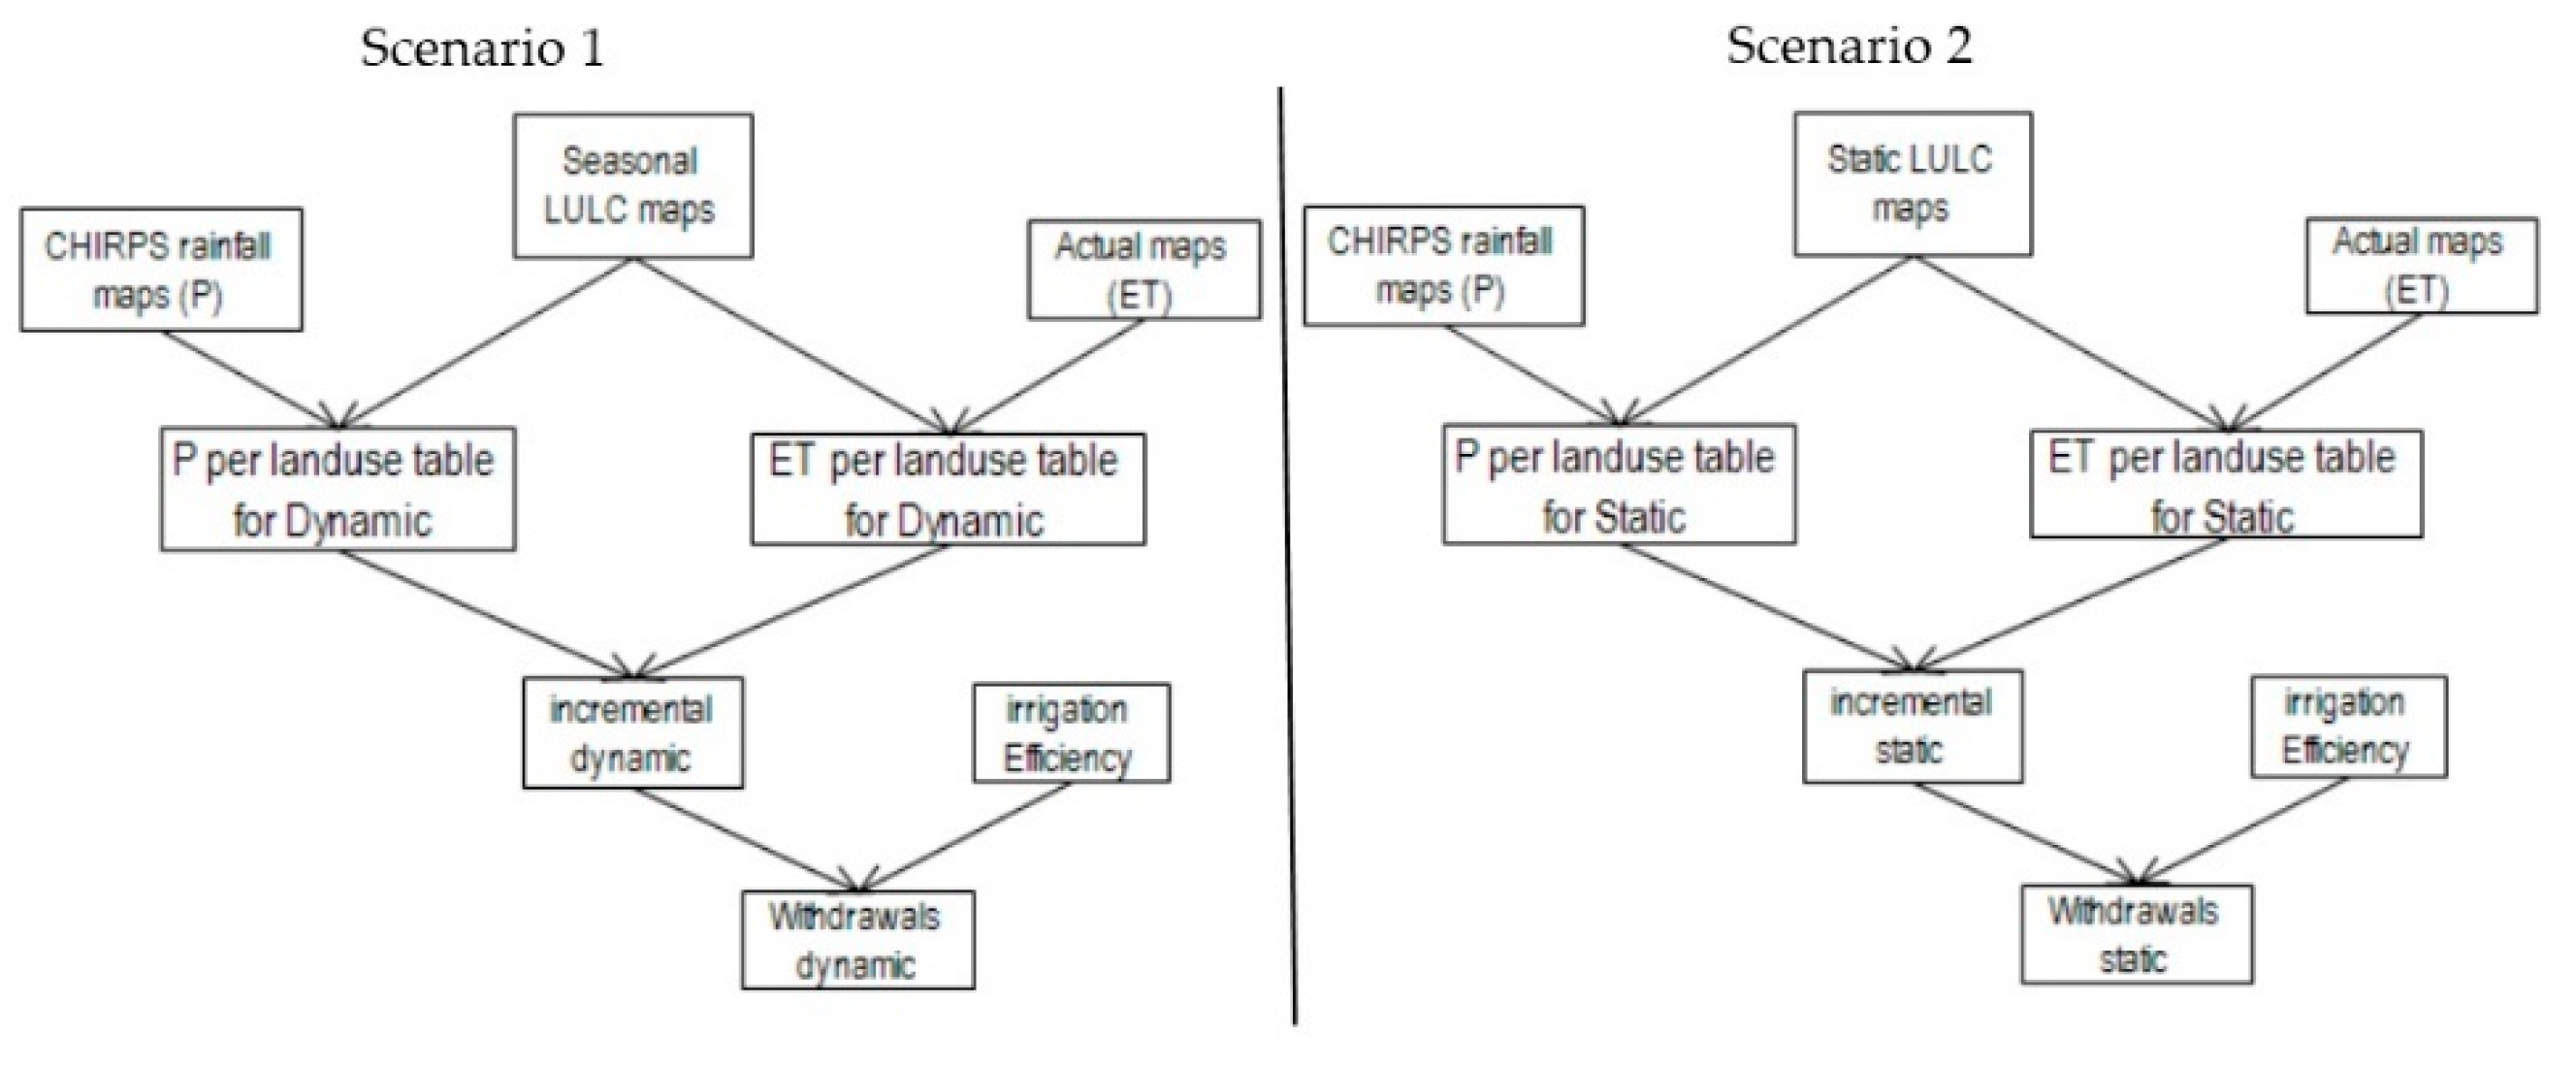
This means that 75% of the water withdrawn is returned to rivers, groundwater, or evaporated and not used for productive agriculture. A summary of the processes to estimate the water withdrawals for irrigated areas is shown in Figure 4.
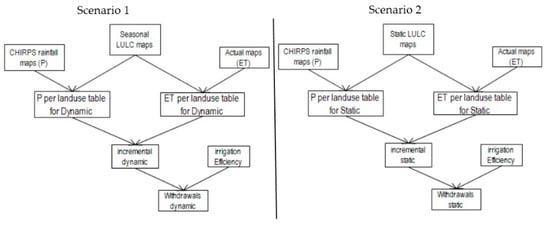
Figure 4.
Summary of the data analysis of the input maps to the final statistic values of the water withdrawals.
Two scenarios were considered. The first scenario used seasonal LULC maps representing different LULC conditions during the three main seasons to calculate the annual water withdrawals per agricultural land use. In the second scenario, one static LULC map representing all seasons was used to extract the monthly ET and P values for calculating water withdrawals (Figure 4). In the first scenario, the seasonal map representing the wet season (long rain) was used to extract values of ET and P for wet months (March, April, May, June, and July) while the August map was used to extract August and September dry months. The October map was used to extract the values of P and ET for the months of the short rainy season (October, November, December, January, and February). Although July is generally the start of the dry season, it was included as a wet month since rain-fed maize is harvested in August, according to the developed crop calendar. Therefore, the March LULC map was used to extract the data for July. For the second scenario, representing a static annual land use condition, the March LULC map was used instead of the LULC map obtained from merging multi-temporal images of all the seasons. This was due to poorer results from the merging of the multi-temporal images for this catchment most likely due to phenology and spectral differences of the images. The zonal statistic tool in ArcMap was used to extract the mean monthly P and ET values for each agricultural land use in both scenarios.
3. Results
3.1. Crop Calendar
The developed crop calendar shows monthly management practices, such as irrigation, growing seasons, and crop types (Table 3). The developed crop calendar makes the distinction between irrigated and rain-fed crops, which was not available in previous studies [15]. Certain crops, such as banana, coffee, and sugarcane, are annual crops and thus do not have specific growing or harvesting dates. However, other crops, such as maize, vegetables, and beans, have specific monthly management practices as indicated in the crop calendar.

Table 3.
Crop calendar for irrigated and rain-fed crops for the Kikuletwa catchment.
3.2. NDVI Analysis for the Kikuletwa Catchment
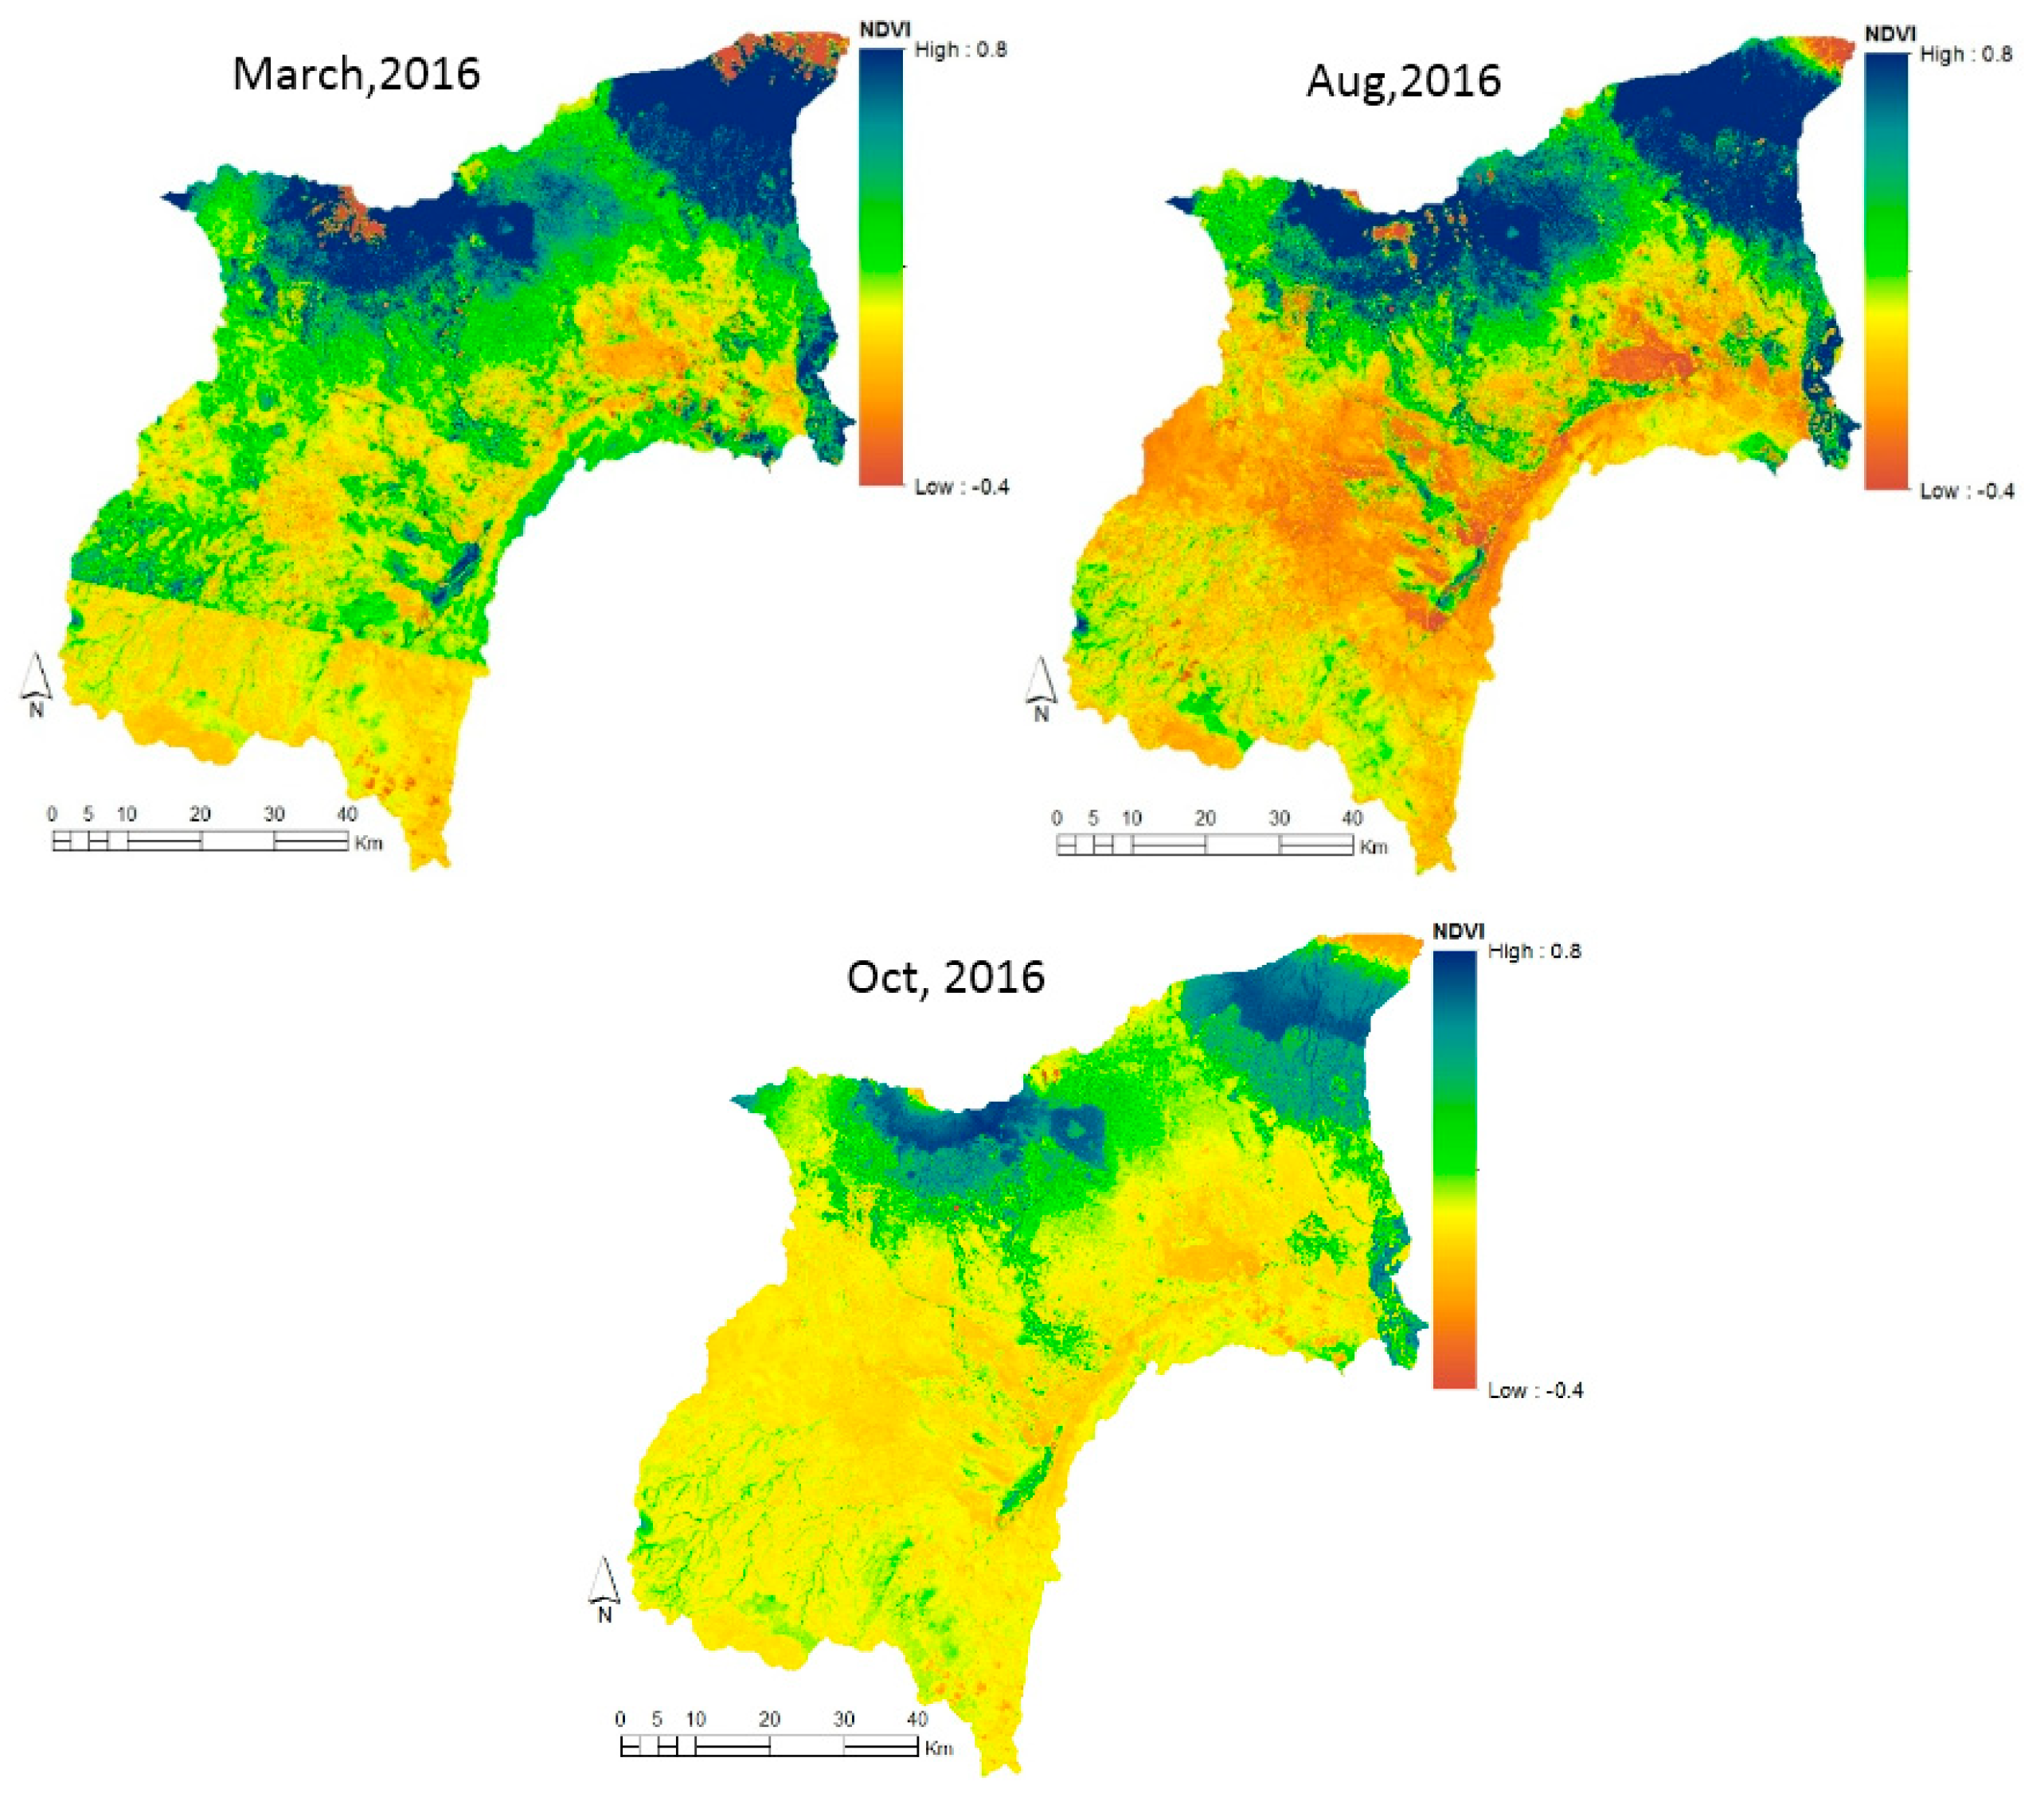
The NDVI values for the Kikuletwa catchment show a clear difference during the three main crop seasons in many areas (Figure 5). In higher altitudes, such as Mount Kilimanjaro and Mount Meru, NDVI values are in the same range in all seasons. This is also the case for irrigated areas in the high and lowlands.
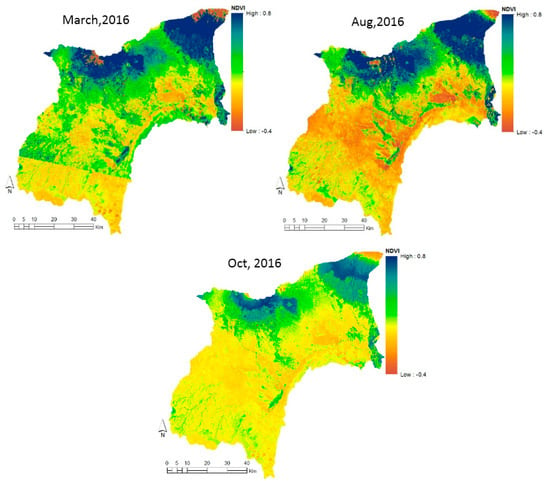
Figure 5.
Spatial distribution of the NDVI for wet (March) and dry (August and October) months of the Kikuletwa catchment.
The NDVI assesses whether an area contains live green vegetation or not regardless of the LULC class. For instance, the NDVI value ranges (0.6–0.8) of irrigated crops, such as sugarcane, were found to be in the same range as the values of other irrigated crops (banana and coffee) and forest in other studies [15]. The use of seasonal land use is important to differentiate the types of agricultural land use classes present in an area.
3.3. Classification Accuracy Assessment
A confusion matrix was used to assess the classification accuracy of the three images; the results are summarized in Table 4. The overall classification accuracy for the images of March, August, and October 2016 are 85.5%, 88.5%, and 91.6%, with a kappa coefficient of 0.84, 0.87, and 0.91, respectively. User and producer accuracy for irrigated banana, coffee, maize, irrigated mixed crops, urban buildings, shrubland and/or thickets, and grazed grassland were relatively lower, below 70% (Table 4). Compared to previous studies [14,15] that have a detailed classification of agricultural land use, both the overall accuracy and kappa coefficient are within an acceptable range [35].

Table 4.
Summary of the LULC classification accuracy for the March, August, and October month images.
3.4. Image Classification and Seasonal LULC Change
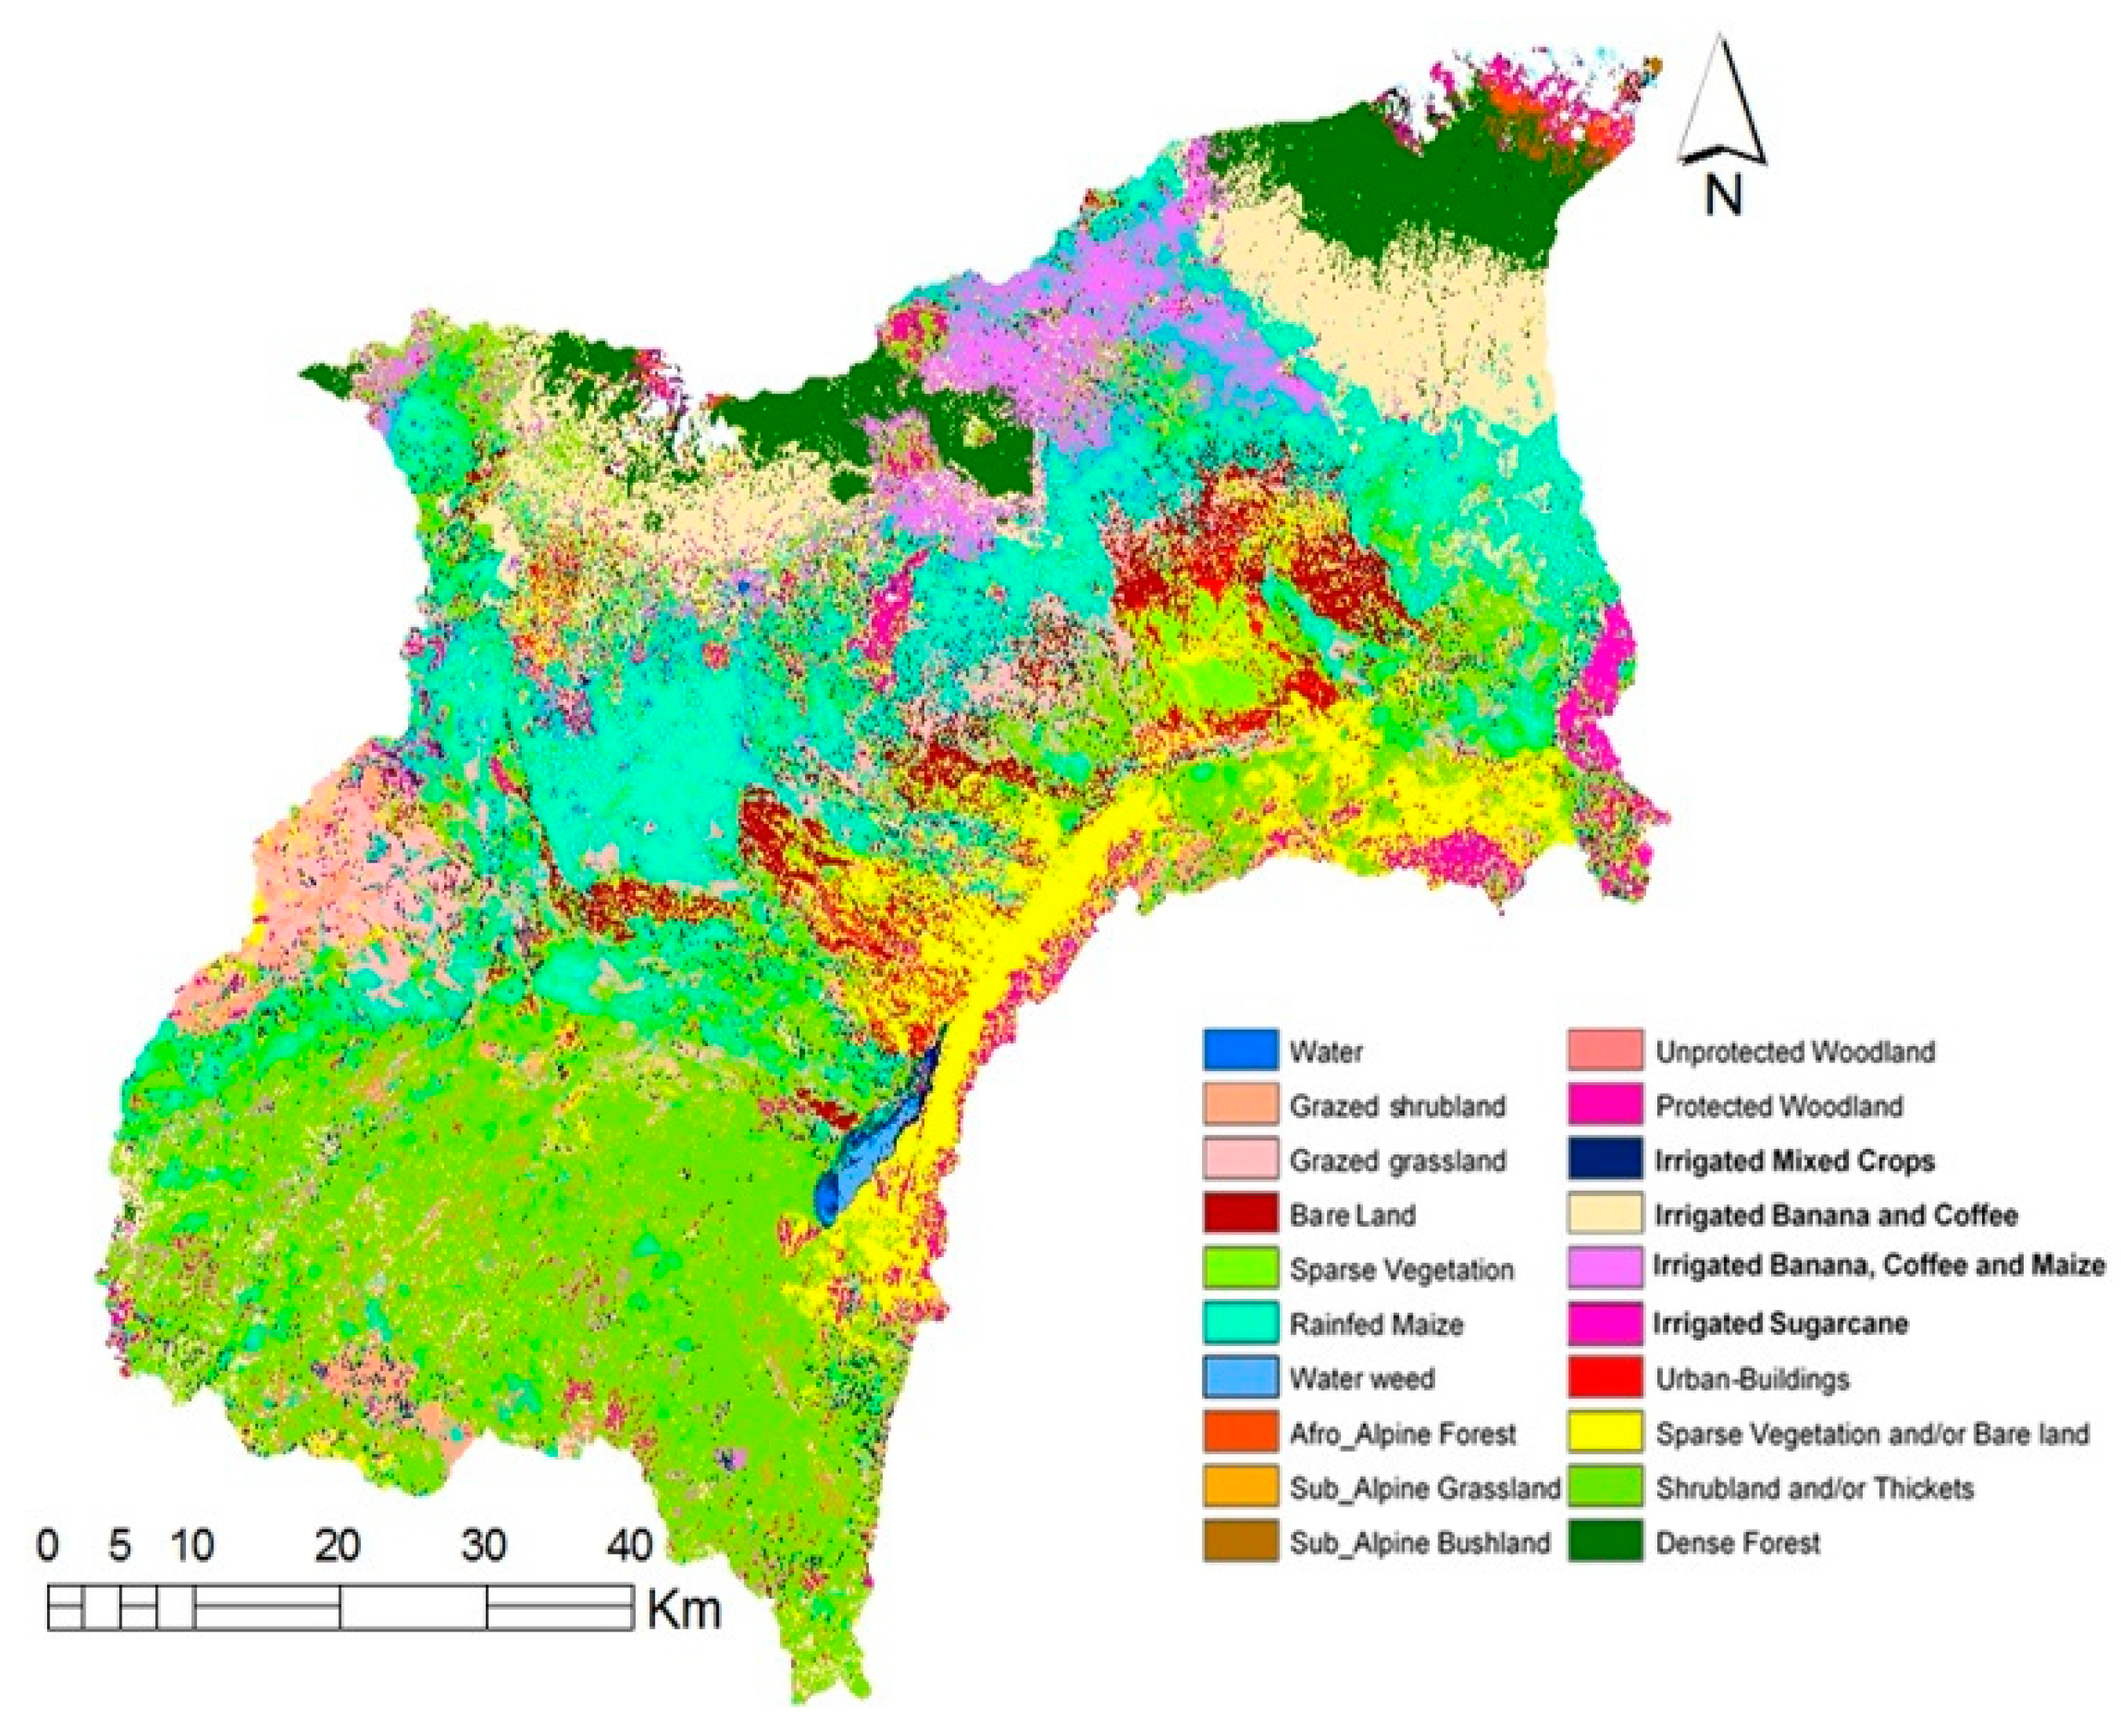
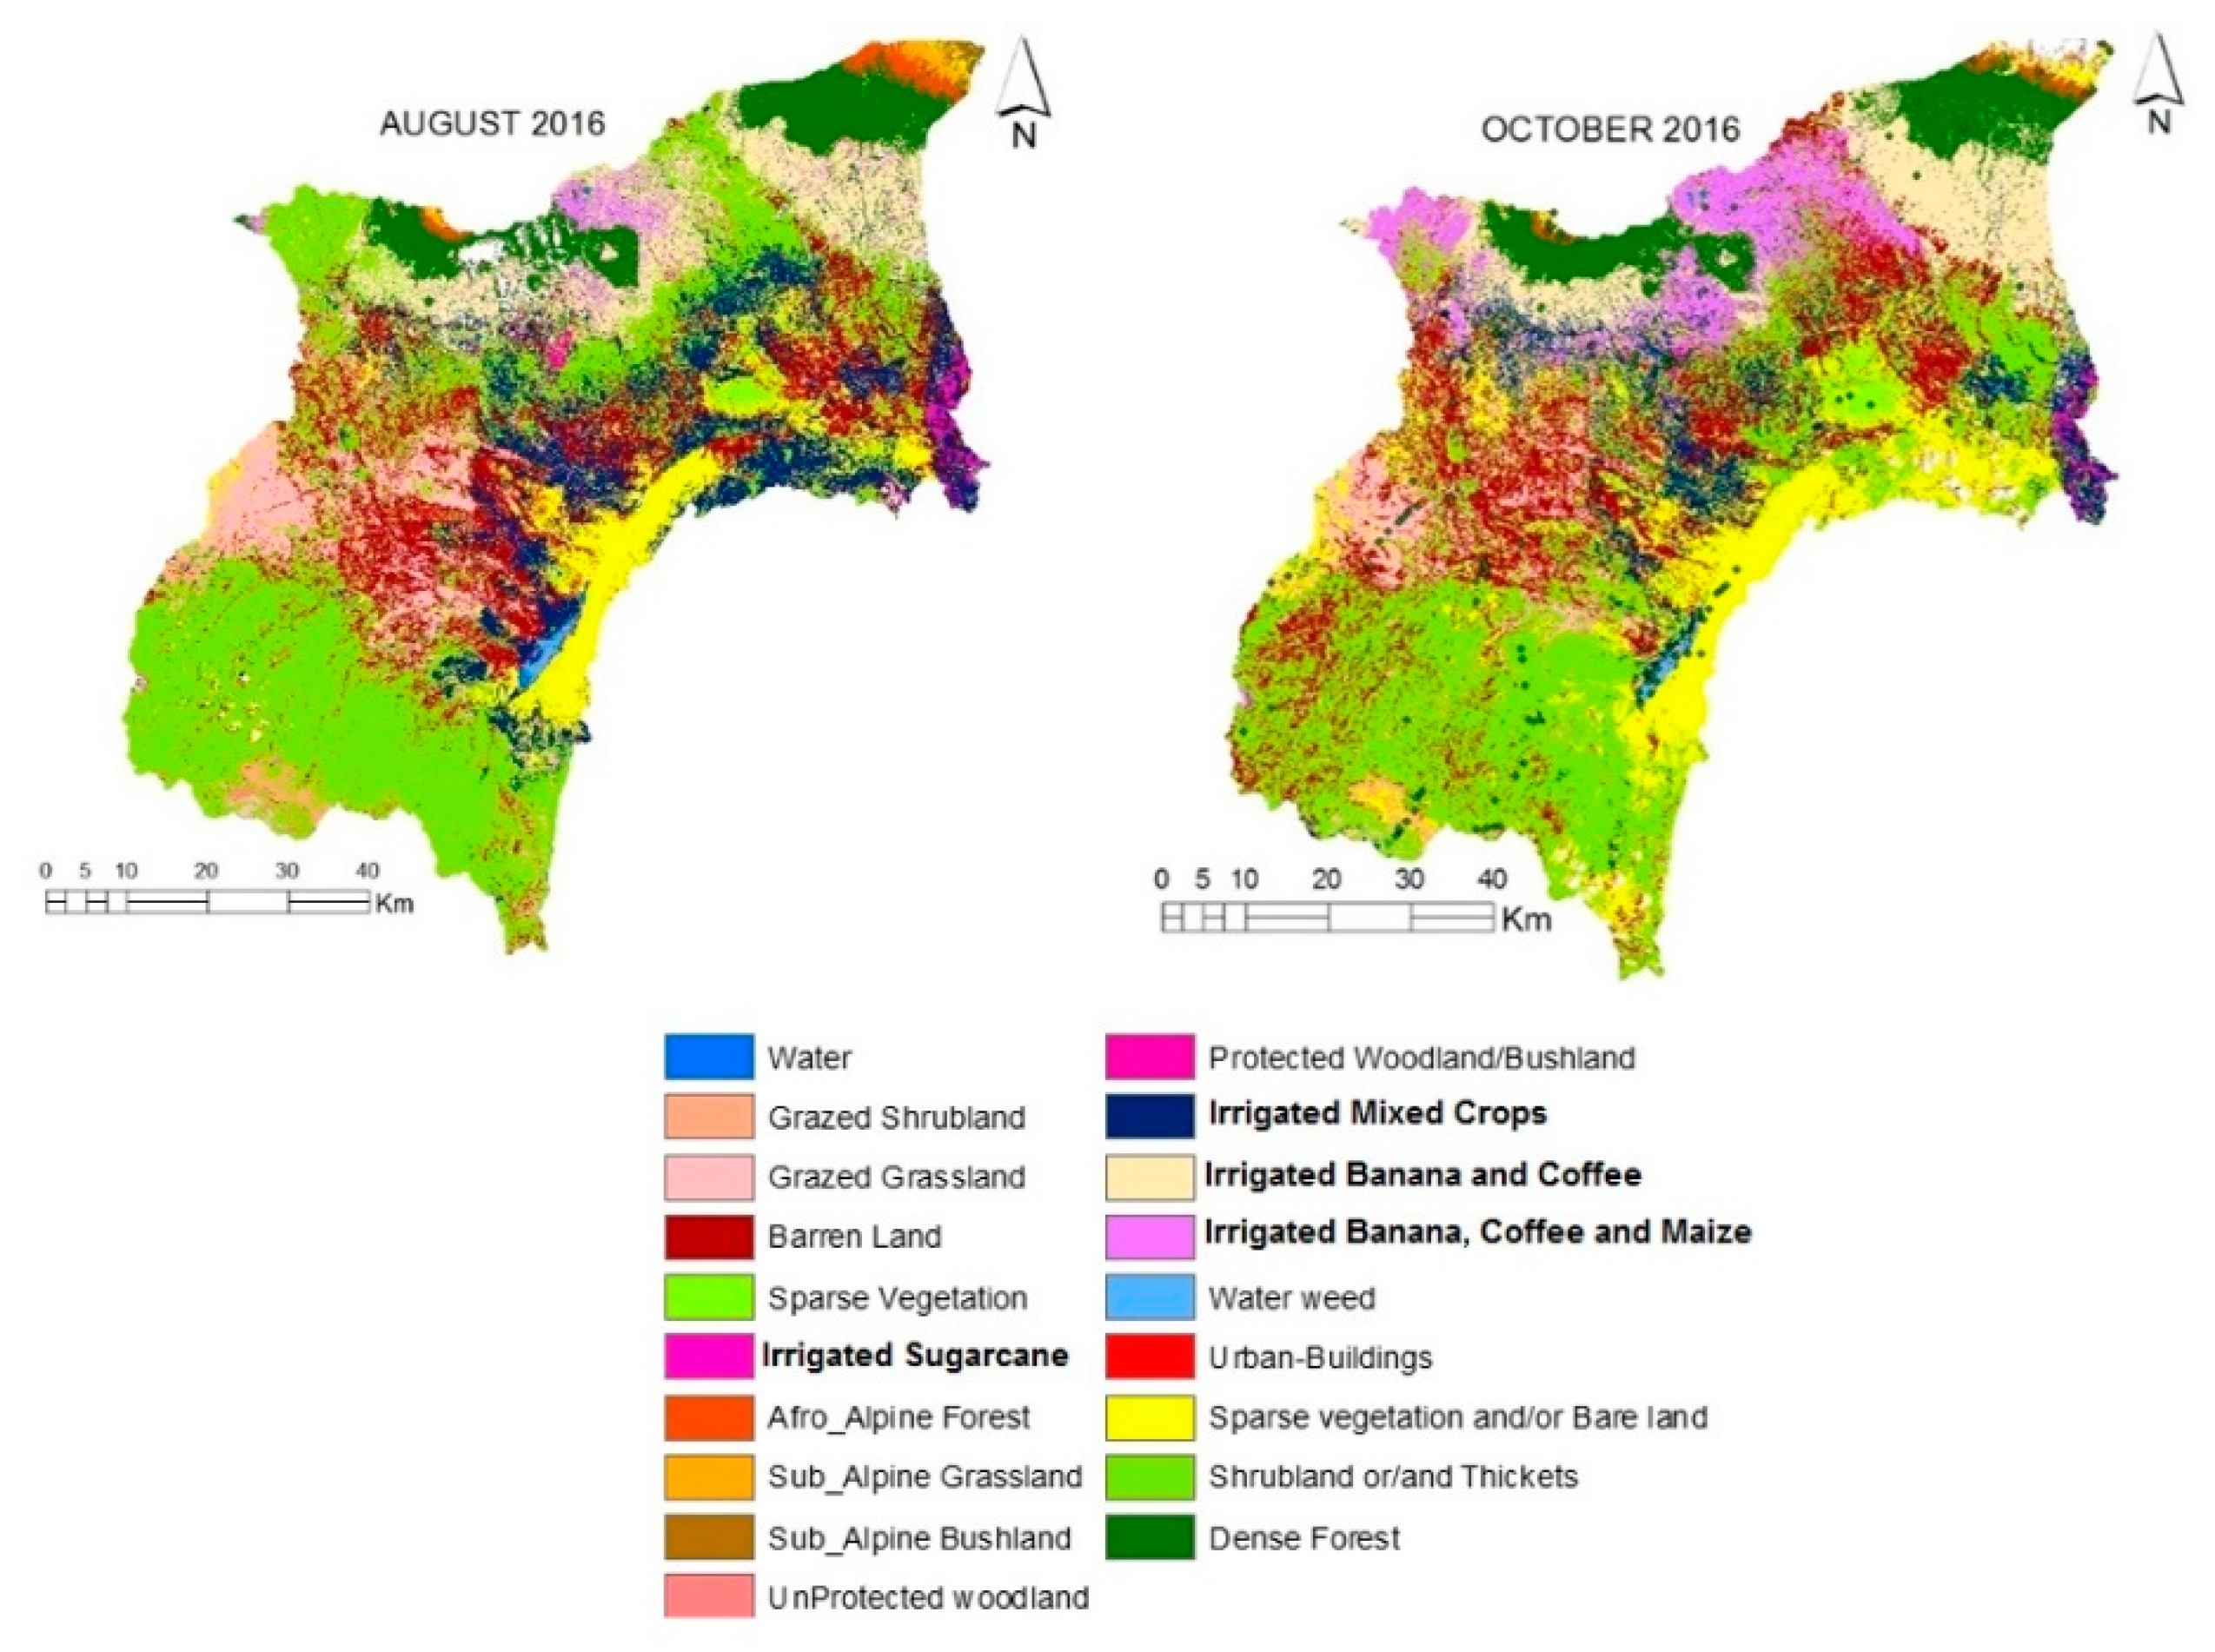
In the Kikuletwa catchment, 20 and 19 LULC classes were mapped for the wet (Figure 6) and dry seasons, respectively (Figure 7). The rain-fed maize class does not appear in the two dry month maps.
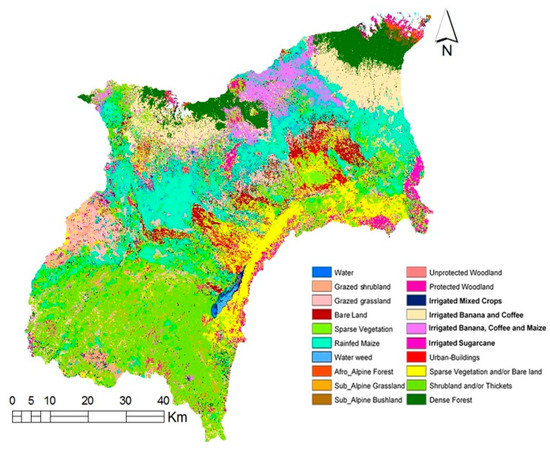
Figure 6.
Spatial distribution of 20 LULC classes for the wet season in the Kikuletwa catchment.
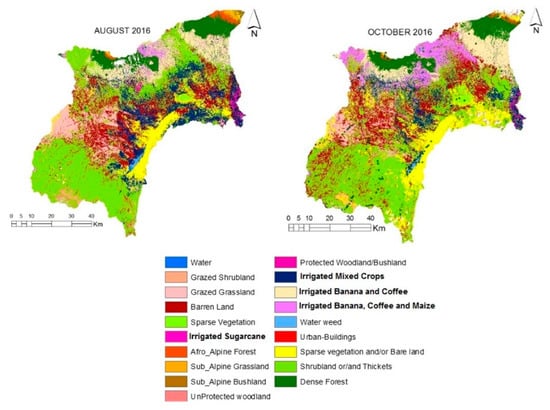
Figure 7.
Spatial distribution of 19 LULC classes for the dry season in the Kikuletwa catchment.
Comparing the classification of the wet season (March 2016—Figure 6) to the dry season (October 2016—Figure 7), we notice that 16% (951 km2) of the total rain-fed maize area was converted into bare land, while irrigated mixed crops increased by 11% (654 km2) in October.
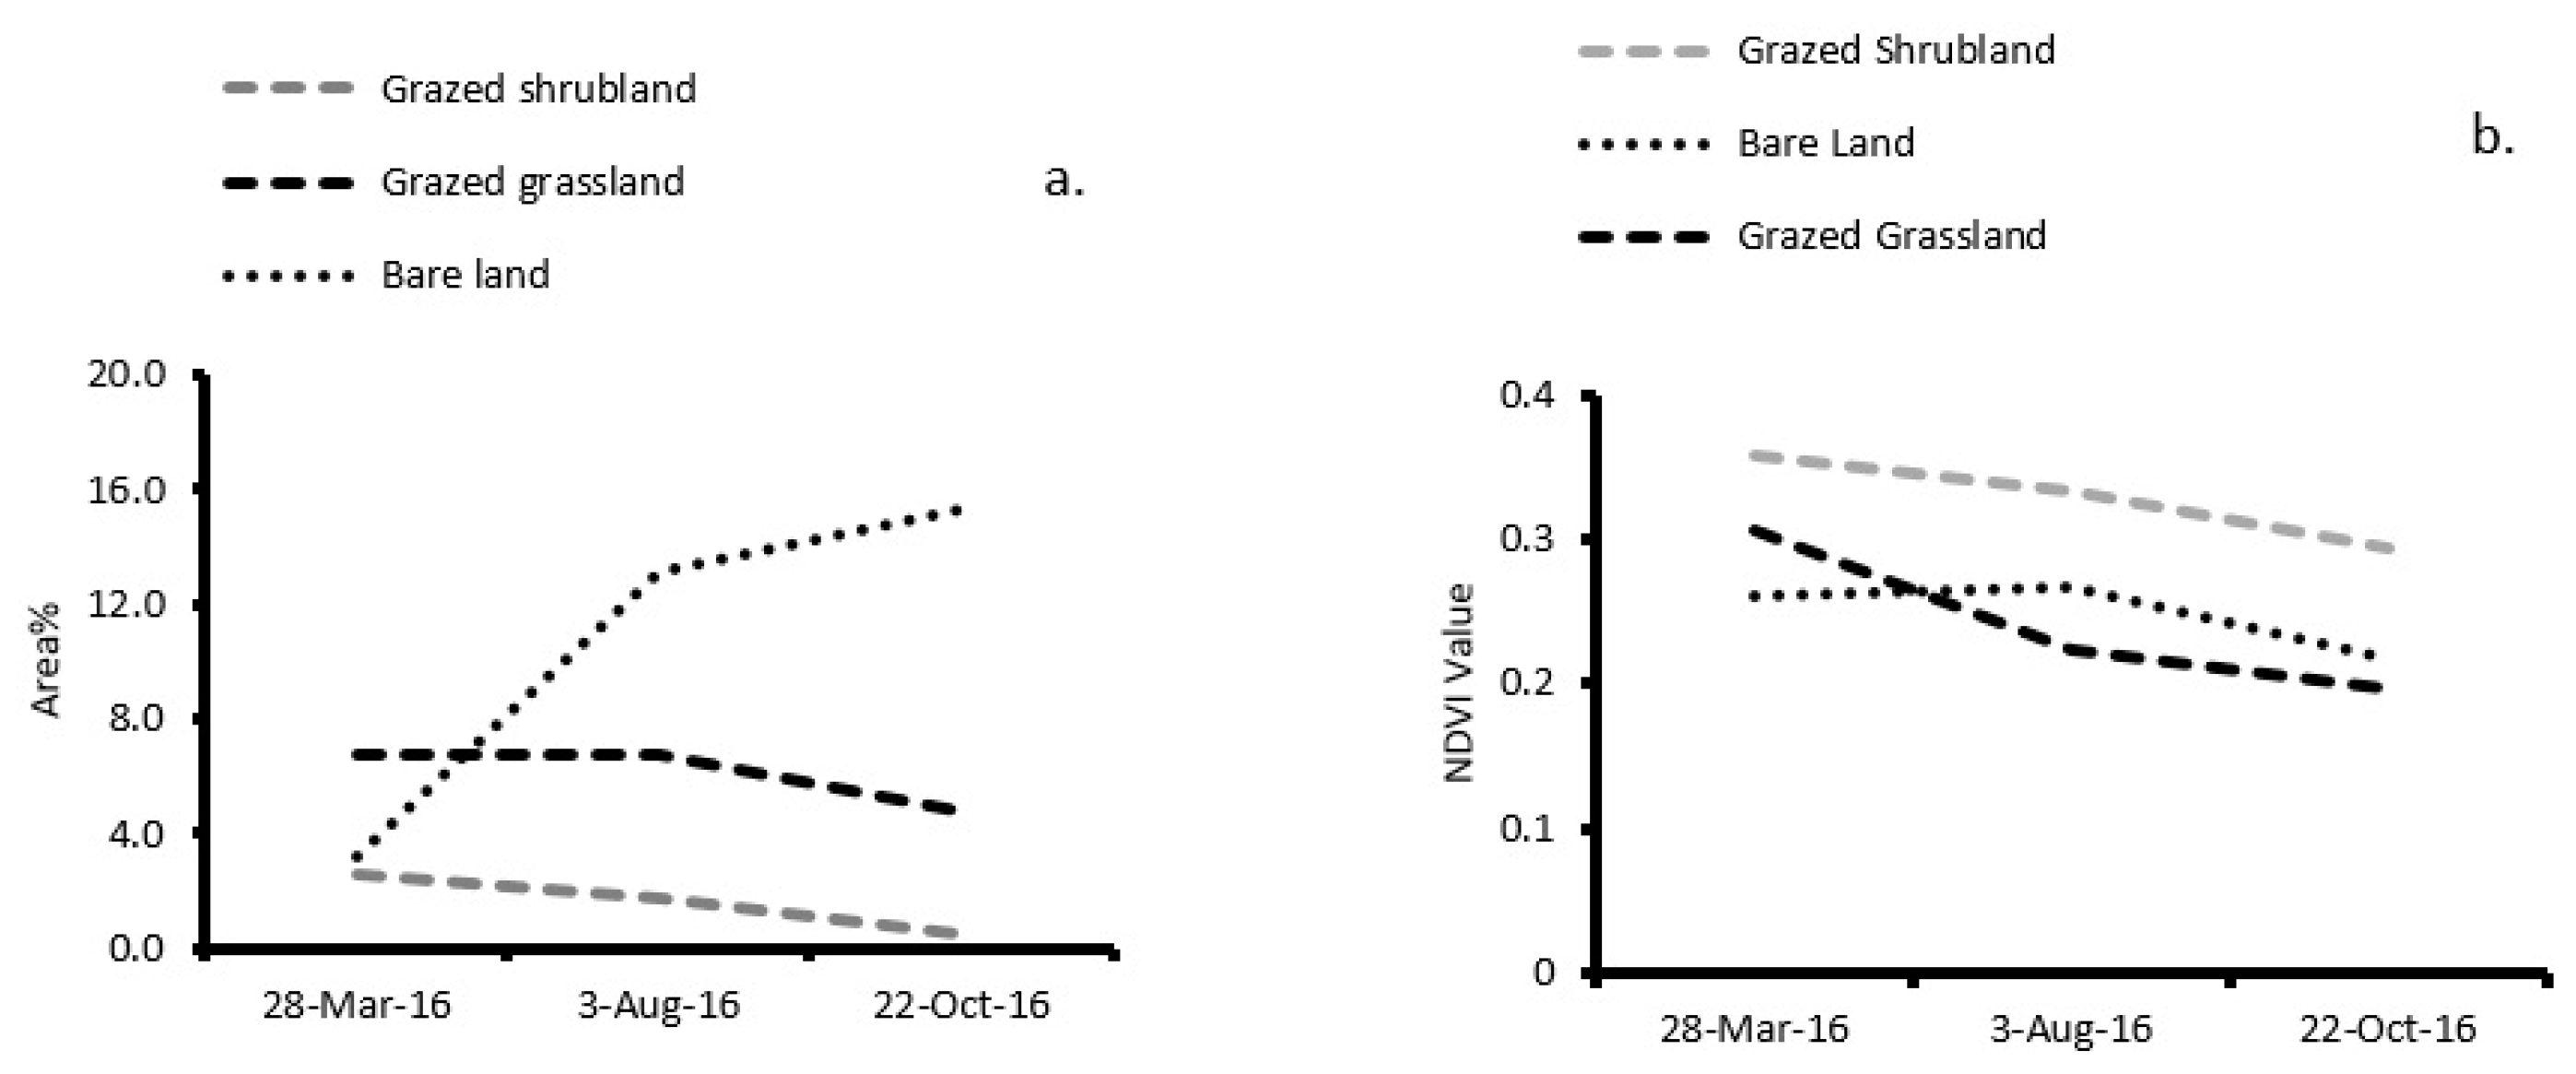
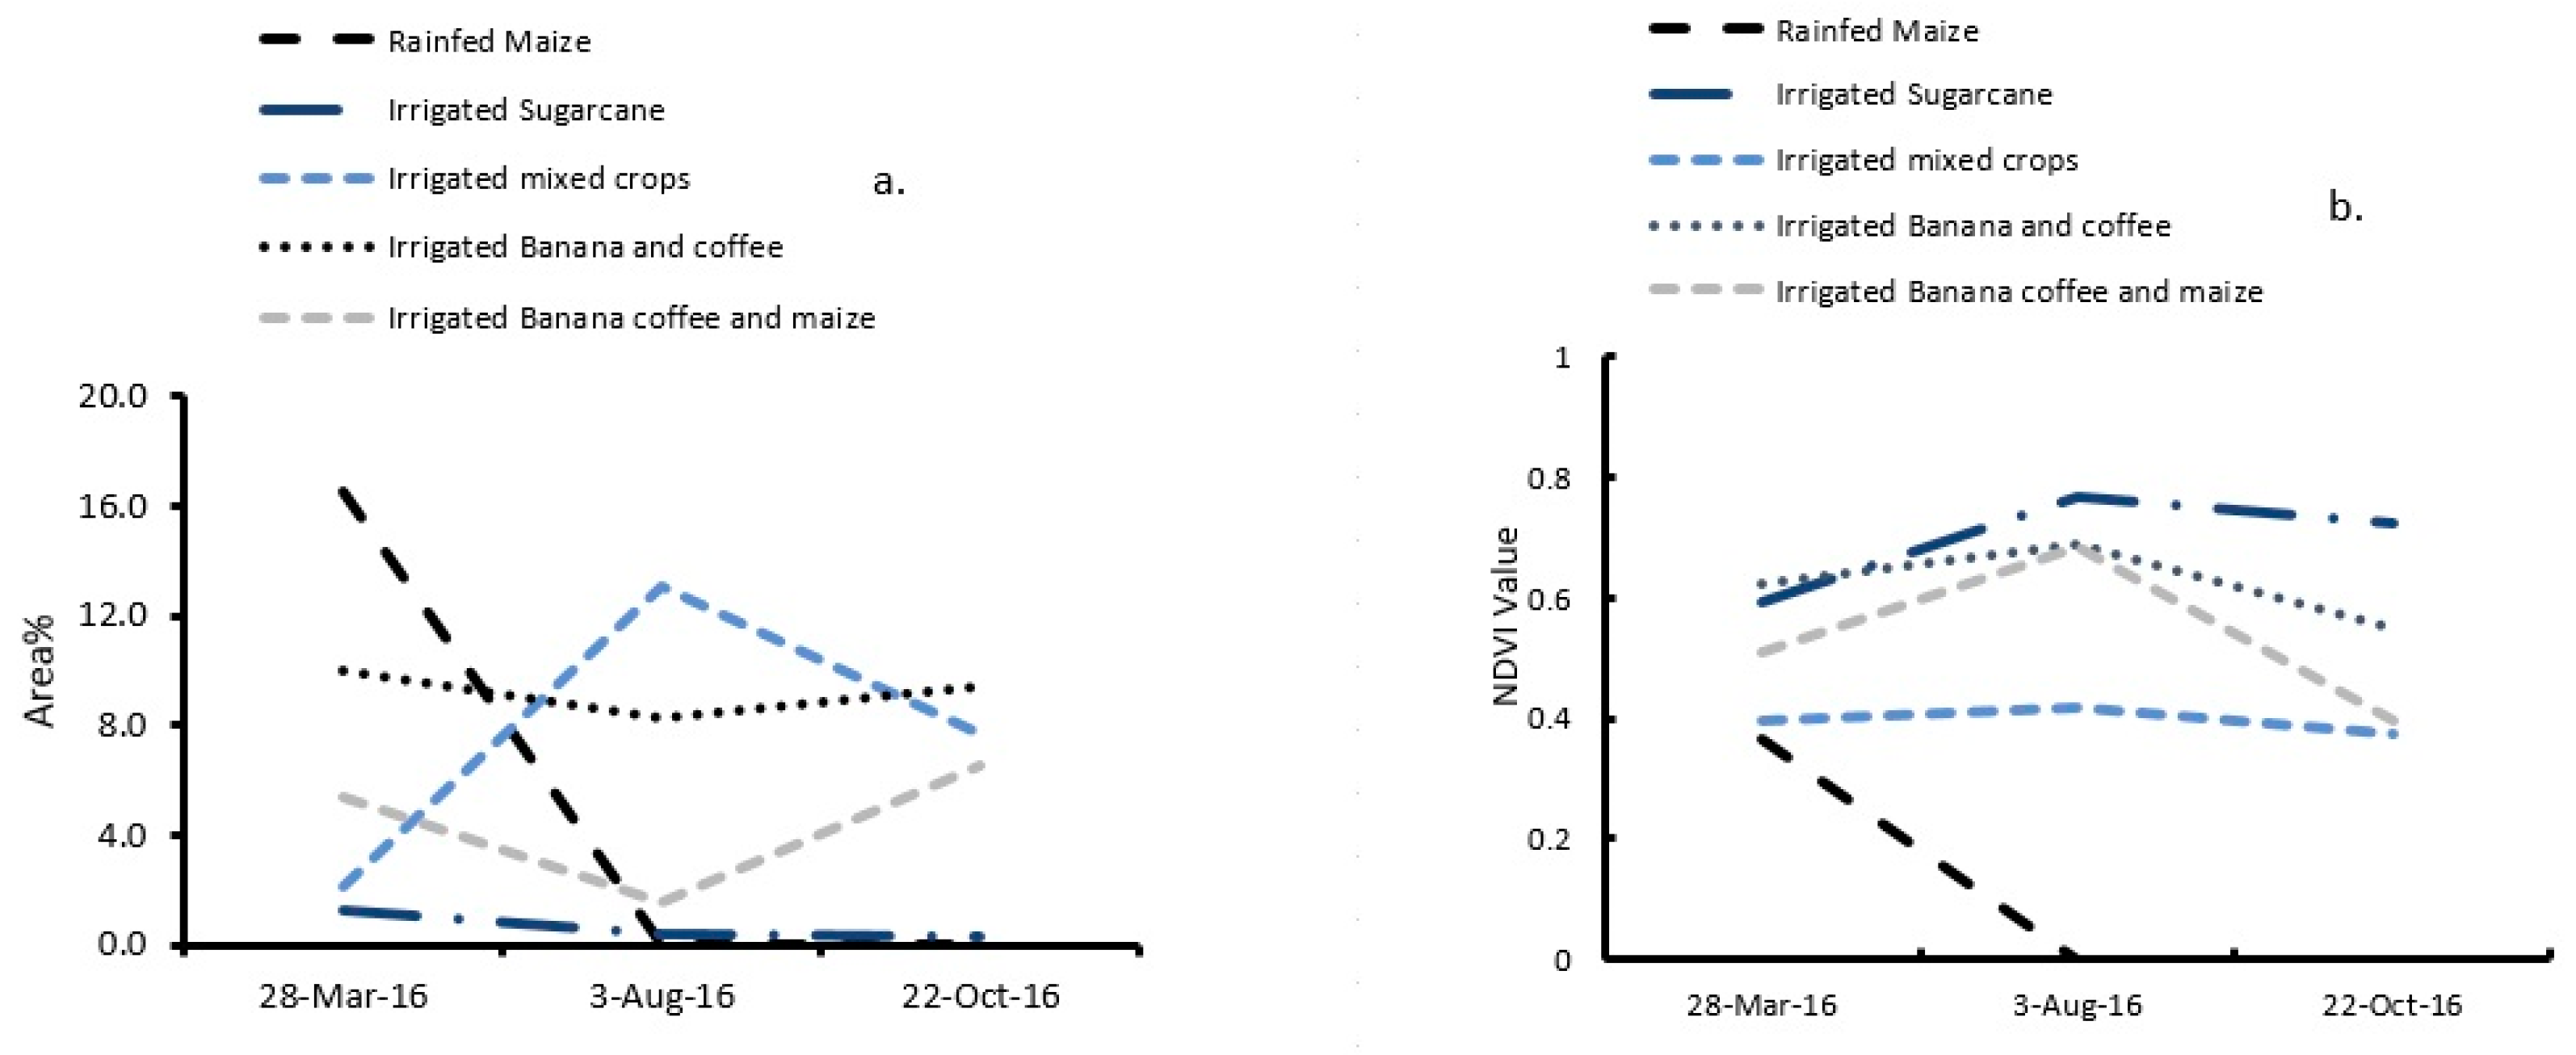
To further assess the seasonal changes of the LULC, zonal statistics and NDVI estimations were analyzed for each LULC class. Figure 8 shows the change in percentage (Figure 8a) and NDVI (Figure 8b) for extensive agriculture as well as bare land for the Kikuletwa catchment from the wet season (March) to the drier seasons (August and October). The most significant change occurs for bare land, which indicates seasonal changes in cropland due to planting, growing, and harvesting (Figure 8a). Furthermore, results in changes for all extensive agricultural land use classes indicate a decrease in NDVI from wet to drier seasons (Figure 8b). This suggests a decrease of green living vegetation (lower spectral response in NIR range) during drier months, most likely due to the lack of water.
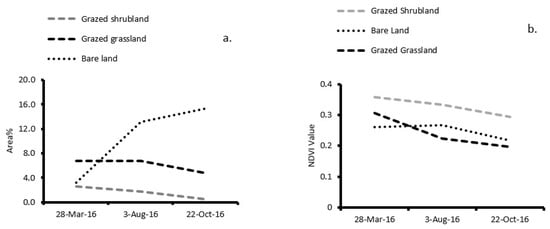
Figure 8.
Seasonal changes of extensive agricultural land use and bare land expressed in % of area (a) and NDVI (b) of the Kikuletwa catchment.
Figure 8a shows the percentage decrease of grazed grassland and shrubland areas from wet to dry months. This is in line with what was reported in the questionnaire interviews conducted in the Maasai grazed areas of the catchment. Extensive grazing starts in July when the rains have stopped. Hence, the grazed grassland and shrubland areas decrease during the drier months. Unexpectedly, the NDVI for bare land is higher than the grazed grassland in August and October. This could be explained by the extensive grazing practices in the area, especially during the dry months. The NDVI values for grazed grassland are higher than for bare land during the wet season. NDVI values for bare land have an acceptable range of [36]. However, to better capture the NDVI seasonality of the different land uses, more (Landsat) images for the wet season are required.
In Figure 9, we examine the other agricultural land use classes in March, August, and October 2016. The results indicate a significant decrease in the percentage of area of rain-fed maize from wet to dry seasons (Figure 9a). There is an increase of about 297 km2 of irrigated mixed crops in the same period. Rain-fed maize has a lower NDVI than the other classes since March corresponds to the start of the wet period (Figure 2), in which the planting starts and thus, the maize crops have not grown yet. During the dry season, the soil is bare as the crops have been harvested, and hence, the NDVI is low. This is different for other crops, such as irrigated sugarcane and irrigated banana and coffee, which show NDVI values of above 0.5, since the crops are present throughout the year. The irrigated mixed crops contain mostly vegetables, rice, and beans, and NDVI values range from 0.3 to 0.4 as expected. In March, irrigated mixed crops, such as rice, are harvested while in August, most of the other irrigated crops such as tomato and eggplant are planted and harvested in October (Table 3).
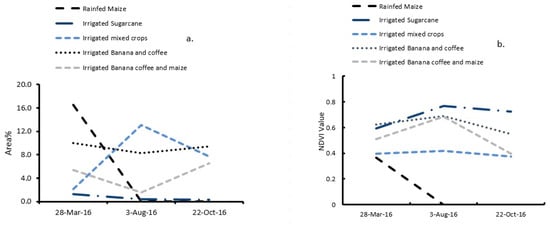
Figure 9.
Seasonal changes of agricultural land use expressed in % of area (a) and NDVI (b) of the Kikuletwa catchment.
3.5. The Hydrological Implication of Seasonal Land Use
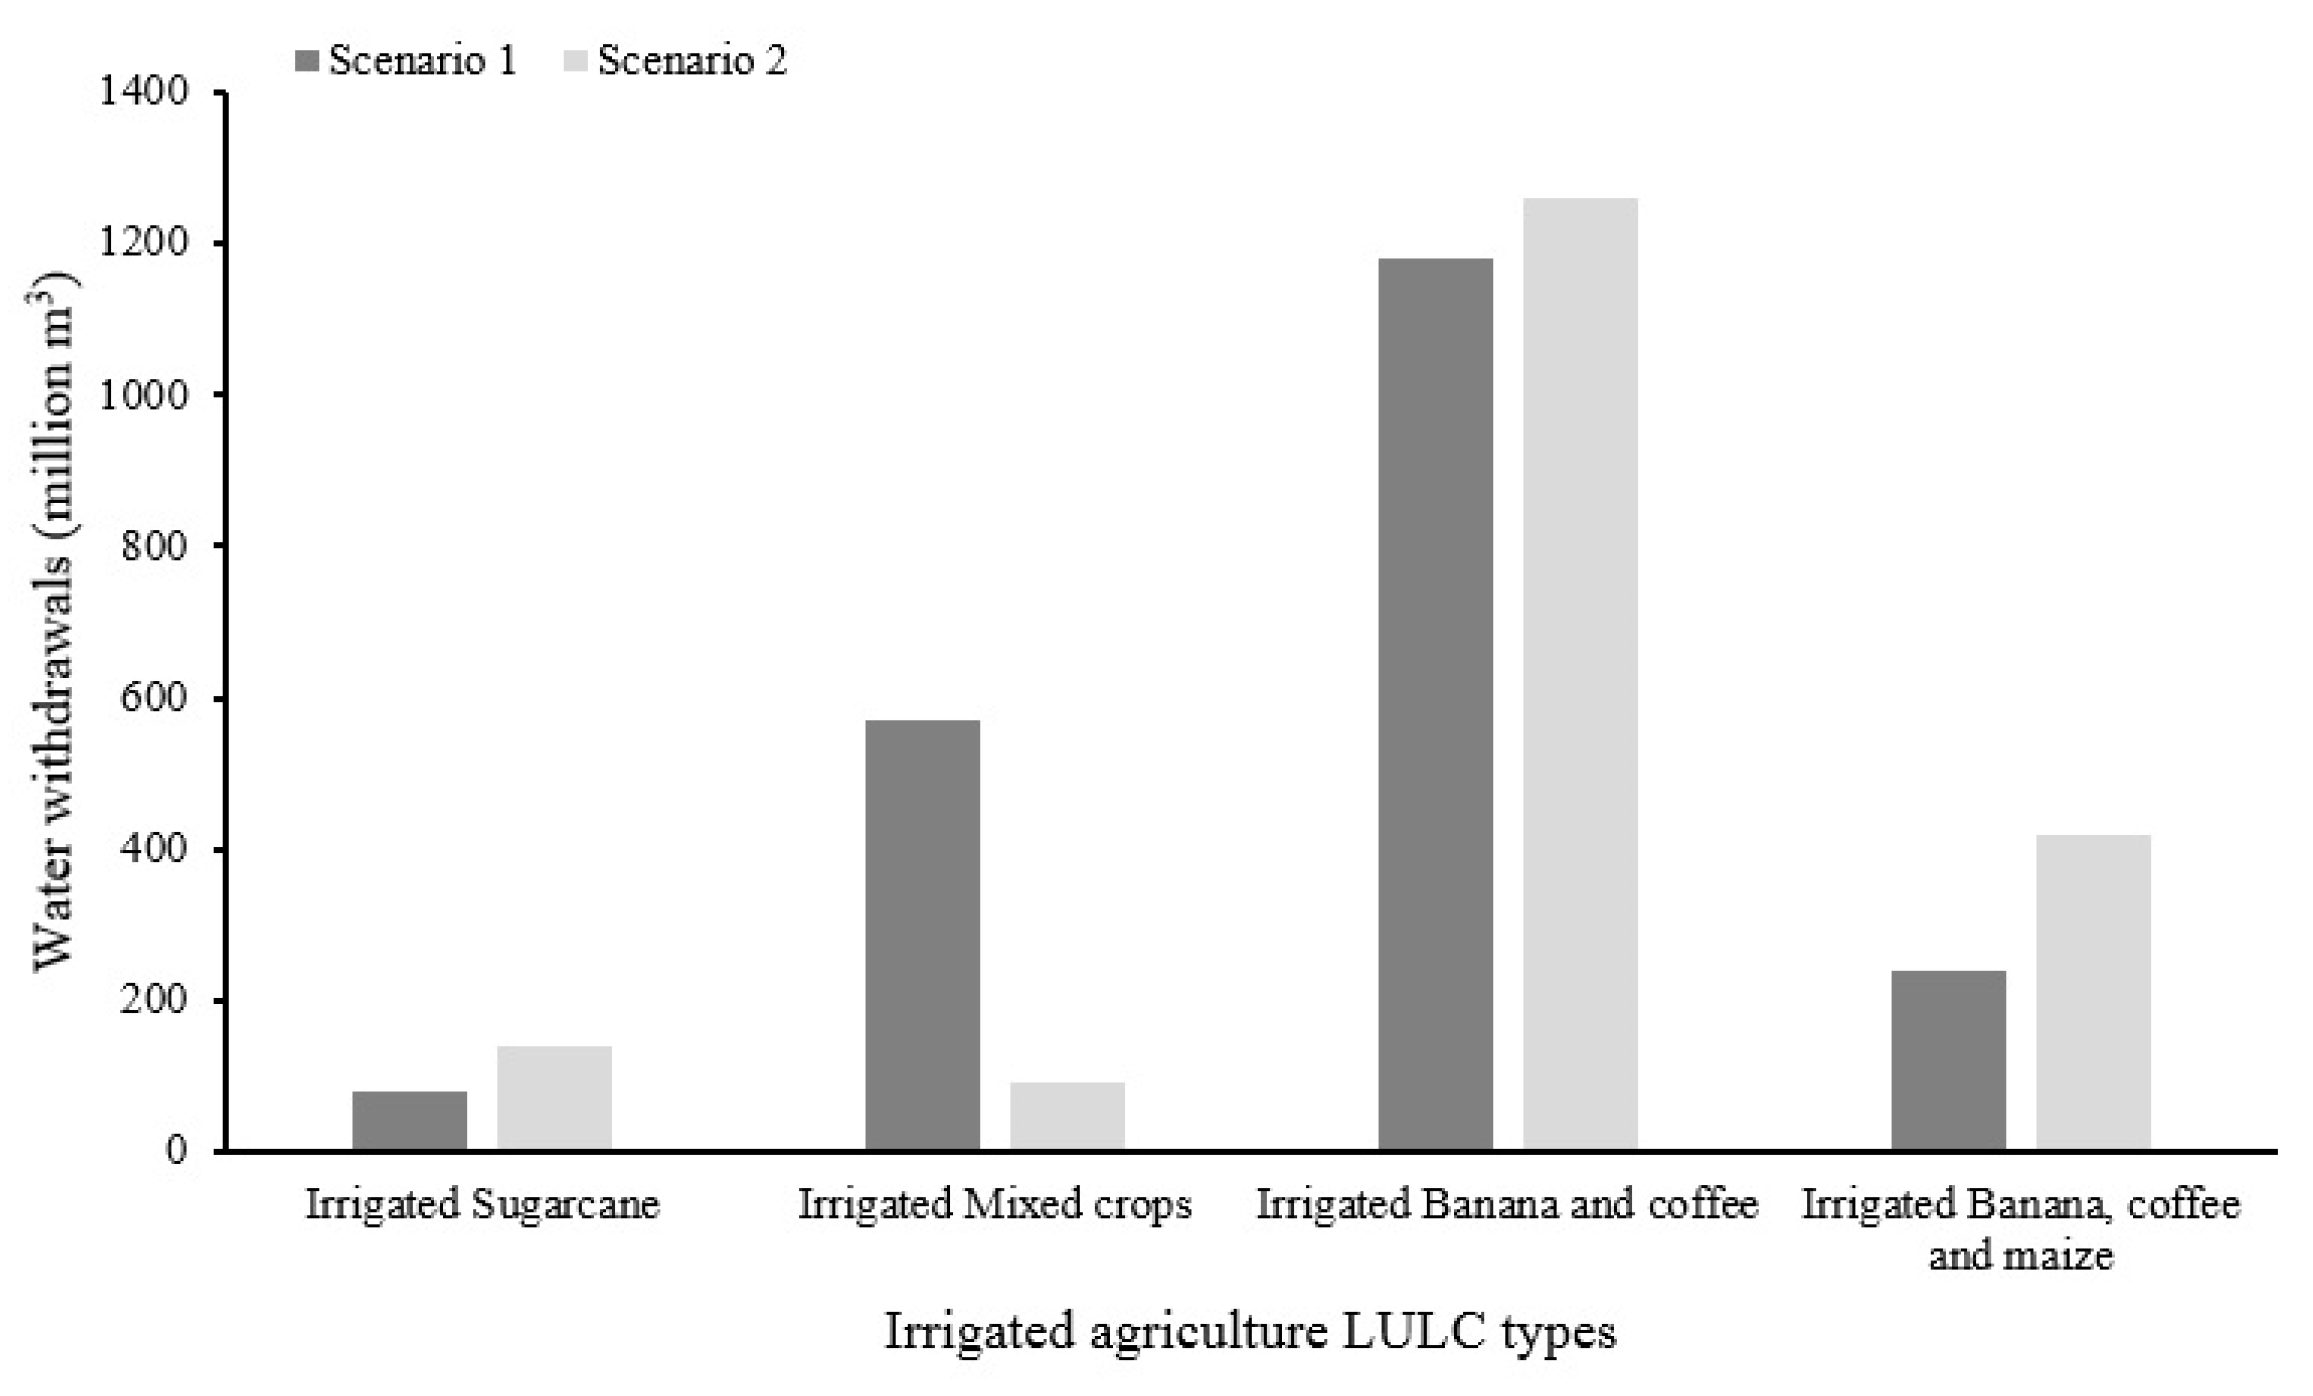
The summary of ET, P and water yield (P-ET), area, and withdrawal for each irrigated agricultural crop in the Kikuletwa catchment are presented in Table 5. When ET exceeds P, this indicates that an external water source was used for irrigation, such as abstraction of ground or surface water. Yearly water withdrawals for the irrigated agricultural land were calculated for the two scenarios: (1) Seasonal LULC maps representing dry, wet, and short rain seasons; and (2) a static LULC map without seasonal representation. A comparison of the two scenarios for the annual volume of water withdrawals per irrigated agriculture land use is presented in Figure 10.

Table 5.
Summary of seasonal precipitation, evapotranspiration, area coverage, and total annual irrigation-based ET for irrigated crops in the Kikuletwa catchment.
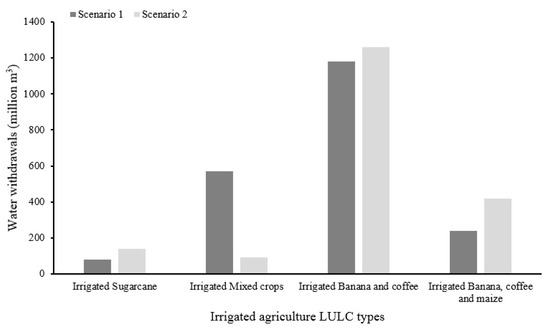
Figure 10.
Comparison of the water withdrawn for 2016 (million m3/year) when using seasonal land use maps (scenario 1) and when using a static land use map (scenario 2).
Figure 10 clearly shows water withdrawals ranging from 80 to 1181 million m3 per year and 90 to 1261 million m3 per year for scenario 1 and 2, respectively.
The estimation of water withdrawn significantly changes when seasonal land use maps or a static map is used. Analysis from scenario 1 shows that a maximum of 1181 million m3 per year of water is used for the irrigation of banana and coffee apart from precipitation, while scenario 2 shows water use of 1261 million m3 per year. The least volume of water withdrawn is from irrigated sugar cane at 80 million m3 per year from the first scenario while the second scenario shows that the least water is withdrawn from the irrigated mixed crops (90 million m3 per year). Sugar cane is a water-intensive crop (high water consumption); the low withdrawal is due to the fact that the total surface covered by sugar cane is much lower than other crop types.
The total annual ET from the three seasons for each crop ranges from 742 to 1397 mm for the first scenario and 711 to 1357 mm for the second scenario. To understand the amount of ET contributed by rainfall, and compared to other sources, such as irrigation, the mean annual precipitation and the difference between precipitation and evapotranspiration is presented in Table 5. Since the catchment is located in the semiarid regions, we assumed other variables, such as Q and ∆S, are negligible because most of the precipitation is lost to evaporation, leaving negligible amounts of runoff. The results indicate that P-ET for different irrigated land use ranges from 18% to 43% for the first scenario and 13% to 36% for the second scenario (Table 5).
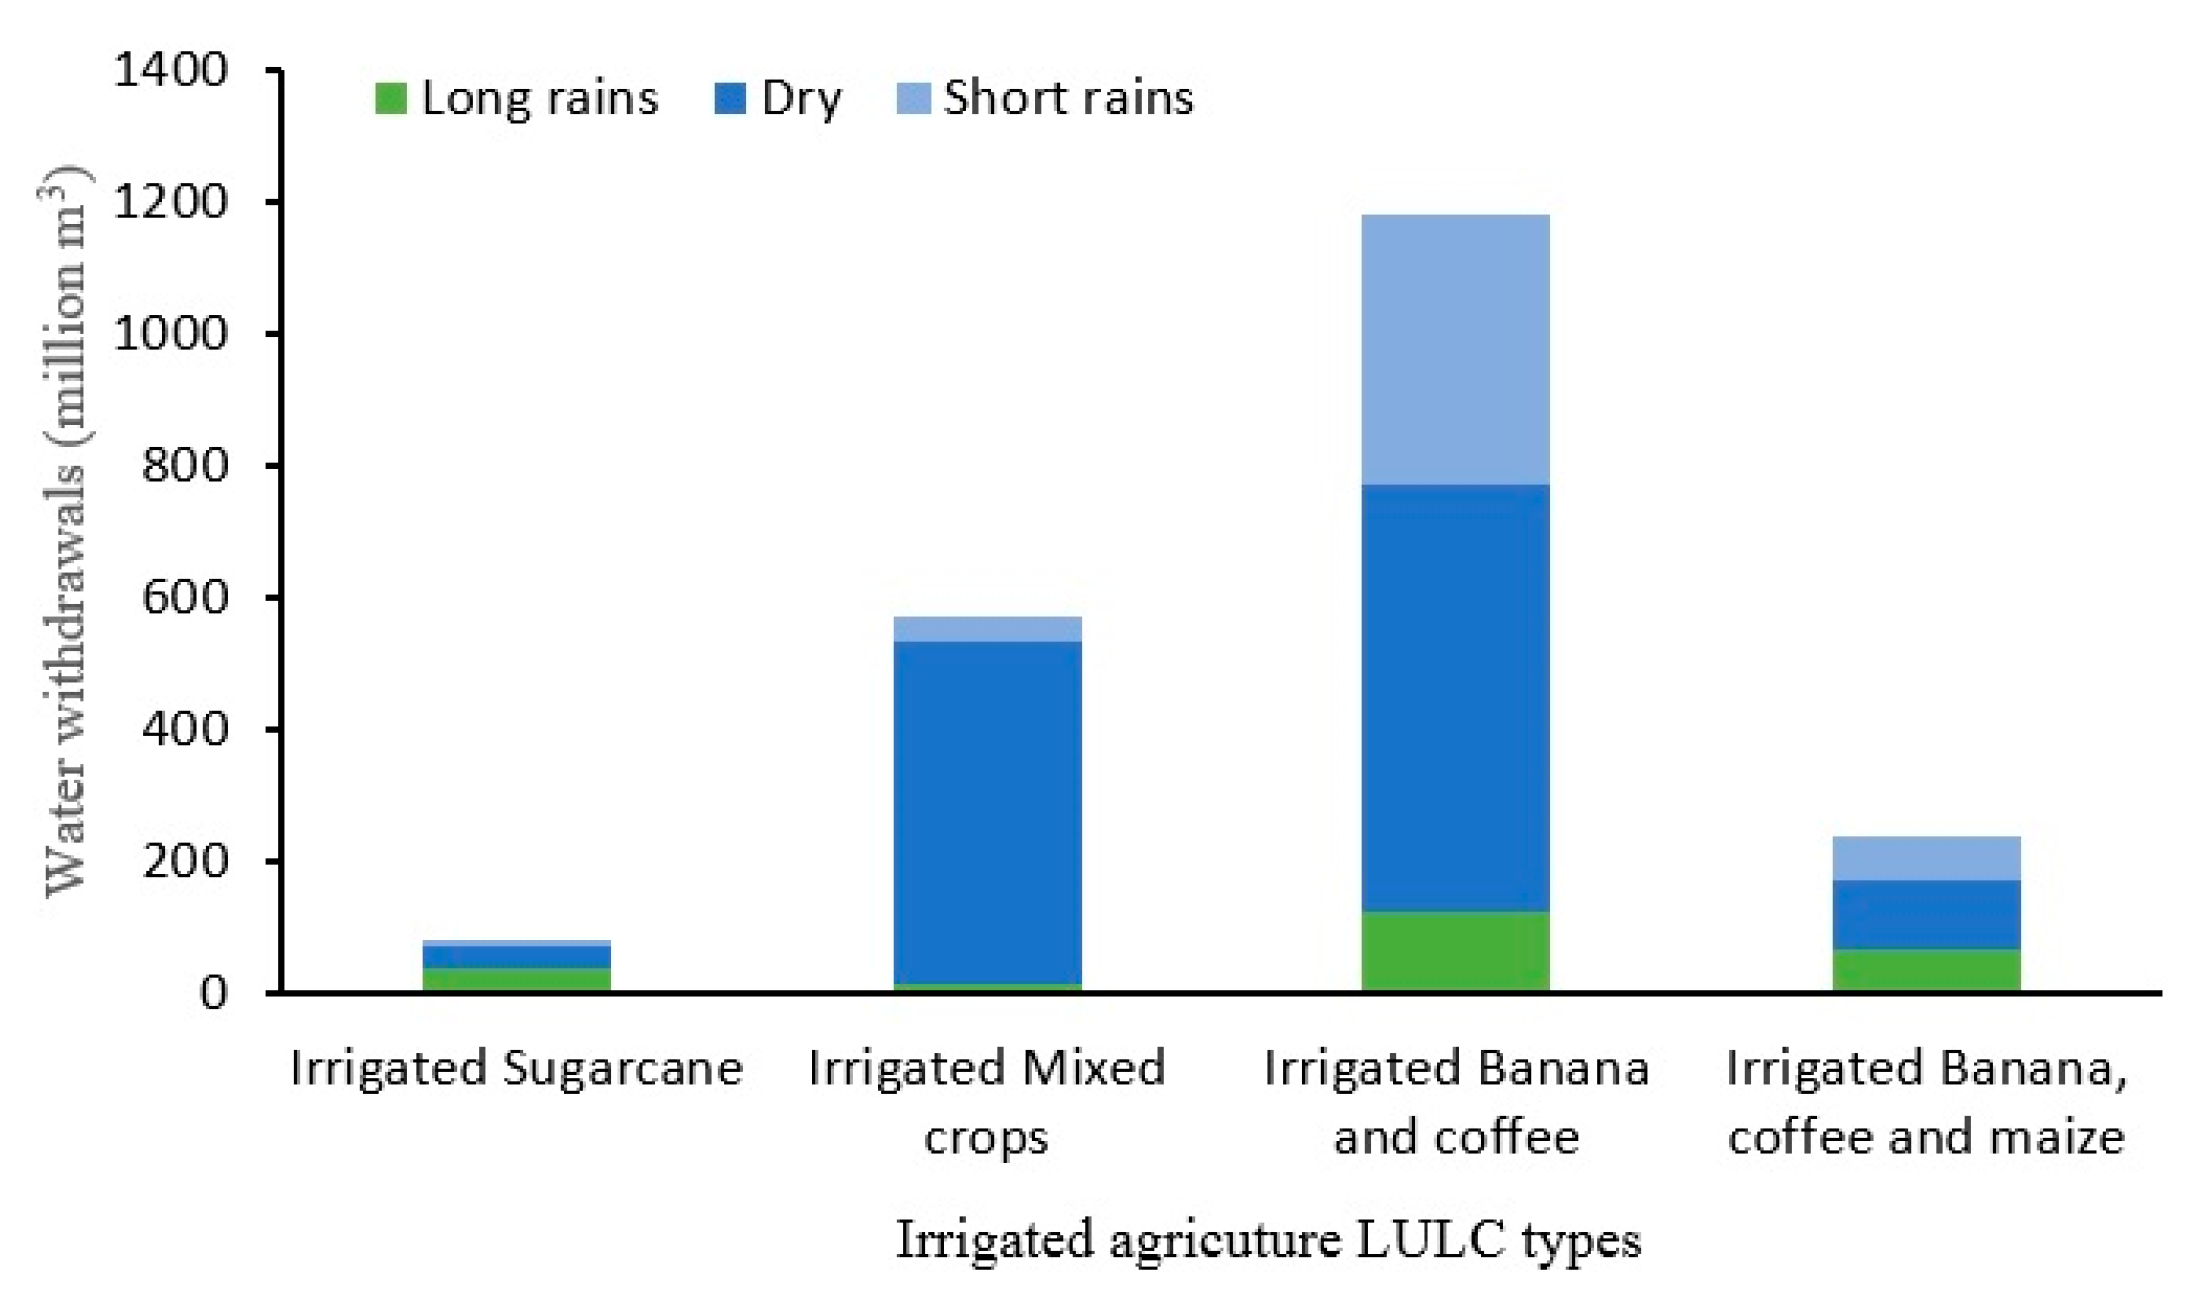
Different areas for each season were used to estimate the water withdrawals in the first scenario of dynamic land use. Figure 11 shows the different water withdrawn per each irrigated land use. The results indicate a high amount of water is withdrawn in the dry season. Irrigated banana and coffee withdrawal is up to 600 million m3 per year, followed by irrigated mixed at being 520 million m3 per year.
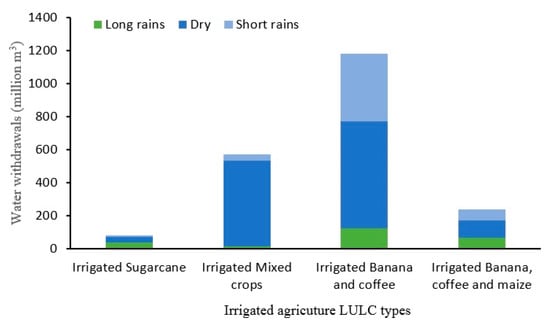
Figure 11.
Seasonal water withdrawals of irrigated crops in the Kikuletwa catchment.
4. Discussion
The combination of Landsat imagery and the developed crop calendar has proven to be useful for analyzing seasonal land use change as well as for developing a detailed classification of agricultural land use in the Kikuletwa catchment. Our results provide insight into the importance of using secondary data for land use classification. We found that the spatial distribution of classes, such as forest and perennial land cover types, corresponds to the results of past LULC studies for our study area [15]. However, large spatial differences are seen in the distribution of shrubland and rain-fed maize in the South-West section of the catchment. This may be attributed to the high resolution of the images used in this study, enabling the identification of detailed features present in the catchment.
NDVI has been used to identify and interpret a range of phenology metrics that describe periodic plant life-cycle events and the relationship with seasonal variations [37]. The higher the difference between NIR (high) and RED (low), the higher the response of vegetation at a specified area, indicating a more abundant presence of healthy green vegetation. The NDVI maps show seasonal variation between the dry and wet season, consistent with findings from past studies of semi-arid areas [38,39]. Changes in percentage areas show that seasonal land use variations in the catchment take place mostly in agricultural areas. However, the southern section of the catchment shows less percentage variation due to irrigation being applied throughout the year.
The seasonal land use maps in this study were used to obtain a better quantification of water withdrawals for irrigated land use. Accurate quantification of water withdrawals for irrigation is essential for river basin management or for managing water allocations. An analysis of water withdrawals for irrigation purposes depicted differences when seasonal LULC maps (scenario 1) were used and when static LULC maps (scenario 2) were used. From farmer interviews, we found that irrigated agricultural land uses in the Kikuletwa catchment consume blue water for irrigation purposes throughout the year. Negative values of P-ET from the analysis of the first and second scenario imply the use of other sources than direct rainfall, such as surface and groundwater, for irrigation (blue water).
Direct measurement of water withdrawals with methods, such as flow meters, is expensive and unlikely to be used in developing countries for long-term monitoring of water resources. In the Kikuletwa catchment, no such instruments are installed. Remote sensing therefore represents a cost-effective alternative to direct measurement.
Further, the estimated volume of water withdrawals per irrigated land use differs between the two scenarios. The volume withdrawn for irrigated mixed crop in the first scenario is higher than the second scenario. This is because the land area of irrigated mixed crop increases from the wet season to the dry season and it is well represented using seasonal land uses in the first scenario, which is unlike the second scenario, where the area was assumed to be constant. In line with the farmers’ interviews and site visits, the irrigated mixed crop areas increase during the dry season, and this results in higher use of water from the surface and groundwater. The opposite trend is visible in the other irrigated land uses (irrigated sugarcane, irrigated banana and coffee, irrigated banana, coffee, and maize), where the irrigated land area decreases from the wet season to the drier seasons. The seasonal land use maps represent the decrease in the area well, and this is why the first scenario shows less water withdrawn by these land uses compared to the second scenario. In the case of irrigated sugarcane, the plant takes nine months till harvest, hence the shift at the sugarcane plantation is to have fewer areas for irrigation during the drier seasons. The water withdrawn depicted by the first scenario is less than the second scenario since the second scenario misses the representation of different areas in all seasons. Irrigated banana and coffee land use showed differences of water withdrawn between the two scenarios even though the crops are perennial, and this may be because of classification errors or because of the land use class interchange between the banana and coffee and banana, coffee, and maize. When maize is planted during the rainy seasons, the class will be banana, coffee, and maize, and when maize is harvested during the dry seasons, the class can be banana and coffee.
A clear advantage of seasonal LULC maps is that a more accurate quantification is obtained for the irrigated water withdrawals in tropical catchments. However, obtaining seasonal land use maps can be challenging due to cloud cover, particularly during the wet season. For instance, in this study, we were only able to obtain an appropriate image during March 2016 to represent the wet season. However, the peak of the wet season is April or May, which could not be represented due to cloud cover. Representing the wet season by an image of March may introduce errors in the areas with late planting dates, and hence, reaching the maturity of the plants later in the wet season. This could also be the reason for low classification accuracy in the irrigated mixed crops and banana coffee and maize land use classes (Table 3).
The crop calendar developed in this study has certain limitations. The harvesting dates of some crops, such as irrigated maize, differ between the lowlands and highlands. It was based on interviews with farmers that may not always remember the exact date of crop planting or harvesting. A large selection of interviewees is needed to minimize errors and doubts. This study conducted ground truthing during the dry seasons and obtained the wet season information from farmers’ interviews at each agricultural land use class location. However, for more accurate results, ground truthing should be conducted in both dry and wet seasons. Likewise, the analysis of water withdrawals was conducted for one year only. Inter-annual variability could therefore not be addressed, as well as variations on water withdrawals occurring during drought years. Moreover, the irrigation efficiency of 25% assumed in this study could also lead to some error because the estimation of irrigation efficiency was conducted at a specific area in the Pangani basin and it might not be representative for parts of the Kikuletwa catchment.
5. Conclusions
In this study, LULC classes were mapped from three Landsat 8 images in 2016. The results were trained and validated using collected ground-truthing points, and a crop calendar was developed for the study area based on farmers’ surveys. Extensive agriculture is a common practice in the catchment, where shrubland and grassland are used for grazing, and agriculture land is used for food crop (banana, coffee, maize, rice, and vegetables) production. Spatial and temporal analysis of the agricultural seasonal land-use change trajectories were identified in the study area. The seasonal LULC change patterns of the study area were analyzed based on the seasonal land use dynamic approach versus a static land use approach through an analysis of the metrics and spatial coverage of the change. Moreover, the water withdrawals from irrigated agricultural land uses were quantified by comparing static and seasonal LULC maps.
5.1. The Main Land Uses
The main land uses that are dynamically changing include “irrigated banana coffee and maize”, “rain-fed maize”, and “irrigated mixed crops”. There is no rain-fed maize land use in the dry season, while for other land uses, like irrigated banana coffee and maize and irrigated mixed crops, the areal coverage at the catchment changes significantly. The percentage areas of irrigated mixed crops changes from 2% in March (wet season) to 13% in August then 7.7% in October (dry and short rain season). The percentage area of “irrigated banana coffee and maize” land use changes from 5% in March to 1.5% in August and 6.5% in October. The increased area in October is because of the irrigated planting season of maize during the dry period.
5.2. Differences in Water Withdrawals
The estimation of water withdrawals was significantly different when using seasonal dynamic maps or a static land use map. Based on seasonal dynamic maps, the estimated maximum withdrawals for irrigated banana and coffee were 1181 million m3 per year while the withdrawal based on a static LULC map was 1261 million m3 per year. Use of a static LULC map might overestimate water withdrawals for irrigation within our catchment area. However, the opposite is true for irrigated mixed crops land use, where the use of a static LULC map could lead to an underestimation of the water withdrawn. There are no studies or measured values in this catchment of water withdrawals per each irrigated agricultural land use to validate our results.
Yet, this paper shows that the use of dynamic LULC maps can improve the quantification of annual agricultural water withdrawals due to dynamic representation of the changing area of irrigated lands throughout the year according to the survey and site visit. Up-to-date and detailed information about the seasonal LULC dynamics delivers very valuable input for hydrological models, water accounting frameworks, as well as land management plans and policy decisions. Moreover, seasonality for water allocation and distribution in tropical catchments can be considered by using detailed seasonal LULC maps. For example, for the Kikuletwa catchment, water is distributed based on water use permits that are given to users on an annual basis. This study provides information that could be useful for policy makers and river basin management board authorities to consider giving water use permits based on seasons. In practice, this would mean considering the different amounts of water abstracted during the dry and wet season for each water use permit. Alternatively, authorities should consider crop area-based water allocation instead of volumetric allocation. This way, the issue of monitoring is less needed, and RS techniques could be applied instead.
Nevertheless, the development of detailed land use maps still faces numerous challenges, some of which have been raised in this paper. Specifically, limited Landsat images for the wet season due to cloud cover did not make it possible to show a continuous seasonal variation of land use throughout the year.
Author Contributions
Conceptualization, A.M., H.C.K., and A.v.G, Data collection, A.M., Methodology A.M., T.H., B.V., and E.S., validation A.M., T.H., E.S., writing (original draft) A.M., and A.V.G., writing (reviewing and editing) A.M., H.C.K., A.V.G., I.W., E.S., and B.V.
Funding
This research was funded by Flemish Interuniversity Council for University Development Cooperation (VLIR-UOS) through an institutional cooperation (IUC programme) with the Nelson Mandela African Institution of Science and Technology (NM-AIST), under the funded research project “Sustainable Management of Soil and Water for the Improvement of Livelihoods in the Upper Pangani River Basin”, grant number ZIUS2013AP029
Acknowledgments
We are grateful to the Flemish Interuniversity Council for University Development Cooperation (VLIR-UOS) for financing this study through an institutional cooperation (IUC programme) with the Nelson Mandela African Institution of Science and Technology (NM-AIST), under the funded research project “Sustainable Management of Soil and Water for the Improvement of Livelihoods in the Upper Pangani River Basin”, grant number ZIUS2013AP029. Thanks to all those who assisted with fieldwork, local government authorities, Pangani River basin Authority and NM-AIST management for the arrangement of field logistics.
Conflicts of Interest
The authors declare no conflict of interest
References
- Dong, J.; Xiao, X.; Menarguez, M.A.; Zhang, G.; Qin, Y.; Thau, D.; Biradar, C.; Moore, B. Mapping paddy rice planting area in northeastern Asia with Landsat 8 images, phenology-based algorithm and Google Earth Engine. Remote Sens. Environ. 2015, 185, 142–154. [Google Scholar] [CrossRef] [PubMed]
- Anderson, J.R.; Hardy, E.E.; Roach, J.T.; Witmer, R.E.; Anderson, B.J.R.; Hardy, E.E.; Roach, J.T.; Witmer, R.E. A Land Use and Land Cover Classification System for Use with Remote Sensor Data; US Government Printing Office: Washington, DC, USA, 1976; Volume 12, ISBN 0240010280.
- Van Eekelen, M.W.; Bastiaanssen, W.G.M.; Jarmain, C.; Jackson, B.; Ferreira, F.; van der Zaag, P.; Saraiva Okello, A.; Bosch, J.; Dye, P.; Bastidas-Obando, E.; et al. A novel approach to estimate direct and indirect water withdrawals from satellite measurements: A case study from the Incomati basin. Agric. Ecosyst. Environ. 2015, 200, 126–142. [Google Scholar] [CrossRef]
- Jaber, H.S.; Ahmad, N. Evaluation of SEBAL Model for Evapotranspiration Mapping in Iraq Using Remote Sensing and GIS. Int. J. Appl. Eng. Res. 2016, 11, 3950–3955. [Google Scholar]
- Jang, K.; Kang, S.; Kim, J.J.; Lee, C.C.B.; Kim, T.; Kim, J.J.; Hirata, R.; Saigusa, N. Mapping evapotranspiration using MODIS and MM5 Four-Dimensional Data Assimilation. Remote Sens. Environ. 2010, 114, 657–673. [Google Scholar] [CrossRef]
- Immerzeel, W.W.; Gaur, A.; Zwart, S.J. Integrating remote sensing and a process-based hydrological model to evaluate water use and productivity in a south Indian catchment. Agric. Water Manag. 2008, 95, 11–24. [Google Scholar] [CrossRef]
- Ndomba, P.; Mtalo, F.; Killingtveit, A. SWAT model application in a data scarce tropical complex catchment in Tanzania. Phys. Chem. Earth 2008, 33, 626–632. [Google Scholar] [CrossRef]
- Kiptala, J.K.; Mul, M.L.; Mohamed, Y.A.; Van Der Zaag, P. Modelling stream flow and quantifying blue water using a modified STREAM model for a heterogeneous, highly utilized and data-scarce river basin in Africa. Hydrol. Earth Syst. Sci. 2014, 18, 2287–2303. [Google Scholar] [CrossRef]
- Allen, R.; Tasumi, M.; Morse, A.; Trezza, R. Satellite-based energy balance for mapping evapotranspiration with internalized calibration (METRIC)—Applications. J. Irrig. 2007, 133, 395–406. [Google Scholar] [CrossRef]
- Mkhwanazi, M.; Chávez, J.L.; Andales, A.A.; DeJonge, K. SEBAL-A: A remote sensing ET algorithm that accounts for advection with limited data. Part II: Test for transferability. Remote Sens. 2015, 7, 15068–15081. [Google Scholar] [CrossRef]
- Senay, G.B.; Friedrichs, M.; Singh, R.K.; Manohar, N.; Velpuri, N.M.; Manohar, N. Evaluating Landsat 8 evapotranspiration for water use mapping in the Colorado River Basin. Remote Sens. Environ. 2016, 185, 171–185. [Google Scholar] [CrossRef]
- La, H.P.; Patrick, T.R.; Park, B.W.; Eo, Y.D. Analysis of the Relationship between MODIS NDVI, LAI and Rainfall in the Forest Region of Rwanda. Int. J. Digit. Content Technol. Its Appl. 2013, 7, 559–569. [Google Scholar]
- Zoungrana, B.; Conrad, C.; Amekudzi, L.; Thiel, M.; Da, E. Land Use/Cover Response to Rainfall Variability: A Comparing Analysis between NDVI and EVI in the Southwest of Burkina Faso. Climate 2014, 3, 63–77. [Google Scholar] [CrossRef]
- Cheema, M.J.M.; Bastiaanssen, W.G.M. Land use and land cover classification in the irrigated Indus Basin using growth phenology information from satellite data to support water management analysis. Agric. Water Manag. 2010, 97, 1541–1552. [Google Scholar] [CrossRef]
- Kiptala, J.K.; Mohamed, Y.; Mul, M.L.; Cheema, M.J.M.; Van Der Zaag, P. Land use and land cover classification using phenological variability from MODIS vegetation in the Upper Pangani River Basin, Eastern Africa. Phys. Chem. Earth 2013, 66, 112–122. [Google Scholar] [CrossRef]
- Mwangi, H.M.; Julich, S.; Patil, S.D.; McDonald, M.A.; Feger, K.H. Relative contribution of land use change and climate variability on discharge of upper Mara River, Kenya. J. Hydrol. Reg. Stud. 2016, 5, 244–260. [Google Scholar] [CrossRef]
- Sewnet, A. Land use/cover change at Infraz watershed by using GIS and remote sensing techniques, northwestern Ethiopia. Int. J. River Basin Manag. 2016, 14, 133–142. [Google Scholar] [CrossRef]
- Welde, K.; Gebremariam, B. Effect of land use land cover dynamics on hydrological response of watershed: Case study of Tekeze Dam watershed, northern Ethiopia. Int. Soil Water Conserv. Res. 2017, 5, 1–16. [Google Scholar] [CrossRef]
- Hegazy, I.R.; Kaloop, M.R. Monitoring urban growth and land use change detection with GIS and remote sensing techniques in Daqahlia governorate Egypt. Int. J. Sustain. Built Environ. 2015, 4, 117–124. [Google Scholar] [CrossRef]
- Liu, J.; Heiskanen, J.; Aynekulu, E.; Pellikka, P.K.E. Seasonal variation of land cover classification accuracy of Landsat 8 images in Burkina Faso. Int. Arch. Photogramm. Remote Sens. Spat. Inf. Sci.—ISPRS Arch. 2015, 40, 455–460. [Google Scholar] [CrossRef]
- Klein, I.; Gessner, U.; Kuenzer, C. Regional land cover mapping and change detection in Central Asia using MODIS time-series. Appl. Geogr. 2012, 35, 219–234. [Google Scholar] [CrossRef]
- Knight, J.F.; Lunetta, R.S.; Ediriwickrema, J.; Khorram, S. Regional Scale Land Cover Characterization Using MODIS-NDVI 250 m Multi-Temporal Imagery: A Phenology-Based Approach. GIScience Remote Sens. 2006, 43, 1–23. [Google Scholar] [CrossRef]
- Hansen, M.C.; Potapov, P.V.; Moore, R.; Hancher, M.; Turubanova, S.A.; Tyukavina, A.; Thau, D.; Stehman, S.V.; Goetz, S.J.; Loveland, T.R.; et al. High-Resolution Global Maps of 21st-Century Forest Cover Change. Science 2013, 342, 850–854. [Google Scholar] [CrossRef] [PubMed]
- Hemp, A. Climate change-driven forest fires marginalize the impact of ice cap wasting on Kilimanjaro. Glob. Chang. Biol. 2005, 11, 1013–1023. [Google Scholar] [CrossRef]
- USGS Science for the Changing World. Available online: http://earthexplorer.usgs.gov/ (accessed on 20 October 2015).
- Biro, K.; Pradhan, B.; Buchroithner, M.; Makeschin, F. Land use/land cover change analysis and its impact on soil properties in the Northern Part of Gadarif Region, Sudan. Land Degrad. Dev. 2011, 13. [Google Scholar] [CrossRef]
- Abd El-Kawy, O.R.; Rød, J.K.; Ismail, H.A.; Suliman, A.S. Land use and land cover change detection in the western Nile delta of Egypt using remote sensing data. Appl. Geogr. 2011, 31, 483–494. [Google Scholar] [CrossRef]
- Shalaby, A.; Tateishi, R. Remote sensing and GIS for mapping and monitoring land cover and land-use changes in the Northwestern coastal zone of Egypt. Appl. Geogr. 2007, 27, 28–41. [Google Scholar] [CrossRef]
- Deb, S.K.; Nathr, R.K. Land use/cover classification- An introduction review and comparison. Glob. J. Res. Eng. Civ. Struct. Eng. 2012, 12. [Google Scholar]
- Afro-Alpine Vegetation. Available online: http://oxfordindex.oup.com/view/10.1093/oi/authority.2011 0803095354988 (accessed on 24 May 2016).
- Congalton, R.G. A review of assessing the accuracy of classifications of remotely sensed data. Remote Sens. Environ. 1991, 37, 35–46. [Google Scholar] [CrossRef]
- Funk, C.; Peterson, P.; Landsfeld, M.; Pedreros, D.; Verdin, J.; Shukla, S.; Husak, G.; Rowland, J.; Harrison, L.; Hoell, A.; et al. The climate hazards infrared precipitation with stations—A new environmental record for monitoring extremes. Sci. Data 2015, 2, 1–21. [Google Scholar] [CrossRef]
- Makurira, H.; Mul, M.L.; Vyagusa, N.F.; Uhlenbrook, S.; Savenije, H.H.G. Evaluation of community-driven smallholder irrigation in dryland South Pare Mountains, Tanzania: Case study of Manoo micro-dam. Phys. Chem. Earth 2007, 32, 1090–1097. [Google Scholar] [CrossRef]
- Komakech, H.C. Emergence and Evolution of Endogenous Water Institutions in an African River Basin: Local Water Governance and State Intervation in the Pangani River Basin, Tanzania. CRC Press/Balkema: Boca Raton, FL, USA, 2013. [Google Scholar]
- Karimi, P.; Bastiaanssen, W.G.M. Spatial evapotranspiration, rainfall and land use data in water accounting—Part 1: Review of the accuracy of the remote sensing data. Hydrol. Earth Syst. Sci. 2015, 19, 507–532. [Google Scholar] [CrossRef]
- Montandon, L.M.; Small, E.E. The impact of soil reflectance on the quantification of the green vegetation fraction from NDVI. Remote Sens. Environ. 2008, 112, 1835–1845. [Google Scholar] [CrossRef]
- Yengoh, G.T.; Dent, D.; Olsson, L.; Tengberg, A.E.; Tucker, C.J. The Use of the Normalized Difference Vegetation Index (NDVI) to Assess Land Degradation at Multiple Scales: A Review of the Current Status, Future Trends, and Practical Considerations; Springer: Berlin, Germany, 2014. [Google Scholar]
- Amri, R.; Zribi, M.; Lili-Chabaane, Z.; Duchemin, B.; Gruhier, C.; Chehbouni, A. Analysis of vegetation behavior in a North African semi-arid region, Using SPOT-VEGETATION NDVI data. Remote Sens. 2011, 3, 2568–2590. [Google Scholar] [CrossRef]
- Ferreira, L.G.; Yoshioka, H.; Huete, A.; Sano, E.E. Seasonal landscape and spectral vegetation index dynamics in the Brazilian Cerrado: An analysis within the Large-Scale Biosphere-Atmosphere Experiment in Amazônia (LBA). Remote Sens. Environ. 2003, 87, 534–550. [Google Scholar] [CrossRef]
© 2019 by the authors. Licensee MDPI, Basel, Switzerland. This article is an open access article distributed under the terms and conditions of the Creative Commons Attribution (CC BY) license (http://creativecommons.org/licenses/by/4.0/).

