2.1. Study Area
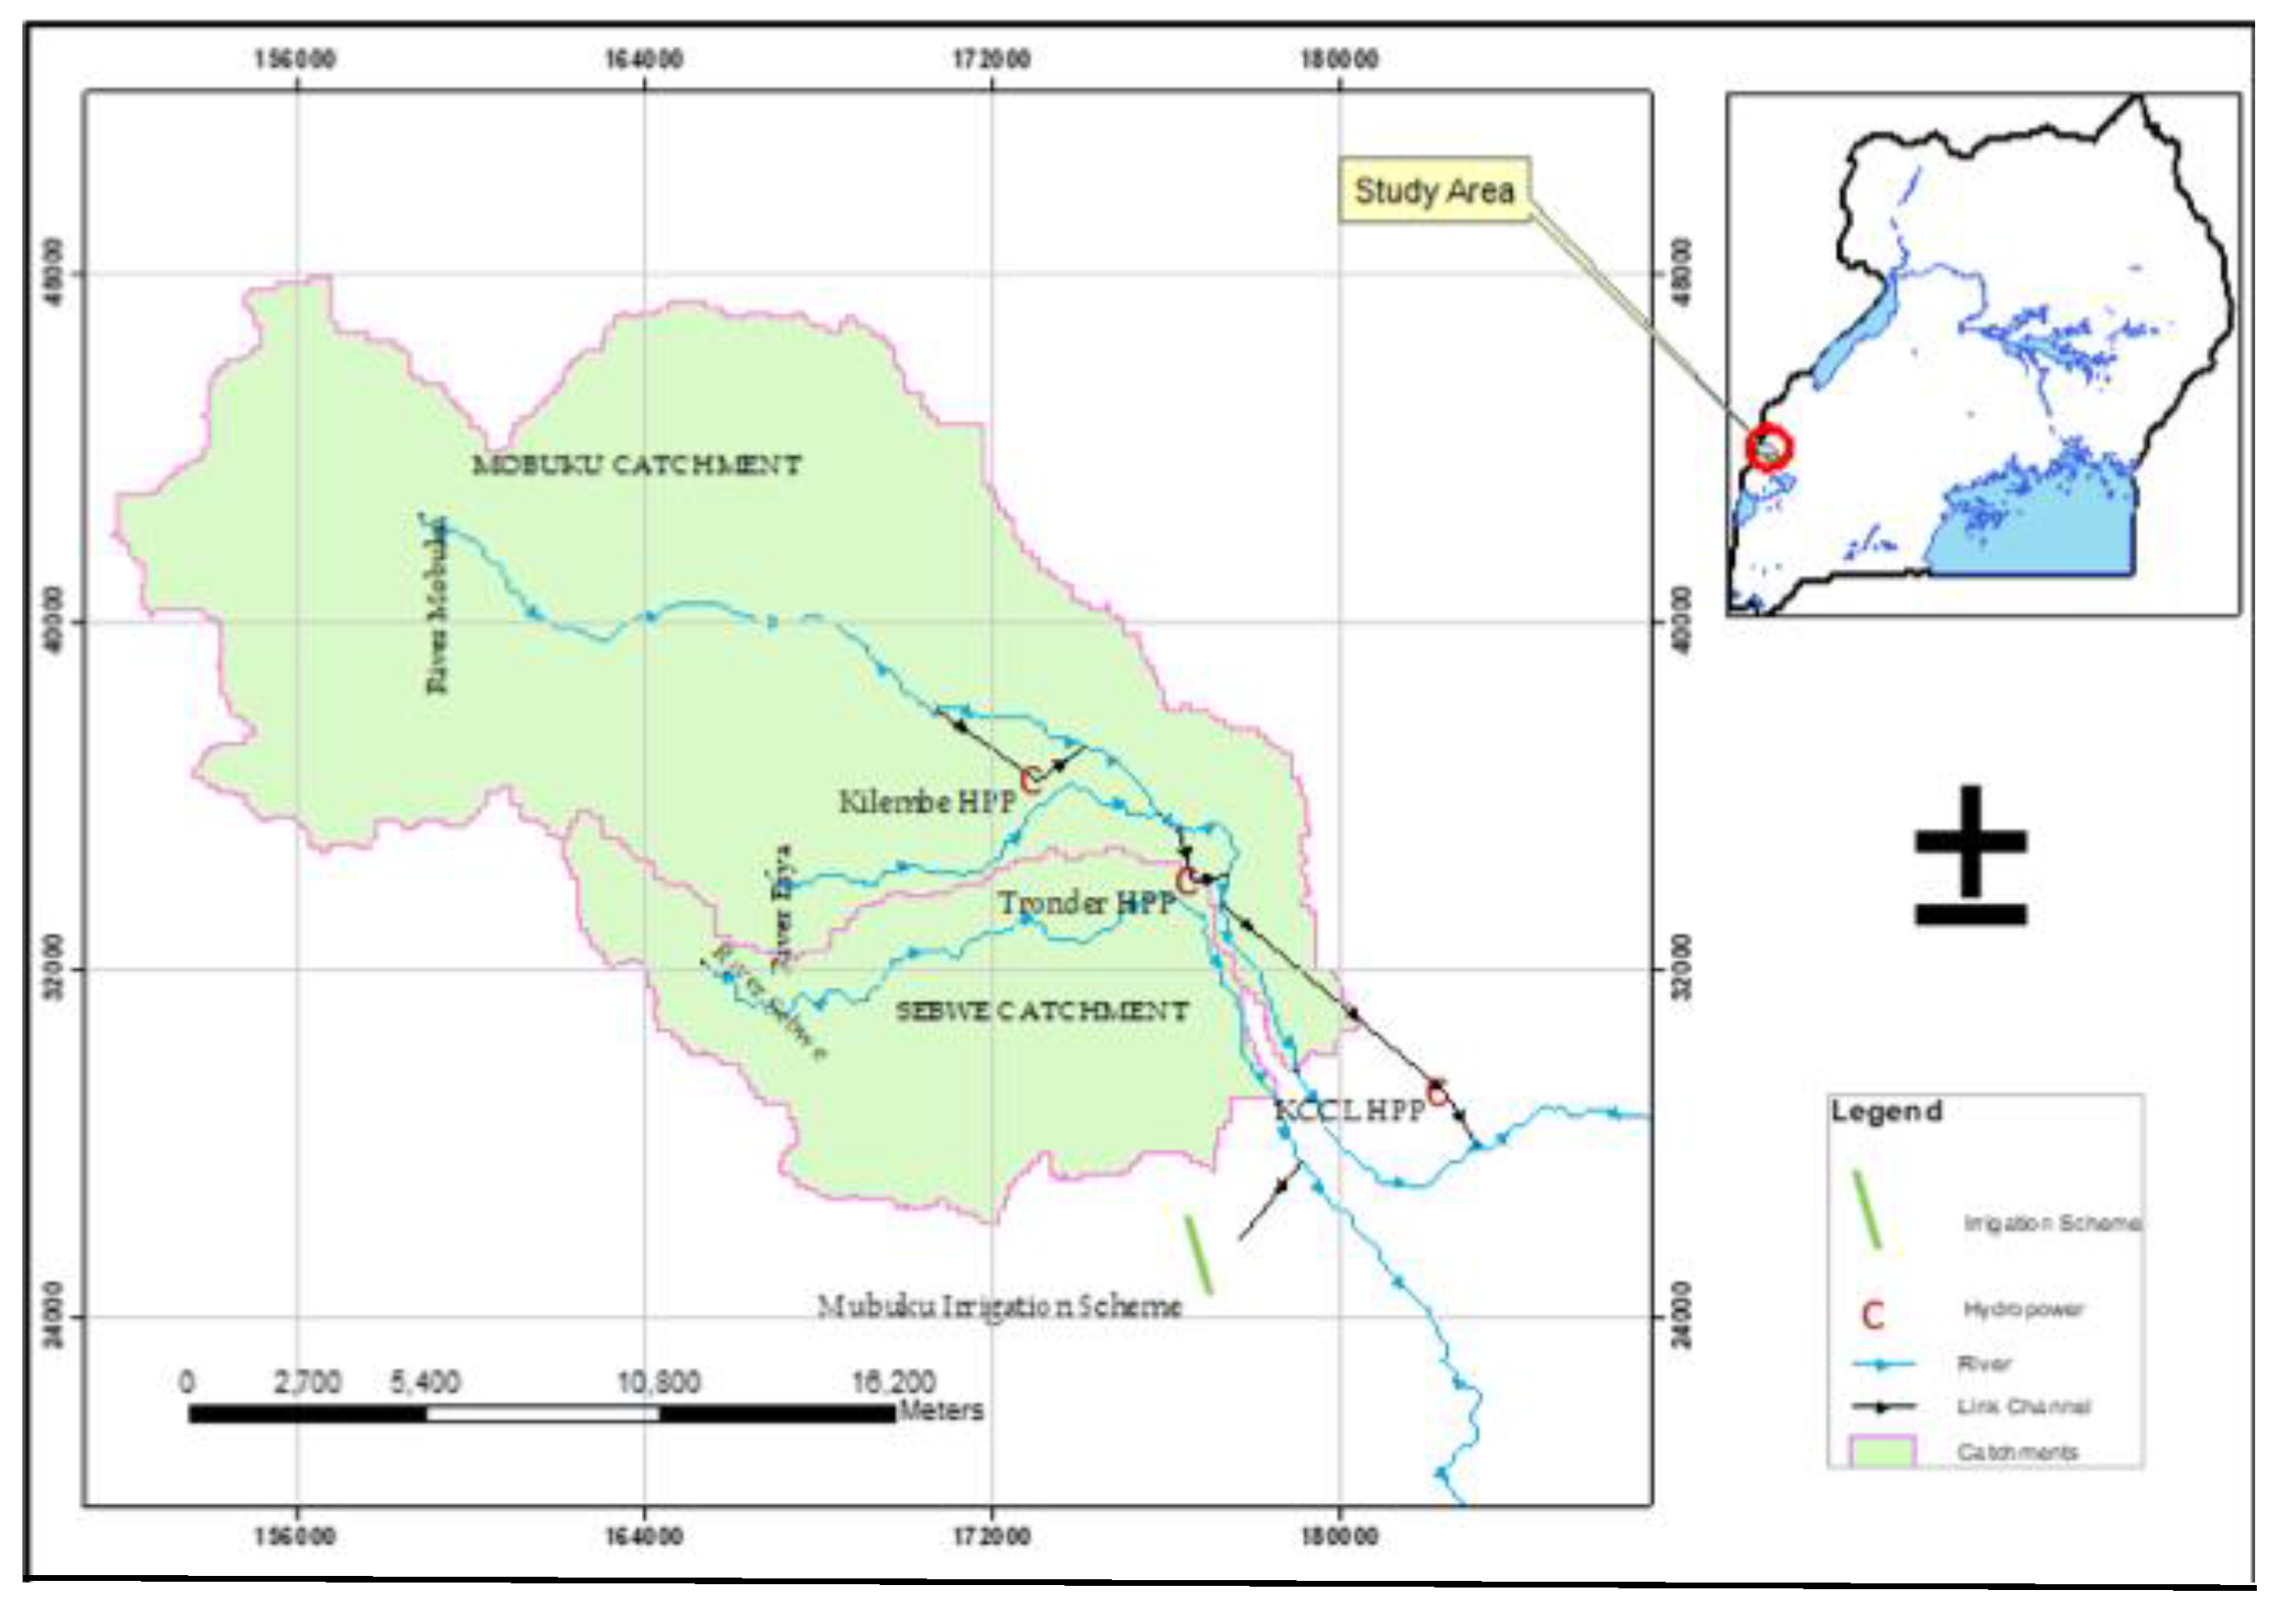
The research covers a one-and-a-half-year period in 2017–2018 from establishing a dataset to analyze. The pilot area is the Mubuku irrigation scheme in Kasese district, in a remote area of Uganda. Kasese is promoted as a high priority area due to its excellent climatic conditions for agriculture. The sub-catchment plan of River Mubuku sets poverty alleviation to the core of the planned development programs. Improving food security and typical low-income levels is envisioned through more effective natural resource use and better farming practices for sustainable land and water management [
28].
Ugandan National Water Policy regulates the establishment of User Associations of irrigators and herders to act as service providers based on performance contract. The monitoring and evaluation, as well as necessary back-up and supervision of irrigation activities remain the responsibilities of the government. While the government ensures gradual transfer of ownership of the irrigation facilities, associations are expected to collect funds in order to cover the operation and maintenance works. The Mubuku settlement scheme is not an exception to the adoption of the national policy. Its main objective is to provide decent livelihood in the area through the provision of agricultural facilities. The small-scale irrigation scheme consists of 540 hectare agricultural land cultivated by 167 farmers. According to the cropping pattern, rice, maize, and onion are produced primarily in two irrigation seasons per annum. The three crops are produced in rotation in both humid and dry seasons. Furthermore tomato, beans, and mango are cropped randomly in small plot sizes. They occupy a significantly smaller production area compared to the three main crops. Crop selection is not restricted, although a governmental maize program provides several provisions for farmers such as delivering inputs, extension services, post-harvest technology (including drying and storing), and a guaranteed minimum farm gate price. The production is commercial, despite the fact that market conditions are often unpredictable. Farmers have little market power to influence farmgate prices and become exposed to fluctuations. Furthermore, sale is physically limited to Kasese district in the absence of transportation, post-harvest technologies, or warehouses. These market uncertainties are clearly strong incentives for farmers to prefer to grow low-profitability, but fixed-price maize. The system of gravity-fed surface irrigation such as Mubuku is of high importance in Sub-Saharan Africa [
29]. Their broad application is due to low initial investment need and easy maintenance. However, surface irrigation through open canals has the lowest conveyance and application efficiency of 60% [
30]. This low efficiency calls for local actions to reduce water loss, which are preferably inexpensive and can be performed by farmers. In Mubuku, irrigation is scheduled in dictated rotation, which allows the irrigation of one block of farm (around 0.8 hectare) every four days. Rigid irrigation turns force farmers to improve their on-farm water management to its maximum potential. The Scheme has recently undergone a project led by Food and Agriculture Organization of United Nations (FAO) to improve agricultural water management through enhanced water use efficiency and crop water productivity [
31]. According to the findings of the project, improving irrigation with “hard-path” approaches such as re-engineering solutions are not enough. Complementary “soft-path” measures could increase the irrigation efficiency and improve farming outcomes. These management practices must ensure that farmers can maximize the benefits of farming while keeping production costs low [
32].
2.2. Study Design and Data
Farmers Participatory Index (FPI) is constructed in two steps. In the first step, management activities available for farmers are identified and selected. In the second step, farmers are ranked according to their engagement in these practices. The chapter provides insight into the process of implementing FPI.
In order to identify farmers’ participatory management activities, qualitative methodology was carried out in the Scheme. FAO-developed Mapping System and Services for Canal Operation Techniques (MASSCOTE) is applied to assess the performance of irrigation management in the Phase II of the Mubuku Irrigation Scheme. The overall goal of the MASSCOTE approach is to maximize irrigation efficiency by providing equally accessible and high-quality water delivery service [
33]. As the first step of MASSCOTE, a Rapid Appraisal Procedure (RAP) is carried out to establish a baseline assessment of performance (Rapid Appraisal Procedure is developed in a set of Excel spreadsheets, and is available as part of the FAO Irrigation and Drainage Paper 63: Modernizing irrigation management—the MASSCOTE approach). The RAP consists of a systemic set of procedures for diagnosing the deficiencies and potentials of the irrigation system. It allows us to identify and prioritize both infrastructural and management improvement strategies. Likewise, RAP is suitable to map the operation and management practices at an institutional level and a farmers’ level. The appraisal evolves various steps: (i.) assessment of key performance indicators regarding irrigation efficiency, management, conditions, and operation of the system and an overall water delivery service, (ii.) analysis of operation and maintenance (O&M) mechanisms, (iii.) identification of the bottlenecks of management, and (iv.) recommendations drawn for improvement. The RAP elaborates the analysis of the irrigation system through multilayer management. Each layer provides water service to the successive layer, from the water source to the final deliveries to farms [
34]. The appraisal results in a set of composite indicators known as external and internal indicators. Each composite indicator is computed from sub-indicators with assigned weights. Weights are defined according to the contribution of indicators to an efficient and high-quality water service. This sequential approach not only results in the identification of O&M activities, but also enables the distinction of management responsibilities over the previously mentioned major domains such as water management, maintenance, and financial management. The same surveys of RAP are conducted at multiple levels in Mubuku: (i) managers of local WUA, called Abasaija Kweyamba Mubuku Farming Cooperative at the management level, (ii) division leaders at the secondary canal level, and (iii) upstream and downstream farmers per each Division at the farm level. The appraisal is also decomposed along the shared management responsibilities. The current management scheme distributes the responsibilities between the Cooperative and farmers. Although the scheme has been established for decades, the management transfer from public authorities to farmers remains imperfect, and asymmetries included responsibility distribution. The Cooperative is responsible for the major maintenance works at the main canal level and the secondary canal level, such as repairing canal banks and maintaining the inspection roads and hydraulic structures. In addition, the Cooperative schedules the irrigation turns from the main canal level to the secondary canal level. Farmers are responsible for distributing water among each other below the secondary level. The elected Division leader arranges the irrigation turns among the farms, and requests an additional water supply in case of need. The farmers are responsible to maintain and operate the hydraulic structures from the tertiary level. The majority of farmers have no effective mean to carry out major maintenance work, which leads to a significant decrease in water use efficiency at the tertiary level. For water services, farmers are required to pay fees. The fee collection efficiency is about 85% when data recording. The degree of farmers’ participation in the operation, maintenance, and management varies according to their facilities, expertise, knowledge, and financial background. In order to measure the farmers’ participation, Farmers Participatory Index is established.
Based on the RAP results, performance-improving variables as management activities were selected to define involvement in management.
Table 1 shows the compiled list limited to the 14 management activities, which can be pursued in a small-scale canal system. In accordance with the three major domains, these activities are grouped as follows.
The current definition of FPI is composed of these variables. In Mubuku, possibilities of farmer participation in irrigation management are limited to these activities, but the degree of their engagement varies. Further criteria for selecting activities include equal access for all farmers. Since unequal water distribution among farmers causes continuous conflicts, activities which discriminate downstream farmers are eliminated [
35]. Based on the RAP definition, the assigned weights to variables correspond to their potential positive effect on system performance, such as irrigation-efficient management at the scheme level. In order to set standard weights for practices and align them to the overall objective of Mubuku scheme, a literature review is undertaken, which is followed by validation through the local expert pool [
36,
37,
38,
39,
40]. While considering the weights according to RAP, the most important piece of criteria was the direct effect on improved water delivery service. Budgetary issues, when farmers contribute to the overall O&M, receive the lowest weight. Activities on capacity-building, overall management arrangement, direct investments, and interventions in irrigation structures receive medium weight. High weights are assigned to maintenance and water control activities. In order to be consistent with sustainability and socioeconomic objectives of the settlement scheme, equal access to water distribution is of the highest importance. Where there is equal access to water resources, the impact of improved irrigation management is more likely to reduce poverty. Therefore, the water allocation arrangements, and, more specifically, the adjustment of the water rate to crop demand and re-distribution of the water supply among farmers receive the highest weight.
In the second step, simple random sampling was carried out involving all farmers in Mubuku. Furthermore, 122 farmers out of a total of 167 farmers are sampled. Other farmers either declined to answer or were not available at the time of the survey. The surveyed farmers follow the typical cropping pattern: maize, rice, and onion. The semi-structured survey records (i) farmers’ characteristics in the first block, (ii) pursued management activities in the second block, and (iii) farm economics data in the third block. In order to achieve the highest degree of comparability, farmers who produced maize in the growing season are preferably involved. Although tomato, beans, and mango are also produced in the Scheme, the size of the production plots is marginal, and their production practices and profitability are not available. The survey is conducted after the harvesting period of the first season from June to July 2018. In order to validate the farm economics data, a local extension service is surveyed to obtain control values. In order to calculate FPI, the second block of the survey is investigated (pursued management activities). This block involves a dichotomous scale (“Yes” or “No”) for about 14 management practices. Each farmer provided a binary response according to pursued management activities. Farmers are scored by considering these activities and their corresponding weights. Engagement in management activities is considered voluntarily assuming that the farmers pursue them only if additional cost results in higher benefits. The Farmers Participatory Index (FPI) categorizes farmers into two groups. Farmers achieving higher scores than FPI = 0.5 are pooled into the participating group while others are pooled into the non-participating group.
Table 2 presents the aggregated scores of participating and non-participating groups.
Through the computing of FPI, 60 farmers are categorized into the participating group and 62 farmers are categorized into the non-participating group from the total sample of 122 farmers. The non-participating group corresponds to the control group, and the participating group corresponds to the treatment group in the study. In order to compare these two groups, socio-economic and farming characteristics are observed. Smallholders in the Mubuku scheme are under-resourced in terms of mechanics, access to production inputs (quality seeds), or production equipment. The climatic and environmental conditions are homogenous across the scheme. Therefore, the number of optional characteristics is limited. The following variables are recorded: educational background, gender, age, number of people living in the household, information held on irrigation, frequent experience of water shortage, waterlogging and/or failing production, and access to information systems. A difference in means is used to compare treatment and control groups by characteristics such as:
where
and
are the means of each group,
SA and
SB are the sample standard deviations of the groups, and the
nA and
nB are the numbers of populations per group.
As
Table 3 reports, the major difference of the characteristics between the two groups lies in their educational background. According to the two-sample non-parametric test, the difference in means for both the education level and participation in irrigation training are statistically significant. Meanwhile, the gender and age categories are balanced between the two groups. However, it is noteworthy that both groups experience water supply shortcomings despite their sufficient water sources. Famers’ single income derives from agriculture in Mubuku, even though they lack a long experience in agriculture. Each household has around 3.4 hectares land to produce food for both household consumption and the market. The large number of household members reflects the pro-poor role of agriculture in the area. Increasing yield and income through improved agricultural practices is the primary mean of combating poverty and food insecurity in Mubuku.
Table 3 includes the outcome variables: average revenue (thousand Ugandan shilling per acre), average profit (thousand Ugandan shilling per acre), and productivity (tons per acre). The study investigates the impact of the participation on these variables. Net profit and productivity are calculated from recorded yield, production cost per unit, and production revenues per unit. Assuming that farmers’ goal is to reach the highest profit possible and the irrigation scheme allows them to select their crops, then revenue and net profit are applicable outcome variables even in a multi-cropping system. Unlike production revenue, net profit is a residual income for consumption and off-farm expenditures. Accordingly, net profit is more adequate in rural development programmes where agriculture plays a crucial role in increasing household income. The issue of revenue and net profit variables is their complexity and dependency on other production conditions. Fluctuating market results in uncertainties in establishing a direct relationship between irrigation water as production input and profitability. The evaluation requires a supplementary variable to overcome the contingency on the demand side. Therefore, productivity is introduced to complement the monetary variables. The productivity outcome variable (N = 95) is limited to maize producing farmers. Yield is measured after post-harvest weighing as being healed and dried maize seeds are for direct consumption. Since the maize programme ensures equal opportunity for all farmers with guaranteed input supply and trigger price, this variable is independent from market uncertainties. The subsidies of the maize programme encourage farmers to raise the efficiency of inputs, and to put additional effort in the production. The values of outcome variables are validated by control surveys to eliminate outliers. The control surveys are compiled with a local extension service and investigated the cost-benefit analysis of each crop. The survey details the costs of production per variable costs and fixed costs. In addition, the control survey includes the market price during the research period. The results of control surveys can be found in
Appendix A. The values differ significantly from the control surveys, are marked as outliers, and are removed. Simple difference in means of the outcome variables is reported in Column 5. The difference of means is statistically significant for each variable, whereas the participating group reaches higher average values. However, alternative methods are introduced, to avoid the possible biased estimate obtained by simple difference in means. Therefore, the study further investigates the estimates of outcome variables’ differences through more sophisticated statistical approaches to account for the groups’ characteristics. In other words, we estimate the level of difference of average revenue, average profit, and productivity between the participating and non-participating groups.
2.3. Estimation Method
The effect of farmers’ participation in management is measured on three farming outcomes: farm revenue, profitability (Ugandan shilling per acre, UGX) (Exchange rate in the time of surveying: 1 USD = 3732.26 UGX), and productivity (tons per acre). The study investigates how these outcomes vary according to the binary treatment of participating or non-participating groups in management. As mentioned before, participating and non-participating groups correspond to treated and control groups, respectively. Beyond the difference in means, three alternative econometric methods are used to estimate the effect, which include a regression adjustment, propensity score matching, and entropy balancing.
Regression specification is calculated as:
where
Yi measures various outcomes, e.g., profitability or productivity of farming for individual
i.
β is the effect of predictor,
Ti is the binary indicator of the treatment variable, as part of participation in management, and
X1 is the vector of characteristics covariates such as education level, gender, age, number of household members, attendance in irrigation training, frequent experience of water shortage, frequent experience of failing production, and access to the information system.
As another alternative strategy, the study attempts to establish counterfactual analysis by replicating the characteristics of the participating (treatment) group for the non-participating (control) group [
41]. A vast number of literature deals with establishing a causal effect relationship between factors mostly in an experimental and a quasi-experimental design. Matching is a widely used non-experimental method of evaluation that can be applied to measure the effect of participating in a program [
42]. This approach is particularly useful for research studies in remote areas, where sampling can be done only once [
43]. The concept is to find one or more non-participating farmer(s) with a similar conditional treatment probability for each participating farmer by obtaining a propensity score. In other words, the performed evaluations are based on the comparison between one group of units that received certain “treatment” (treated) and the other group of units, which did not receive such “treatment” (control). These matches are chosen according to the similarity in observed characteristics of each group member. Many evaluations and studies of different programmes aimed at measuring the effect and the degree of the effect on the outcome assume that “the treatment received by one unit does not affect other units’ outcome” [
44,
45]. In other words, estimation of the effect of farmer participation on the outcome variables of revenue, profitability, and productivity aims at answering the following question: What would have happened to non-participating farmers if they had participated in management? Methods using effective matching on critical variables are generally robust enough to minimize statistical bias, imbalance, or inefficient group identification [
46]. Therefore, they prove to be more appropriate in comparing two groups. Average treatment is estimated by the equation below.
where
T is the binary treatment variable (participation),
i1 = 1, …, and
Yi1 indicates the outcome that received treatment (
T = 1 indicates the participation, 0 otherwise). Generally, the treatment effect is defined as the average difference in outcome variables of treated and weighted non-treated matched characteristics.
where N
1 is the number of treated observations, and
Wi,j is the weight of outcome of nontreated observation
j after matching the treated observation unit
i.
The classic evaluating problem is to find
E (
Y10|
T = 1) when only
E (
Y10|
T = 0) is available. Rosenbaum and Rubin worked out the propensity score matching as the most widely-used matching approach [
47]. The propensity score is defined as the probability of treatment, or as the probability of participation in management. The model is estimated by explaining the treatment/participation by several observable characteristics (set of characteristics
X =
x1), and the prediction of this estimation is used to create a propensity score ranging from 0 to 1. The choice of variables is at a critical stage of estimating propensity scores by the logit or probit model [
48]. In the study, participating farmers are matched to non-participating farmers with some similar characteristics by using the following equation.
where
D is the indicator of exposure to treatment (participation), and
X is the multidimensional vector of characteristics. Propensity scores are derived from the standard probit model as shown below.
where
h(
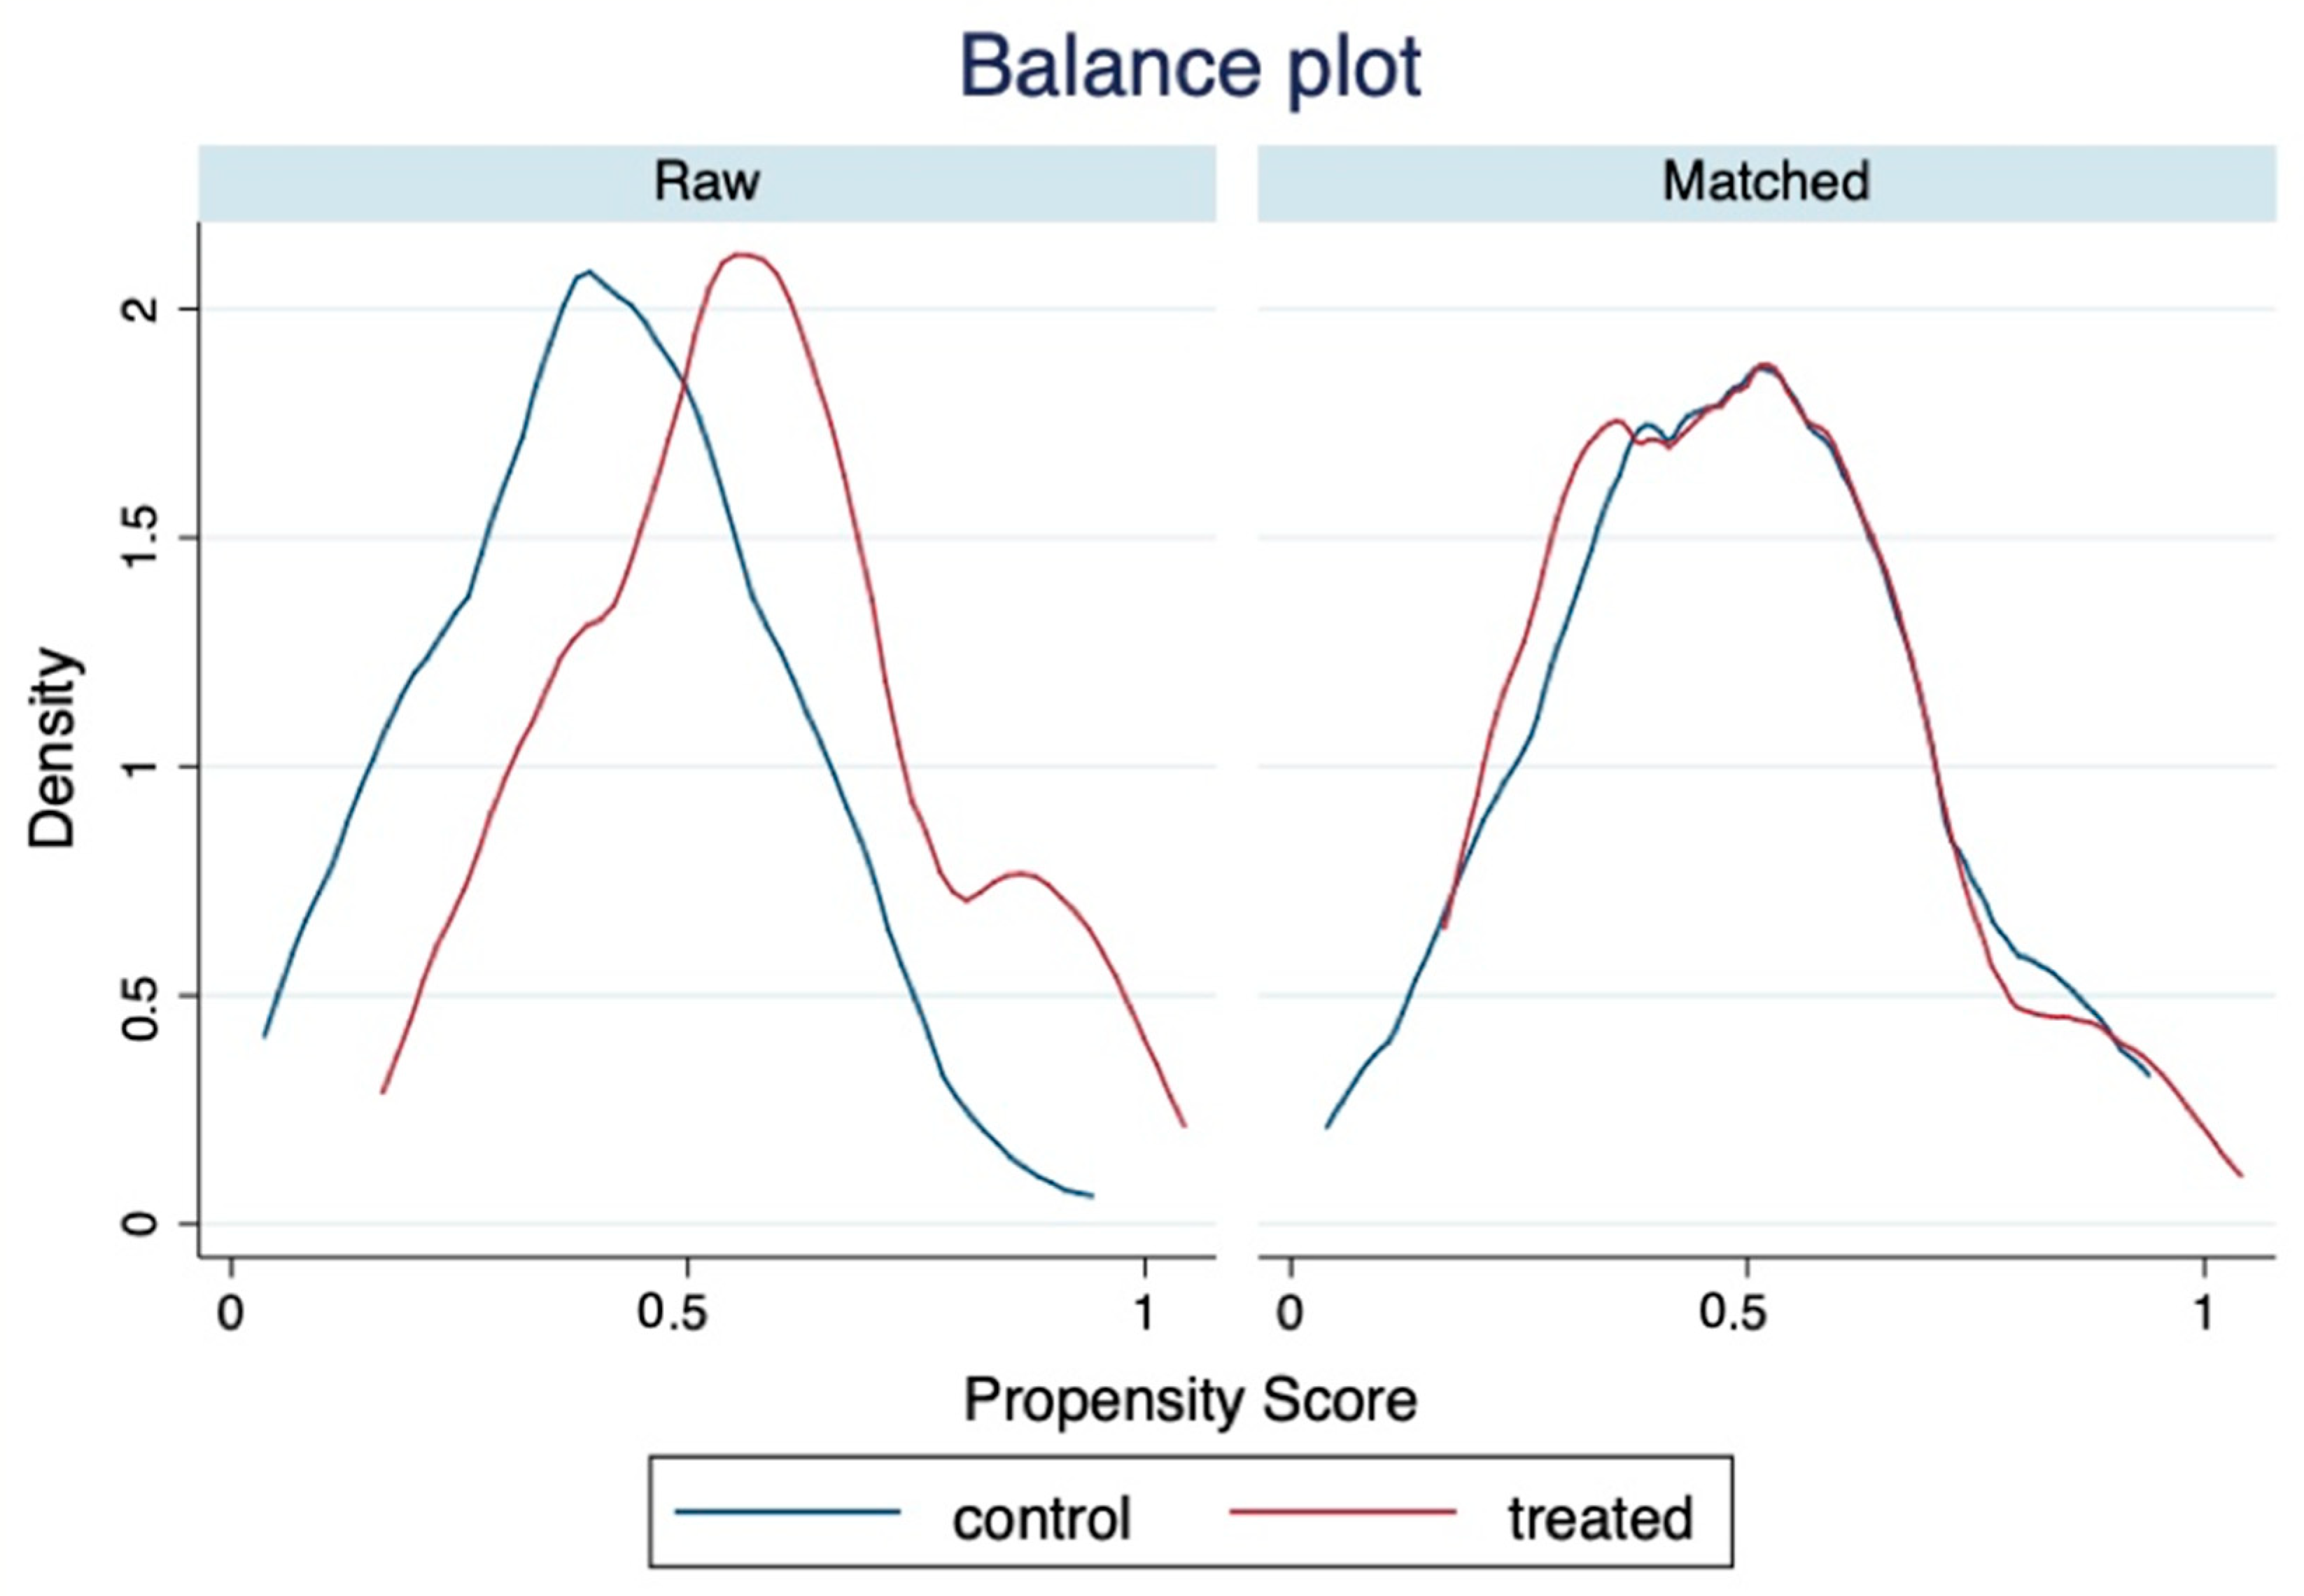
Xi) is the function of covariates with linear and higher order terms. The comparison of estimated propensity scores increases the reliability of the estimation strategy by assessing the similarity between treated and control groups. Matching the treated unit to the nearest control unit in terms of propensity scores ensures the highest comparability between groups.
Lastly, entropy balancing is introduced as a methodology to achieve a balancing property, which involves a reweighting process to incorporate a covariate balance into the weight function [
49]. This function is applied in the sample unit. Entropy balancing is necessary when covariates are significantly different between treatment and control groups. Weights for the control group are defined to seek exact balance between covariates, and to minimize loss function H(ω). In the first step, weights are assigned to the control observations by the reweighting scheme to match their characteristics to treated observations. The balancing scheme, which consists of reweighting a set of units, enables similar statistical pre-moments of covariates (e.g., skewness, mean, variances, etc.). After reaching moment-independent covariates, the counterfactual mean can be defined as:
where ω
I is the weight assigned to the control observation based on the H(ω) reweighting scheme minimizing the distance between the distribution of estimated control weights and the distribution of the base weights. The weights are adjusted as much as needed to eliminate balance constraints, while keeping the maximum possible information in reweighted data as shown below.
The key advantage of entropy balancing is the simplicity of balancing the property of covariates. As the entropy distance metric shows, estimated weights of observations remain as close as possible to the base weights to minimize loss of information.


