1. Introduction
Water is essential for humans. There is a pressing need to limit contamination of unconfined aquifers that may serve as existing or potential drinking water sources. Aquifers worldwide are being contaminated by petroleum fuels, i.e., gasoline (petrol), diesel, and fuel oils, from leaks in storage tanks and pipes as well as accidental spills. When the release of petroleum fuels occurs above the water table, the petroleum fuels may migrate downwards to the water table as a separate phase liquid through the subsurface. If a sufficient volume is released, the petroleum fuels may accumulate above the water table because they are typically less dense than water. Such petroleum fuels are commonly referred to as light nonaqueous phase liquids (LNAPLs). The LNAPLs also may depress the elevation of the water-saturated region. The amount of the depression is a function of the LNAPL volume above the depression of the water-saturated region.
Subsurface LNAPL contamination is a complex issue and there are many factors that affect how best to address the contamination. The Interstate Technical & Regulatory Council (ITRC) lists three concerns when responding to subsurface LNAPL contamination: risk and safety concerns, migration concerns, and mobile LNAPL occurrence concerns [
1]. Under risk and safety concerns they include human or ecological exposures and risk concerns arising from the presence of the LNAPL; under migration concerns they include the potential for further LNAPL migration, which may create new exposures and risks; and under mobile LNAPL occurrence concerns they include LNAPL-specific regulatory requirements, such as removal of mobile LNAPL from existing wells to a defined threshold. An important step for addressing subsurface LNAPL contamination is developing a comprehensive document (plan) based on sound science that includes the three concerns and guides subsequent remediation activities. Such a document has been called a LNAPL Conceptual Site Model (LCSM) by ITRC [
2] and based upon U.S. Environmental Protection Agency [
3] and earlier documents. A LCSM needs to be updated as LNAPL contamination conditions change. [
4] lists potential elements that can be included in a LCSM. They further stress that developing a LCSM is an iterative process.
In order to develop comprehensive plans for addressing subsurface LNAPL contamination, the ITRC states that the LNAPL vertical spatial distribution, potential mobility, and potential recoverability are important elements [
5]. Understanding the volume and spatial distribution of LNAPL in vertical slices of the subsurface are crucial for estimating the LNAPL potential mobility and recoverability via pumping from wells. The LNAPL volume per unit horizontal area in a vertical slice of the subsurface is commonly referred to as the LNAPL specific volume [
6]. Investigators can estimate the volume and spatial distribution of LNAPL in vertical slices of the subsurface by measurement methods or by predictive models. Some measurement techniques are coring and high-resolution, laser-induced fluorescence (LIF), which may be costly to conduct. Radioactive attenuation techniques are not permitted generally for near surface depths where potable water may be encountered. Predictive models are either numerical multiphase flow codes or analytical models based on LNAPL levels (elevations or depths) in monitoring wells. Numerical multiphase flow codes may require costly computer systems. Analytical models likely require less processing power. Note the LNAPL subsurface volume and spatial distribution from either measurements or predictive models are only valid for the locations where the measurements are conducted or where the data for the predictive models are determined.
Both numerical multiphase flow codes and analytical models have improved over time. [
7] recently presented an improved computational framework using a numerical multiphase code for predicting LNAPL subsurface behaviour. [
8] recently presented an improved analytical model using current and historic fluid levels in wells to predict subsurface LNAPL specific volumes and transmissivity. The analytical model by [
8] is based on the approach introduced by [
6,
9], but accounts also for entrapped and residual LNAPL. The model yields variable LNAPL saturations and relative permeabilities with elevation. Earlier approaches [
10,
11,
12] assumed a LNAPL ‘pancake’ immediately above the water saturated regions, i.e., above the water-saturated capillary fringe over the water table. [
13] concluded the approach by [
6,
9] is more reliable and representative (accurate) than the pancake approach for estimating subsurface LNAPL volumes.
Testing either numerical multiphase flow codes or analytical models against laboratory or field data is complicated and requires significant effort. Various measurements may be needed, and the site needs to be adequately characterized, including determining all parameters required for the models. Seldom there are sufficient financial resources to thoroughly test models at LNAPL contaminated sites. Hysteresis in capillary pressure–saturation-relative permeability relations further complicates the testing of predictive models.
In this paper, we test the recent analytical model by [
8] against data collected by the Commonwealth Scientific and Industrial Research Organization (CSIRO) over multiple years at a site. We test the model using independent measurements. Rarely are there the type of independent measurements necessary to objectivity test such models. Fortunately, the site investigated does have the independent measurements necessary to objectively test the model. We call our test “preliminary” because we compare only measured and predicted vertical LNAPL saturations and not measured and predicted LNAPL transmissivities. Further, we test the model at a single site. In addition, we emphasize how considering hysteresis in capillary pressure–saturation relations can affect predictions from either numerical multiphase flow codes or analytical models.
2. Model
The analytical model by [
8] predicts the total, free, entrapped, and residual LNAPL saturations in a vertical slice of the surface using the elevations of the air/LNAPL and LNAPL/water interfaces in a nearby well. The predicted saturations are valid only near the well. The air/LNAPL and LNAPL/water interfaces in a well are assumed to be representative of the fluid pressures in the formation and static, i.e., the LNAPL is not migrating downwards or upwards—vertical equilibrium conditions exist. The entrapped LNAPL saturations (water occluded) are predicted using the historical lowest elevation of the LNAPL/water interface in the well. The residual LNAPL saturations (non-water occluded, but immobile) are predicted using the historical highest elevation of the air/LNAPL interface in the well. From the predicted LNAPL saturations, the total, free, entrapped, and residual LNAPL specific volumes are calculated. From the predicted free LNAPL saturations, the vertical distribution of LNAPL relative permeabilities is calculated, which is used to predict the LNAPL transmissivity (the volumetric LNAPL flux across a unit width of the subsurface containing LNAPL under a unit LNAPL pressure gradient). Both the total (free) and recoverable transmissivities are predicted where the recoverable transmissivity pertains only to the LNAPL at higher pressures than atmospheric. In the subsurface, LNAPL can exist at higher and lower pressures than atmospheric. Only LNAPL with higher pressures than atmospheric will enter a well borehole and potentially be recovered by pumping. LNAPL with lower pressures than atmospheric will not generally enter a well borehole from the subsurface cavities (pores and narrow fractures) because of capillary forces. The LNAPL with lower pressures than atmospheric still may be mobile depending if a LNAPL pressure gradient exists, but the movement will be substantially slower than the LNAPL with higher pressures than atmospheric. The total (free) LNAPL transmissivity is a measure of the potential total mobility of the LNAPL, whereas the recoverable LNAPL transmissivity is a measure of the potential flow into the well borehole. An assumption is made in the model that the predictions are not dependent on whether the historical highest or lowest fluid level elevations in a well occur first. Numerical simulations suggested that this assumption is reasonable [
14].
To use the model, an investigator needs to determine the relevant parameters and required inputs. Two general type of parameters are required: hydraulic parameters and fluid parameters. The hydraulic parameters are
α and
n of the [
15] capillary pressure–saturation function, residual water saturation, porosity, and the maximum residual and entrapped LNAPL saturations. The fluid parameters are the air/LNAPL and LNAPL/water interfacial tensions, the ratio of the LNAPL to water viscosities (LNAPL/water specific viscosity), and the LNAPL specific gravity, which is the ratio of the LNAPL to water mass densities. The inputs are the elevations of the ground surface and the air/LNAPL and LNAPL/water interfaces in a well, both current and historic. If only one of the air/LNAPL or LNAPL/water interfaces are measured along with the air/water elevation in a nearby well, then the other air/LNAPL or LNAPL/water interface can be calculated from Equation 6 in [
8]. Only elevations of two fluid/fluid interfaces need to be measured to determine the elevations of all three fluid/fluid interfaces: air/water, air/LNAPL, and LNAPL/water.
Table 1 lists the model parameters and inputs. For a more complete description of the model, including equations, readers are referred to [
8].
Because all parameters and inputs may not be precisely known, the model can still be used by assuming representative values within likely ranges (e.g., the historical air/LNAPL and LNAPL/water interface elevations). It is common to estimate parameters either from indirect measurements or published values when using any numerical multiphase flow code or analytical model, if direct measurements are not available.
3. The Site
CSIRO conducted investigations of LNAPL (weathered diesel) contamination at a site over multiple years. The contamination occurred because of leaks from above-ground petroleum fuel storage tanks and spills. Near one location, investigators collected cores to determine LNAPL saturations and measured the LNAPL/water interface elevation and air/water interface elevation (potentiometric surface) over time in nearby boreholes to where the LNAPL saturations were measured. In addition, investigators measured subsurface and LNAPL properties. The cores had an outside diameter of 5 cm and an inside diameter of 4.6 cm. Approximately 20 m from the location where the LNAPL saturations and properties were determined, samples were collected and capillary pressure–saturation measurements were conducted in a laboratory to obtain [
15] retention parameters. They recorded the data in a commercial-in-confidence report [
16], which is a proprietary report exclusively for the client. We utilize data in this report for our preliminary test of the [
8] model.
At the site, the subsurface consists largely of sands deposited under a marine environment. Variations in sea levels affect water table fluctuations. There are two sand types near the ground surface: the upper and lower sand facies. The interface between the sands occur approximately 4–4.5 m below the surface. The upper sand is a uniform fine-medium sand with thin layers of shell and coral fragments below 2.5 m from the surface. The lower sand is a fine sand (finer than the upper sand) with less layering than the upper sand; however, there may be some cementation below the water table.
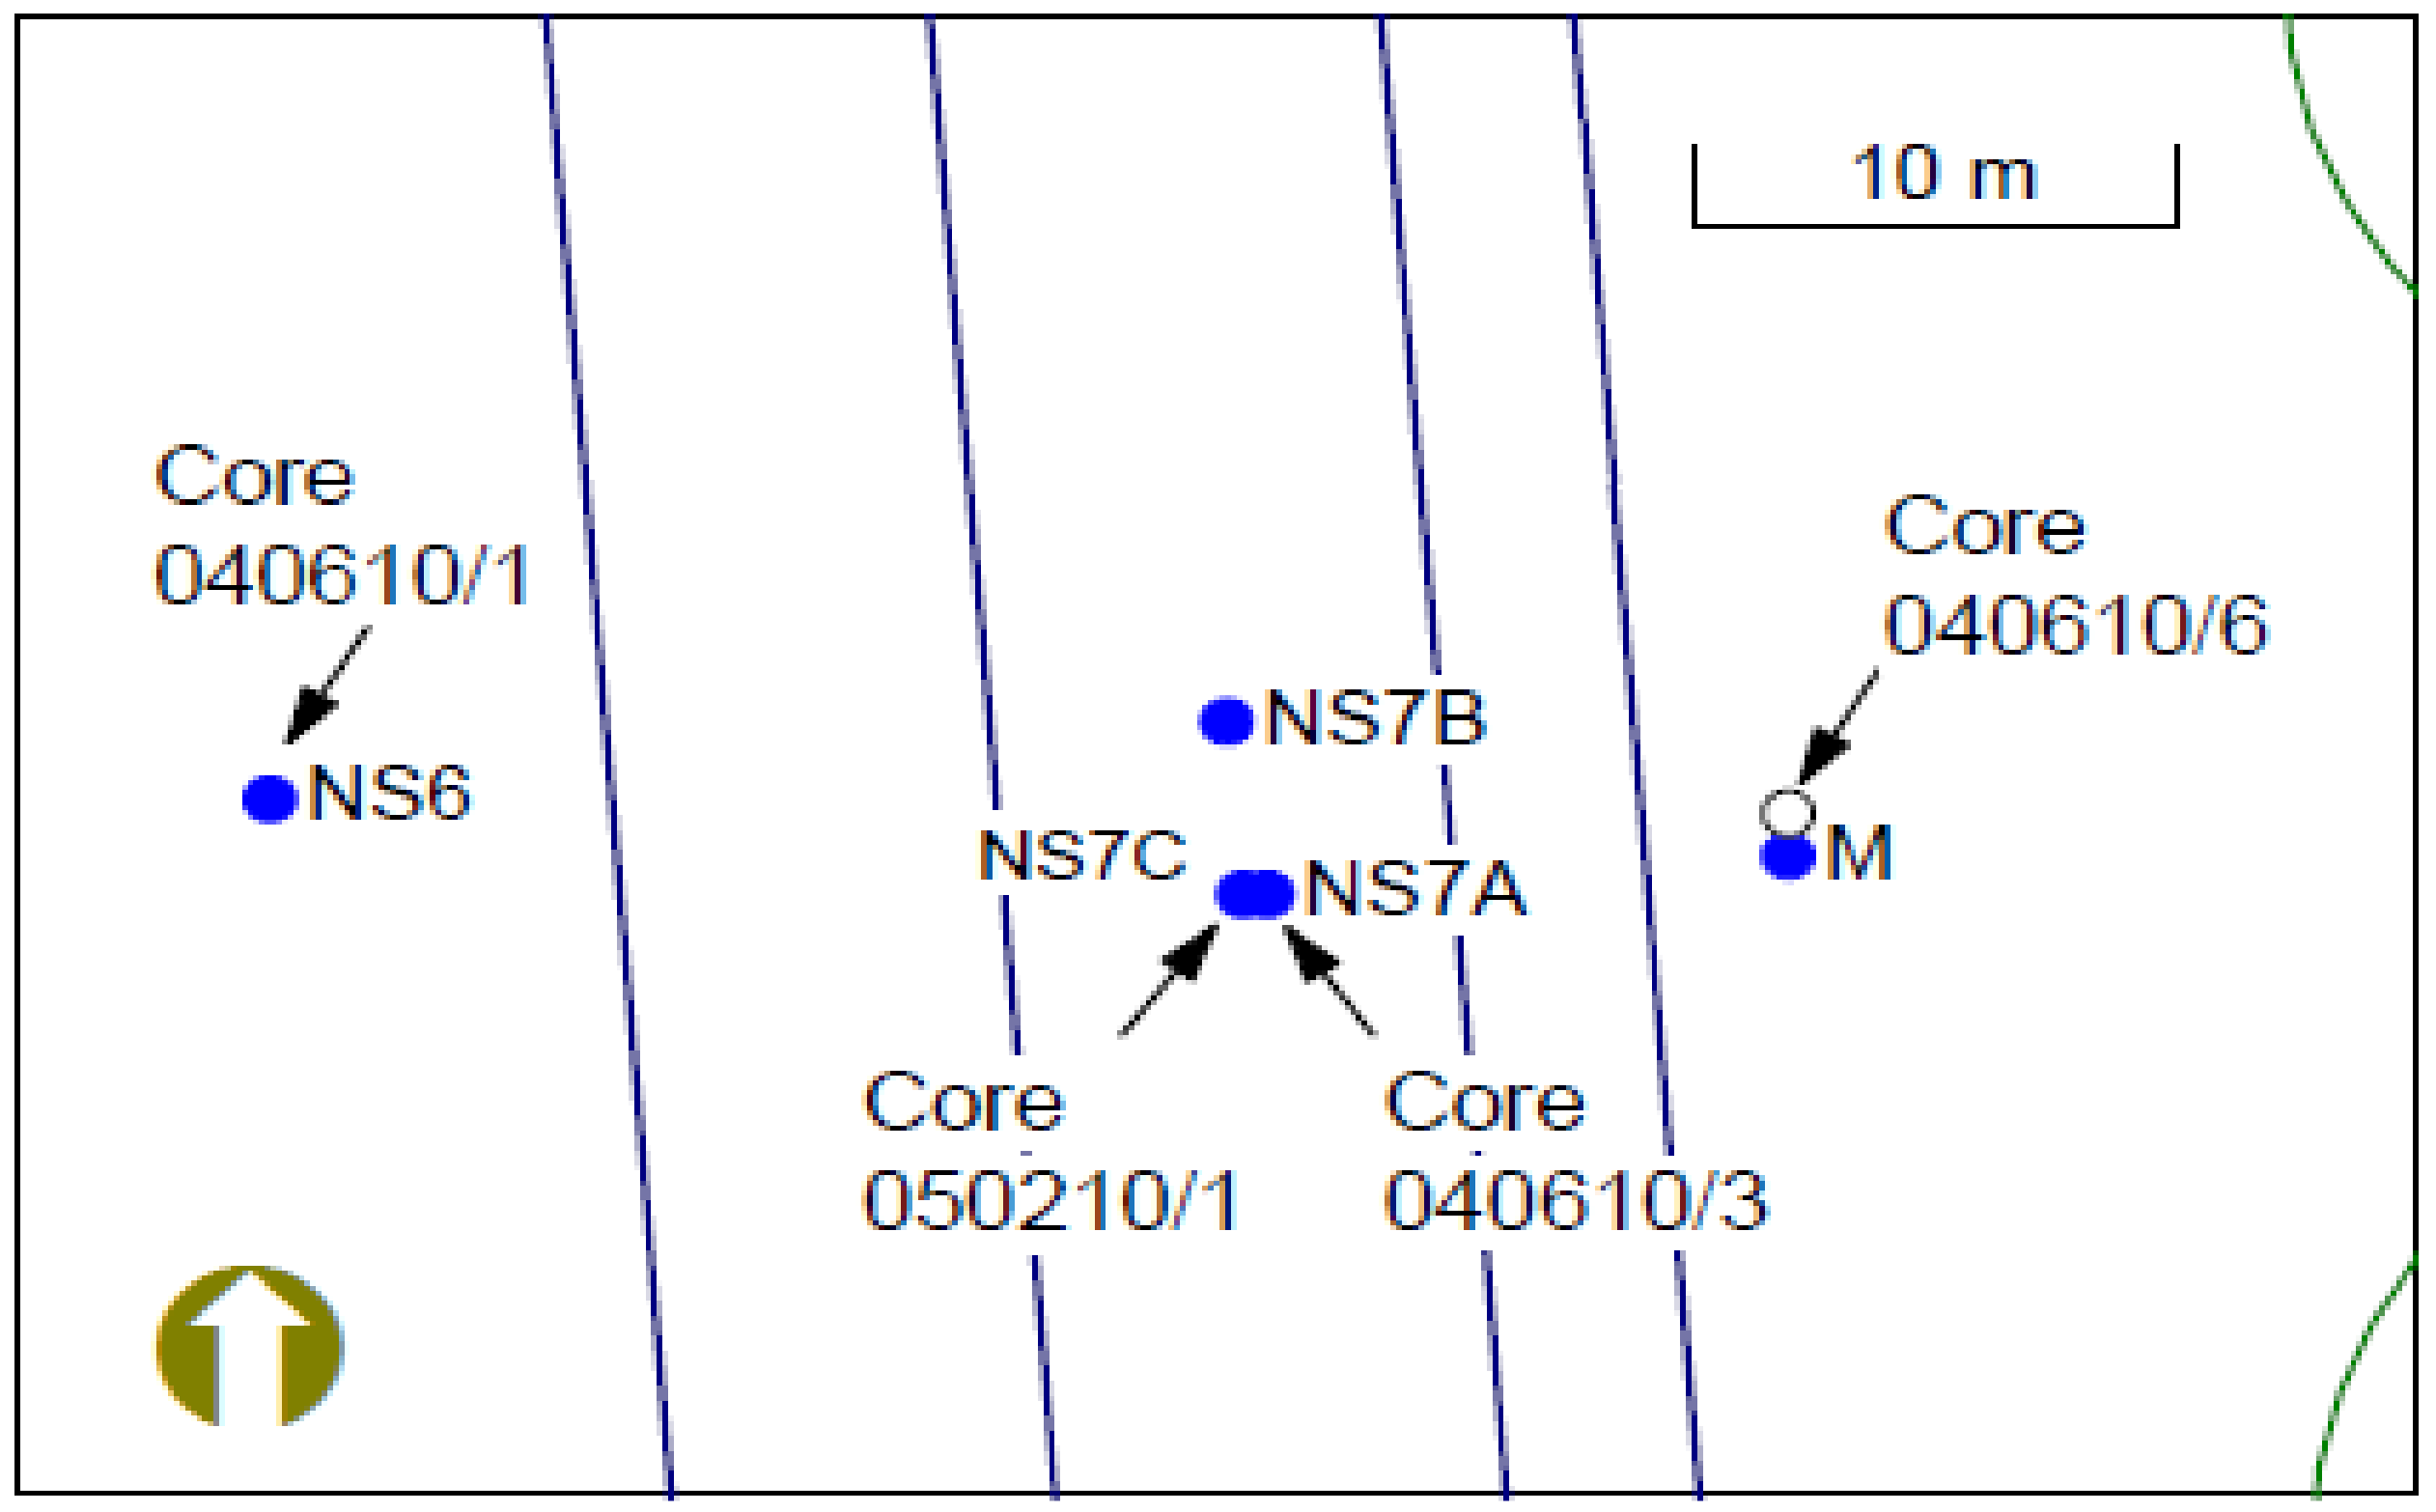
Figure 1 shows the wells and coring locations in the general area. Investigators collected four cores from the area and measured subsurface properties and LNAPL saturations in samples. Three cores (040610/1, 040610/3, and 040610/6) were collected on 10 June 2004 and one core (050210/1) was collected on 10 February 2005, which was in the summer in Australia (i.e., low seasonal water table). Cores 040610/3 and 050210/1 are adjacent to well NS7A. The LNAPL fluid properties and LNAPL/water interface elevations were measured from and in well NS7A (developed 30 June 2004), which was screened across the water table so both LNAPL and water could enter the borehole. Well NS7B, which is approximately 3 m from well NS7A, also was developed 30 June 2004, but screened below the water table so air/water interface elevations could be measured. Well NS7C was developed 1 m from NS7A after the 050210/1 core was collected. Wells NS7A and NS7B were developed to 6.5 m depth. Well NS7C was developed to 7 m depth. The capillary pressure–saturation measurements were conducted using samples from the 040610/1 (10 June 2004) core near well NS6. The ground elevation near wells NS7A, NS7B, and NC7C is 4.8 m AHD (Australian Height Datum).
LNAPL saturations measured in cores 040610/1, 040610/3, and 040610/6 are not used in this preliminary test because the LNAPL saturations were measured prior to the periodic measurements (5 minute intervals) of fluid levels in wells, i.e., we did not know the fluid level elevations in wells when these cores were collected. Continuous recording of air/water and LNAPL/water interface elevations in wells NS7A and NS7B began 1 August 2004. No continuous recording of fluid levels was conducted in wells NS6 and M (
Figure 1).
5. Results
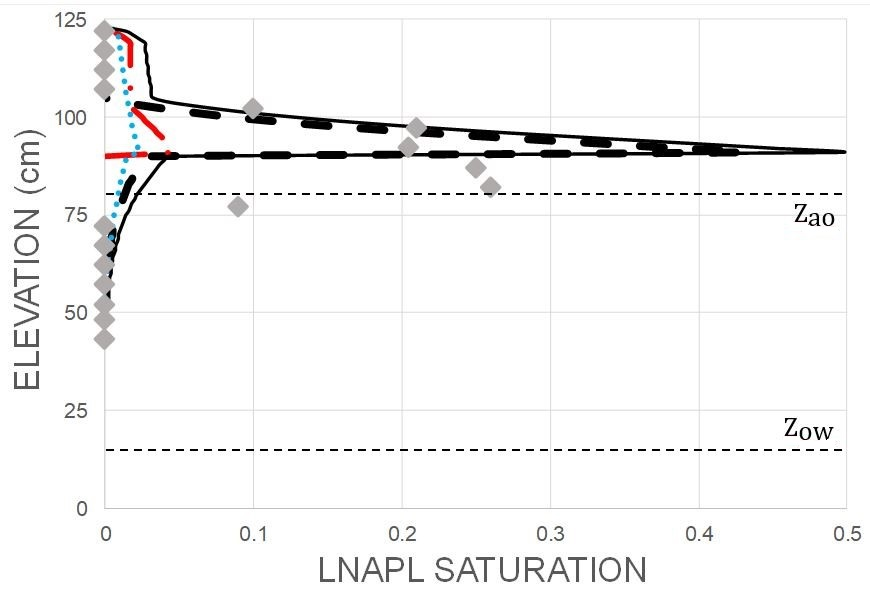
Using the model parameters and inputs, we compared the measured LNAPL saturations against model predictions for [
15] main drainage
α and
n parameters and
.
Figure 4 shows the comparison.
In
Figure 4, the black solid line is predicted total LNAPL saturations; the black thick shorter broken line is predicted free LNAPL saturations; the red longer broken line is predicted residual LNAPL saturations, and the light blue dotted line is predicted entrapped LNAPL saturations. The horizontal thin short black broken lines are the
and
elevations. As assumed, there is no entrapped LNAPL predicted close to the elevation datum, so assuming
Z = 0 at −0.5 m AHD instead at−0.53 m AHD likely had negligible consequence. The predicted largest total LNAPL saturation (i.e., 0.494) is substantially larger than the largest measured LNAPL saturation (i.e., 0.26). The vast majority of the LNAPL is predicted to be in the upper sand. At the boundary between the sands (i.e., 90 cm), the LNAPL saturation goes from 0.04 in the lower sand to 0.49 in the upper sand. The boundary between the sands can be seen clearly with the large change in the predicted total, free, and residual LNAPL saturations at 90 cm elevation. Only a small amount of LNAPL is predicted below 90 cm, which is in contrast to measured values.
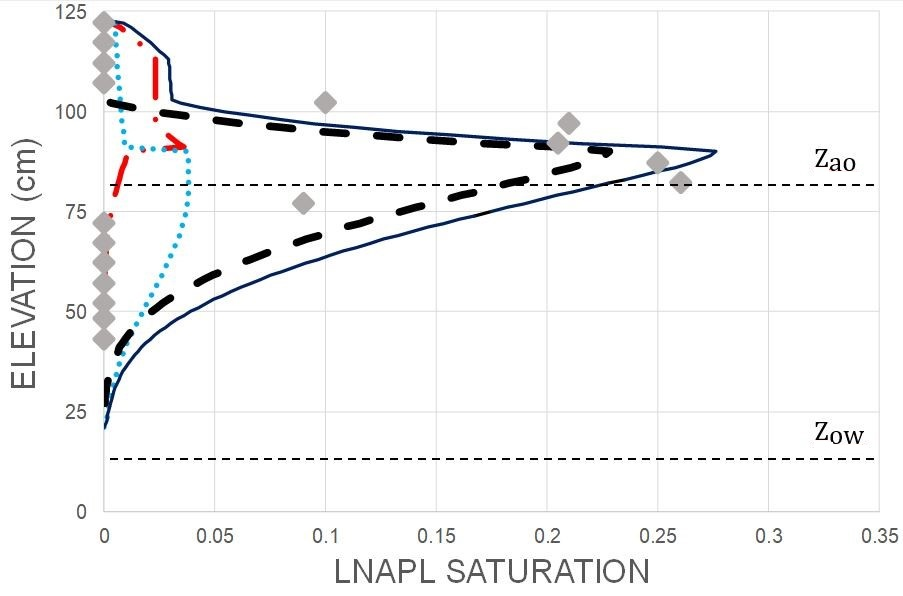
Figure 5 shows the comparison of measured LNAPL saturations against model predictions for [
15] imbibition
α and
n parameters and
.
In
Figure 5, the labelling of the lines is the same as with
Figure 4. Again, it appears our assumption
Z = 0 at −0.5 m AHD instead at −0.53 m AHD likely had negligible consequence. There was no predicted entrapped LNAPL near the elevation datum. Using the imbibition parameters, the predicted largest total LNAPL saturation (i.e., 0.276) is very similar to the largest measured LNAPL saturation (i.e., 0.26). The difference in total LNAPL saturation at the boundary between the sands only goes from 0.27 in the lower sand to 0.25 in the upper sand, which reflects better agreement with the measured data below the 90 cm elevation than for drainage parameters. The boundary between the two sands can be seen clearly with the change in the predicted residual and entrapped LNAPL saturations at the 90 cm elevation.
6. Discussion
There are significant differences between
Figure 4 and
Figure 5. The principal reason is because of hysteresis in capillary pressure–saturation relations. A model describing capillary pressure–saturation-relative permeability hysteresis in air/water and air/LNAPL/water fluid systems has been described by [
19,
20]. The capillary-pressure–saturation model was successfully tested by [
21]. The capillary pressure–saturation-relative permeability model was later amended by [
17] to include residual LNAPL. [
22] also incorporated hysteresis in capillary pressure–saturation-relative permeability relations into a multiphase, multicomponent numerical simulator to predict subsurface LNAPL migration. If investigators want to use predictive models similar to [
8] and obtain realistic results, then they will need to employ parameters describing capillary-pressure relations reflecting the current conditions in the subsurface. Too commonly, investigators use main drainage parameters because they are more frequently measured, indirectly predicted from grain-size distributions, and listed in the literature. There are infinite potential saturation paths that can be followed by water and LNAPL. Each path is dependent on the saturations where the previous paths changed from wetting to drying and drying to wetting. It is unreasonable to assume any investigator will know the particular saturation path that is being followed at a site and, therefore, how to parameterize that path. However, investigators should not routinely use only main drainage parameters. Understanding hysteresis in capillary pressure–saturation relations is important for determining parameters that describe capillary pressure–saturation relations when attempting to predict multiphase flow and subsurface LNAPL saturations.
Better agreement between the predicted and measured LNAPL saturations occurred when the [
15] imbibition parameters were employed, which is reasonable. At the site, LNAPL moved downward increasing the total liquid (water and LNAPL) saturations following the LNAPL contamination events. Therefore, the total liquid saturation path should be a wetting (imbibition) path and not a drainage path. Furthermore, it is reasonable to assume that the water saturations may not be at their lowest historic levels because 1) lower water saturations would exist when
occurred and 2) the water saturations may have been lower prior to the LNAPL contamination. Therefore, it would be inappropriate to use main drainage capillary pressure–saturation relations to predict the existing (current) subsurface saturations. The current saturation paths corresponding to the current
and
likely will be a scanning path, which may have developed from an imbibition path. Parameterization of the specific current saturation path will be almost impossible because the history of the wetting to drying and drying to wetting reversal saturations will be unknown. However, the specific current saturation path likely will be closer to the main imbibition path than the main drainage path. This is why we obtained better agreement between the predicted and measured subsurface LNAPL saturations using the [
15] imbibition parameters versus the drainage parameters.
Although there is relatively good agreement between predicted and measured LNAPL saturations in the upper sand and upper portion of the lower sand when the [
15] imbibition parameters are employed, there are significant differences deeper in the lower sand. The model predicts larger free and entrapped LNAPL saturations than what was measured. The reasons are unclear at this stage of our analyses. The measured data suggests no LNAPL may have become entrapped as the fluid levels in NS7A went from its historic low (i.e,
at 67.2 cm and
at 0 cm) on approximately 15 January 2005 to its current levels (i.e.,
at 81.7 cm and
at 14.5 cm) on 10 February 2005. Conceivable explanations are 1) there was negligible LNAPL at the location where the sample was collected (the inside diameter of the cores is 4.6 cm) because of possible heterogeneity in porous medium properties and/or the LNAPL saturation distribution and 2) the LNAPL measurement technique is not sensitive for detecting small LNAPL saturations. In
Figure 4 and
Figure 5, the lowest measured LNAPL saturation above non-detect was greater than 0.07. In all LNAPL saturation measurements made at the site including cores 040610/1, 040610/3, and 040610/6, the lowest non-detect saturation was approximately 0.03. Additional testing of the [
8] model is needed.
Models similar to the [
8] model can help investigators and regulators address subsurface LNAPL contamination. Predictions from the models can better inform risk and safety concerns, migration concerns, and mobile LNAPL occurrence concerns. Further, the predicted LNAPL saturations and potential mobility (i.e., predicted LNAPL transmissivities) can guide remediation approaches. The predictions from the models can contribute to a science based LCSM. The changing
and
over time can be used to provide updates to the LCSM. For the models to yield reasonable predictions of subsurface conditions, then parameters employed to describe capillary pressure–saturation-relative permeability relations need to reflect existing (current) fluid saturation paths in the field. The use of mathematical modelling coupled with field data is useful for understanding subsurface LNAPL distributions which can be utilized for potential LNAPL recovery operations from contaminated sites [
23].
7. Conclusions
Our preliminary test of the [
8] model to predict subsurface LNAPL saturations in the field from fluid levels in wells yielded better results when [
15] imbibition parameters were employed. We tested the model using independent measurements. Our test further emphasized that parameters need to reflect capillary pressure–saturation relations existing at the time when the fluid levels in a well are measured. Understanding hysteresis in capillary pressure–saturation relations is important when predicting multiphase flow and subsurface LNAPL predictions. If investigators always employ main drainage capillary pressure–saturation relations in predictive models, then the predictions may not likely produce reasonable results, especially when the current conditions reflect imbibition saturation paths.
The [
8] model closely predicted the largest LNAPL saturations, which will affect potential LNAPL mobility. We obtained those results using the [
15] imbibition parameters and not the main drainage parameters. We felt that the capillary pressure–saturation relations at the site were closer to imbibition than main drainage relations. Even though reasonably good predictions were obtained with the model, there were some discrepancies. Our preliminary test of the model yielded promising results at the site, but more testing is needed, especially to a wider range of conditions at different sites, to completely assess the model. It is important to conduct additional testing because the [
8] and similar models can be used to help develop and update the LCSM of a site and contribute to guide more effective management of LNAPL contaminated sites.


