A Simple Approach to Predicting the Reliability of Small Wastewater Treatment Plants


Abstract
:1. Introduction
2. Materials and Methods
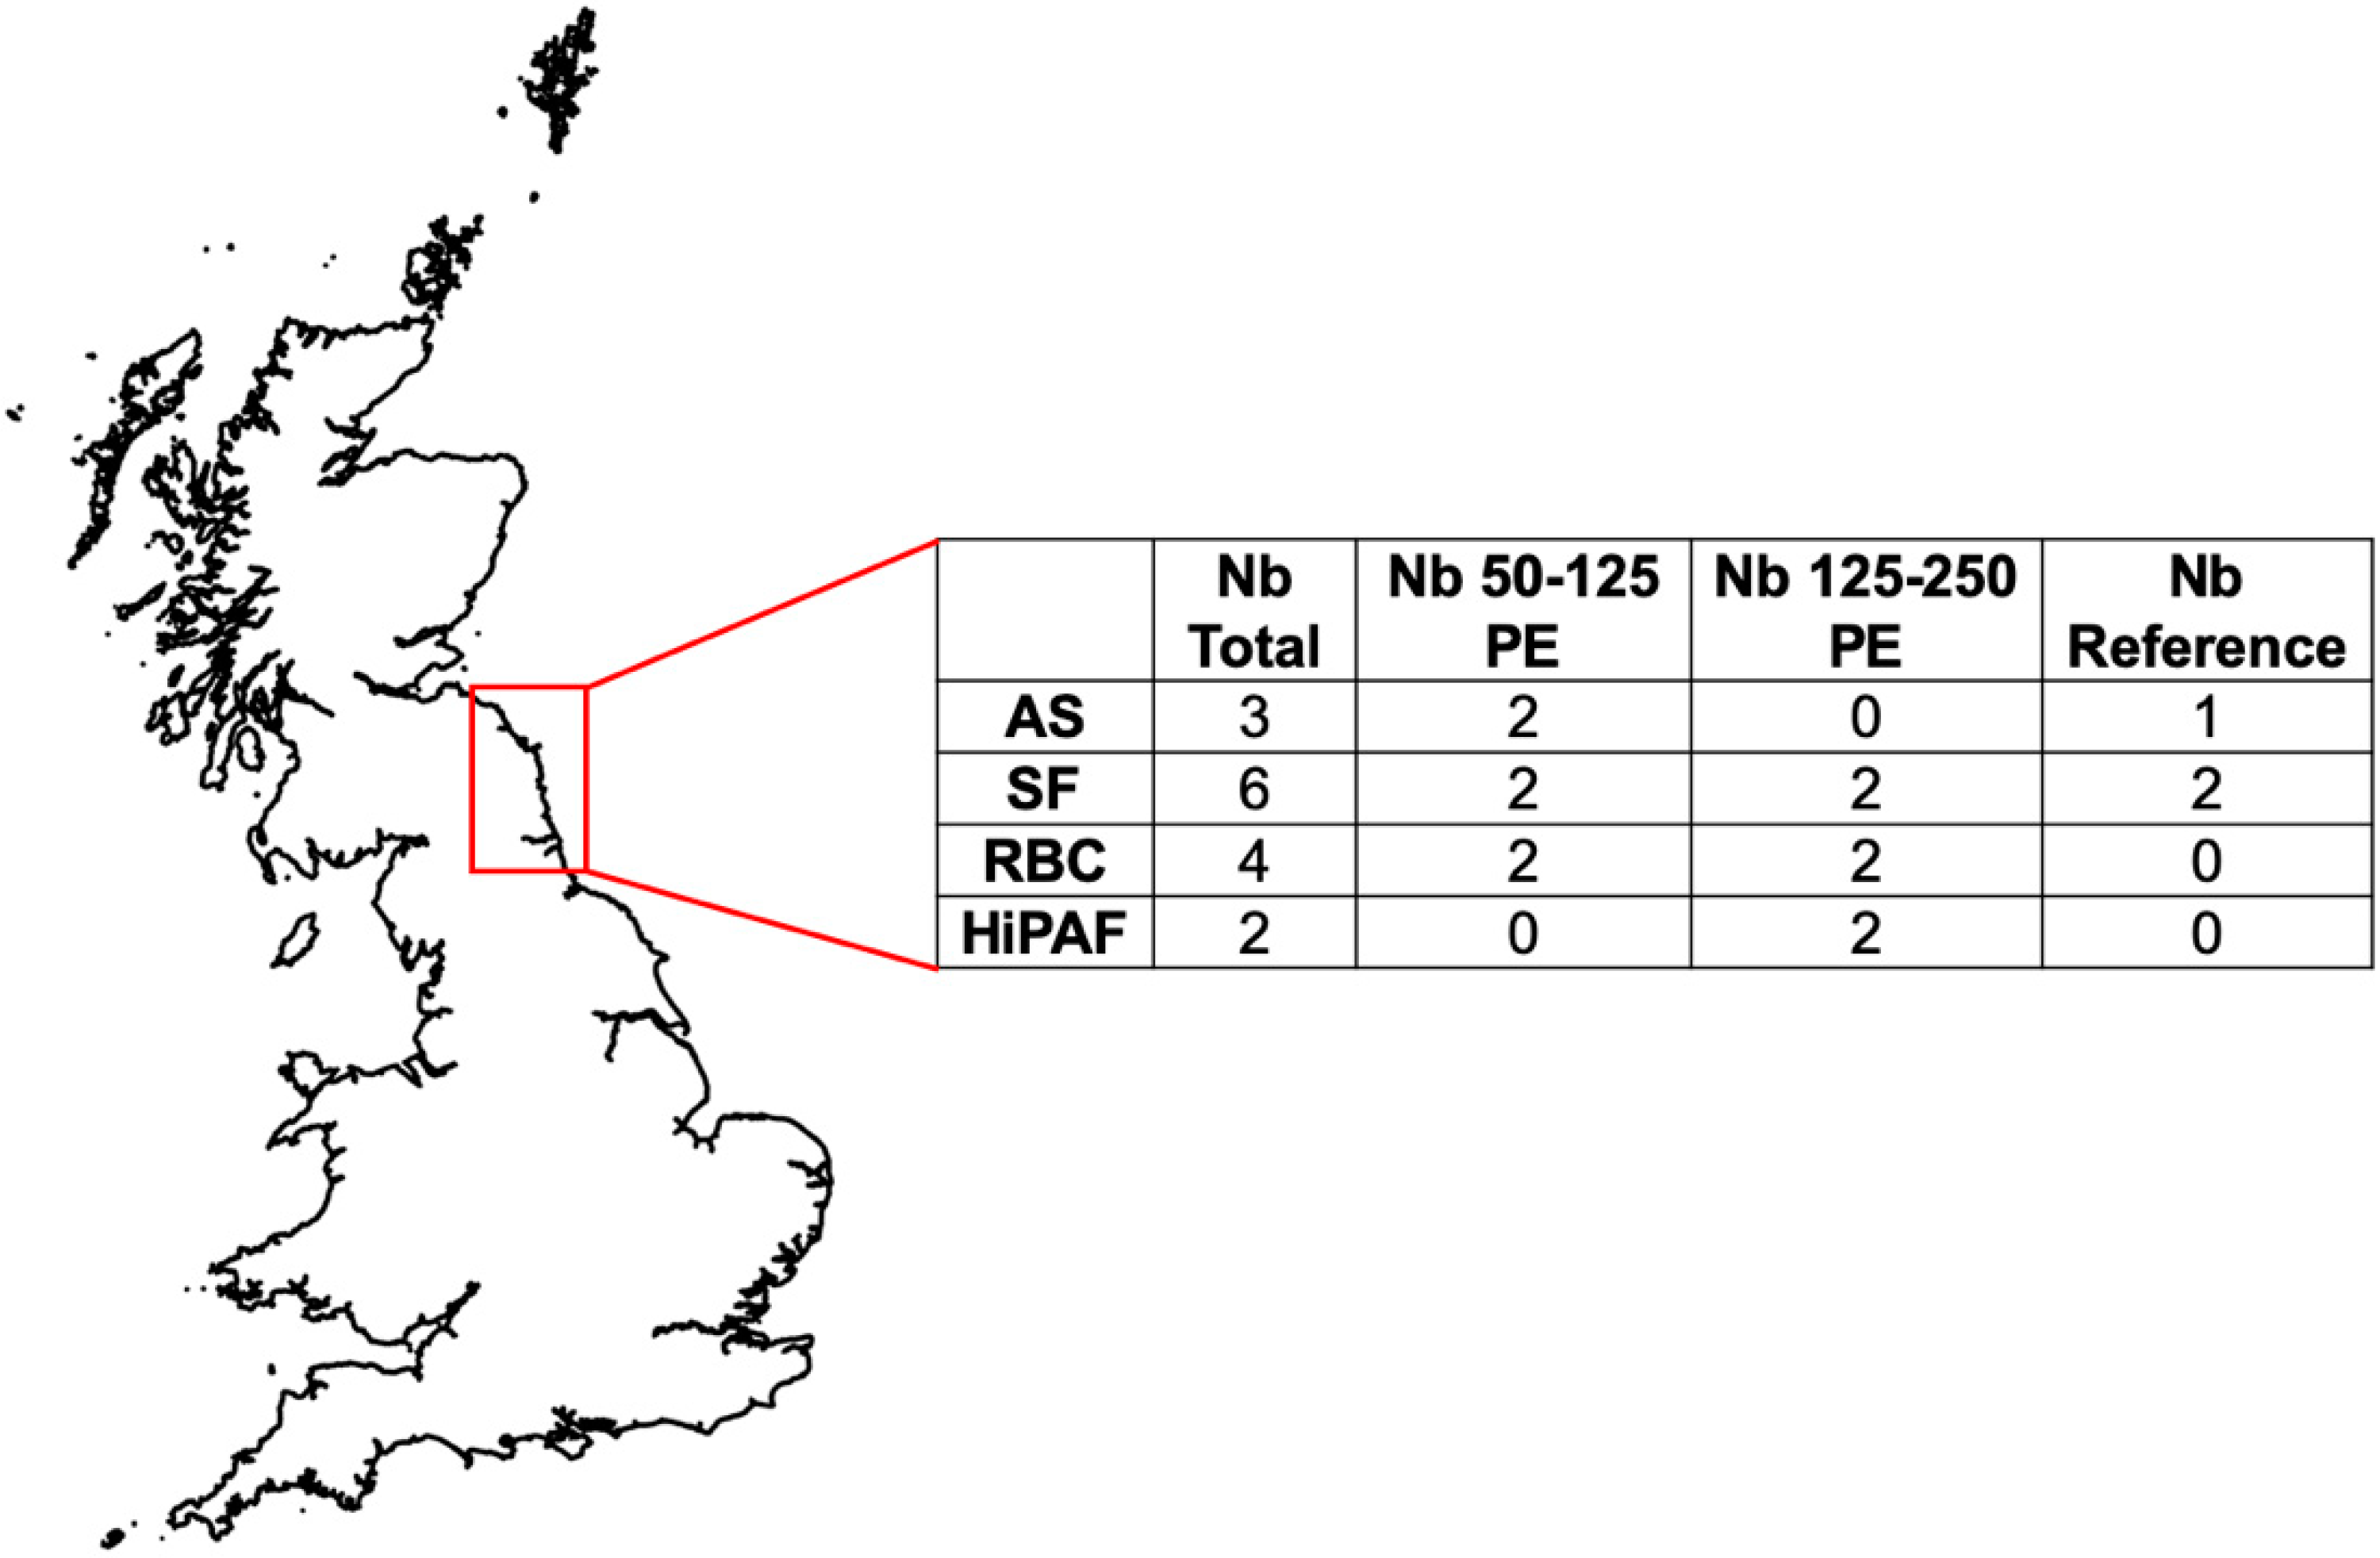
2.1. Identification of Study Sites and Experimental Design
2.2. Sampling Approach and Collection
2.3. Physical and Chemical Analysis
2.4. Data Analysis and Statistical Observation
2.5. Reliability Analysis
2.6. Prediction of Treatment Plant Reliability
3. Results and Discussion
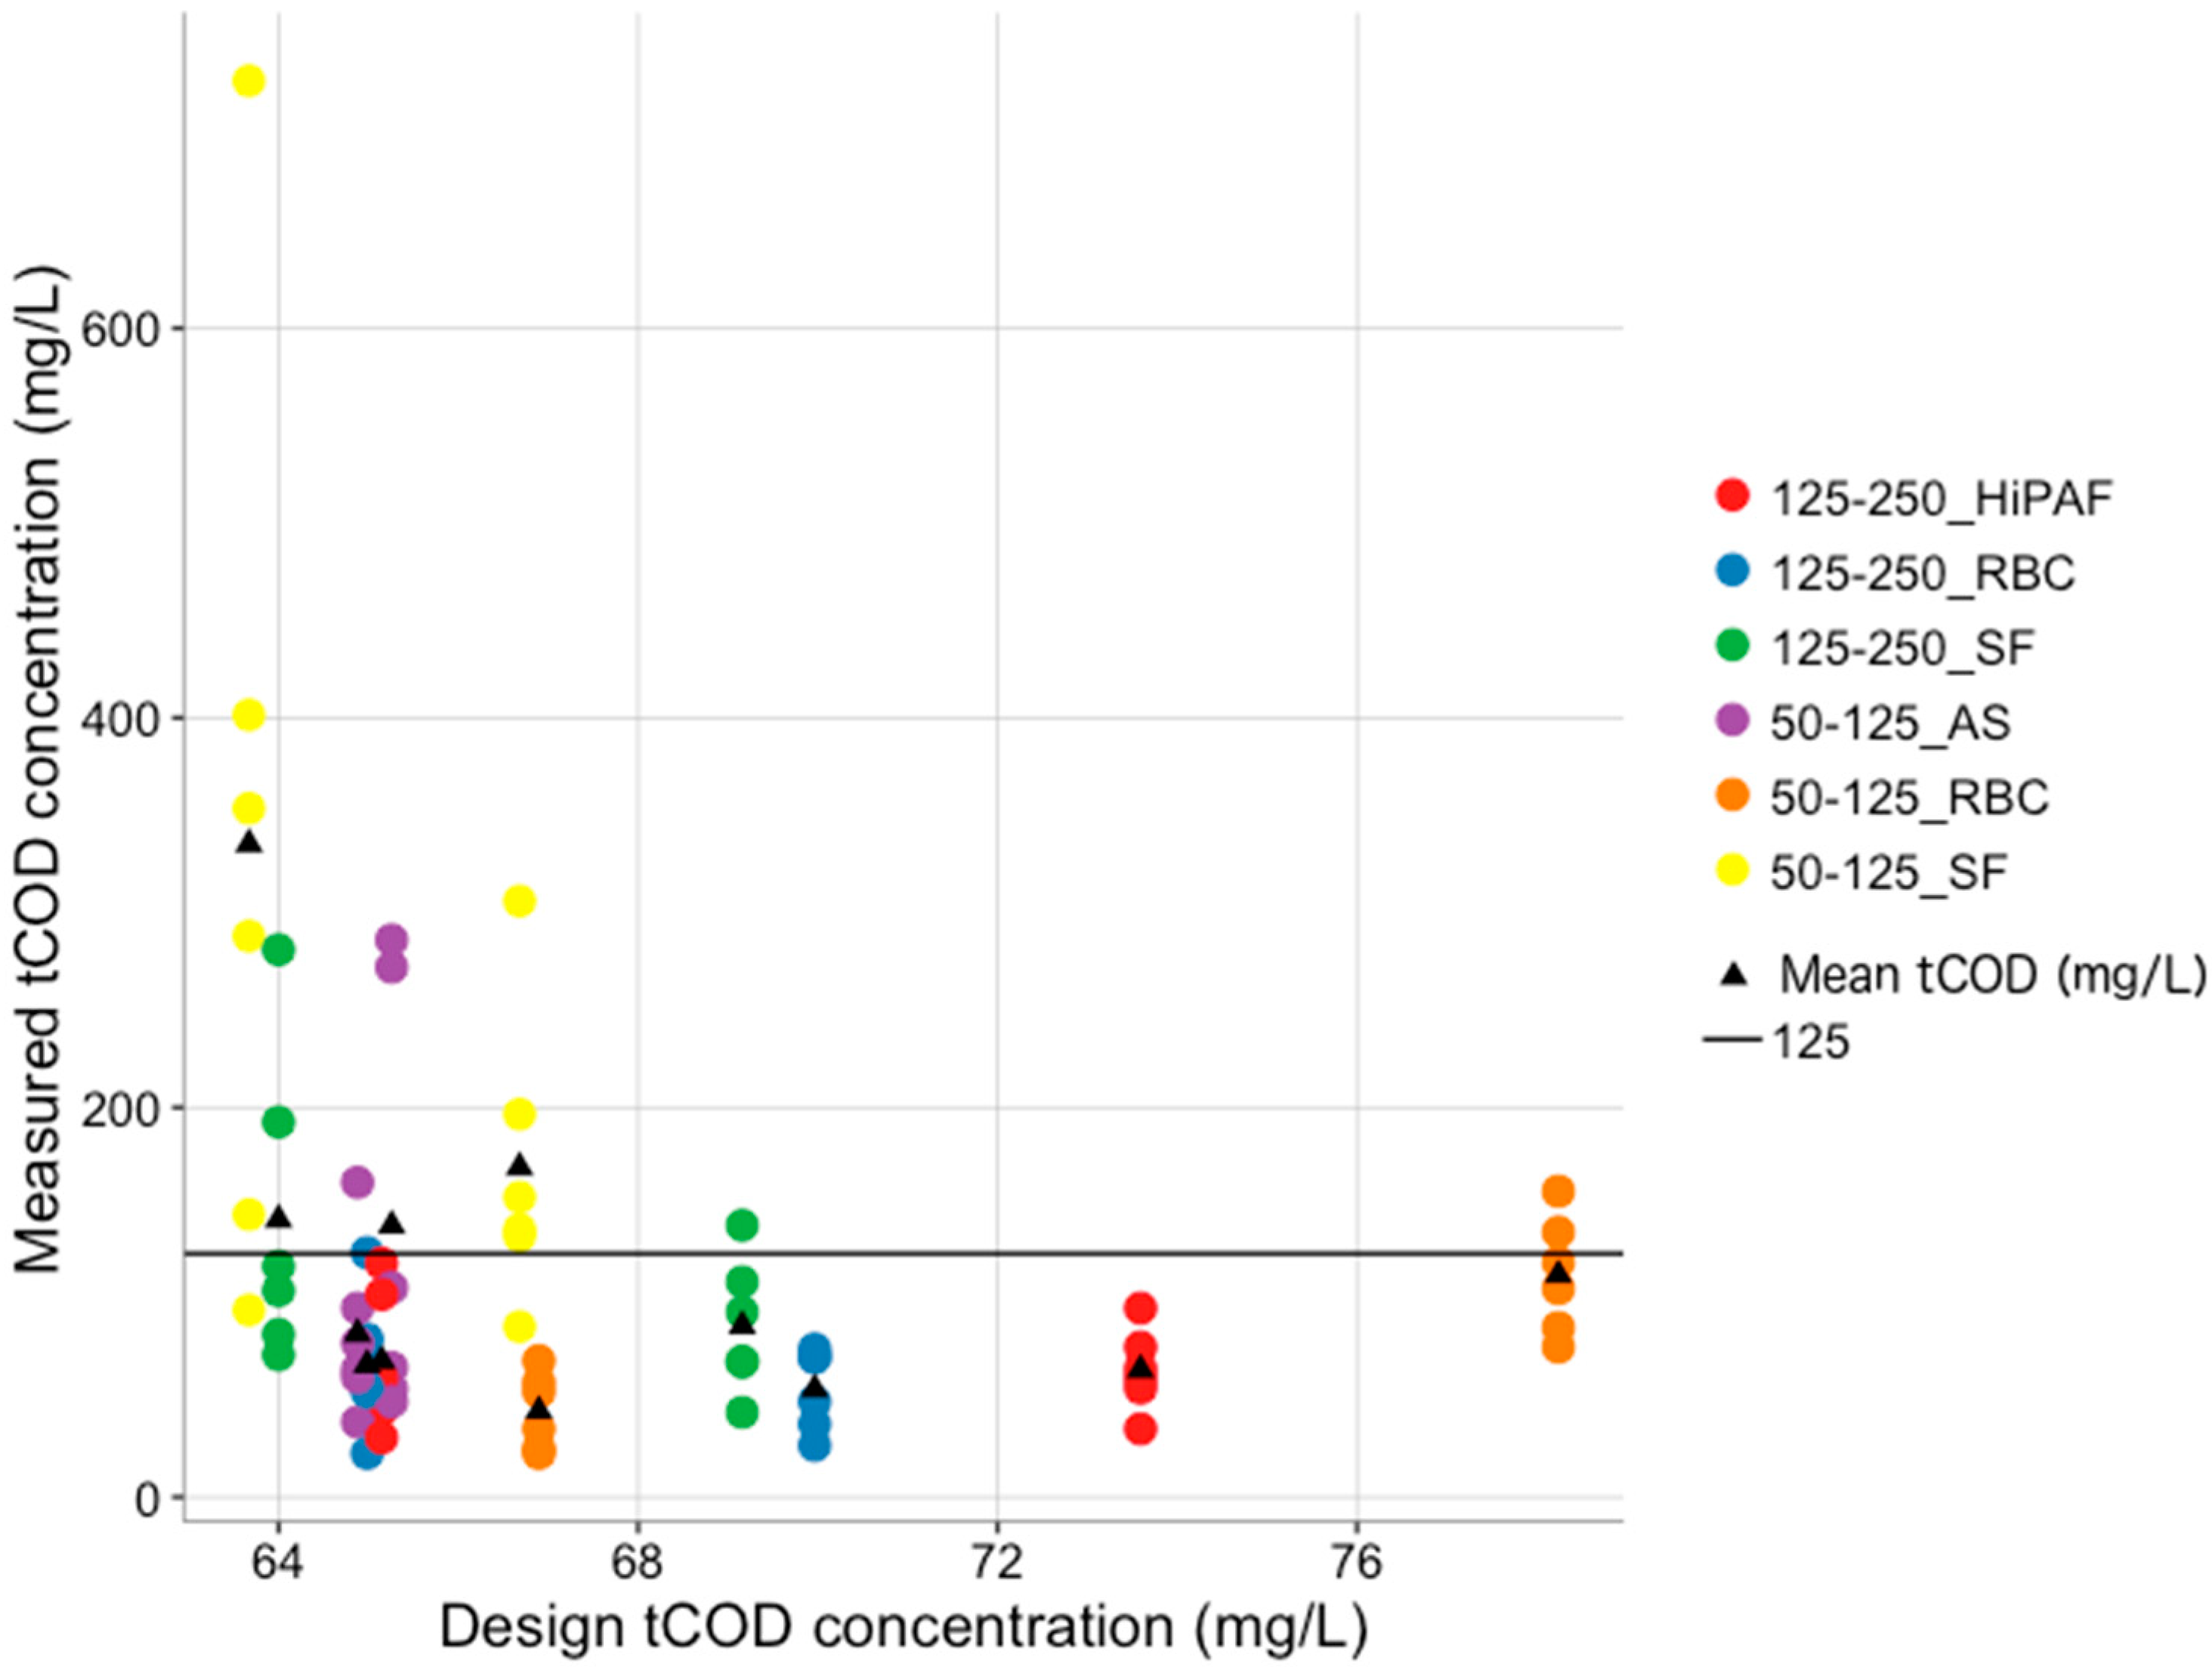
3.1. Analysis of Experimental Categories
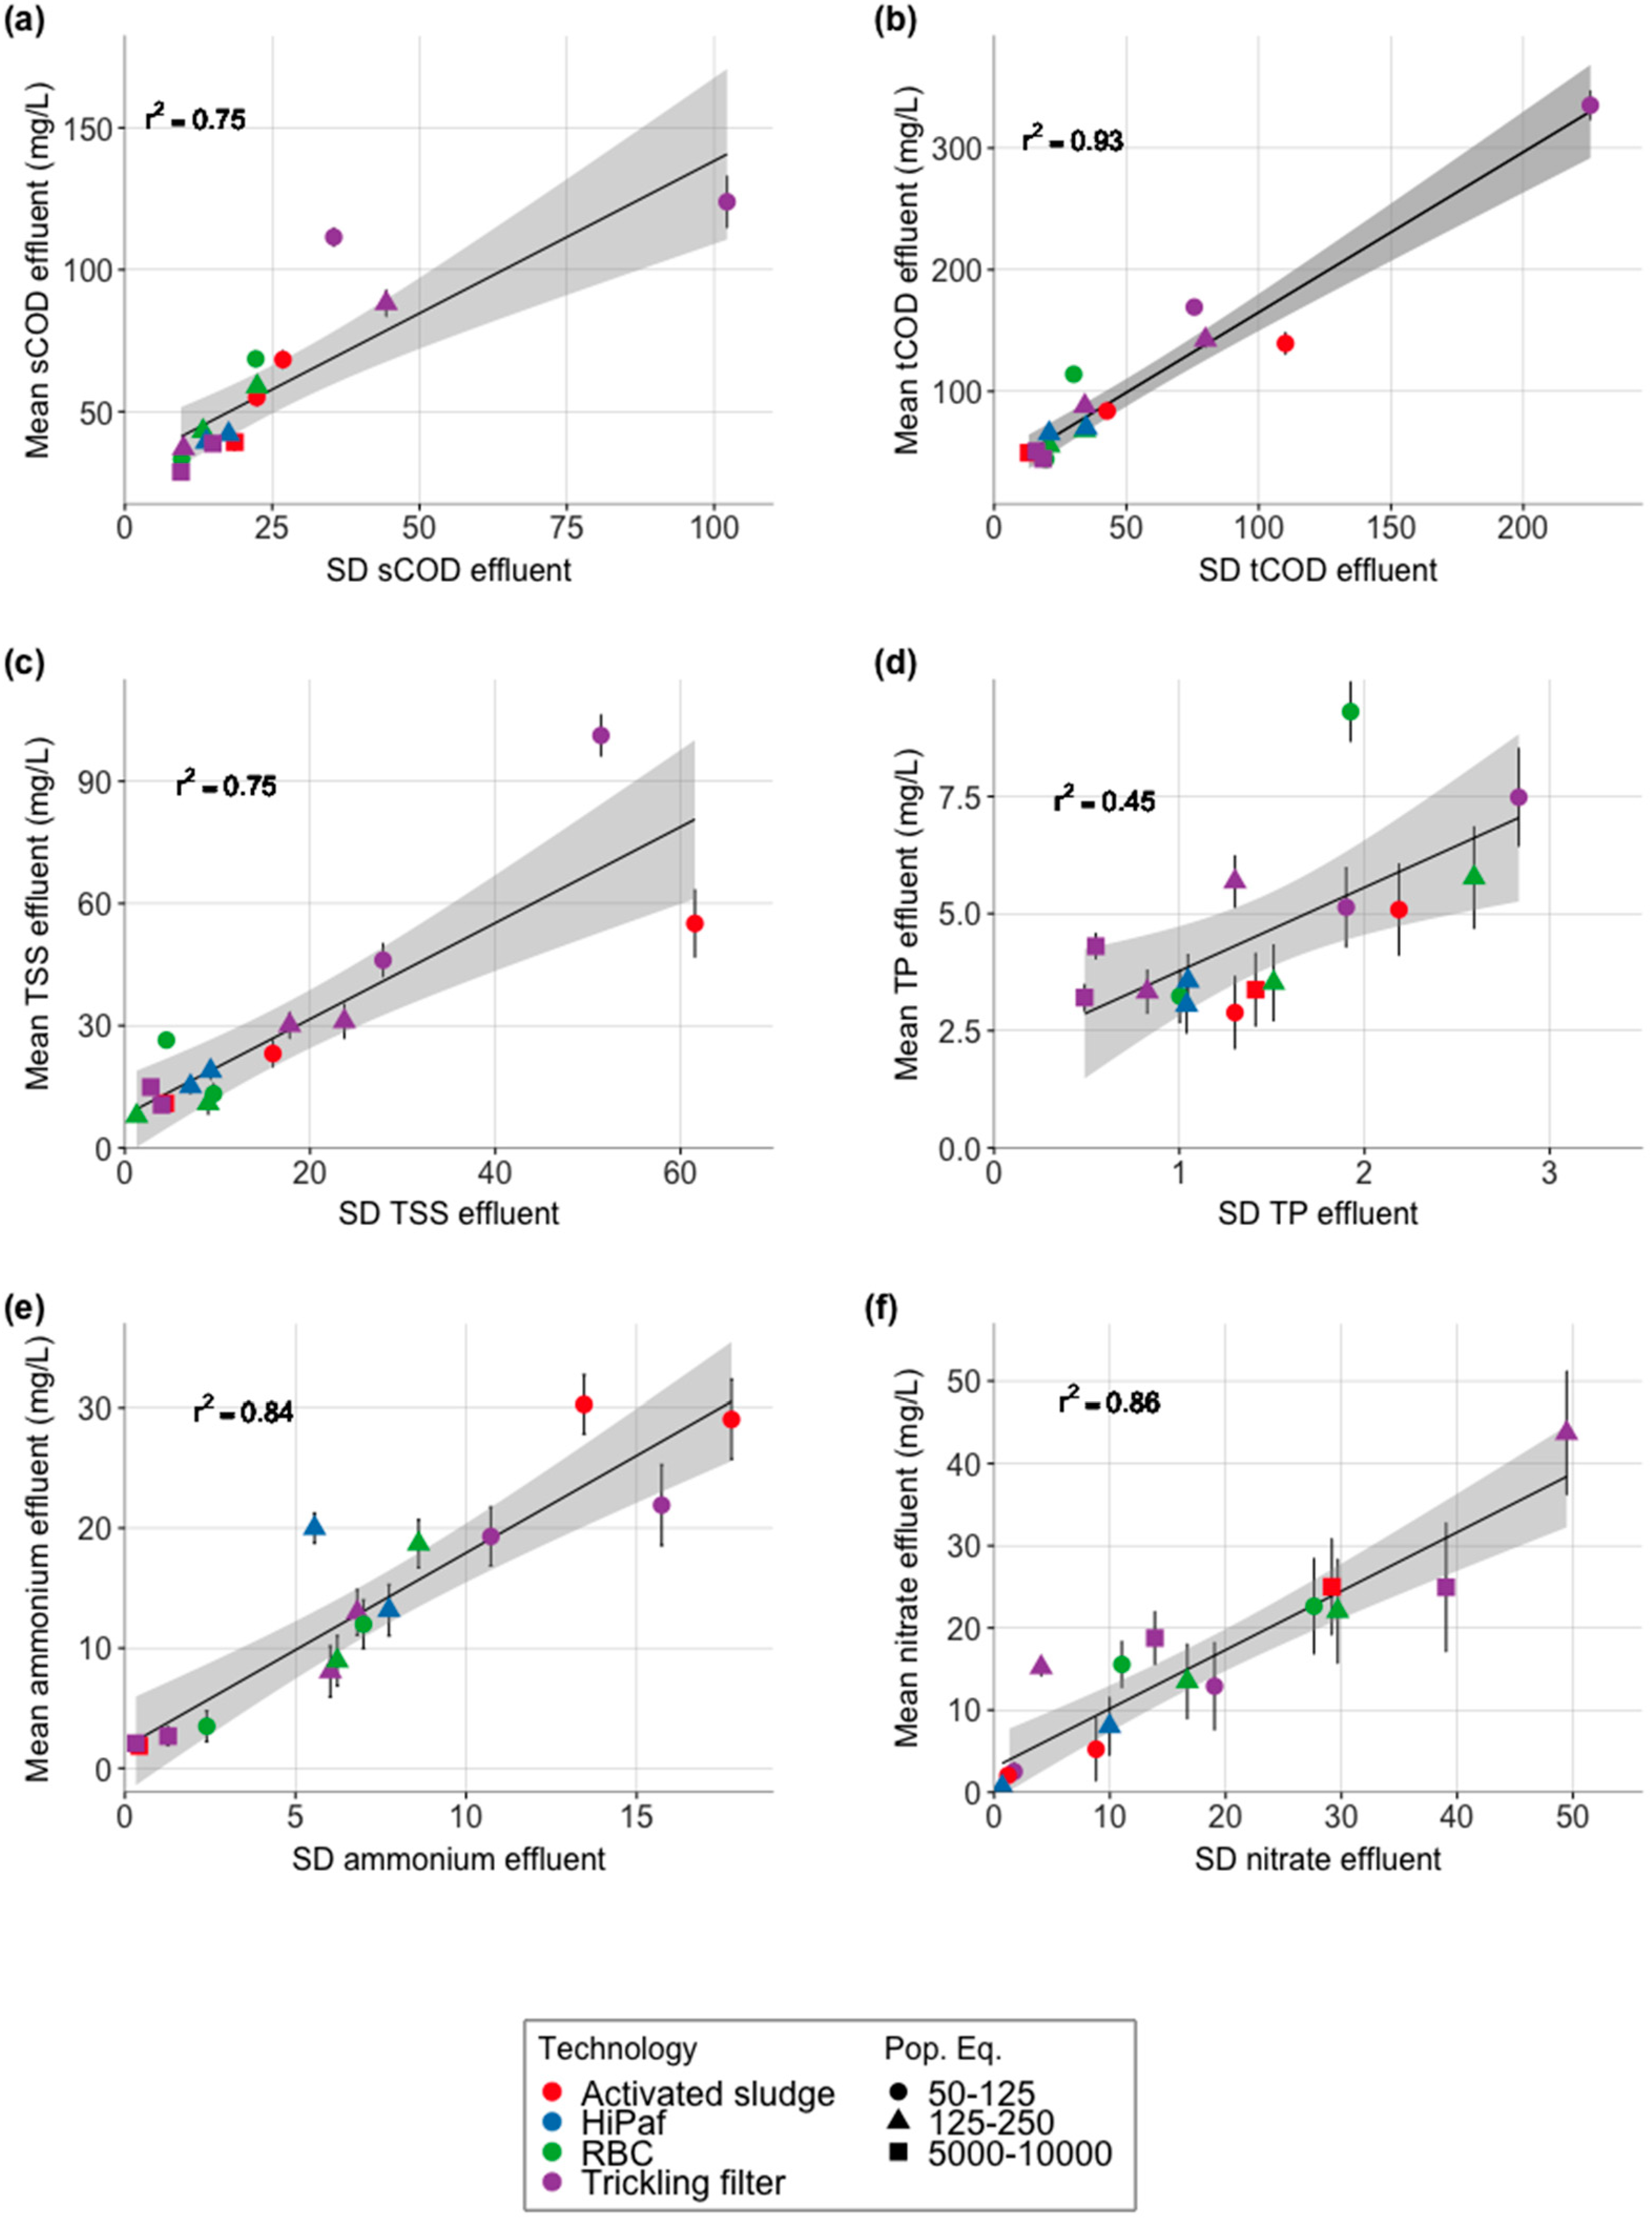
3.2. Covariance of Effluent Parameters
3.3. Reliability of Small Wastewater Treatment Plants
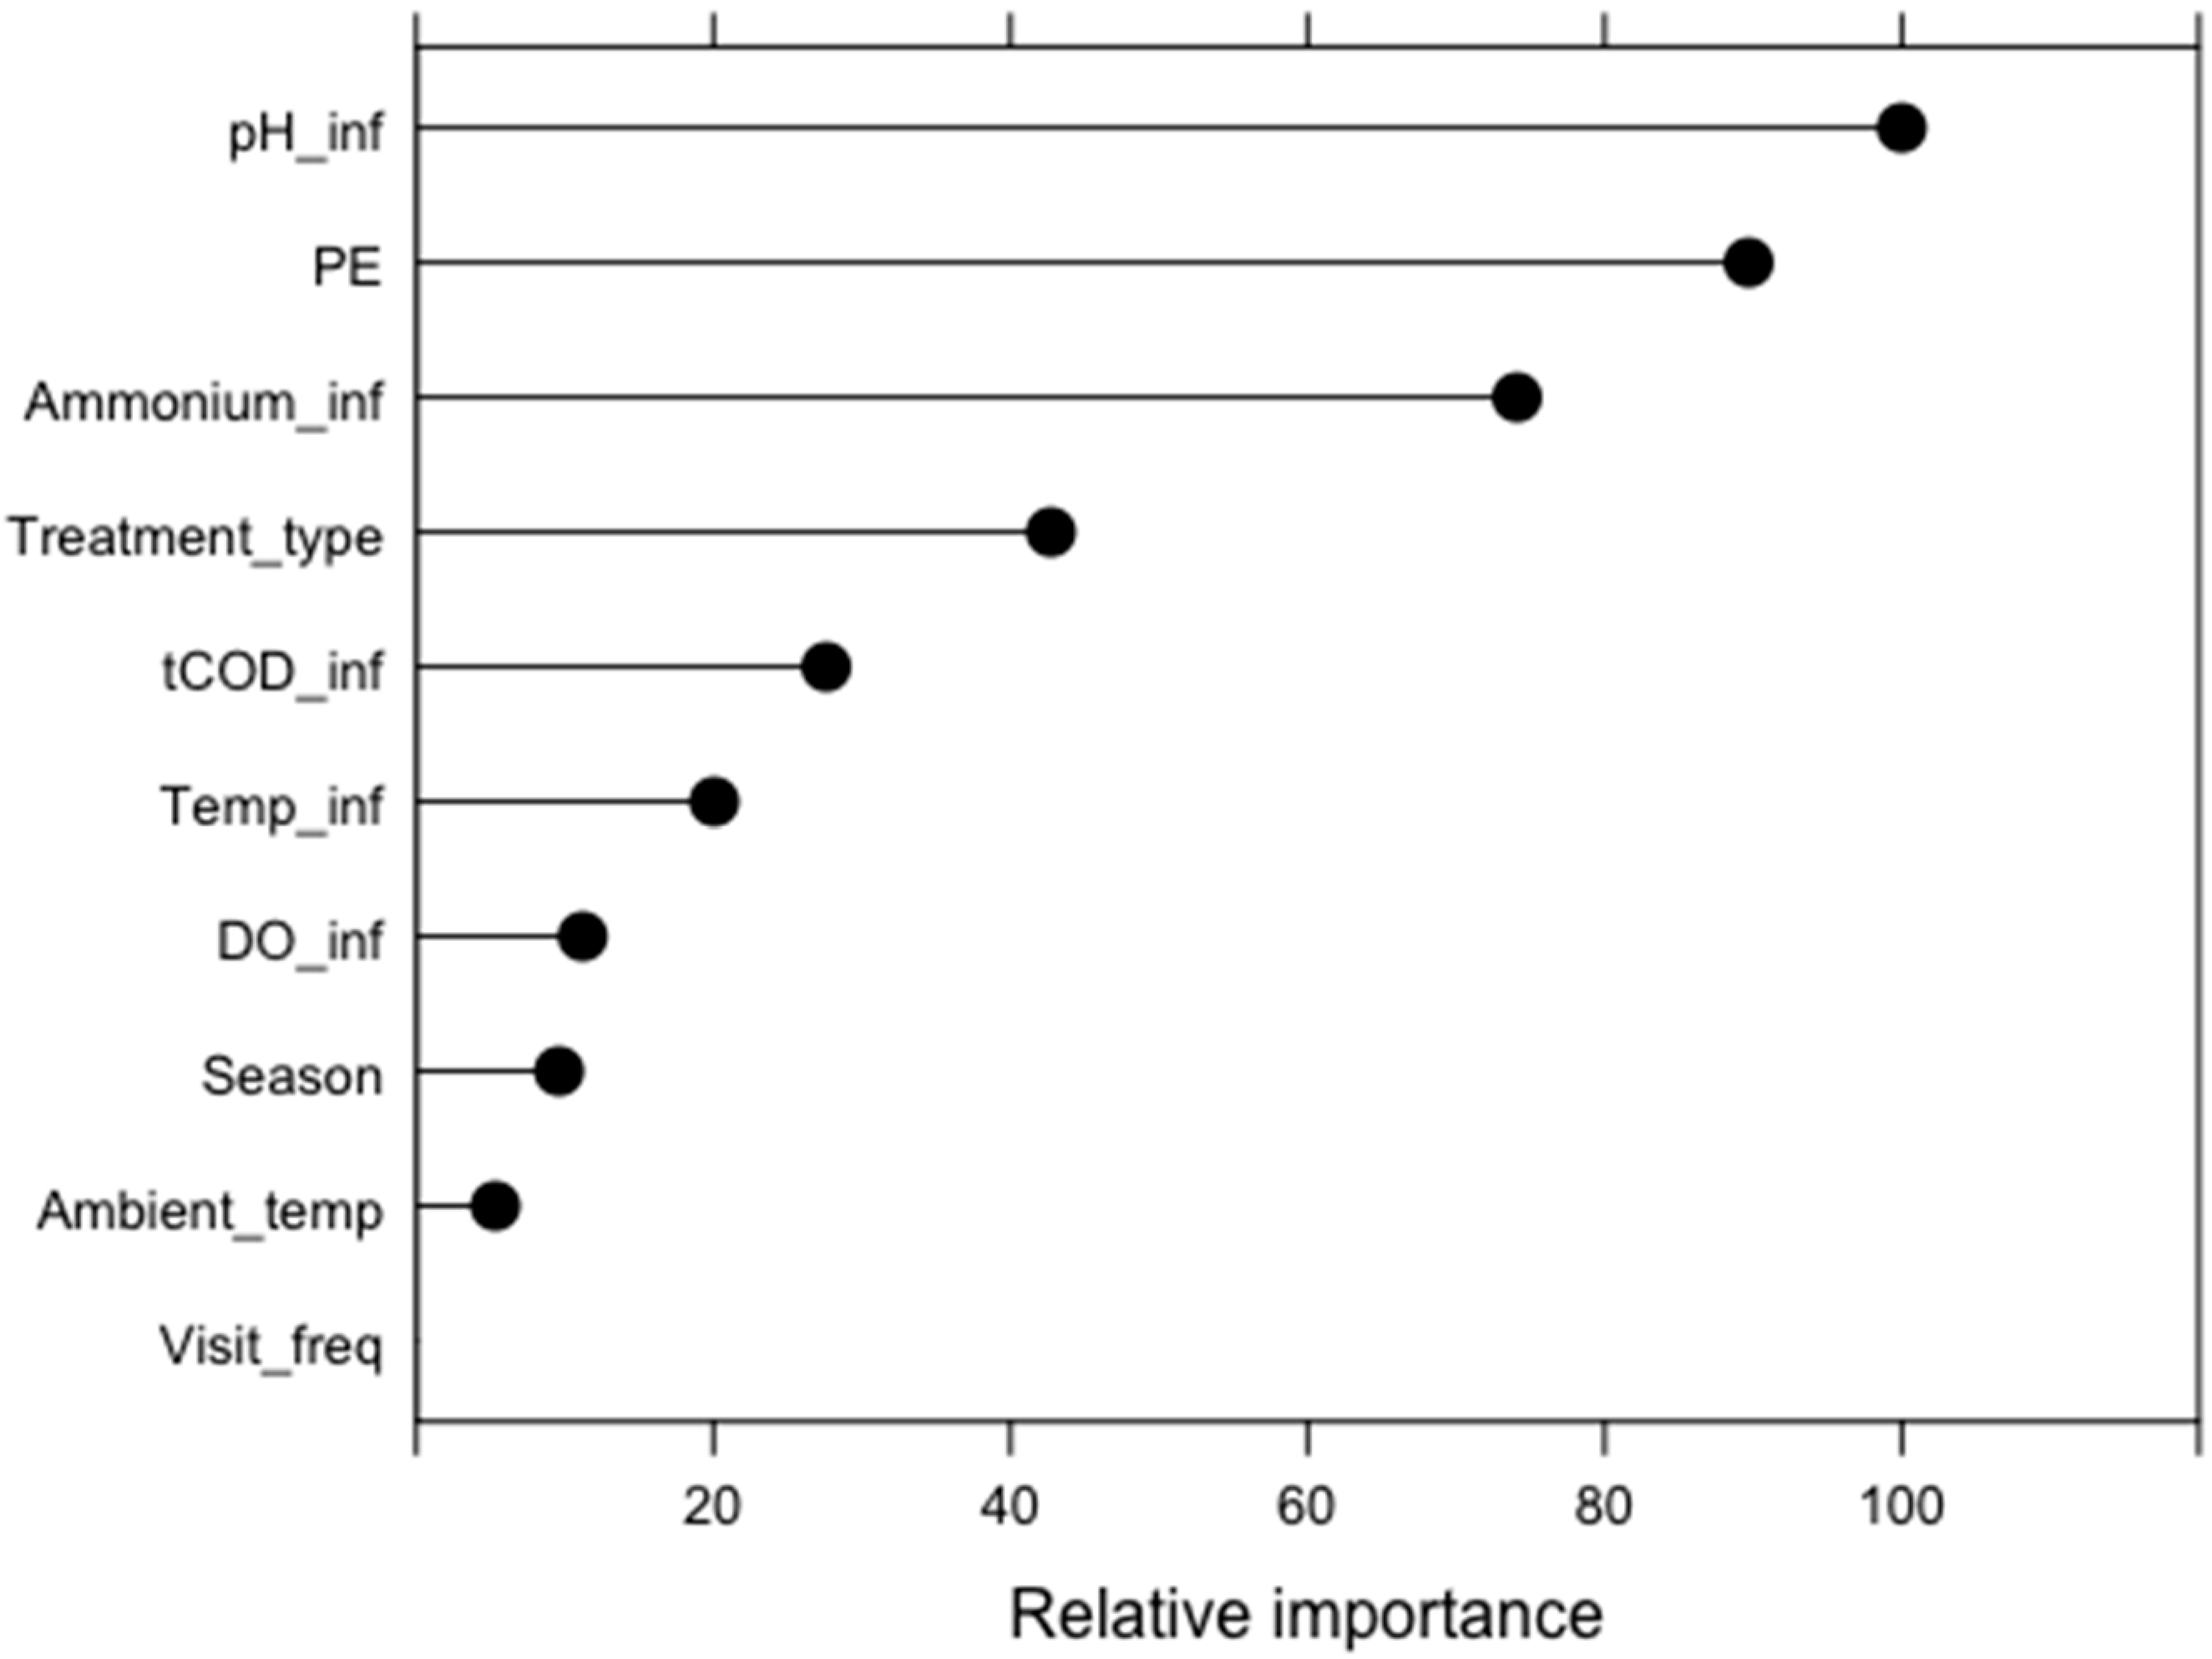
3.4. Prediction of Small Wastewater Treatment Plant Reliability
3.5. Model Simplification
4. Conclusions
Author Contributions
Funding
Acknowledgments
Conflicts of Interest
Appendix A


| Model | Accuracy | Sensitivity | MSE |
|---|---|---|---|
| Random Forest | 64.2% | 0.92 | 0.36 |
| Gradient Boosting Machine | 47.6% | 0.42 | 0.52 |
| Generalized Linear Model | 52.4% | 0.67 | 0.48 |
| Reference | |||
|---|---|---|---|
| Actual > Design | Actual < Design | ||
| Prediction | Actual > Design | 41.67% | 44.44% |
| Actual < Design | 58.33% | 55.56% | |
| Reference | |||
|---|---|---|---|
| Actual > Design | Actual < Design | ||
| Prediction | Actual > Design | 66.67% | 66.67% |
| Actual < Design | 33.33% | 33.33% | |
References
- McCarty, P.L.; Bae, J.; Kim, J. Domestic wastewater treatment as a net energy producer—Can this be achieved? Environ. Sci. Technol. 2011, 45, 7100–7106. [Google Scholar] [CrossRef] [PubMed]
- Larsen, T.A.; Alder, A.C.; Eggen, R.I.L.; Maurer, M.; Lienert, J. A new planning and design paradigm to achieve sustainable resource recovery from wastewater. Environ. Sci. Technol. 2009, 43, 6126–6130. [Google Scholar]
- DEFRA. Environmental Permitting (England and Wales) Regulations 2010; Statutory Instrument No. 675 Environmental Permitting (England and Wales) Regulations 2010, Statutory Instrument No. 675; DEFRA: London, UK, 2010.
- Crites, R.; Tchobanoglous, G. Chapter 7: Biological treatment and nutrent removal. In Small and Decentralised Wastewater Management Systems; KT, K., Munson, E., Haag, G., Tchobanoglous, G., Eds.; WCB McGraw Hill: New York, NY, USA, 1998; pp. 397–526. [Google Scholar]
- Pujol, R.; Lienard, A. Qualitative and quantitative characterization of waste water for small communities. In Proceedings of the International Specialized Conference on Design and Operation of Small Wastewater Treatment Plants, Trondheim, Norway, 26–28 June 1989; Odegaard, H., Ed.; 1989; pp. 267–274. [Google Scholar]
- May, L.; Place, C.; OMalley, M.; Spears, B.M. The Impact of Phosphorus Inputs from Small Discharges on Designated Freshwater Sites; Natural England Commissioned Reports, Number 170; Natural England: London, UK, 2015. [Google Scholar]
- EC. Directive 2000/60/EC of the European Parliament and of the Council of 23 October 2000 establishing a framework for Community action in the field of water policy. Off. J. Eur. Parliam. 2000, L327, 1–82. [Google Scholar]
- UK Technical Advisory Group on the Water Framework Directive. Recommendations on Surface Water Classification Schemes for the Purposes of the Water Framework Directive; UK Technical Advisory Group on the Water Framework Directive: London, UK, 2009. [Google Scholar]
- Environment Agency. Update to the River Basin Management Plans in England; National Evidence and Data Report; Environment Agency: Bristol, UK, 2015. [Google Scholar]
- Chong, M.N.; Ho, A.N.M.; Gardner, T.; Sharma, A.K.; Hood, B. Assessing decentralised wastewater treatment technologies: Correlating technology selection to system robustness, energy consumption and GHG emission. In Proceedings of the International Conference on Integrated Water Management, Perth, Western Australia, 2–5 February 2011. [Google Scholar]
- EC. Council Directive concerning urban waste water treatment. Off. J. Eur. Communities 1991, 135, 40–52. [Google Scholar]
- Tchobanoglous, G.; Burton, F.; Stensel, D. Wastewater Engineering: Treatment and Reuse (4th Edition), 4th ed.; McGraw Hill: New York, NY, USA, 2003. [Google Scholar]
- Champely, S. Pwr: Basic Functions for Power Analysis; R Package Version 1.2-2; R Foundation for Statistical Computing: Vienna, Austria, 2018. [Google Scholar]
- R Foundation for Statistical Computing. R Core R: A Language and Environment for Statistical Computing; R Foundation for Statistical Computing: Vienna, Austria, 2018. [Google Scholar]
- Cohen, J. Statistical Power Analysis for the Behavioural Sciences, 2nd ed.; Routledge: Abingdon, UK, 1988. [Google Scholar]
- APHA. Standard Methods for the Examination of Water and Wastewater; American Public Health Association: Washington, DC, USA, 2009. [Google Scholar]
- Wickham, H. Ggplot2: Elegant Graphics for Data Analysis; Springer: New York, NY, USA, 2016. [Google Scholar]
- Niku, S.; Schroeder, E.D.; Samaniego, F.J. Performance of activated sludge processes and reliability-based design. J. Water Pollut. Control 1979, 51, 2841–2857. [Google Scholar]
- Brieman, L. Random Forestst. Mach. Learn. 2001, 45, 5–32. [Google Scholar]
- Ho, T.K. Random decision forests. Proc. Int. Conf. Doc. Anal. Recognit. ICDAR 1995, 1, 278–282. [Google Scholar]
- Kuhn, M. Caret: Classification and Regression Training; R Package Version 6.0-80; R Foundation for Statistical Computing: Vienna, Austria, 2018. [Google Scholar]
- Metz, C.E. Basic principles of ROC analysis. Semin. Nucl. Med. 1978, 8, 283–298. [Google Scholar] [CrossRef]
- Limpert, E.; Stahel, W.A.; Abbt, M. Log-normal distributions across the sciences: Keys and clues. Bioscience 2001, 51, 341–352. [Google Scholar] [CrossRef]

| (a) Effluent Concentration | ||||||||
|---|---|---|---|---|---|---|---|---|
| Smaller WWTPs (n = 72) | Larger WWTPs (n = 18) | |||||||
| Parameter | Min | Max | Mean | SD | Min | Max | Mean | SD |
| sCOD (mg/L) | 21 | 317.5 | 64.1 | 44.8 | 17 | 64 | 35.6 | 14.8 |
| tCOD (mg/L) | 22.5 | 727 | 114.6 | 108.2 | 28.5 | 77.5 | 48.3 | 15.3 |
| TSS (mg/L) | 2.3 | 161 | 31.6 | 35.3 | 5.5 | 19.3 | 12.1 | 4.1 |
| TP (mg/L) | 1 | 11.6 | 4.9 | 2.5 | 1 | 5.1 | 3.6 | 1 |
| NH4-N (mg/L) | 1.75 | 49.2 | 16.5 | 12.1 | 1 | 5.2 | 2.2 | 0.8 |
| NO3-N (mg/L) | LOD | 129.5 | 13.4 | 21.7 | LOD | 104.1 | 22.8 | 27.5 |
| pH | 5.73 | 8.03 | 7.2 | 0.4 | 5.9 | 7.7 | 7.2 | 0.4 |
| DO (mg/L) | 1.1 | 7.7 | 3.2 | 1.2 | 1.6 | 6.4 | 4.1 | 1.5 |
| Ambient temp (°C) | −1.4 | 24.3 | 11.5 | 5.5 | 4 | 20.9 | 13 | 4.6 |
| WW temp (°C) | 4 | 19.1 | 12.2 | 4.6 | 6 | 17.3 | 12.6 | 3.4 |
| (b) Removal Rates | ||||||||
| Smaller WWTPs (n = 72) | Larger WWTPs (n = 18) | |||||||
| Parameter | Min | Max | Mean | SD | Min | Max | Mean | SD |
| sCOD (%) | −18.4 | 95.1 | 67.3 | 20.4 | 33.5 | 94.3 | 73.2 | 17.6 |
| tCOD (%) | −13.1 | 98.5 | 78 | 20.6 | 74.1 | 96.6 | 88.5 | 7.03 |
| TSS (%) | −13.6 | 98 | 80 | 33.9 | 80.3 | 97.6 | 91.7 | 4.6 |
| NH4-N (%) | −15.4 | 95.4 | 55.5 | 30.4 | 81.6 | 96.6 | 92.9 | 3.7 |
| Reference | |||
|---|---|---|---|
| Actual > Design | Actual < Design | ||
| Prediction | Actual > Design | 71.40% | 42.90% |
| Actual < Design | 28.60% | 57.10% | |
| WWTP Category | % Correct Predictions |
|---|---|
| 125–250_HiPAF | 67 |
| 125–250_RBC | 17 |
| 125–250_SF | 100 |
| 50–125_AS | 50 |
| 50–125_RBC | 67 |
| 50–125_SF | 100 |
© 2019 by the authors. Licensee MDPI, Basel, Switzerland. This article is an open access article distributed under the terms and conditions of the Creative Commons Attribution (CC BY) license (http://creativecommons.org/licenses/by/4.0/).
Share and Cite
Bunce, J.T.; Graham, D.W. A Simple Approach to Predicting the Reliability of Small Wastewater Treatment Plants. Water 2019, 11, 2397. https://doi.org/10.3390/w11112397
Bunce JT, Graham DW. A Simple Approach to Predicting the Reliability of Small Wastewater Treatment Plants. Water. 2019; 11(11):2397. https://doi.org/10.3390/w11112397
Chicago/Turabian StyleBunce, Joshua T., and David W. Graham. 2019. "A Simple Approach to Predicting the Reliability of Small Wastewater Treatment Plants" Water 11, no. 11: 2397. https://doi.org/10.3390/w11112397
APA StyleBunce, J. T., & Graham, D. W. (2019). A Simple Approach to Predicting the Reliability of Small Wastewater Treatment Plants. Water, 11(11), 2397. https://doi.org/10.3390/w11112397