Model Performance Indicator of Aging Pipes in a Domestic Water Supply Distribution Network

 , and
, and
Abstract
1. Introduction
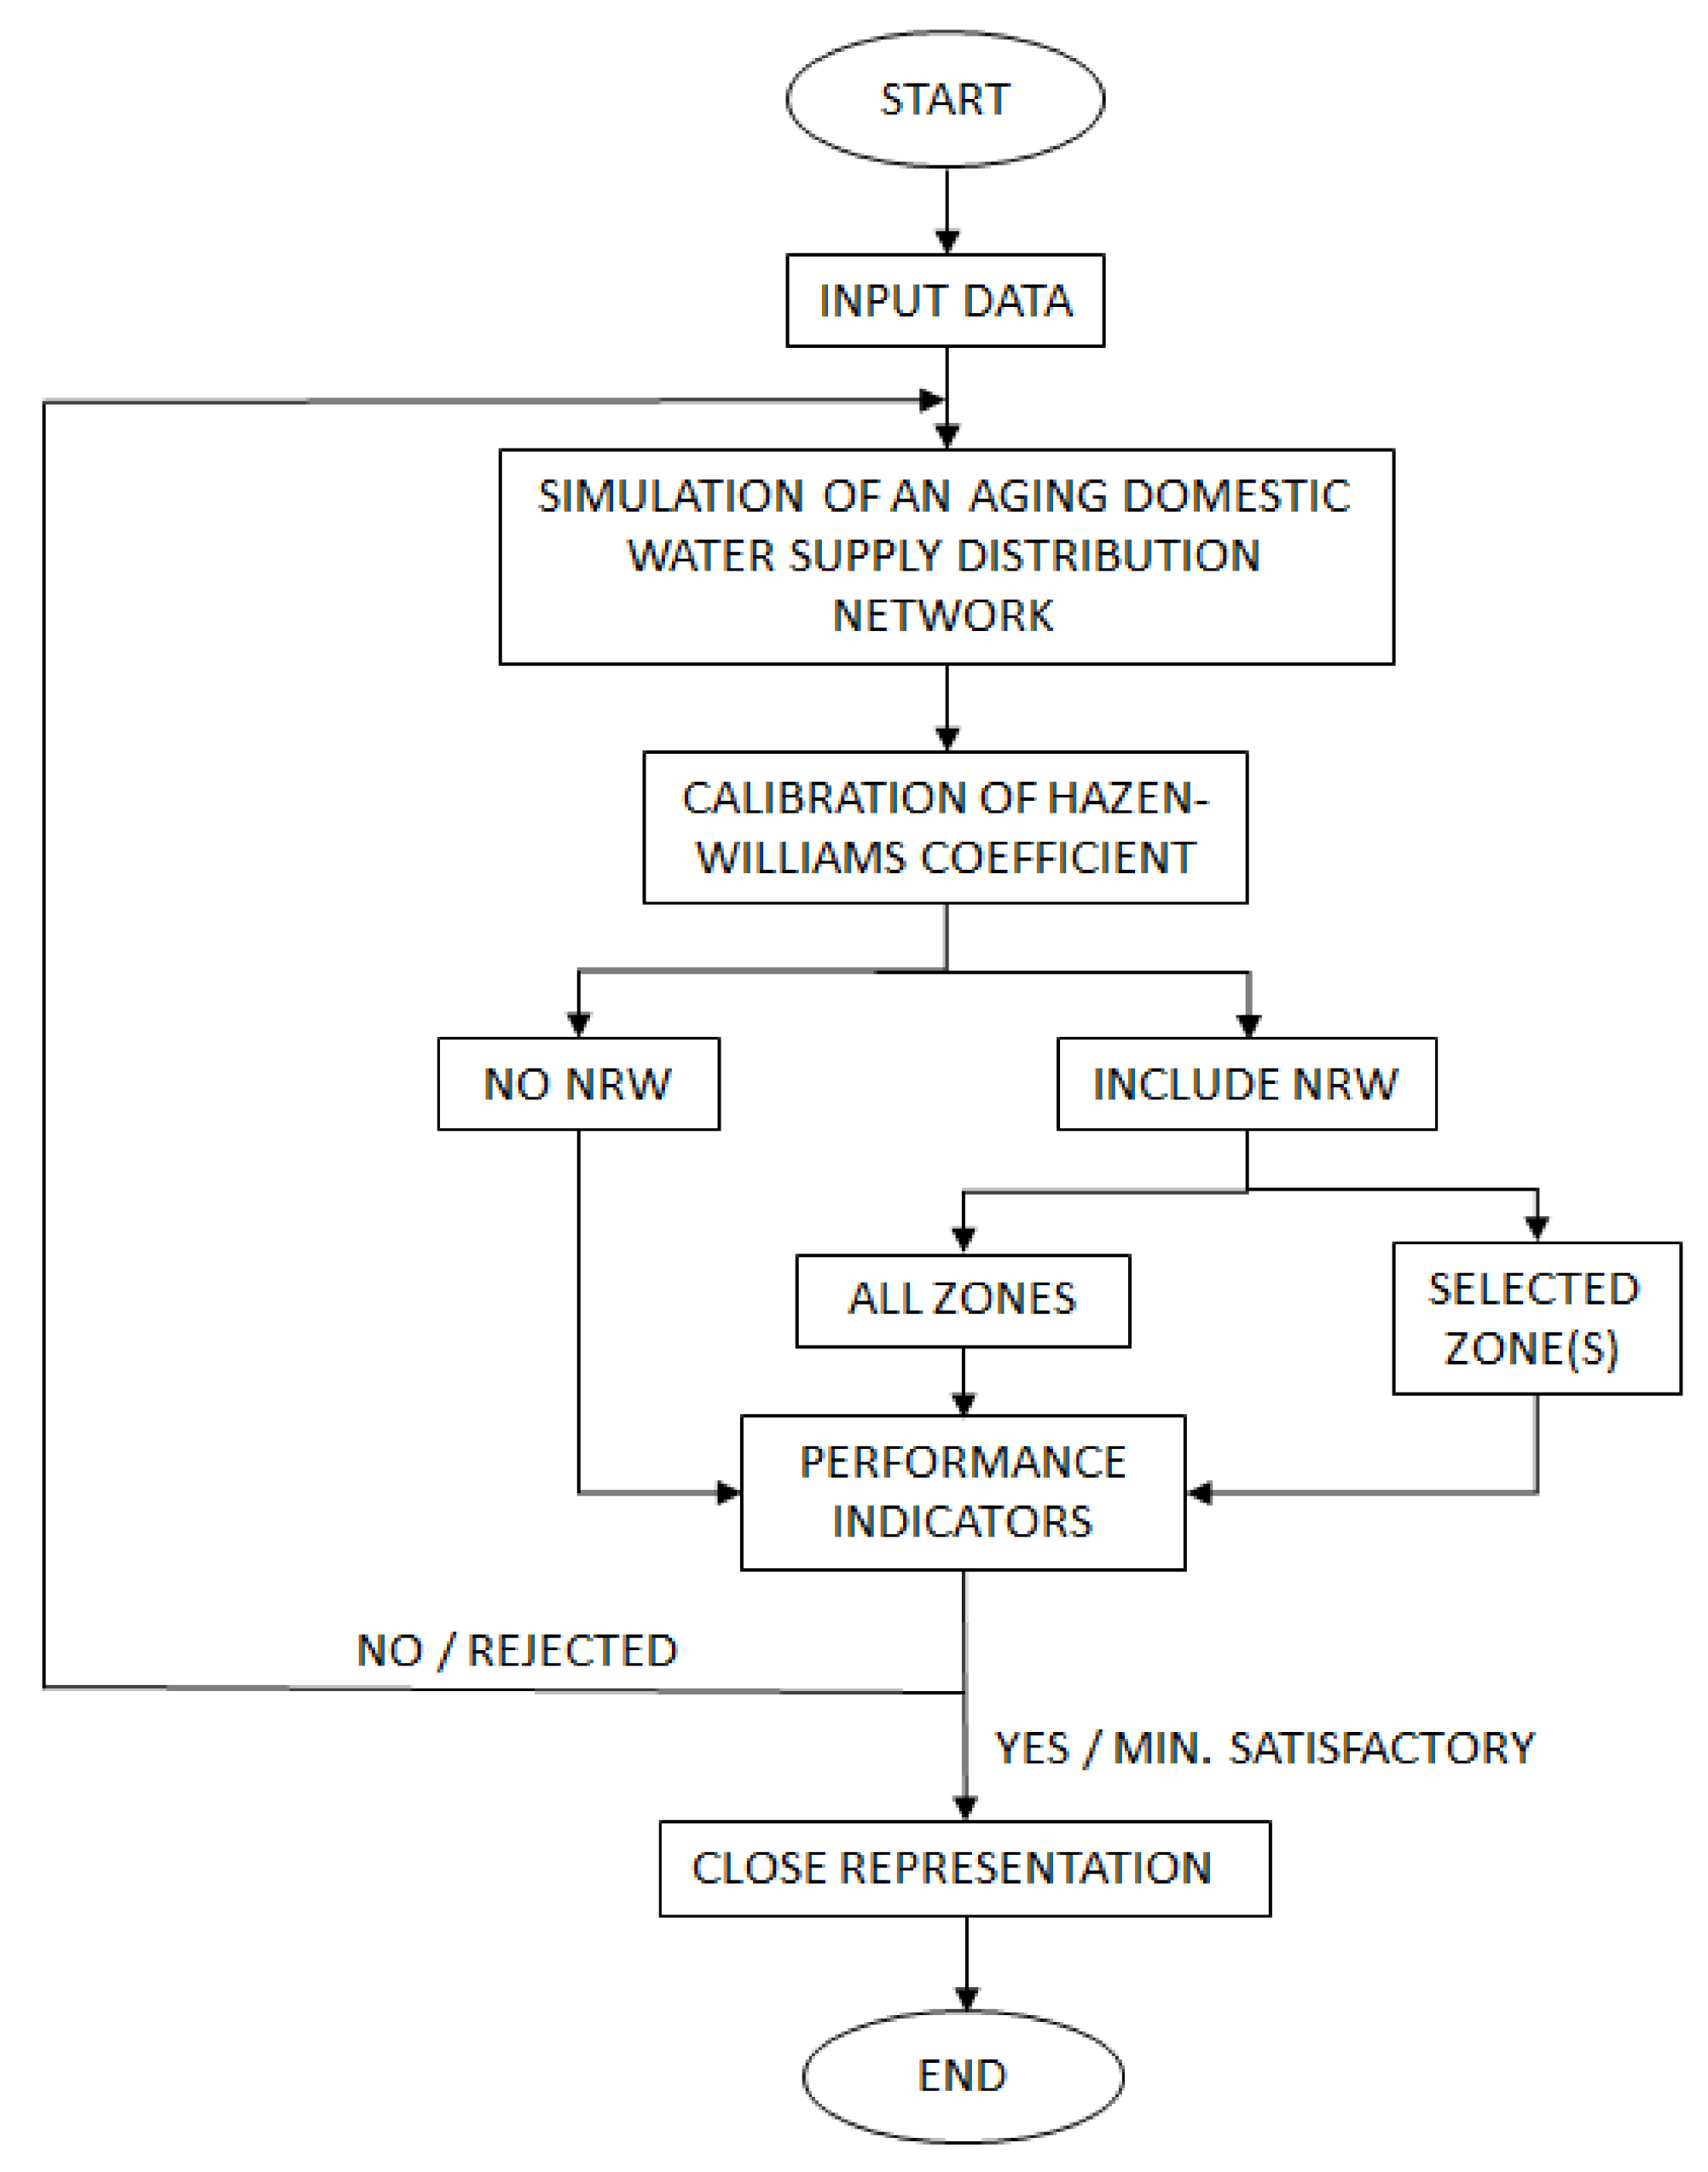
2. Materials and Methods
2.1. Study Area
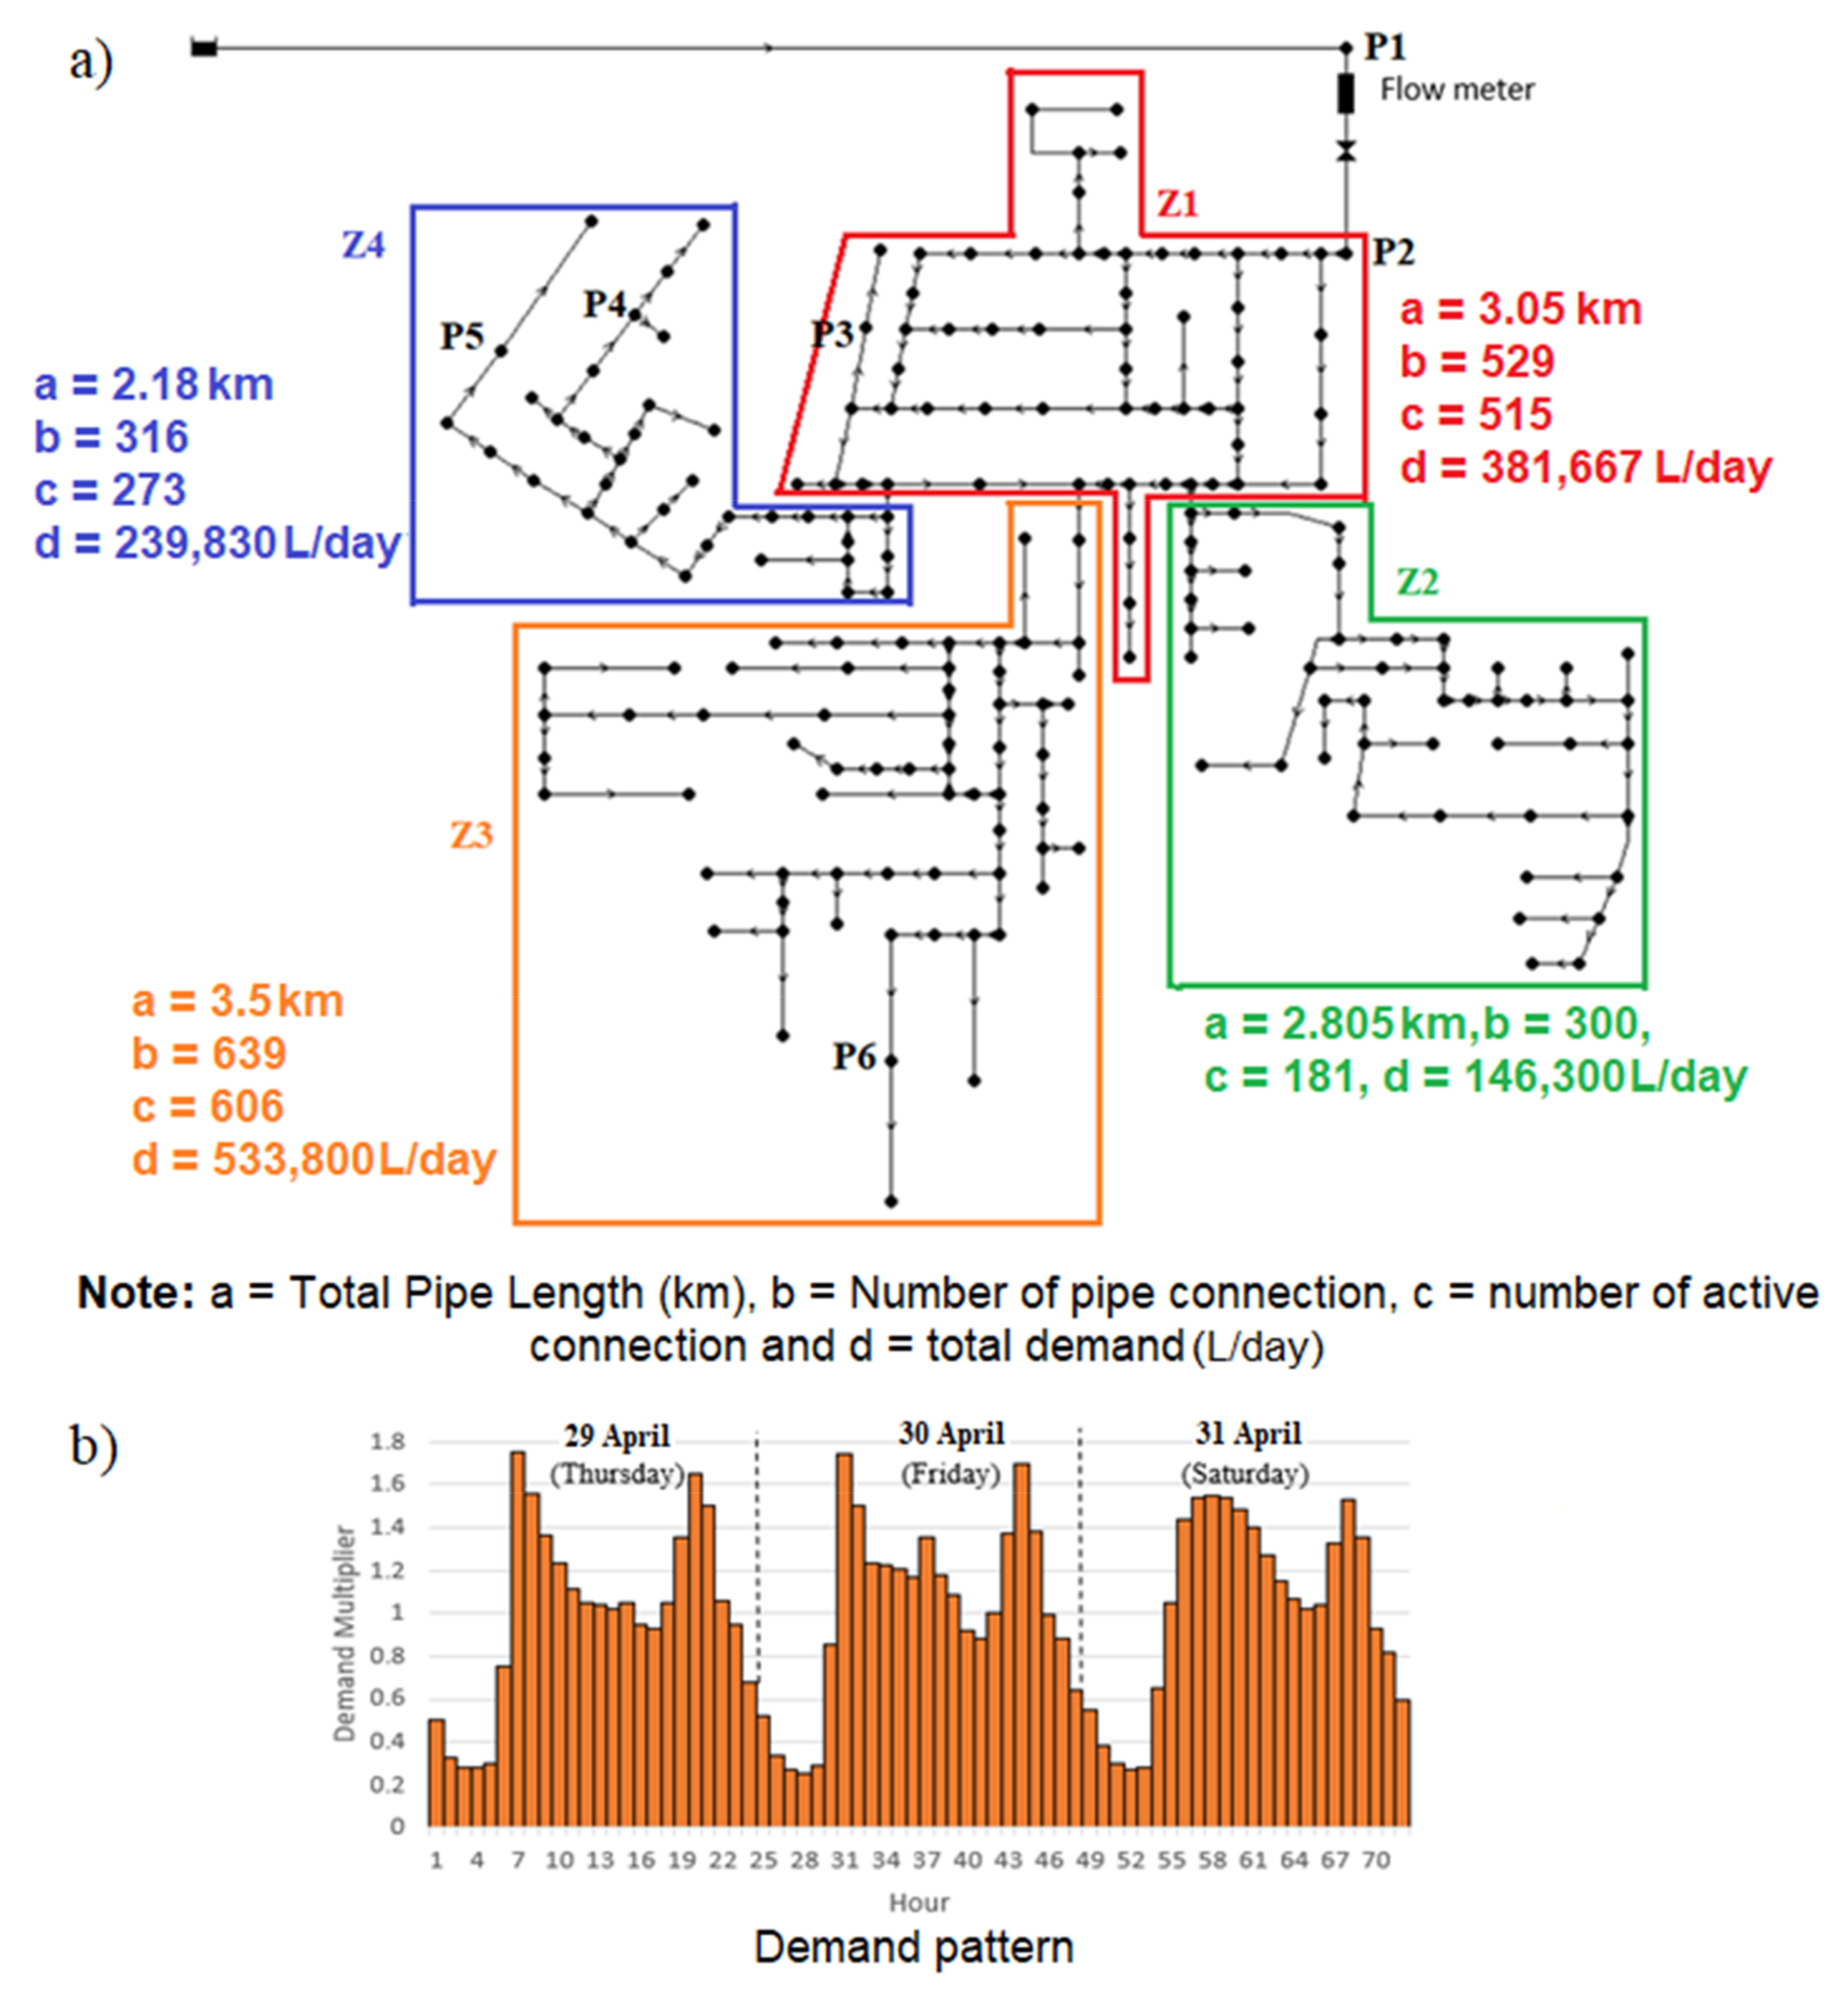
2.2. Pipe Distribution Network
2.3. Nodal Base Demand and Demand Pattern
2.4. Estimation of NRW
2.5. Uncertainty Parameter
2.6. Performance Indicators
2.6.1. Efficiency of the Simulated Models
1. Mean Absolute Error (MAE)
2. Nash–Sutcliffe Efficiency Coefficient (NSEC)
3. Coefficient of Determination, R2
2.6.2. Accuracy of the Simulated Models
3. Results
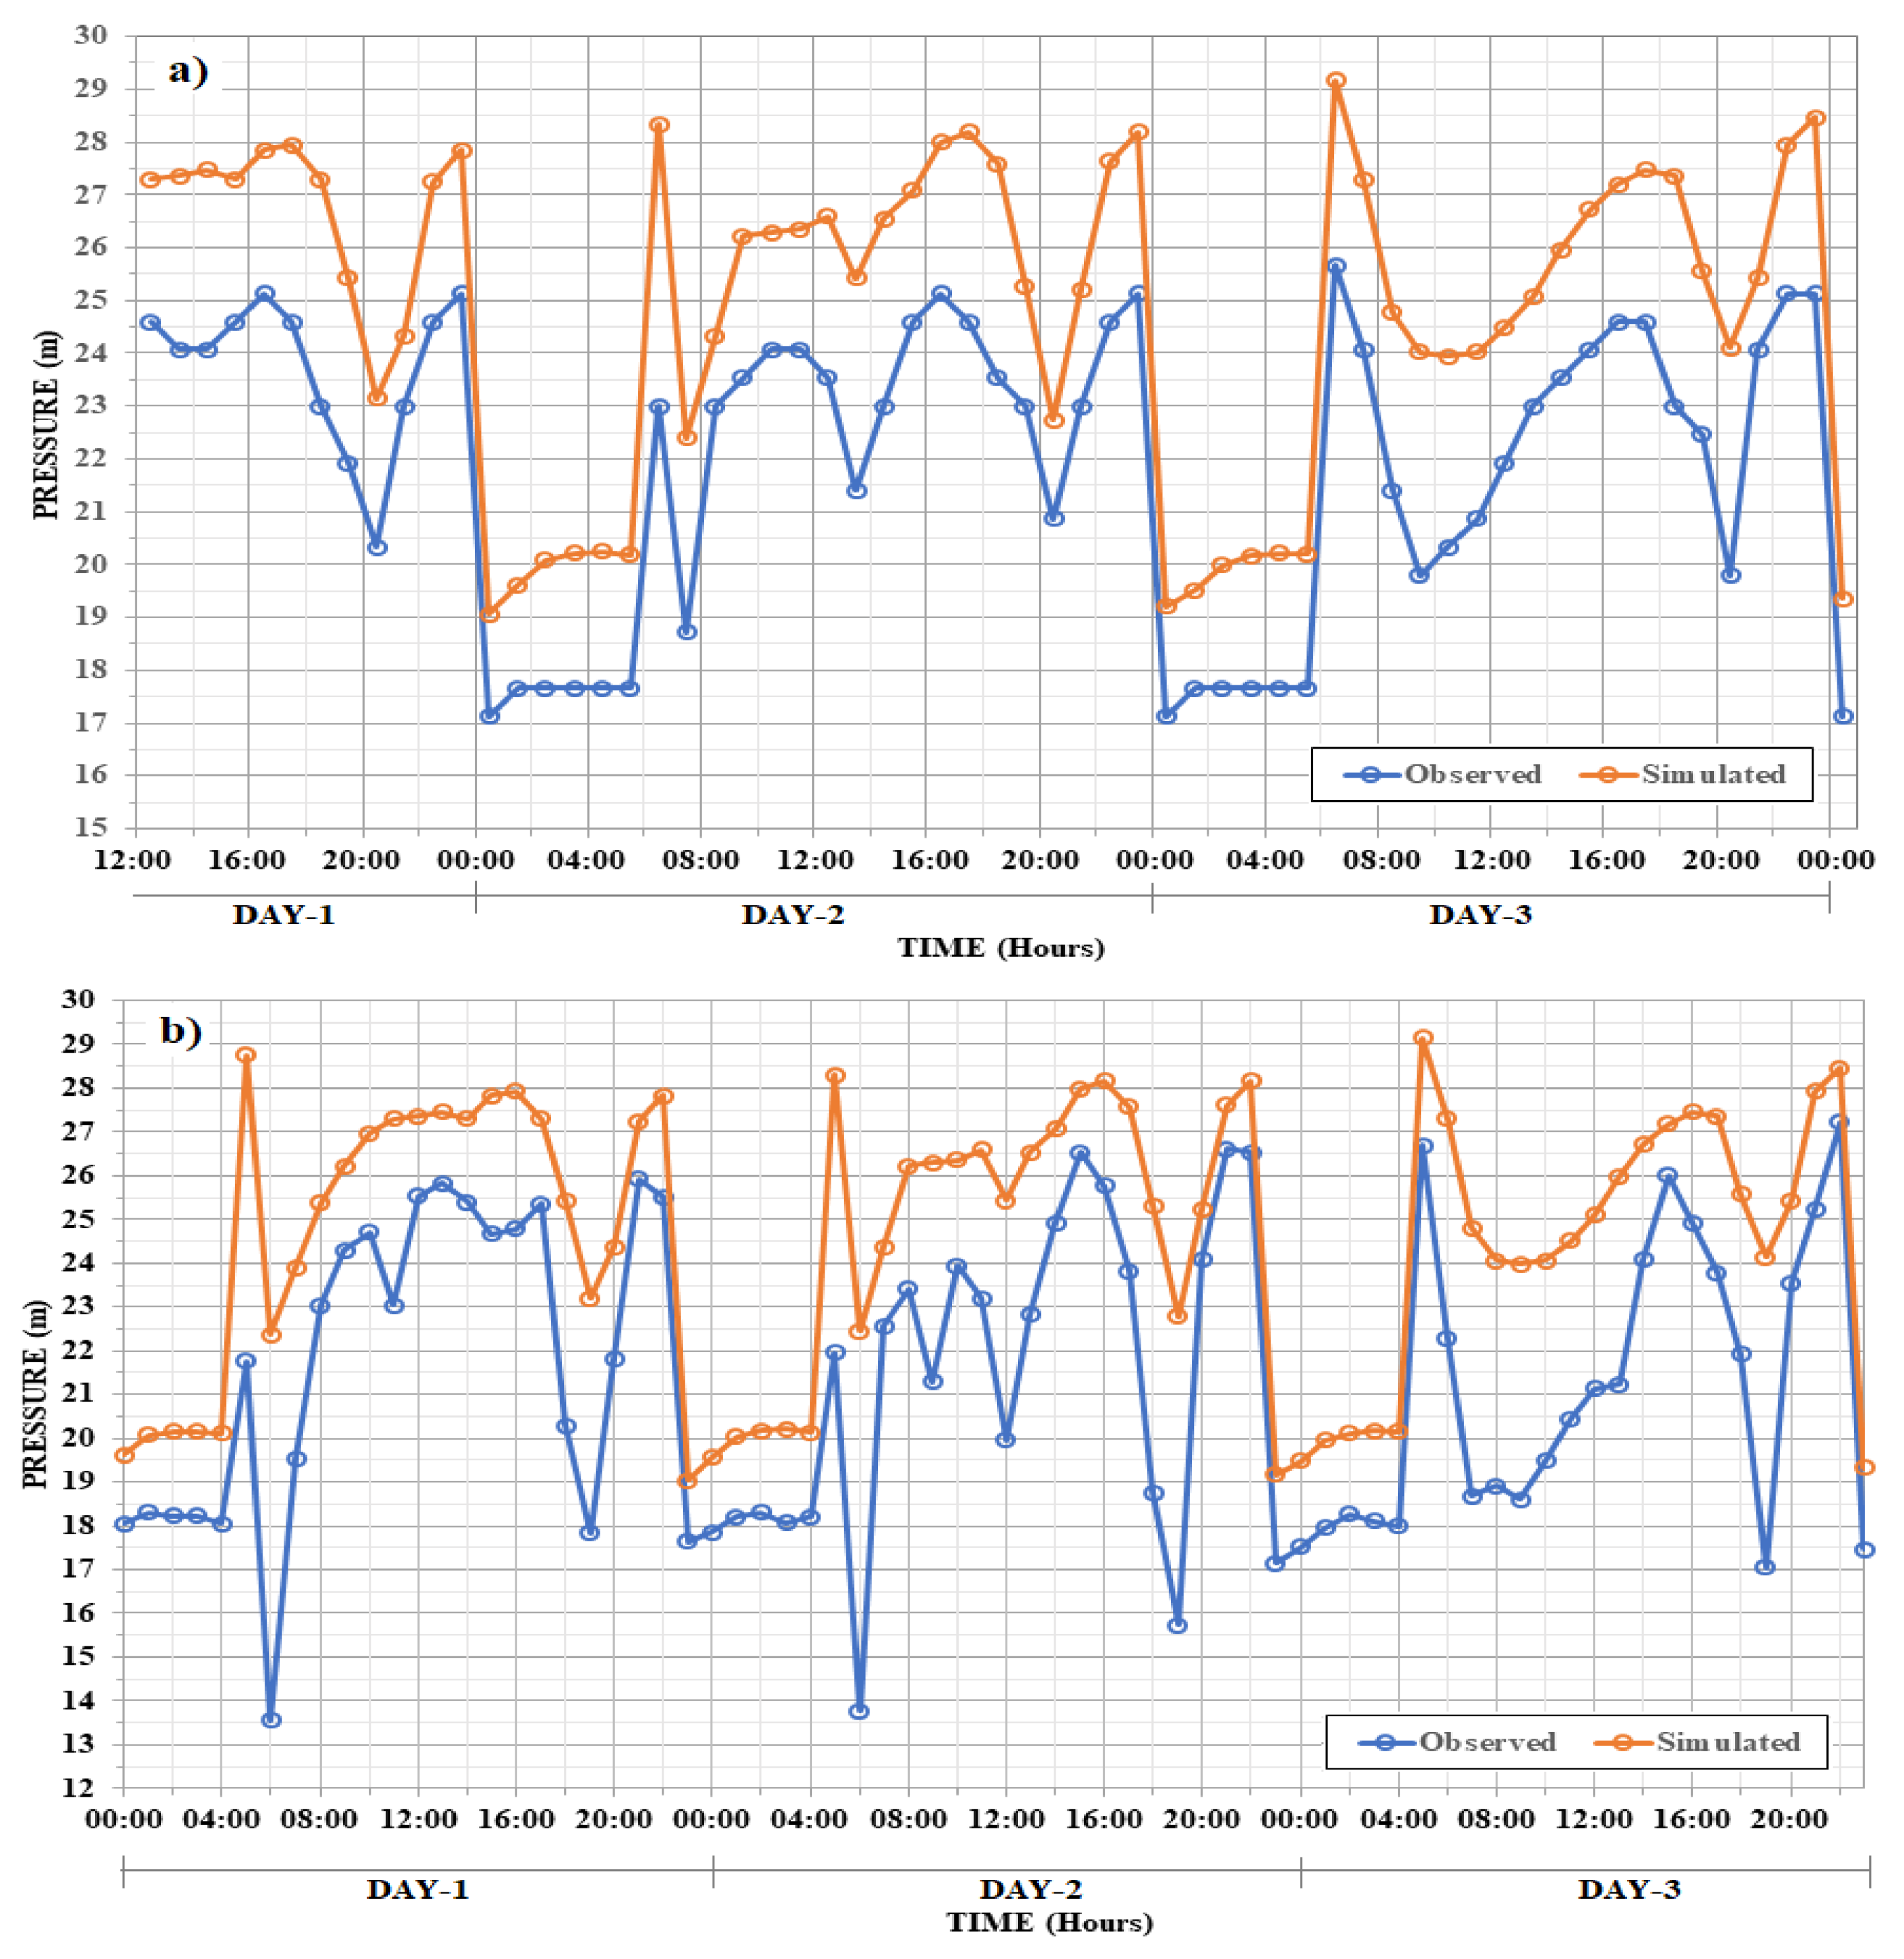
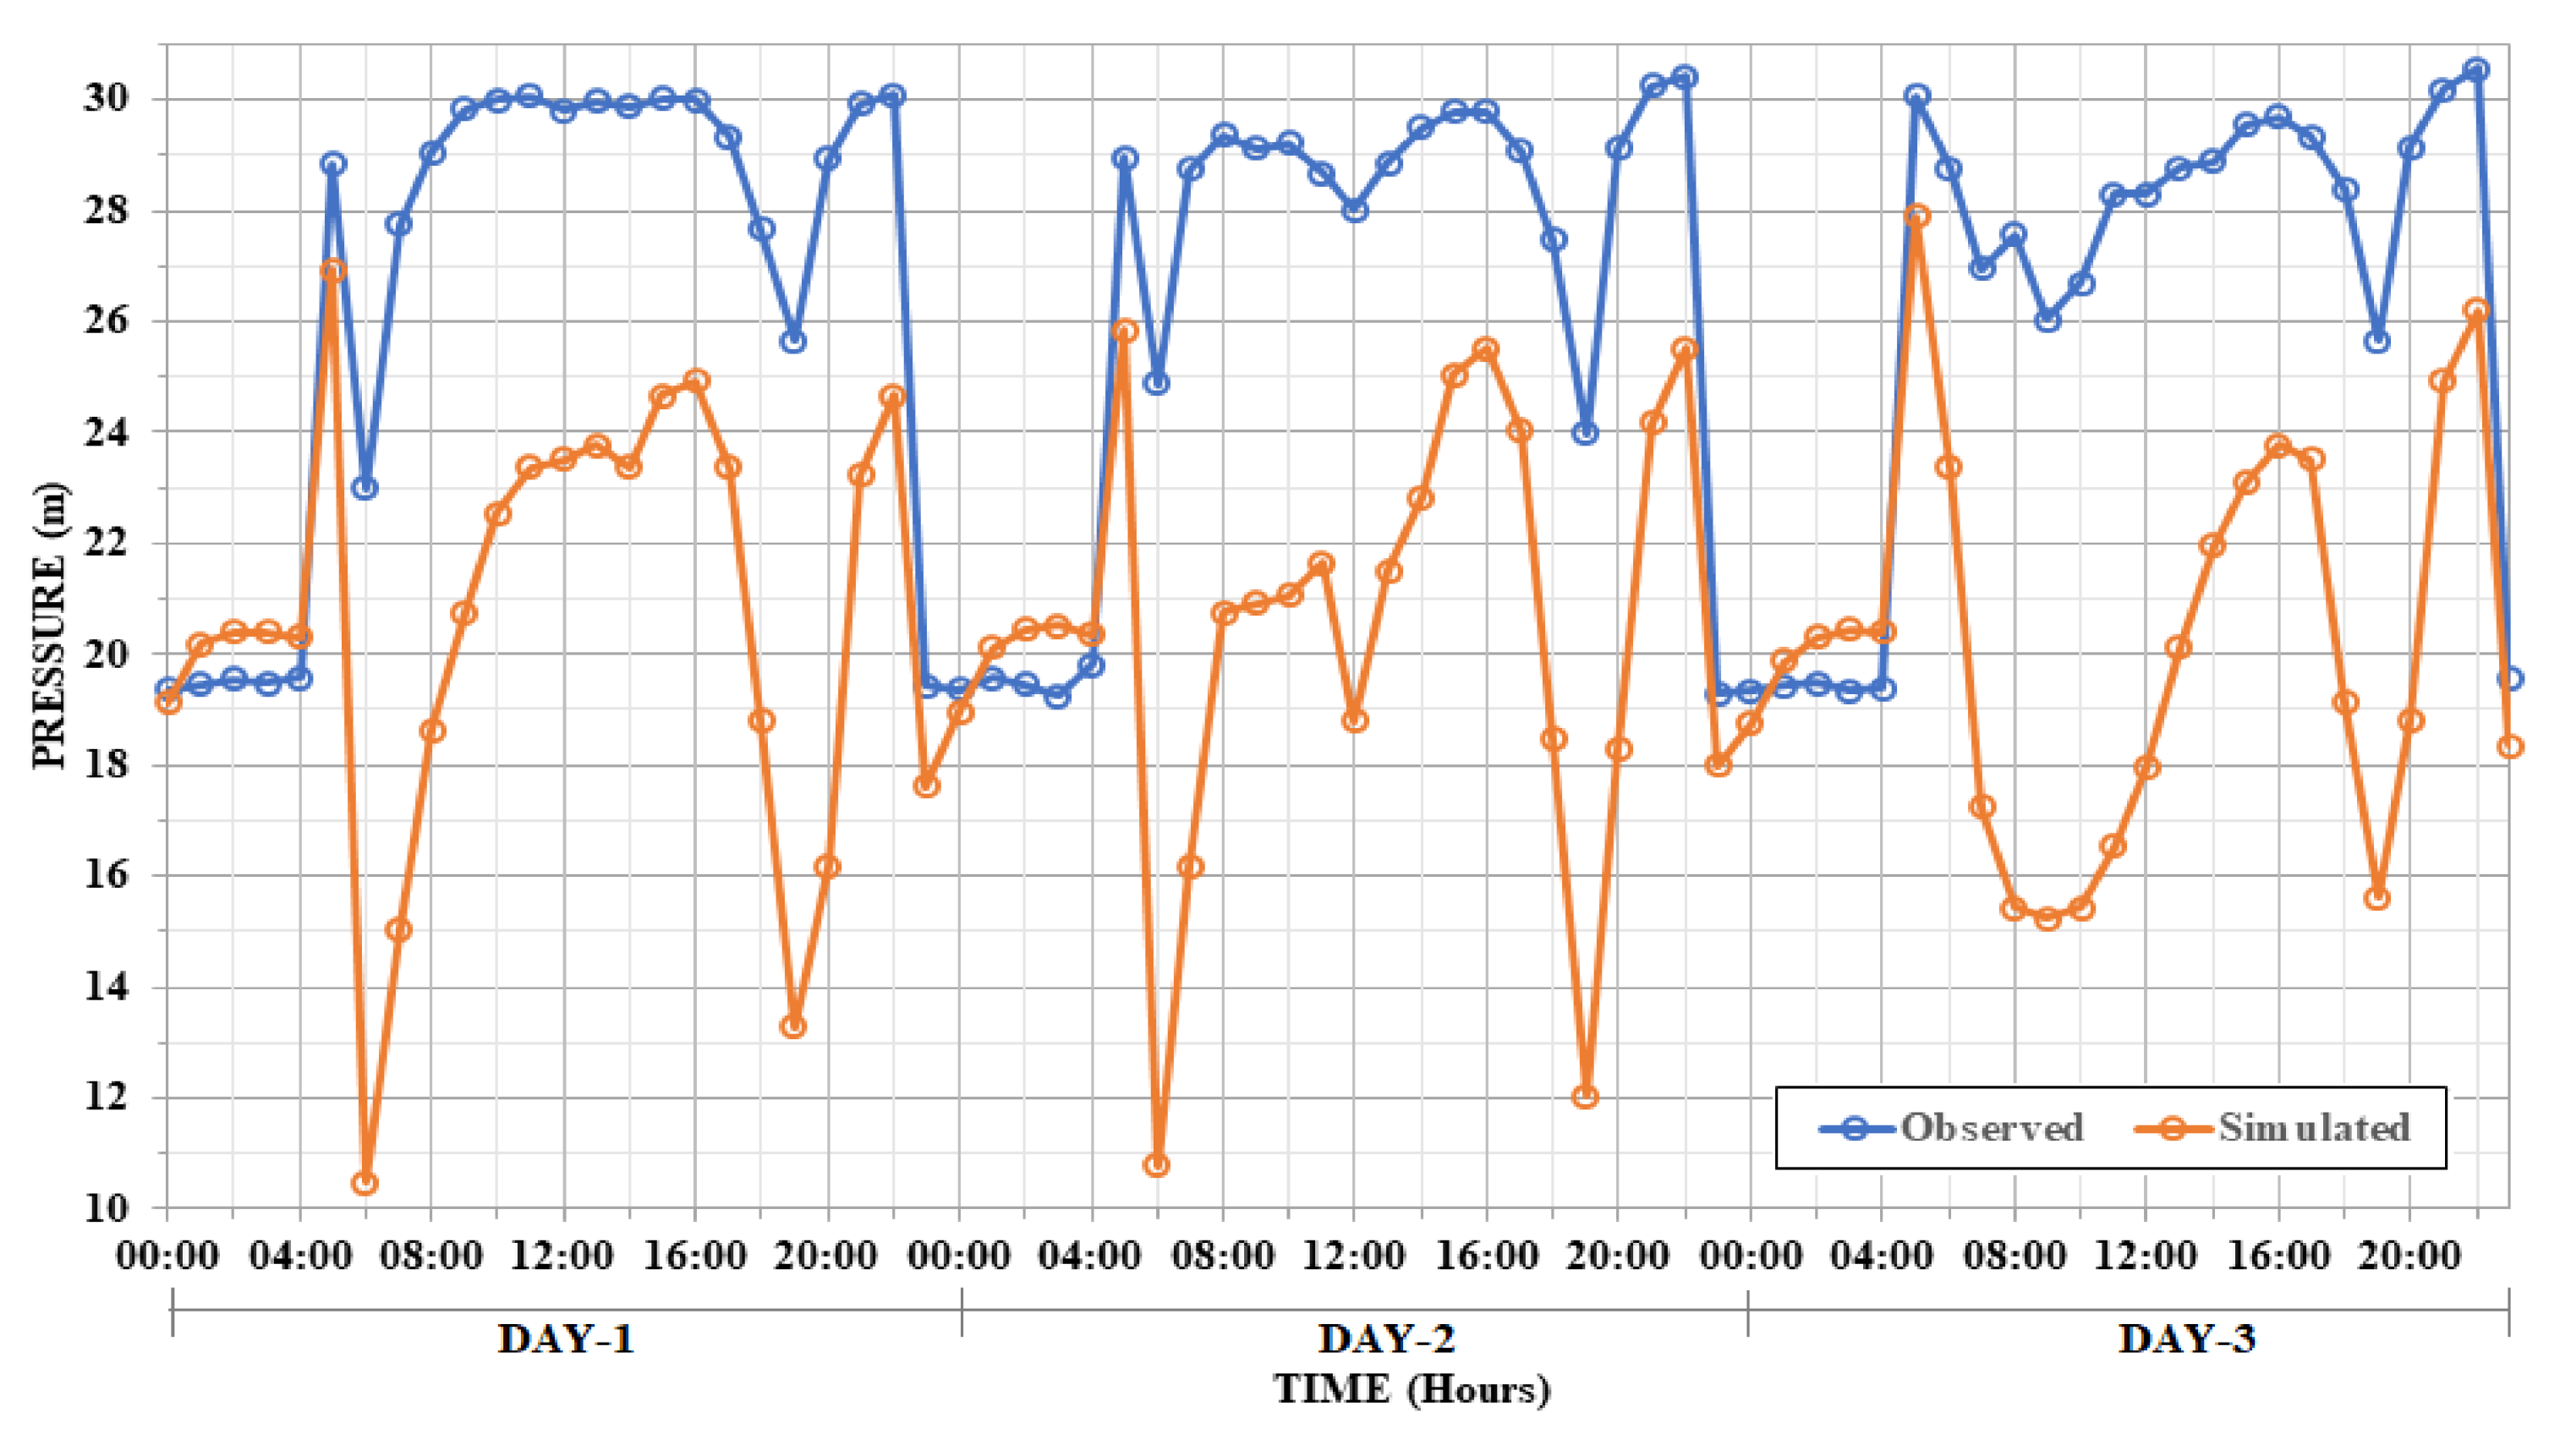
3.1. Performance Analysis o fthe Calibration Model
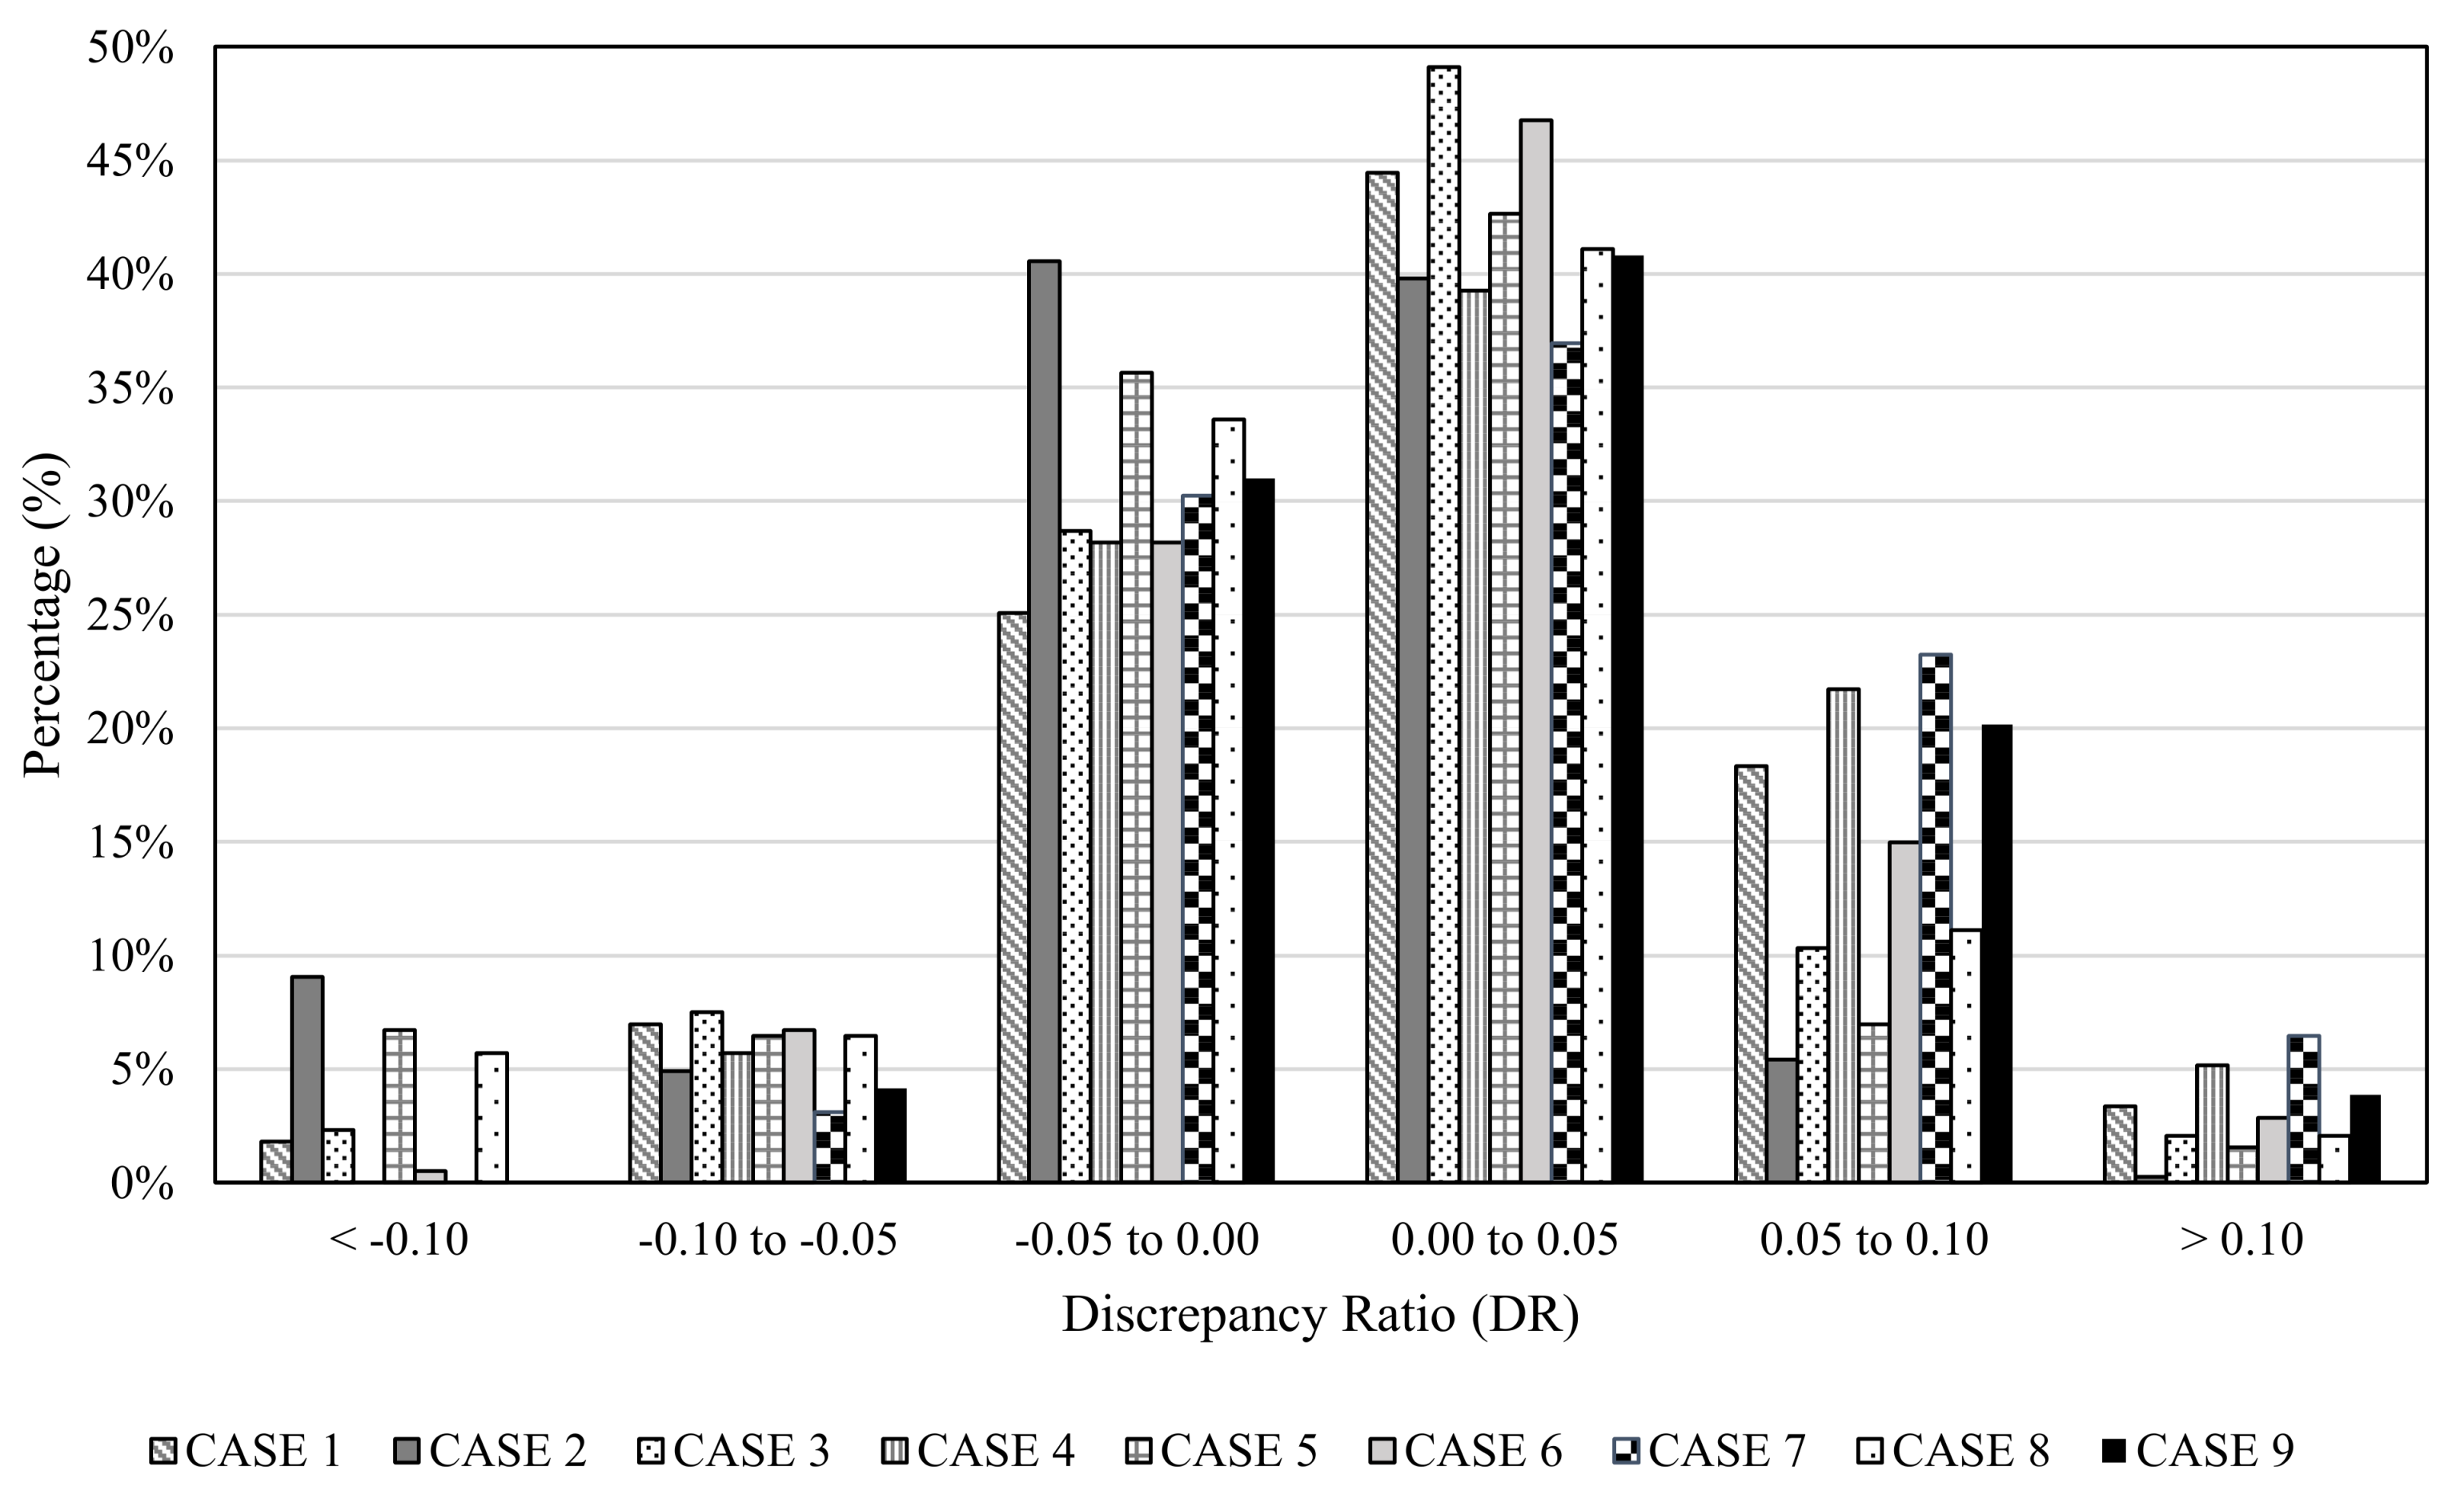
3.2. Accuracy Analysis of the Calibration Model
4. Conclusions
- a)
- A colour-coded performance indicator for model calibration of water distribution systems was established based on statistical values of NSEC, R2 and MAE. The model performance efficiency evaluation was proposed, supported with the accuracy analysis using the Discrepancy Ratio.
- b)
- There appears to be a systematic error between observed and simulated values in the model calibration process, especially for an aging network with limitation of data. However, with a certain range of average error, i.e.,MAE, the calibrated model can be acceptable with some missing data, in this case, valves’ status and respective demand pattern for each subzone.
- c)
- This study proposed an extended period of simulation based on observed data of three days, instead of a common, single period simulation. The calibrated model was proven to represent the behaviour of an aging domestic water distribution network in terms of the demand and pressure during weekdays, weekend eve and also weekends.
- d)
- Identifying the sole demand pattern of the study area is sufficient to perform a simulation, without knowing the actual demand pattern at each node.
- e)
- For pipes aged 20 years or more, the Hazen–Williams coefficient for PVC pipes was estimated between 130 and 140.
- f)
- The estimated NRW value should be included, particularly for an aging domestic water distribution network.
- g)
- The threshold error value for calibrated water distribution network models is proposed as ±5%.
Author Contributions
Funding
Conflicts of Interest
References
- Ahmed, F.; Siwar, C.; Begum, R.A. Water resources in Malaysia: Issues and challenges. J. Food Agric. Environ. 2014, 12, 1100–1104. [Google Scholar]
- New Straits Times. Aged Pipes, Some Since 1960s, to Finally be Replaced in Five States. Available online: https://www.nst.com.my/news/nation/2018/01/326479/aged-pipes-some-1960s-finally-be-replaced-five-states (accessed on 14 May 2019).
- ISTAT. Press Release: WORLD WATER DAY 2019: ISTAT WATER STATISTICS. Available online: https://www.istat.it/en/archivio/228780 (accessed on 14 May 2019).
- Folkman, S. Water Main Break Rates in the USA and Canada: A Comprehensive Study. Available online: https://digitalcommons.usu.edu/cgi/viewcontent.cgi?article=1173&context=mae_facpub (accessed on 8 May 2019).
- Lambert, A.; Hirner, W. Losses from Water Supply Systems: Standard Terminology and Recommended Performance Measures. In IWA The Blue Pages; IWA Publishing: London, UK, 2000. [Google Scholar]
- Marzouk, M.; Hamid, S.A.; El-Said, M. A methodology for prioritizing water mains rehabilitation in Egypt. HBRC J. 2015, 11, 114–128. [Google Scholar] [CrossRef]
- Yoo, D.; Kang, D.; Jun, H.; Kim, J. Rehabilitation priority determination of water pipes based on hydraulic importance. Water 2014, 6, 3864–3887. [Google Scholar] [CrossRef]
- Punurai, W.; Davis, P. Prediction of asbestos cement water pipe aging and pipe prioritization using Monte Carlo simulation. Eng. J. 2017, 21, 1–13. [Google Scholar] [CrossRef]
- Abd Rahman, N.; Muhammad, N.S.; Wan Mohtar, W.H.M. Evolution of research on water leakage control strategies: Where are we now? Urban Water J. 2018, 15, 812–826. [Google Scholar] [CrossRef]
- Koppel, T.; Vassiljev, A. Calibration of a model of an operational water distribution system containing pipes of different age. Adv. Eng. Softw. 2009, 40, 659–664. [Google Scholar] [CrossRef]
- Alvisi, S.; Franchini, M. Pipe roughness calibration in water distribution systems using grey numbers. J. Hydroinformatics 2010, 12, 424–445. [Google Scholar] [CrossRef]
- Jadhao, R.D.; Gupta, R. Calibration of water distribution network of the Ramnagar zone in Nagpur City using online pressure and flow data. Appl. Water Sci. 2018, 8, 1–10. [Google Scholar] [CrossRef]
- Bhave, P.R.; Gupta, R. Analysis of Water Distribution Network; Narosa Publication House Pvt. Ltd.: New Delhi, India, 2006. [Google Scholar]
- Pernot, P.; Cailliez, F. A critical review of statistical calibration/prediction models handling data inconsistency and model inadequacy. AIChE J. 2017, 63, 4642–4665. [Google Scholar] [CrossRef]
- Savic, D.A.; Kapelan, Z.S.; Jonkergouw, P.M. Quo vadis water distribution model calibration? Urban Water J. 2009, 6, 3–22. [Google Scholar] [CrossRef]
- Dini, M.; Tabesh, M. A new method for simultaneous calibration of demand pattern and Hazen–Williams coefficients in water distribution systems. Water Resour. Manag. 2014, 28, 2021–2034. [Google Scholar] [CrossRef]
- Takahashi, S.; Saldarriaga, J.G.; Vega, M.C.; Hernández, F. Water distribution system model calibration under uncertainty environments. Water Sci. Technol. Water Supply 2010, 10, 31–38. [Google Scholar] [CrossRef]
- Mohapatra, S.; Sargaonkar, A.; Labhasetwar, P.K. Distribution network assessment using EPANET for intermittent and continuous water supply. Water Resour. Manag. 2014, 28, 3745–3759. [Google Scholar] [CrossRef]
- Abdullah, J.; Muhammad, N.S.; Julien, P.Y.; Ariffin, J.; Shafie, A. Flood flow simulations and return period calculation for the Kota Tinggi watershed, Malaysia. Flood Risk Manag. 2018, 11, S766–S782. [Google Scholar] [CrossRef]
- Abdullah, J.; Muhammad, N.S.; Muhammad, S.A.; Julien, P.Y. Envelope curves for the specific discharge of extreme floods in Malaysia. J. Hydro-Environ. Res. 2019, 25, 1–11. [Google Scholar] [CrossRef]
- Rosli, M.H.; Sulaiman, W.N.A.; Jamil, N.; Toriman, M.E.; Kamarudin, M.K.A. Integration of spatially hydrological modelling on bentong catchment, pahang, peninsular Malaysia using distributed GIS-based rainfall runoff model. Environ. Asia 2017, 10, 65–79. [Google Scholar] [CrossRef]
- Moriasi, D.N.; Arnold, J.G.; Van Liew, M.W.; Bingner, R.L.; Harmel, R.D.; Veith, T.L. Model evaluation guidelines for systematic quantification of accuracy in watershed simulations. Trans. ASABE 2007, 50, 885–900. [Google Scholar] [CrossRef]
- Ritter, A.; Muñoz-Carpena, R. Performance evaluation of hydrological models: Statistical significance for reducing subjectivity in goodness-of-fit assessments. J. Hydrol. 2013, 480, 33–45. [Google Scholar] [CrossRef]
- Willmott, C.J.; Robeson, S.M.; Matsuura, K. A refined index of model performance. Int. J. Climatol. 2012, 32, 2088–2094. [Google Scholar] [CrossRef]
- Legates, D.R.; McCabe, G.J. Evaluating the use of “goodness-of-fit” measures in hydrologic and hydroclimatic model validation. Water Resour. Res. 1999, 35, 233–241. [Google Scholar] [CrossRef]
- Tayfur, G.; Moramarco, T. Predicting hourly-based flow discharge hydrographs from level data using genetic algorithms. J. Hydrol. 2008, 352, 77–93. [Google Scholar] [CrossRef]
- Seo, I.W.; Cheong, T.S. Predicting longitudinal dispersion coefficient in natural streams. J. Hydraul. Eng. 1998, 124, 25–32. [Google Scholar] [CrossRef]
- Kashefipour, S.M.; Falconer, R.A. Longitudinal dispersion coefficients in natural channels. Water Res. 2002, 36, 1596–1608. [Google Scholar] [CrossRef]
- Sivakumar, P.; Prasad, R.K. Extended period simulation of pressure-deficient networks using pressure reducing valves. Water Resour. Manag. 2015, 29, 1713–1730. [Google Scholar] [CrossRef]
- Chen, J.; Zeidan, M.; Ostfeld, A. Analysis of Relations between Pressure and Water Age in Water Distribution Systems. In Proceedings of the 1st International WDSA/CCWI Joint Conference, Kingston, ON, Canada, 23–25 July 2018. [Google Scholar]
- Cheng, W.P.; Liu, E.H.; Liu, J.Q. A novel statistical model for water age estimation in water distribution networks. Math. Probl. Eng. 2015, 2015, 1–9. [Google Scholar] [CrossRef]
- Akdeniz, T.; Muhammetoğlu, H. Chlorine residual management for water utilities using GIS, SCADA and modeling tools. Desalin. Water Treat. 2017, 59, 135–143. [Google Scholar] [CrossRef]
- Adedoja, O.; Hamam, Y.; Khalaf, B.; Sadiku, R. Towards development of an optimization model to identify contamination source in a water distribution network. Water 2018, 10, 579. [Google Scholar] [CrossRef]
- Giustolisi, O.; Berardi, L.; Laucelli, D.; Savic, D.; Walski, T.; Brunone, B. Battle of background leakage assessment for water networks (BBLAWN) at WDSA conference 2014. Proced. Eng. 2014, 89, 4–12. [Google Scholar] [CrossRef]
- National Water Service Commission. Non-Revenue Water Year 2016–2017. Available online: https://www.span.gov.my/article/view/non-revenue-water-nrw-2015-2016 (accessed on 4 June 2019).
- Malaysian Water Association. MWA Design Guidelines for Water Supply Systems; MWA: Kuala Lumpur, Malaysia, 1994. [Google Scholar]
- Adeniran, A.E.; Oyelowo, M.A. An EPANET analysis of water distribution network of the University of Lagos, Nigeria. J. Eng. Res. 2013, 18, 69–83. [Google Scholar]
- Walski, T.M. Procedure for hydraulic model calibration. J.-Am. Water Work. Assoc. 2017, 109, 55–61. [Google Scholar] [CrossRef]
- Tayfur, G. Artificial neural networks, fuzzy logic and genetic algorithms. In Soft Computing in Water Resources Engineering; WIT Press: Southampton, UK, 2014; pp. 55–59. [Google Scholar]
- Walski, T.M. Technique for calibrating network models. J. Water Resour. Plan. Manag. 1983, 109, 360–372. [Google Scholar] [CrossRef]
- Abdullah, J.; Julien, P.Y. Distributed flood simulations on a small topical watershed with the TREX model. J. Flood Eng. 2014, 5, 17–37. [Google Scholar]
- Nash, J.E.; Sutcliffe, J.V. River flow forecasting through conceptual models, Part I—A discussion of principles. J. Hydrol. 1970, 10, 282–290. [Google Scholar] [CrossRef]
- Hwang, S.H.; Ham, D.H.; Kim, J.H. A new measure for assessing the efficiency of hydrological data-driven forecasting models. Hydrol. Sci. J. 2012, 57, 1257–1274. [Google Scholar] [CrossRef]
- Tayfur, G.; Singh, V.P. Predicting longitudinal dispersion coefficient in natural streams by artificial neural network. J. Hydraul. Eng. 2005, 131, 991–1000. [Google Scholar] [CrossRef]
- Ibrahim, S.L.; Abdullah, J.; Hashim, K.; Ariffin, J. Establishment of Jet index for soil erodibility coefficient using jet erosion device (JEd). GEOMATE 2017, 12, 152–157. [Google Scholar] [CrossRef]


| Simulation | 30% NRW | Hazen–Williams Roughness Coefficient (for PVC Pipes) |
|---|---|---|
| CASE 1 | NO | 130 |
| CASE 2 | YES | 130 |
| CASE 3 | SELECTED ZONE(S) | 130 |
| CASE 4 | NO | 140 |
| CASE 5 | YES | 140 |
| CASE 6 | SELECTED ZONE(S) | 140 |
| CASE 7 | NO | 150 |
| CASE 8 | YES | 150 |
| CASE 9 | SELECTED ZONE(S) | 150 |
| MODEL | 30% NRW | Hazen-William Coefficient | Nash-Sutcliffe Efficiency Coefficient, NSEC | Coefficient of Determination, R2 | Mean Absolute Error, MAE | Correlation Coefficient, r | Accuracy (%) | ||||||
|---|---|---|---|---|---|---|---|---|---|---|---|---|---|
| P1 | P2 | P3 | P4 | P5 | P6 | ||||||||
| CASE 1 | NO | 130 | 0.89 | 0.96 | 0.93 | −0.11 | −0.15 | 0.22 | 0.82 | 1.97 | 0.9 | 69 | |
| CASE 2 | YES | 130 | 0.83 | 0.96 | 0.74 | 0.66 | 0.72 | −2.04 | 0.73 | 2.08 | 0.88 | 81 | |
| CASE 3 | ONLY Z4 | 130 | 0.9 | 0.96 | 0.96 | 0.4 | 0.3 | 0.08 | 0.84 | 1.74 | 0.92 | 78 | |
| CASE 4 | NO | 140 | 0.89 | 0.96 | 0.88 | −0.45 | −0.44 | 0.5 | 0.82 | 2.03 | 0.90 | 77 | |
| CASE 5 | YES | 140 | 0.83 | 0.96 | 0.89 | 0.57 | 0.52 | −1.09 | 0.76 | 1.98 | 0.89 | 79 | |
| CASE 6 | ONLY Z4 | 140 | 0.9 | 0.96 | 0.93 | 0.11 | 0.02 | 0.4 | 0.85 | 1.81 | 0.92 | 75 | |
| CASE 7 | NO | 150 | 0.89 | 0.96 | 0.81 | −0.78 | −0.72 | 0.67 | 0.82 | 2.08 | 0.90 | 67 | |
| CASE 8 | YES | 150 | 0.83 | 0.96 | 0.94 | 0.37 | 0.3 | −0.48 | 0.79 | 1.96 | 0.89 | 75 | |
| CASE 9 | ONLY Z4 | 150 | 0.9 | 0.96 | 0.88 | −0.2 | −0.26 | 0.6 | 0.85 | 1.88 | 0.92 | 72 | |
| Legend | Model Indicator | NSEC / R2 | MAE (m) |
|---|---|---|---|
| Reject | < 0.34 | > 10.0 | |
| Satisfactory | 0.35–0.49 | 5.0–10.0 | |
| Acceptable | 0.50–0.65 | 3.1–5.0 | |
| Good | 0.66–0.79 | 1.5–3.1 | |
| Very Good | 0.80–1.00 | < 1.5 |
© 2019 by the authors. Licensee MDPI, Basel, Switzerland. This article is an open access article distributed under the terms and conditions of the Creative Commons Attribution (CC BY) license (http://creativecommons.org/licenses/by/4.0/).
Share and Cite
Abd Rahman, N.; Muhammad, N.S.; Abdullah, J.; Wan Mohtar, W.H.M. Model Performance Indicator of Aging Pipes in a Domestic Water Supply Distribution Network. Water 2019, 11, 2378. https://doi.org/10.3390/w11112378
Abd Rahman N, Muhammad NS, Abdullah J, Wan Mohtar WHM. Model Performance Indicator of Aging Pipes in a Domestic Water Supply Distribution Network. Water. 2019; 11(11):2378. https://doi.org/10.3390/w11112378
Chicago/Turabian StyleAbd Rahman, Norzaura, Nur Shazwani Muhammad, Jazuri Abdullah, and Wan Hanna Melini Wan Mohtar. 2019. "Model Performance Indicator of Aging Pipes in a Domestic Water Supply Distribution Network" Water 11, no. 11: 2378. https://doi.org/10.3390/w11112378
APA StyleAbd Rahman, N., Muhammad, N. S., Abdullah, J., & Wan Mohtar, W. H. M. (2019). Model Performance Indicator of Aging Pipes in a Domestic Water Supply Distribution Network. Water, 11(11), 2378. https://doi.org/10.3390/w11112378