Impact of Climate Change on Water Balance Components and Droughts in the Guajoyo River Basin (El Salvador)


Abstract
1. Introduction
2. Materials and Methods
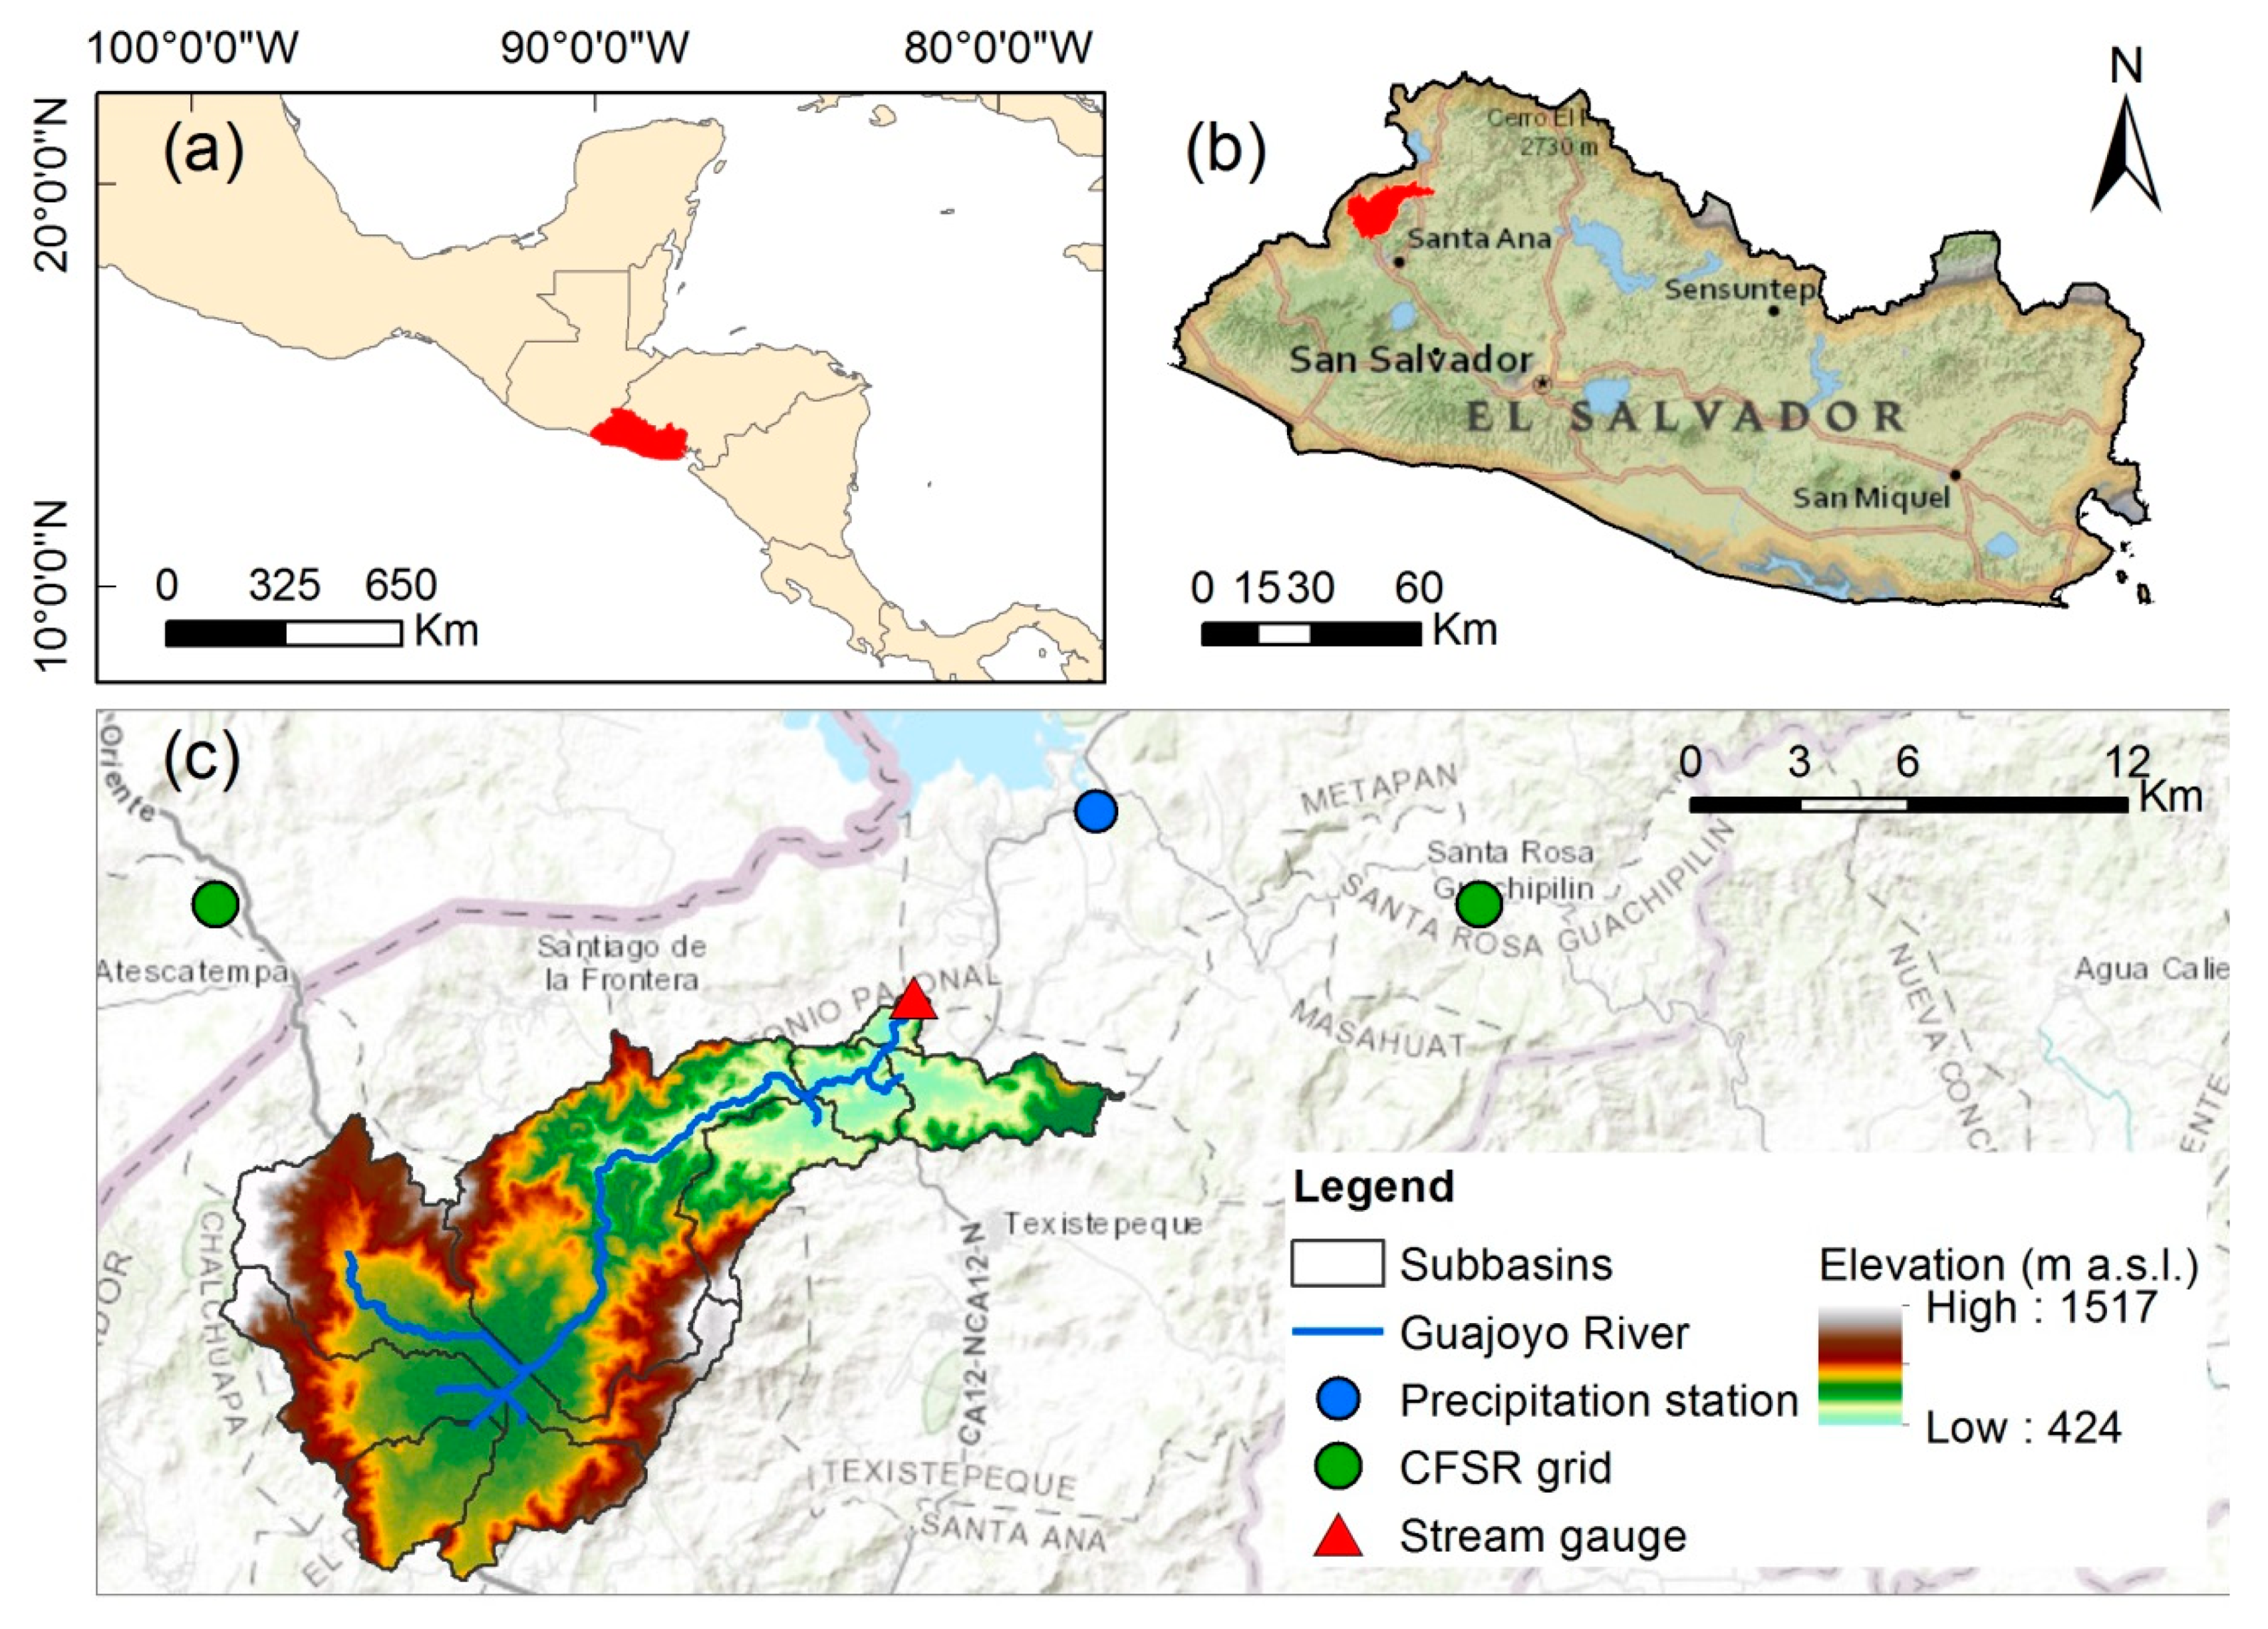
2.1. Study Area
2.2. Data Sources
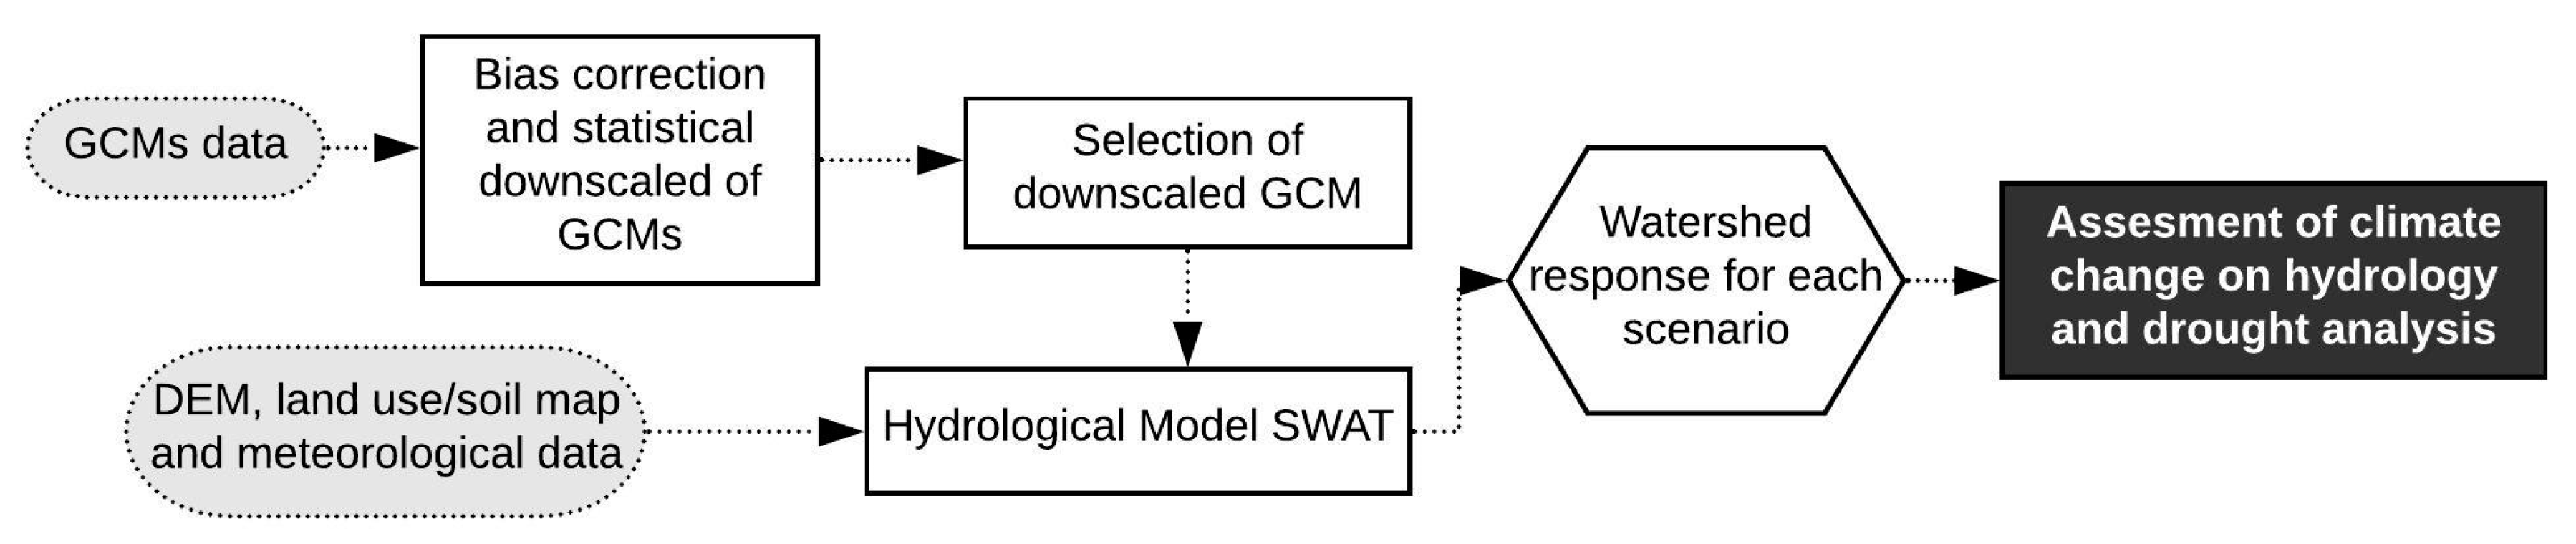
2.3. Conceptual Model
2.4. The SWAT Hydrological Model
2.4.1. Model Setup
2.4.2. Model Calibration and Validation Procedures
2.5. Climate Change Scenarios and Predictions
Trend Analysis Methods
2.6. Drought Analysis
3. Results and Discussion
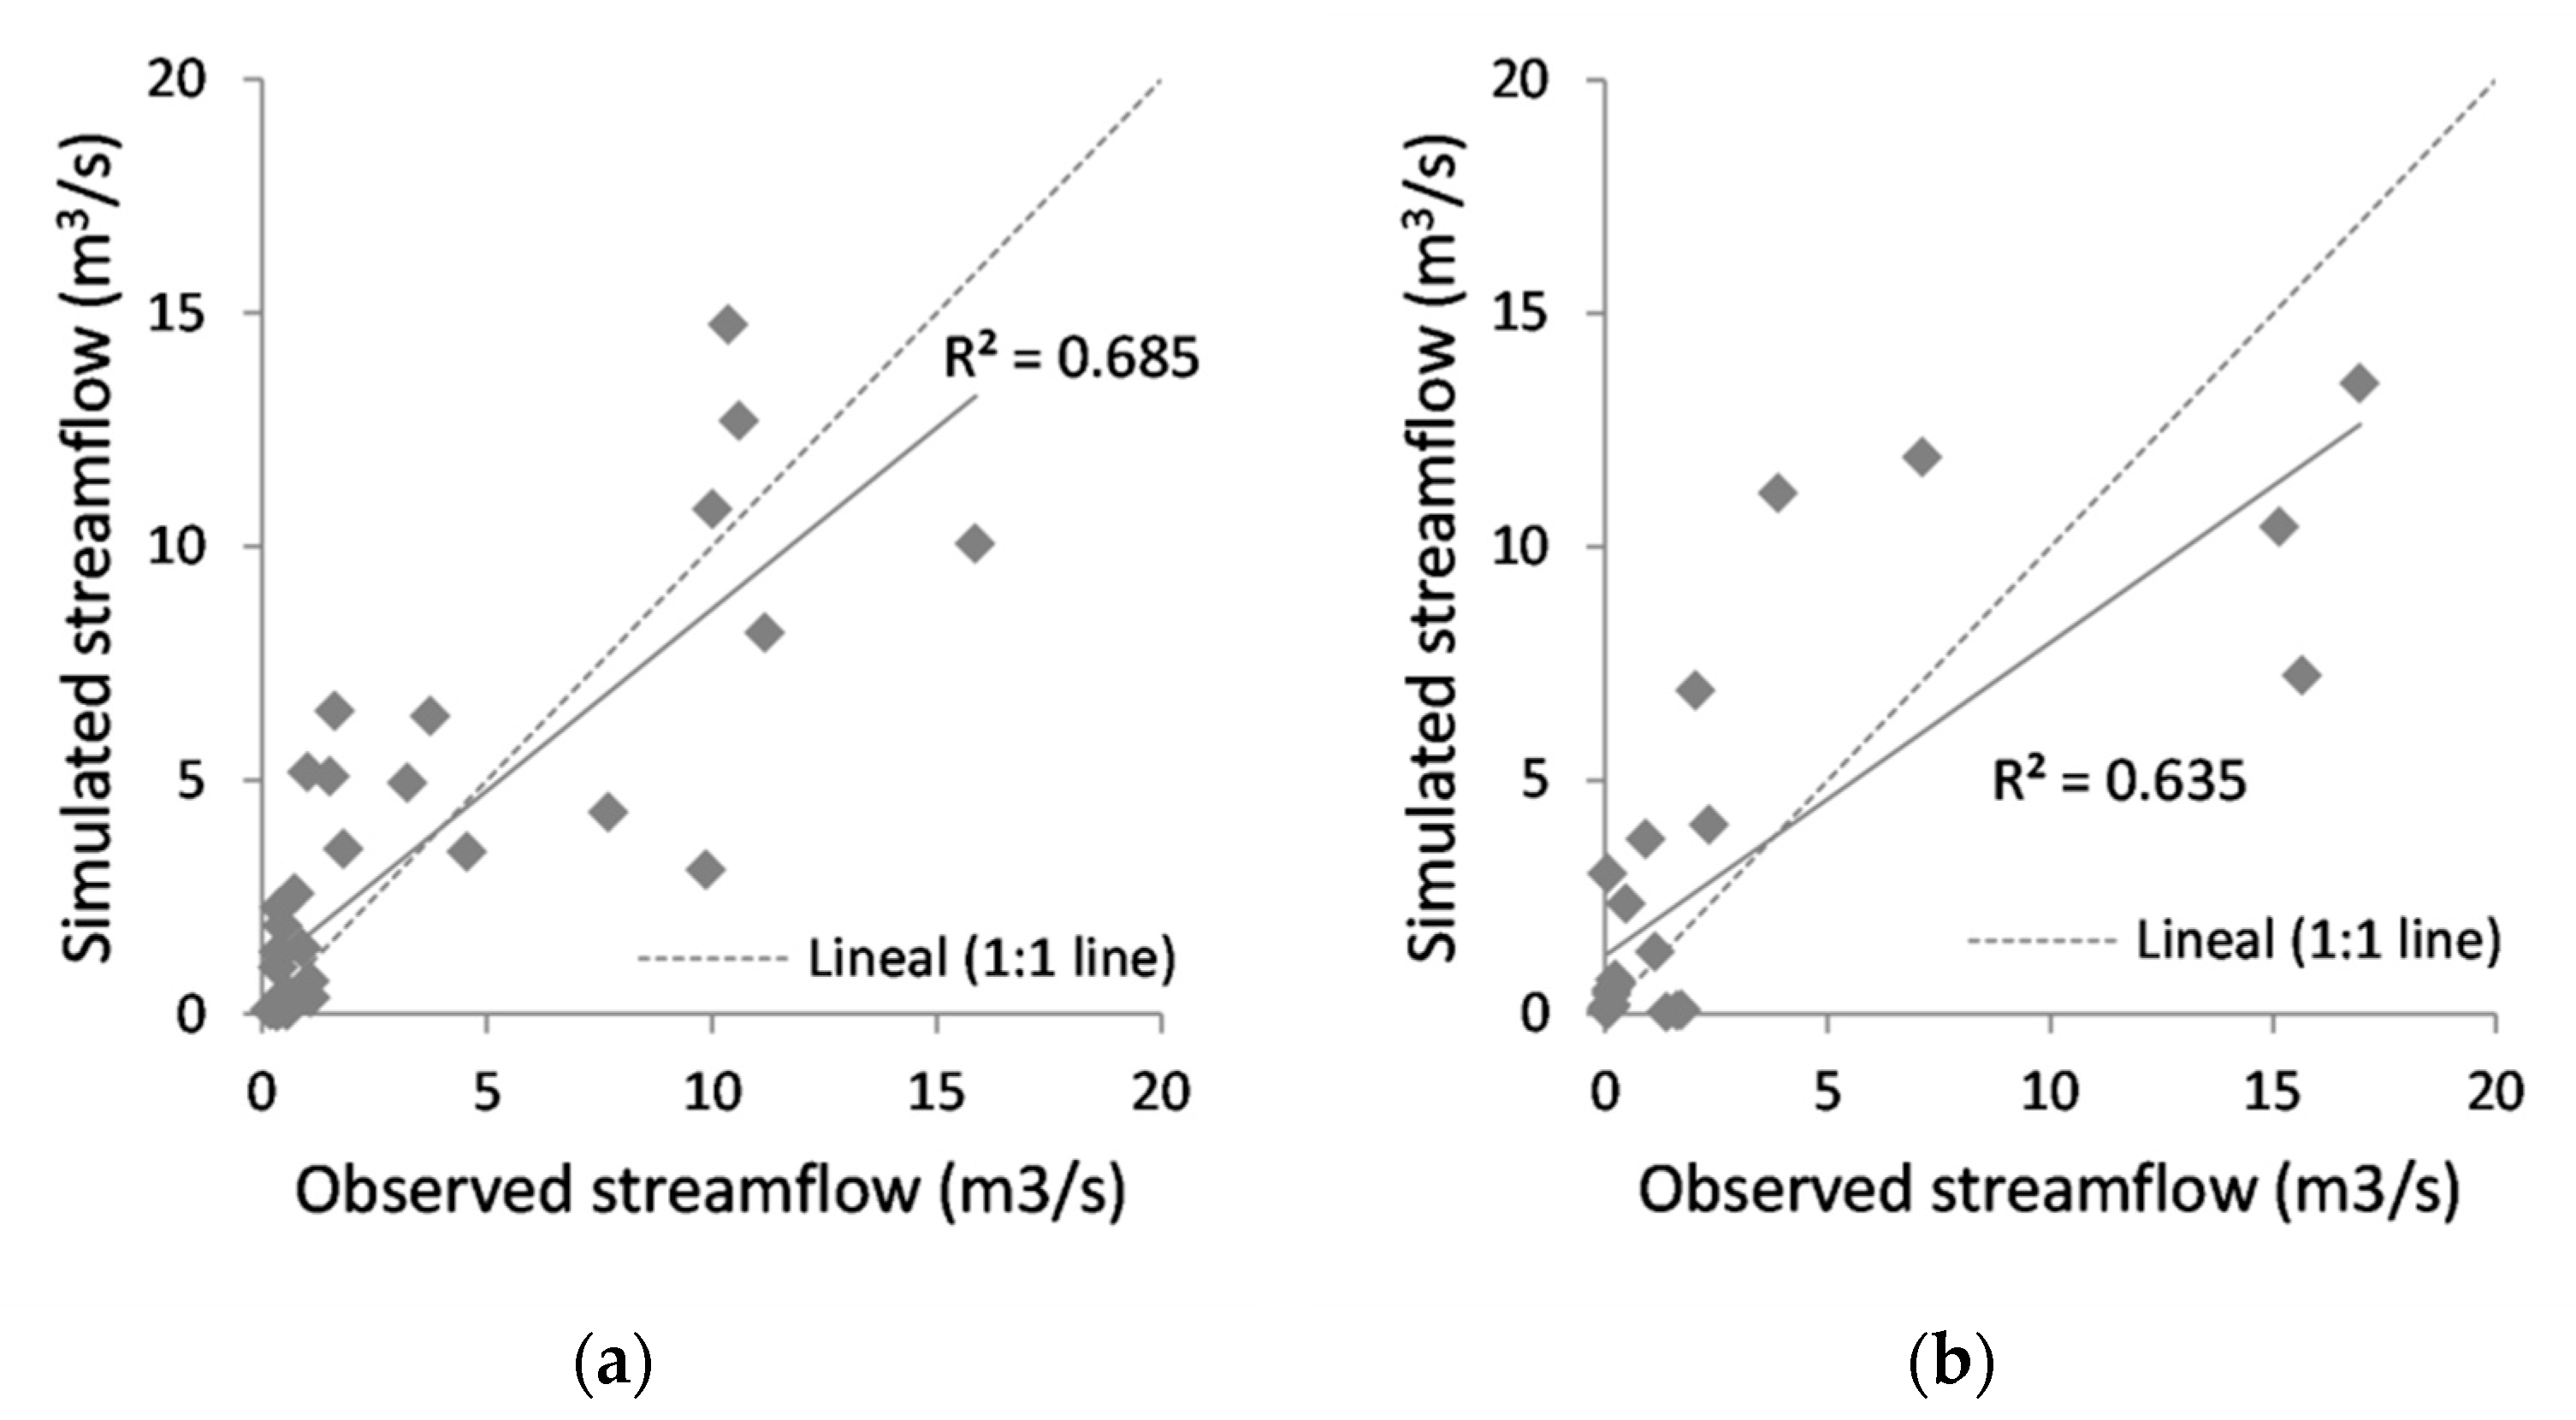
3.1. Performance of the SWAT Model
3.2. Selection of Climate Change Models
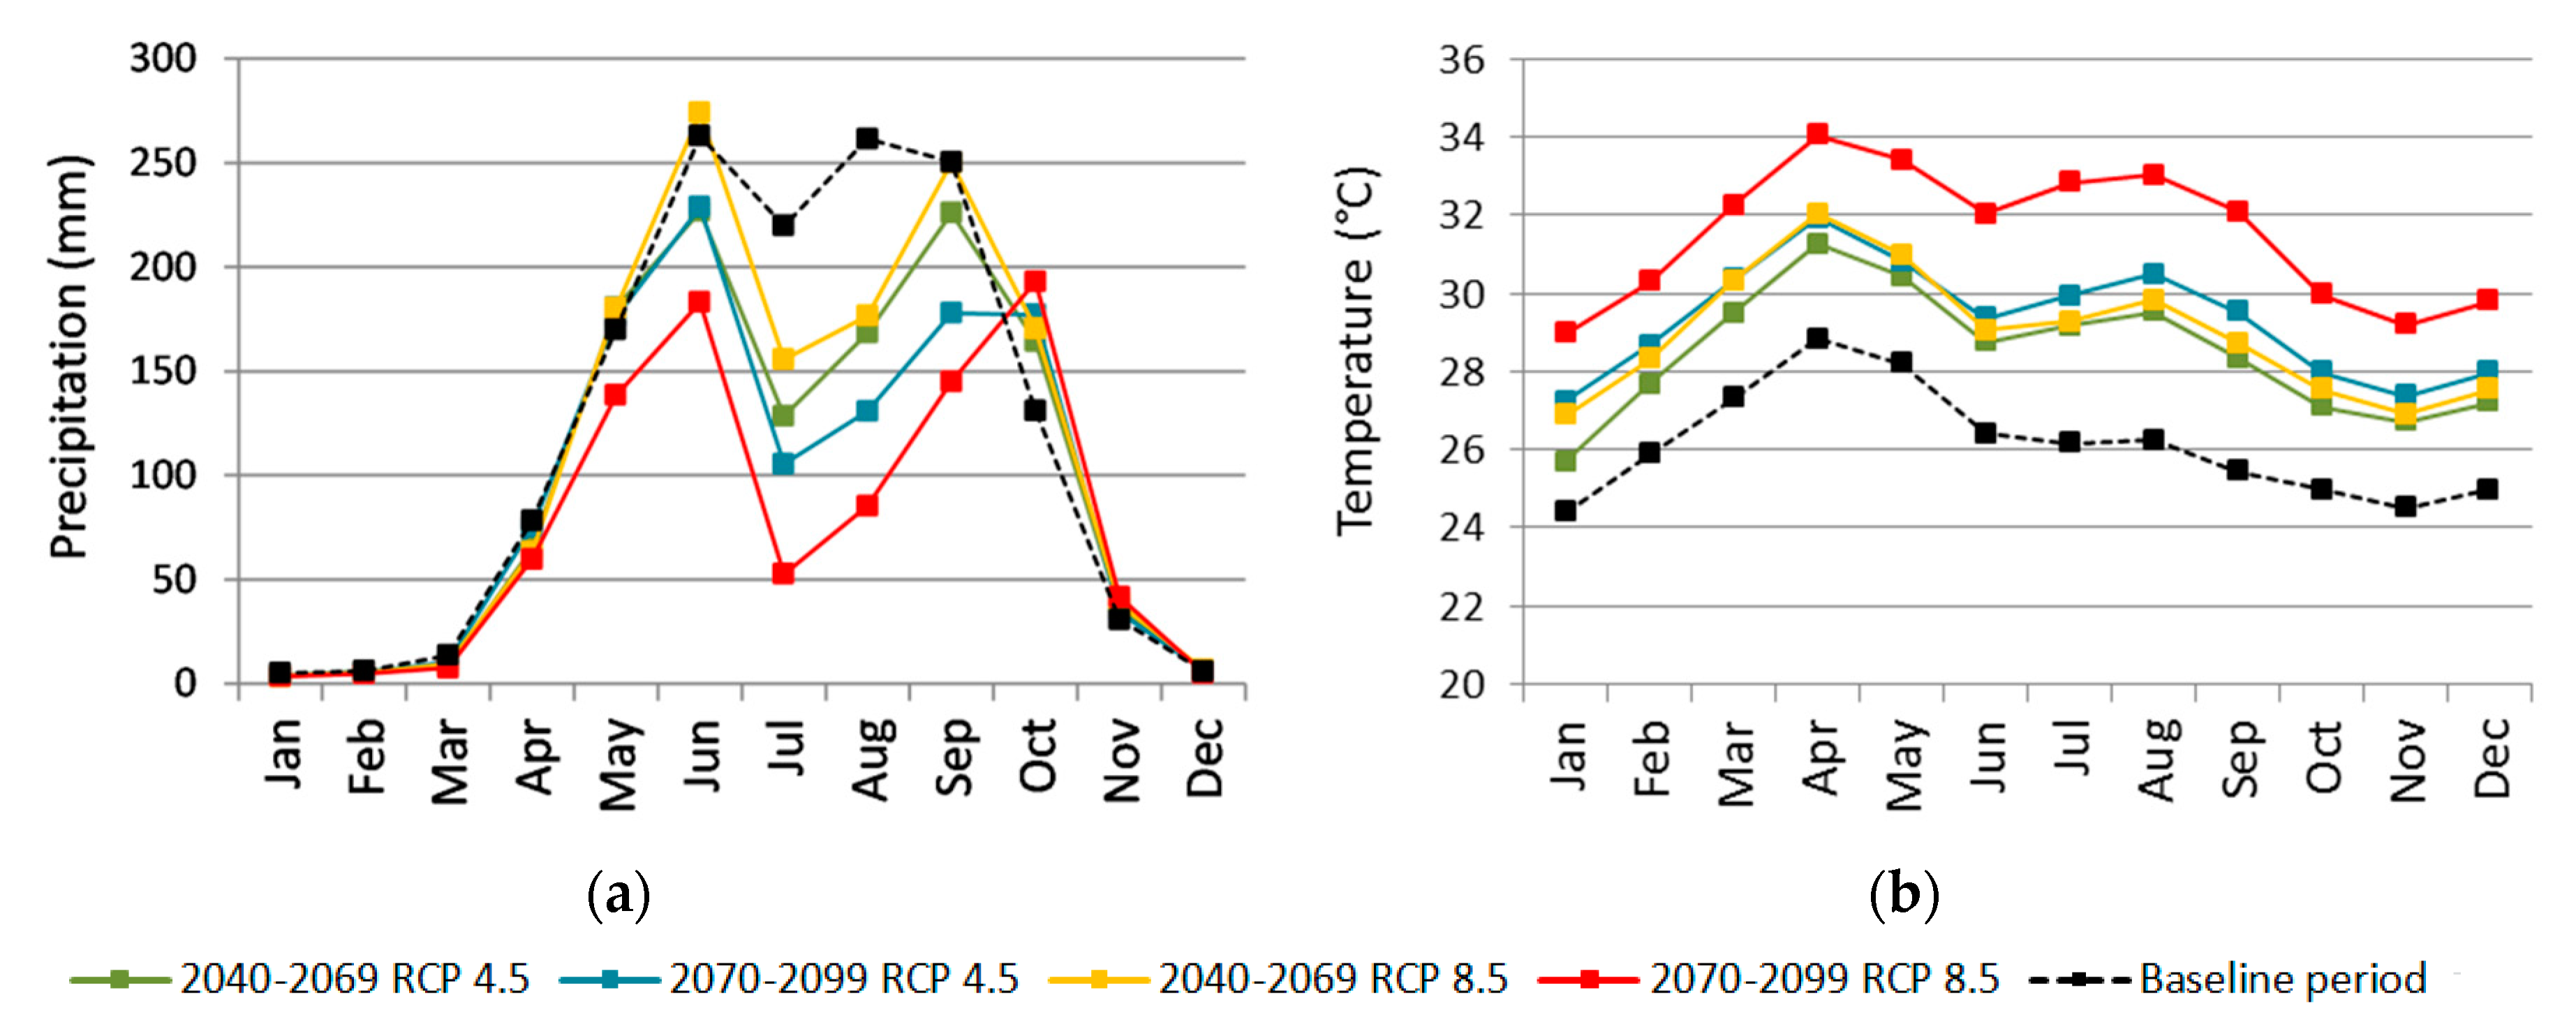
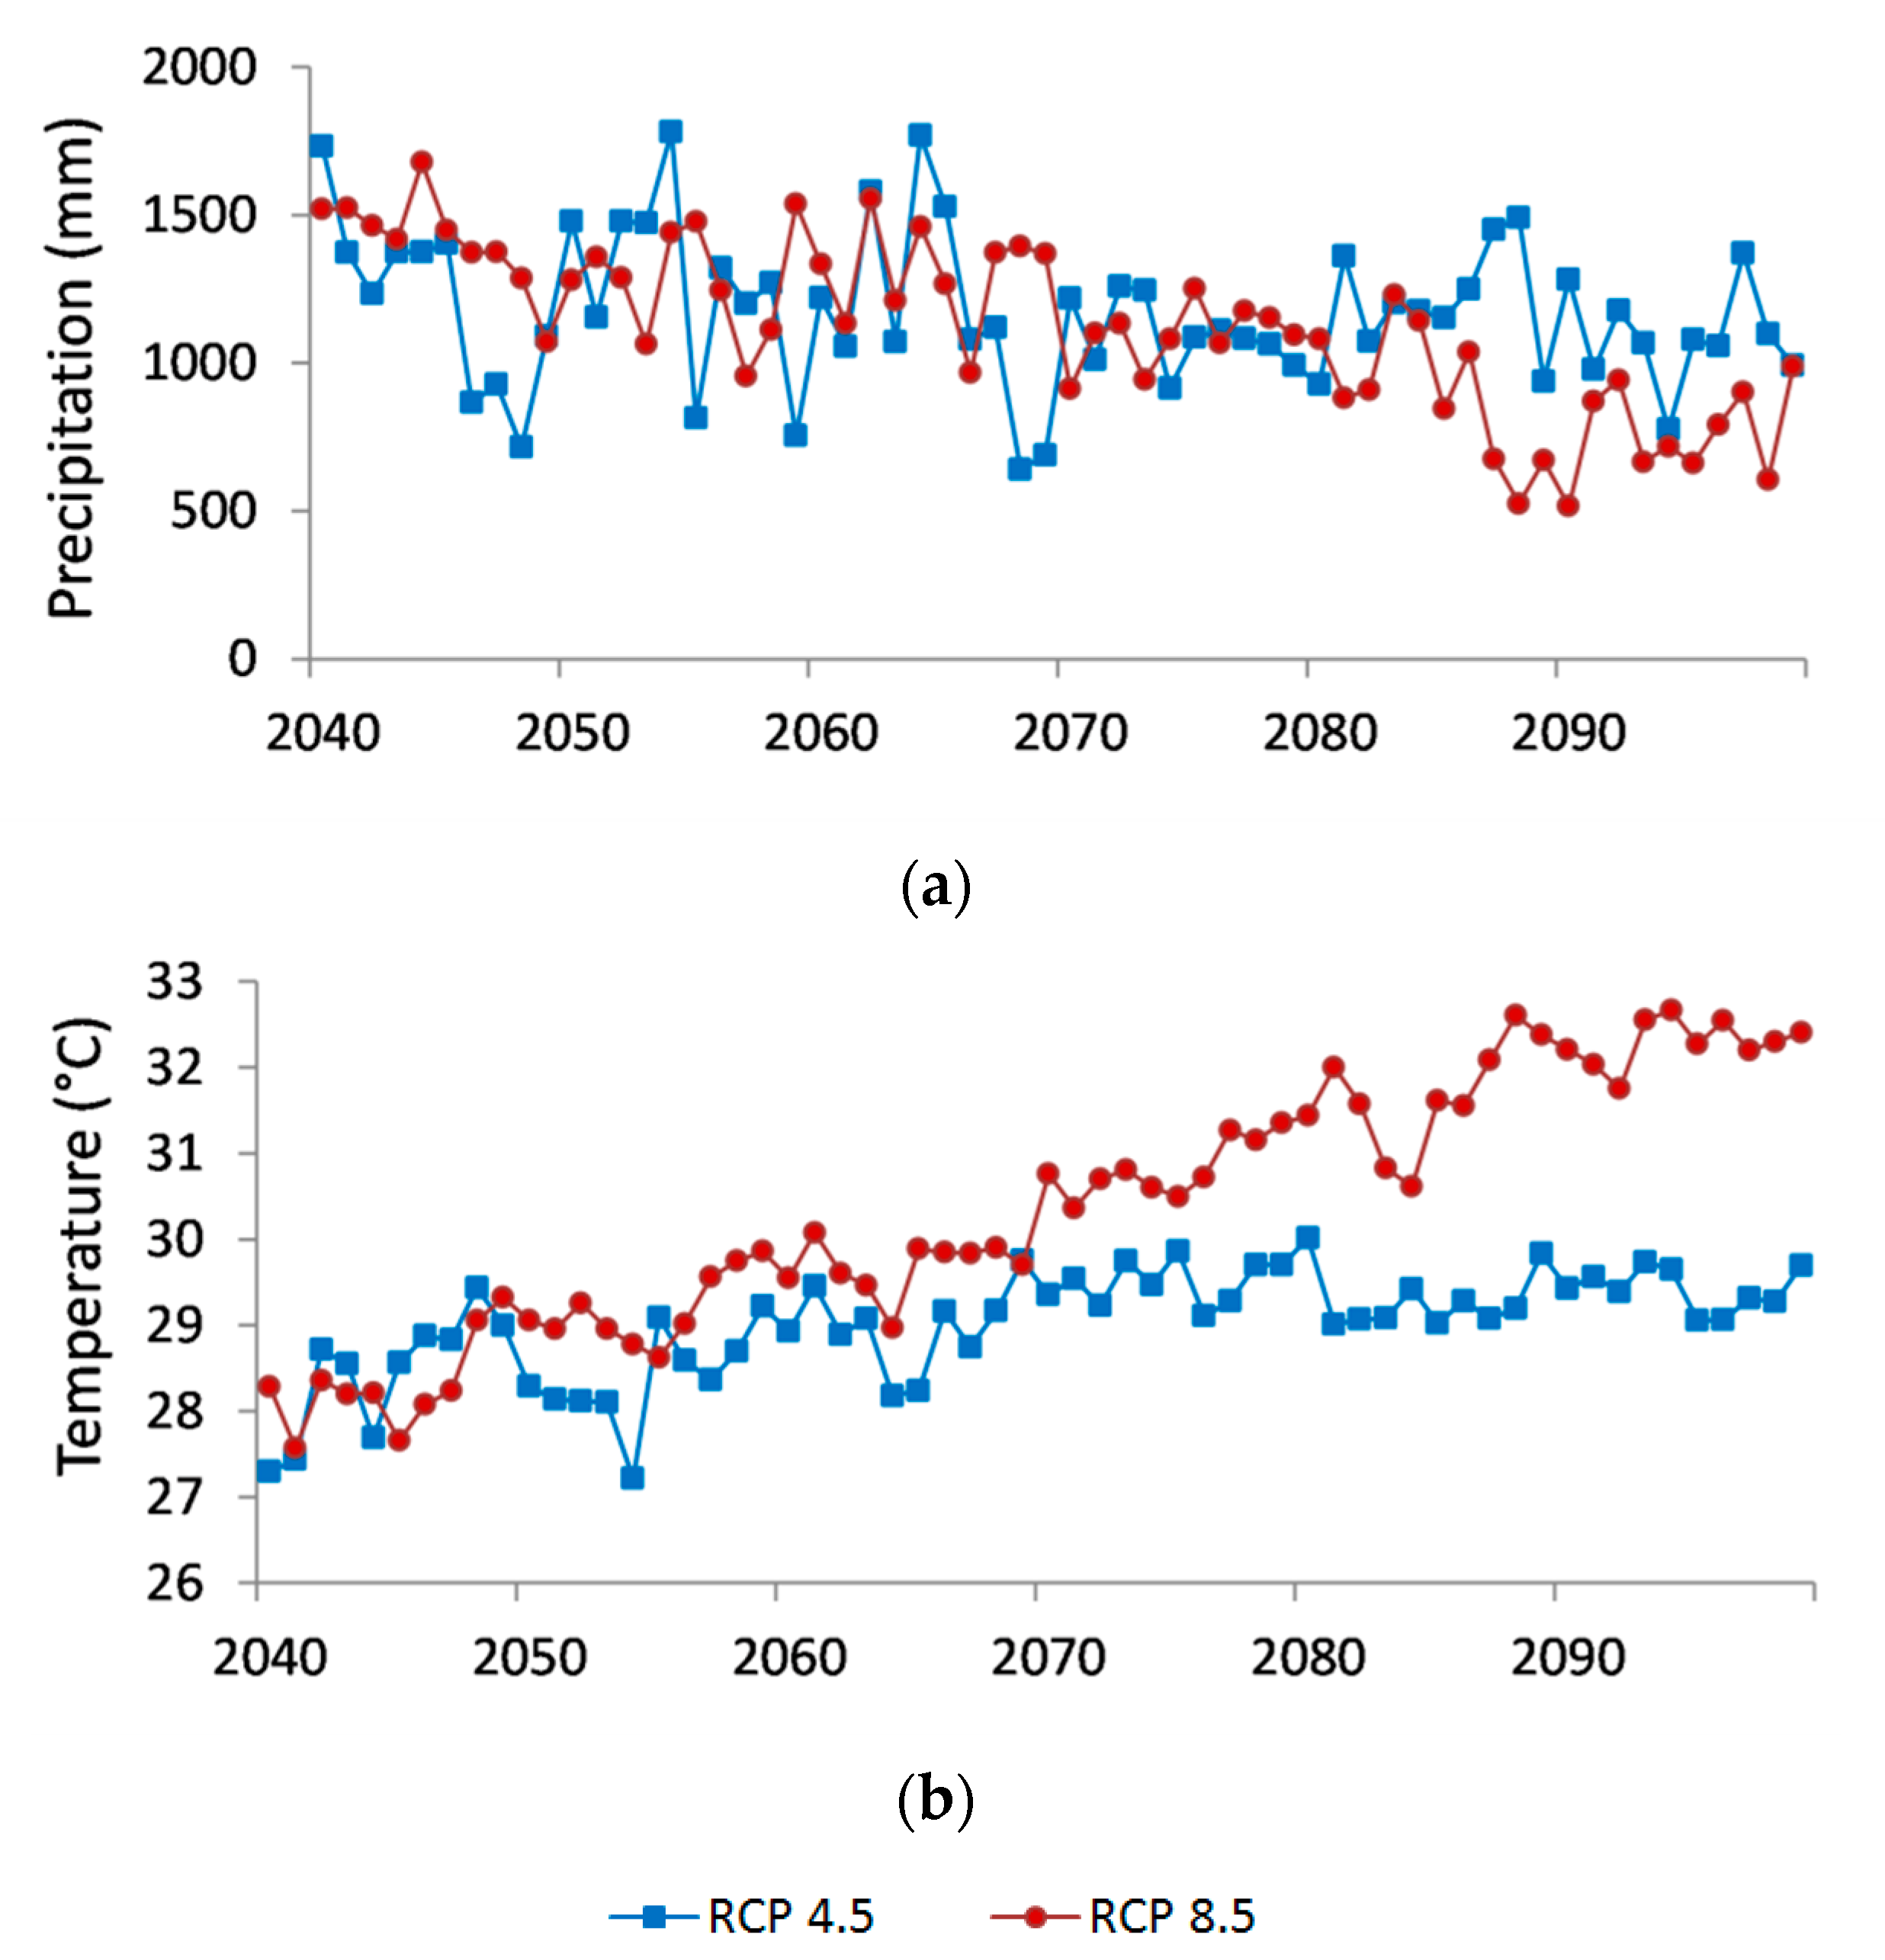
3.3. Changes in Climate Variables under RCP Scenarios
Trends in the Climatic Variables
3.4. Changes in Water Balance under RCP Scenarios
3.5. Future Projections of Drought
4. Conclusions
Supplementary Materials
Author Contributions
Funding
Acknowledgments
Conflicts of Interest
References
- Verma, S.; Bhattarai, R.; Bosch, N.S.; Cooke, R.C.; Kalita, P.K.; Markus, M. Climate change impacts on flow, sediment and nutrient export in a Great Lakes watershed using SWAT. Clean Soil Air Water 2015, 43, 1464–1474. [Google Scholar] [CrossRef]
- Zhang, Y.; You, Q.; Chen, C.; Ge, J. Impacts of climate change on streamflows under RCP scenarios: A case study in Xin River Basin, China. Atmos. Res. 2016, 178, 521–534. [Google Scholar] [CrossRef]
- Chattopadhyay, S.; Jha, M.K. Hydrological response due to projected climate variability in Haw River watershed, North Carolina, USA. Hydrol. Sci. J. 2016, 61, 495–506. [Google Scholar] [CrossRef]
- Bhatta, B.; Shrestha, S.; Shrestha, P.K.; Talchabhadel, R. Evaluation and application of a SWAT model to assess the climate change impact on the hydrology of the Himalayan River Basin. Catena 2019, 181, 104082. [Google Scholar] [CrossRef]
- Parry, M.L.; Canziani, O.F.; Palutikof, J.P.; Van der Linden, P.J.; Hanson, C.E. IPCC, 2007. Climate Change 2007: Impacts, Adaptation and Vulnerability. Contribution of Working Group II to the Fourth Assessment Report of the Intergovernmental Panel on Climate Change; Cambridge University Press: Cambridge, UK, 2007; p. 976. [Google Scholar]
- Fischer, G.; Shah, M.; Tubiello, F.N.; Van Velhuizen, H. Socio–economic and climate change impacts on agriculture: An integrated assessment, 1990–2080. Philos. T. Roy. Soc. B 2005, 360, 2067–2083. [Google Scholar] [CrossRef] [PubMed]
- Tubiello, F.N.; Rosenzweig, C. Developing climate change impact metrics for agriculture. Integrat. Assess. 2008, 8, 165–184. [Google Scholar]
- Campos, M.; Herrador, D.; Manuel, C.; McCall, M.K. Estrategias de adaptación al cambio climático en dos comunidades rurales de México y El Salvador. BAGE 2013, 61, 329–349. [Google Scholar]
- Maurer, E.P.; Adam, J.C.; Wood, A.W. Climate model based consensus on the hydrologic impacts of climate change to the Rio Lempa basin of Central America. Hydrol. Earth Syst. Sci. 2009, 13, 183–194. [Google Scholar] [CrossRef]
- Imbach, P.; Molina, L.; Locatelli, B.; Roupsard, O.; Mahé, G.; Neilson, R.; Corrales, L.; Scholze, M.; Ciais, P. Modeling potential equilibrium states of vegetation and terrestrial water cycle of mesoamerica under climate change scenarios. J. Hydrometeorol. 2012, 13, 665–680. [Google Scholar] [CrossRef]
- Aguilar, M.Y.; Pacheco, T.R.; Tobar, J.M.; Quiñónez, J.C. Vulnerability and adaptation to climate change of rural inhabitants in the central coastal plain of El Salvador. Clim. Res. 2009, 40, 187–198. [Google Scholar] [CrossRef][Green Version]
- Parajuli, P.B. Assessing sensitivity of hydrologic responses to climate change from forested watershed in Mississippi. Hydrol. Process. 2010, 24, 3785–3797. [Google Scholar] [CrossRef]
- Zhang, X.; Xu, Y.; Hao, F.; Li, C.; Wang, X. Hydrological components variability under the impact of climate change in a semi–arid river basin. Water 2019, 11, 1122. [Google Scholar] [CrossRef]
- Ji, L.; Duan, K. What is the main driving force of hydrological cycle variations in the semiarid and semi–humid Weihe River Basin, China? Sci. Total Environ. 2019, 684, 254–264. [Google Scholar] [CrossRef] [PubMed]
- Senent–Aparicio, J.; Pérez–Sánchez, J.; Carrillo–García, J.; Soto, J. Using SWAT and fuzzy TOPSIS to assess the impact of climate change in the headwaters of the segura river Basin (SE Spain). Water 2017, 9, 149. [Google Scholar] [CrossRef]
- MARN. Plan Nacional de Gestión Integrada del Recurso Hídrico de El Salvador, con Énfasis en Zonas Prioritarias, 1st ed.; Ministerio de Medio Ambiente y Recursos Naturales: San Salvador, El Salvador, 2017. Available online: http://www.marn.gob.sv/plan-nacional-de-gestion-integrada-del-recurso-hidrico/ (accessed on 1 May 2019).
- Wada, K. The distinctive properties of Andosols. In Advances in Soil Science; Springer: New York, NY, USA, 1985; pp. 173–229. [Google Scholar] [CrossRef]
- Levard, C.; Basile–Doelsch, I. Geology and mineralogy of imogolite–type materials. In Nanosized Tubular Clay Minerals; Elsevier: Amsterdam, The Netherlands, 2016; pp. 49–65. [Google Scholar] [CrossRef]
- ASTER Global Digital Elevation Map. Available online: https://asterweb.jpl.nasa.gov/gdem.asp (accessed on 20 May 2019).
- Fischer, G.; Nachtergaele, F.; Prieler, S.; Velthuizenvan, H.; Verelst, L.; Wiberg, D. Global Agro–Ecological Zones Assessment for Agriculture (GAEZ 2008); IIASA: Laxenburg, Austria; FAO: Rome, Italy, 2008. [Google Scholar]
- Saha, S.; Moorthi, S.; Pan, H.L.; Wu, X.; Wang, J.; Nadiga, S.; Tripp, P.; Kistler, R.; Woollen, J.; Behringer, D.; et al. The NCEP climate forecast system reanalysis. B. Am. Meteorol. Soc. 2010, 91, 1015–1057. [Google Scholar] [CrossRef]
- Tarawneh, E.; Bridge, J.; Macdonald, N. A pre–calibration approach to select optimum inputs for hydrological models in data–scarce regions. Hydrol. Earth Syst. Sci. 2016, 70, 4391–4407. [Google Scholar] [CrossRef]
- Vaghefi, S.A.; Abbaspour, N.; Kamali, B.; Abbaspour, K.C. A toolkit for climate change analysis and pattern recognition for extreme weather conditions—Case study: California–Baja California peninsula. Environ. Model. Softw. 2017, 96, 181–198. [Google Scholar] [CrossRef]
- Hempel, S.; Frieler, K.; Warszawski, L.; Schewe, J.; Piontek, F. A trend-preserving bias correction—The isi-mip approach. Earth Syst. Dynam. 2013, 4, 219–236. [Google Scholar] [CrossRef]
- Arnold, J.G.; Srinivasan, R.; Muttiah, R.S.; Williams, J.R. Large area hydrologic modeling and assessment Part I: Model development. J. Am. Water Resour. Assoc. 1998, 34, 73–89. [Google Scholar] [CrossRef]
- Arnold, J.G.; Kiniry, J.R.; Srinivasan, R.; Williams, J.R.; Haney, E.B.; Neitsch, S.L. Soil & Water Assessment Tool—Input/Output Documentation; Version 2012; Texas Water Resources Institute: College Station, TX, USA, 2012; p. 650. Available online: https://swat.tamu.edu/docs/ (accessed on 20 May 2019).
- Singh, V.; Bankar, N.; Salunkhe, S.S.; Bera, A.K.; Sharma, J.R. Hydrological stream flow modelling on Tungabhadra catchment: Parameterization and uncertainty analysis using SWAT CUP. Curr. Sci. India 2013, 104, 1187–1199. [Google Scholar]
- Emami, F.; Koch, M. Modeling the impact of climate change on water availability in the Zarrine River Basin and inflow to the Boukan Dam, Iran. Climate 2019, 7, 51. [Google Scholar] [CrossRef]
- USDA, SCS. Hydrology. In National Engineering Handbook, Section 4; USDA Soil Conservation Service: Washington, DC, USA, 1972. [Google Scholar]
- Monteith, J.L. Evaporation and environment. Symp. Soc. Exp. Biol. 1965, 19, 205–234. [Google Scholar] [PubMed]
- Allen, R.G.; Pereira, L.S.; Raes, D.; Smith, M. Crop Evapotranspiration: Guidelines for Computing Crop Water Requirements; Food and Agriculture Organization of the United Nations: Rome, Italy, 1998. [Google Scholar]
- Abbaspour, K.C.; Vejdani, M.; Haghighat, S. SWAT–CUP calibration and uncertainty programs for SWAT. In Proceedings of the Modsim 2007: International Congress on Modelling and Simulation, Christchurch, New Zealand, 3–8 December 2007; pp. 1603–1609. [Google Scholar]
- Alemayehu, T.; van Griensven, A.; Bauwens, W. Evaluating CFSR and WATCH data as input to swat for the estimation of the potential evapotranspiration in a data–scarce Eastern–African catchment. J. Hydrol. Eng. 2016, 21, 16. [Google Scholar] [CrossRef]
- Poméon, T.; Diekkrüger, B.; Springer, A.; Kusche, J.; Eicker, A. Multi–objective validation of SWAT for sparsely–gauged West African River basins—A remote sensing approach. Water 2018, 10, 451. [Google Scholar] [CrossRef]
- Arnold, J.G.; Moriasi, D.; Gassman, P.W.; Abbaspour, K.C.; White, M.J.; Srinivasan, R.; Santhi, C.; Harmel, R.D.; van Griensven, A.; Van Liew, M.W.; et al. SWAT: Model use, calibration, and validation. Trans. ASABE 2012, 55, 1491–1508. [Google Scholar] [CrossRef]
- Moriasi, D.N.; Arnold, J.G.; van Liew, M.W.; Bingner, R.L.; Harmel, R.D.; Veith, T.L. Model evaluation guidelines for systematic quantification of accuracy in watershed simulations. Trans. ASABE 2007, 50, 885–900. [Google Scholar] [CrossRef]
- Gupta, H.V.; Kling, H.; Yilmaz, K.K.; Martinez, G.F. Decomposition of the mean squared error and NSE performance criteria: Implications for improving hydrological modelling. J. Hydrol. 2009, 377, 80–91. [Google Scholar] [CrossRef]
- Chen, J.; Brissette, F.P.; Chaumont, D.; Braun, M. Performance and uncertainty evaluation of empirical downscaling methods in quantifying the climate change impacts on hydrology over two North American river basins. J. Hydrol. 2013, 479, 200–214. [Google Scholar] [CrossRef]
- Vaghefi, S.A.; Iravani, M.; Sauchyn, D.; Andreichuk, Y.; Goss, G.; Faramarzi, M. Regionalization and parameterization of a hydrologic model significantly affect the cascade of uncertainty in climate–impact projections. Clim. Dyn. 2019, 53, 2861–2886. [Google Scholar] [CrossRef]
- Sofaer, H.R.; Barsugli, J.J.; Jarnevich, C.S.; Abatzoglou, J.T.; Talbert, M.K.; Miller, B.W.; Morisette, J.T. Designing ecological climate change impact assessments to reflect key climatic drivers. Glob. Change Biol. 2017, 23, 2537–2553. [Google Scholar] [CrossRef] [PubMed]
- Pulido–Velazquez, D.; García–Aróstegui, J.L.; Molina, J.L.; Pulido–Velazquez, M. Assessment of future groundwater recharge in semi–arid regions under climate change scenarios (Serral–Salinas aquifer, SE Spain). Could increased rainfall variability increase the recharge rate? Hydrol. Process. 2015, 29, 828–844. [Google Scholar] [CrossRef]
- Salmi, T.; Maatta, A.; Anttila, P.; Airola, T.R.; Amnell, T. Detecting Trends of Annual Values of Atmospheric Pollutants by the Mann–Kendal Test and Sen’s Slope Estimates—The Excel Template Application MAKESENS; User Manual; Air Quality, Finish Meteorological Institute: Helsinki, Finland, 2002; p. 35. [Google Scholar]
- Senent-Aparicio, J.; Liu, S.; Pérez-Sánchez, J.; López-Ballesteros, A.; Jimeno-Sáez, P. Assessing impacts of climate variability and reforestation activities on water resources in the headwaters of the Segura River Basin (SE Spain). Sustainability 2018, 10, 3277. [Google Scholar] [CrossRef]
- Partal, T.; Kahya, E. Trend analysis in Turkish precipitation data. Hydrol. Process. 2006, 20, 2011–2026. [Google Scholar] [CrossRef]
- Sen, P.K. Estimates of the regression coefficient based on Kendall’s tau. J. Am. Stat. Assoc. 1968, 63, 1379–1389. [Google Scholar] [CrossRef]
- McKee, T.B.; Doesken, N.J.; Kleist, J. The relationship of drought frequency and duration to time scales. In Proceedings of the 8th Conference on Applied Climatology, Anaheim, CA, USA, 17–22 January 1993; pp. 179–184. [Google Scholar]
- Shukla, S.; Wood, A.W. Use of a standardized runoff index for characterizing hydrologic drought. Geophys. Res. Lett. 2008, 35, L02405. [Google Scholar] [CrossRef]
- NDMC. SPI Generator Software. University of Nebraska–Lincoln, USA. 2019. Available online: https://drought.unl.edu/droughtmonitoring/SPI/SPIProgram.aspx (accessed on 23 July 2019).
- WMO. Standardized Precipitation Index User Guide; WMO–No. 1090; WMO: Geveva, Switzerland, 2012; Available online: https://library.wmo.int/doc_num.php?explnum_id=7768 (accessed on 23 July 2019).
- Jimeno–Sáez, P.; Senent–Aparicio, J.; Pérez–Sánchez, J.; Pulido–Velazquez, D. A Comparison of SWAT and ANN models for daily runoff simulation in different climatic zones of Peninsular Spain. Water 2018, 10, 192. [Google Scholar] [CrossRef]
- Spellman, P.; Webster, V.; Watkins, D. Bias correcting instantaneous peak flows generated using a continuous, semi–distributed hydrologic model. J. Flood Risk Manag. 2018, 11, e12342. [Google Scholar] [CrossRef]
- Čerkasova, N.; Umgiesser, G.; Ertürk, A. Assessing climate change impacts on streamflow, sediment and nutrient loadings of the Minija River (Lithuania): A hillslope watershed discretization application with high–resolution spatial inputs. Water 2019, 11, 676. [Google Scholar] [CrossRef]
- McSweeney, C.F.; Jones, R.G.; Lee, R.W.; Rowell, D.P. Selecting CMIP5 GCMs for downscaling over multiple regions. Clim. Dyn. 2015, 44, 3237–3260. [Google Scholar] [CrossRef]
- Ahmed, K.; Sachindra, D.A.; Shahid, S.; Demirel, M.C.; Chung, E.S. Selection of multi-model ensemble of GCMs for the simulation of precipitation based on spatial assessment metrics. Hydrol. Earth Syst. Sci. 2019. Discuss, in review. [Google Scholar] [CrossRef]
- Knutti, R.; Furrer, R.; Tebaldi, C.; Cermak, J.; Meehl, G.A. Challenges in combining projections from multiple climate models. J. Clim. 2010, 23, 2739–2758. [Google Scholar] [CrossRef]
- Overland, J.E.; Wang, M.; Bond, N.A.; Walsh, J.E.; Kattsov, V.M.; Chapman, W.L. Considerations in the selection of global climate models for regional climate projections: The Arctic as a case study. J. Clim. 2011, 24, 1583–1597. [Google Scholar] [CrossRef]
- Magaña, V.; Amador, J.A.; Medina, S. The midsummer drought over Mexico and Central America. J. Clim. 1999, 12, 1577–1588. [Google Scholar] [CrossRef]
- MARN. Modelos de Simulación y Escenarios Climáticos para El Salvador (Nacional, Regional y Local); Ministerio de Medio Ambiente y Recursos Naturales, Centro del Agua del Trópico Húmedo para América Latina y el Caribe: San Salvador, El Salvador, 2017. Available online: http://rcc.marn.gob.sv/xmlui/handle/123456789/347 (accessed on 15 August 2019).
- CEPAL. La Economía del Cambio Climático en Centroamérica—Síntesis 2010; Comisión Económica para América Latina y El Caribe (CEPAL): Naciones Unidas, México, 2010. [Google Scholar]
- Conde–Álvarez, C.; Saldaña–Zorrilla, O. Cambio climático en América Latina y el Caribe: Impactos, vulnerabilidad y adaptación. Revista Ambiente y Desarrollo 2007, 23, 23–30. [Google Scholar]
- Esquivel, M.; Grünwaldt, A.; Paredes, J.R.; Rodríguez–Flores, E. Vulnerabilidad al Cambio Climático de los Sistemas de Producción Hidroeléctrica en Centroamérica y sus Opciones de Adaptación, Resumen Ejecutivo; Sector de Cambio Climático y Sector de Energía, Banco Interamericano de Desarrollo (BID): Madrid, Spain, 2016; Available online: http://expertosenred.olade.org/wp-content/uploads/sites/8/2017/01/Vulnerabilidad-al-cambio-climatico-de-los-sistemas-de-produccion-hidroelectrica-en-Centroamerica-y-sus-opciones-de-adaptacion-1.pdf (accessed on 23 August 2019).
- IPCC–AR5. Climate change 2013, The Physical Science Basis, Working Group I Contribution to the Fifth Assessment Report of the Intergovernmental Panel on Climate Change; Cambridge University Press: Cambridge, UK, 2014; ISBN 978-1-107-66182-0. [Google Scholar]


| Land Use Type | Area (km2) | % Coverage |
|---|---|---|
| Commercial | 0.66 | 0.42 |
| Sugarcane | 0.68 | 0.43 |
| Range–Grasses | 0.97 | 0.62 |
| Residential–High Density | 1.70 | 1.09 |
| Forest–Deciduous | 2.00 | 1.28 |
| Forest–Mixed | 2.35 | 1.50 |
| Southwestern US (Arid) Range | 3.22 | 2.06 |
| Meadow Bromegrass | 3.22 | 2.06 |
| Forest–Evergreen | 3.84 | 2.46 |
| Residential–Medium Density | 4.27 | 2.74 |
| Coffee | 5.75 | 3.69 |
| Shrubland | 11.51 | 7.38 |
| Pasture | 12.47 | 7.99 |
| Range–Grasses | 31.44 | 20.15 |
| Dryland cropland and pasture | 34.44 | 22.07 |
| Agricultural Land–Generic | 37.52 | 24.05 |
| Performance Metric | Equation | Range |
|---|---|---|
| Nash–Sutcliffe efficiency coefficient (NSE) | [−∞, 1] | |
| Coefficient of determination (R2) | [0, 1] | |
| Percent bias (PBIAS) | [−∞, ∞] | |
| Root mean squared error (RMSE) | [0, ∞] | |
| RMSE–observations standard deviation ratio (RSR) | [0, ∞] |
| Parameter 1 | Description | Final Range Used in Calibration | Fitted Value | Final Value |
|---|---|---|---|---|
| r_CN2.mgt | SCS runoff curve number | −0.2 to 0.2 | −0.09 | [63.40–75.17] 2 |
| v_ALPHA_BF.gw | Baseflow alpha factor (days−1) | 0 to 0.65 | 0.09 | 0.09 |
| a_GW_DELAY.gw | Groundwater delay time (days) | −10 to 60 | −2.90 | 28.07 |
| a_GWQMN.gw | Threshold depth of water in the shallow aquifer for return flow to occur (mm) | 200 to 1500 | 1407.70 | 2407.70 |
| v_GW_REVAP.gw | Groundwater revap coefficient | 0.02 to 0.15 | 0.13 | 0.13 |
| a_RCHRG_DP.gw | Deep aquifer percolation fraction | −0.02 to 0.03 | 0.02 | 0.07 |
| a_REVAPMN.gw | Threshold depth of water in the shallow aquifer for revap or percolation to the deep aquifer to occur (mm) | −150 to 150 | −85.50 | 664.5 |
| v_CANMX.hru | Maximum canopy storage (mm) | 1 to 10 | 4.47 | 4.47 |
| v_EPCO.bsn | Plant uptake compensation factor | 0.5 to 1 | 0.87 | 0.87 |
| v_ESCO.bsn | Soil evaporation compensation factor | 0.3 to 0.9 | 0.79 | 0.79 |
| r_SOL_AWC.sol | Available water capacity of the soil layer (mm H2O/mm soil) | −0.02 to 0.02 | −0.01 | [0.06–0.10] 3 |
| Performance Metric | Calibration | Validation |
|---|---|---|
| NSE | 0.67 | 0.63 |
| R2 | 0.69 | 0.64 |
| PBIAS (%) | −9.04 | −8.80 |
| RMSE (m3/s) | 2.35 | 3.12 |
| RSR | 0.58 | 0.61 |
| RCMs | Monthly Series | |||||
|---|---|---|---|---|---|---|
| Precipitation | Temperature | Id | ||||
| Id (Δx) | Id (Δσ) | Id (Δx) | Id (Δσ) | |||
| 1 | GFDL–ESM2M | 2.14 | 11.18 | 1.22 | 3.76 | 18.30 |
| 2 | HadGEM2–ES | 1.78 | 5.95 | 1.63 | 2.74 | 12.10 |
| 3 | IPSL–CM5A–LR | 1.51 | 10.93 | 1.23 | 4.15 | 17.82 |
| 4 | MIROC | 2.65 | 9.30 | 1.21 | 9.17 | 22.33 |
| 5 | NoerESM1–M | 1.52 | 8.13 | 1.23 | 5.45 | 16.33 |
| Model | Scenario | Time Period | Precipitation (mm) | Temperature (°C) | ||
|---|---|---|---|---|---|---|
| Value | Change with Respect to Baseline | Value | Change with Respect to Baseline | |||
| Baseline | 1975–2004 | 1435.60 | – | 26.12 | – | |
| HadGEM2–ES | RCP 4.5 | 2040–2069 | 1219.12 | −216.48 (−15%) | 28.45 | +2.33 (+9%) |
| 2070–2099 | 1129.62 | −305.98 (−21%) | 29.30 | +3.19 (+12%) | ||
| RCP 8.5 | 2040–2069 | 1332.64 | −102.96 (−7%) | 28.95 | +2.84 (+11%) | |
| 2070–2099 | 919.07 | −516.53 (−36%) | 31.49 | +5.38 (+21%) | ||
| Month | Precipitation RCP 4.5 | Temperature RCP 4.5 | Precipitation RCP 8.5 | Temperature RCP 8.5 | ||||||||
|---|---|---|---|---|---|---|---|---|---|---|---|---|
| Test Z | Sig. | Qi | Test Z | Sig. | Qi | Test Z | Sig. | Qi | Test Z | Sig. | Qi | |
| January | −0.49 | −0.01 | 3.78 | *** | 0.03 | 0.16 | 0.00 | 7.79 | *** | 0.07 | ||
| February | 0.10 | 0.00 | 4.98 | *** | 0.03 | −0.56 | −0.01 | 7.57 | *** | 0.07 | ||
| March | −0.17 | −0.01 | 4.02 | *** | 0.02 | −0.84 | −0.03 | 8.12 | *** | 0.07 | ||
| April | 0.91 | 0.27 | 3.31 | *** | 0.02 | −0.43 | −0.10 | 7.53 | *** | 0.07 | ||
| May | −0.07 | −0.05 | 1.10 | 0.01 | −2.38 | * | −1.19 | 6.96 | *** | 0.07 | ||
| June | −0.12 | −0.09 | 2.98 | ** | 0.02 | −3.50 | *** | −2.46 | 7.67 | *** | 0.09 | |
| July | −1.91 | + | −0.90 | 2.56 | * | 0.03 | −5.83 | *** | −2.53 | 8.41 | *** | 0.11 |
| August | −1.55 | −0.94 | 3.91 | *** | 0.03 | −5.35 | *** | −2.92 | 9.29 | *** | 0.10 | |
| September | −2.53 | * | −1.34 | 4.46 | *** | 0.03 | −5.02 | *** | −3.66 | 9.00 | *** | 0.11 |
| October | 0.94 | 0.42 | 4.11 | *** | 0.03 | 1.24 | 0.75 | 8.09 | *** | 0.08 | ||
| November | −0.47 | −0.04 | 3.17 | ** | 0.02 | 1.17 | 0.18 | 7.83 | *** | 0.07 | ||
| December | 1.00 | 0.02 | 4.45 | *** | 0.02 | −0.32 | −0.01 | 7.69 | *** | 0.07 | ||
| Annual | −1.79 | + | −3.70 | 5.24 | *** | 0.02 | −6.8 | *** | −13.17 | 9.34 | *** | 0.08 |
| Scenario | Time Period | P (mm) | ET (mm) | ET/P | WYLD (mm) | DA_RCHG (mm) |
|---|---|---|---|---|---|---|
| Baseline | 1975–2004 | 1435.6 | 523.9 | 0.36 | 720.72 | 27.95 |
| RCP 4.5 | 2040–2069 | 1219.12 (−15%) | 608.70 (+16%) | 0.50 | 450.33 (−37%) | 15.85 (−43%) |
| 2070–2099 | 1129.62 (−21%) | 613.80 (+17%) | 0.54 | 359.47 (−50%) | 12.55 (−55%) | |
| RCP 8.5 | 2040–2069 | 1332.64 (−7%) | 626.40 (+19%) | 0.47 | 522.18 (−27%) | 18.66 (−33%) |
| 2070–2099 | 919.07 (−36%) | 547.00 (+4%) | 0.60 | 268.87 (−63%) | 8.19 (−71%) |
| Characteristics of drought | Baseline (1975–2004) | RCP 4.5 | RCP 8.5 | |||||||
|---|---|---|---|---|---|---|---|---|---|---|
| 2040–2069 | 2070–2099 | 2040–2069 | 2070–2099 | |||||||
| SPI | SRI | SPI | SRI | SPI | SRI | SPI | SRI | SPI | SRI | |
| Number of drought events | 9 | 5 | 4 | 4 | 10 | 6 | 7 | 7 | 3 | 3 |
| Longest duration of drought events (months) | 26 | 36 | 47 | 46 | 34 | 34 | 22 | 24 | 54 | 53 |
| Average duration of drought events (months) | 12 | 14 | 22 | 27 | 13 | 14 | 15 | 14 | 36 | 36 |
| Average drought intensity | 1.60 | 1.95 | 2.15 | 2.01 | 1.47 | 1.85 | 1.93 | 1.53 | 1.98 | 1.90 |
| Maximum drought intensity | 2.52 | 2.64 | 2.68 | 2.49 | 2.44 | 2.15 | 2.42 | 2.68 | 2.74 | 2.58 |
© 2019 by the authors. Licensee MDPI, Basel, Switzerland. This article is an open access article distributed under the terms and conditions of the Creative Commons Attribution (CC BY) license (http://creativecommons.org/licenses/by/4.0/).
Share and Cite
Blanco-Gómez, P.; Jimeno-Sáez, P.; Senent-Aparicio, J.; Pérez-Sánchez, J. Impact of Climate Change on Water Balance Components and Droughts in the Guajoyo River Basin (El Salvador). Water 2019, 11, 2360. https://doi.org/10.3390/w11112360
Blanco-Gómez P, Jimeno-Sáez P, Senent-Aparicio J, Pérez-Sánchez J. Impact of Climate Change on Water Balance Components and Droughts in the Guajoyo River Basin (El Salvador). Water. 2019; 11(11):2360. https://doi.org/10.3390/w11112360
Chicago/Turabian StyleBlanco-Gómez, Pablo, Patricia Jimeno-Sáez, Javier Senent-Aparicio, and Julio Pérez-Sánchez. 2019. "Impact of Climate Change on Water Balance Components and Droughts in the Guajoyo River Basin (El Salvador)" Water 11, no. 11: 2360. https://doi.org/10.3390/w11112360
APA StyleBlanco-Gómez, P., Jimeno-Sáez, P., Senent-Aparicio, J., & Pérez-Sánchez, J. (2019). Impact of Climate Change on Water Balance Components and Droughts in the Guajoyo River Basin (El Salvador). Water, 11(11), 2360. https://doi.org/10.3390/w11112360