Chromaticity Measurement Based on the Image Method and Its Application in Water Quality Detection


Abstract
:1. Introduction
2. Materials and Methods
2.1. Design of a Measurement System Structure
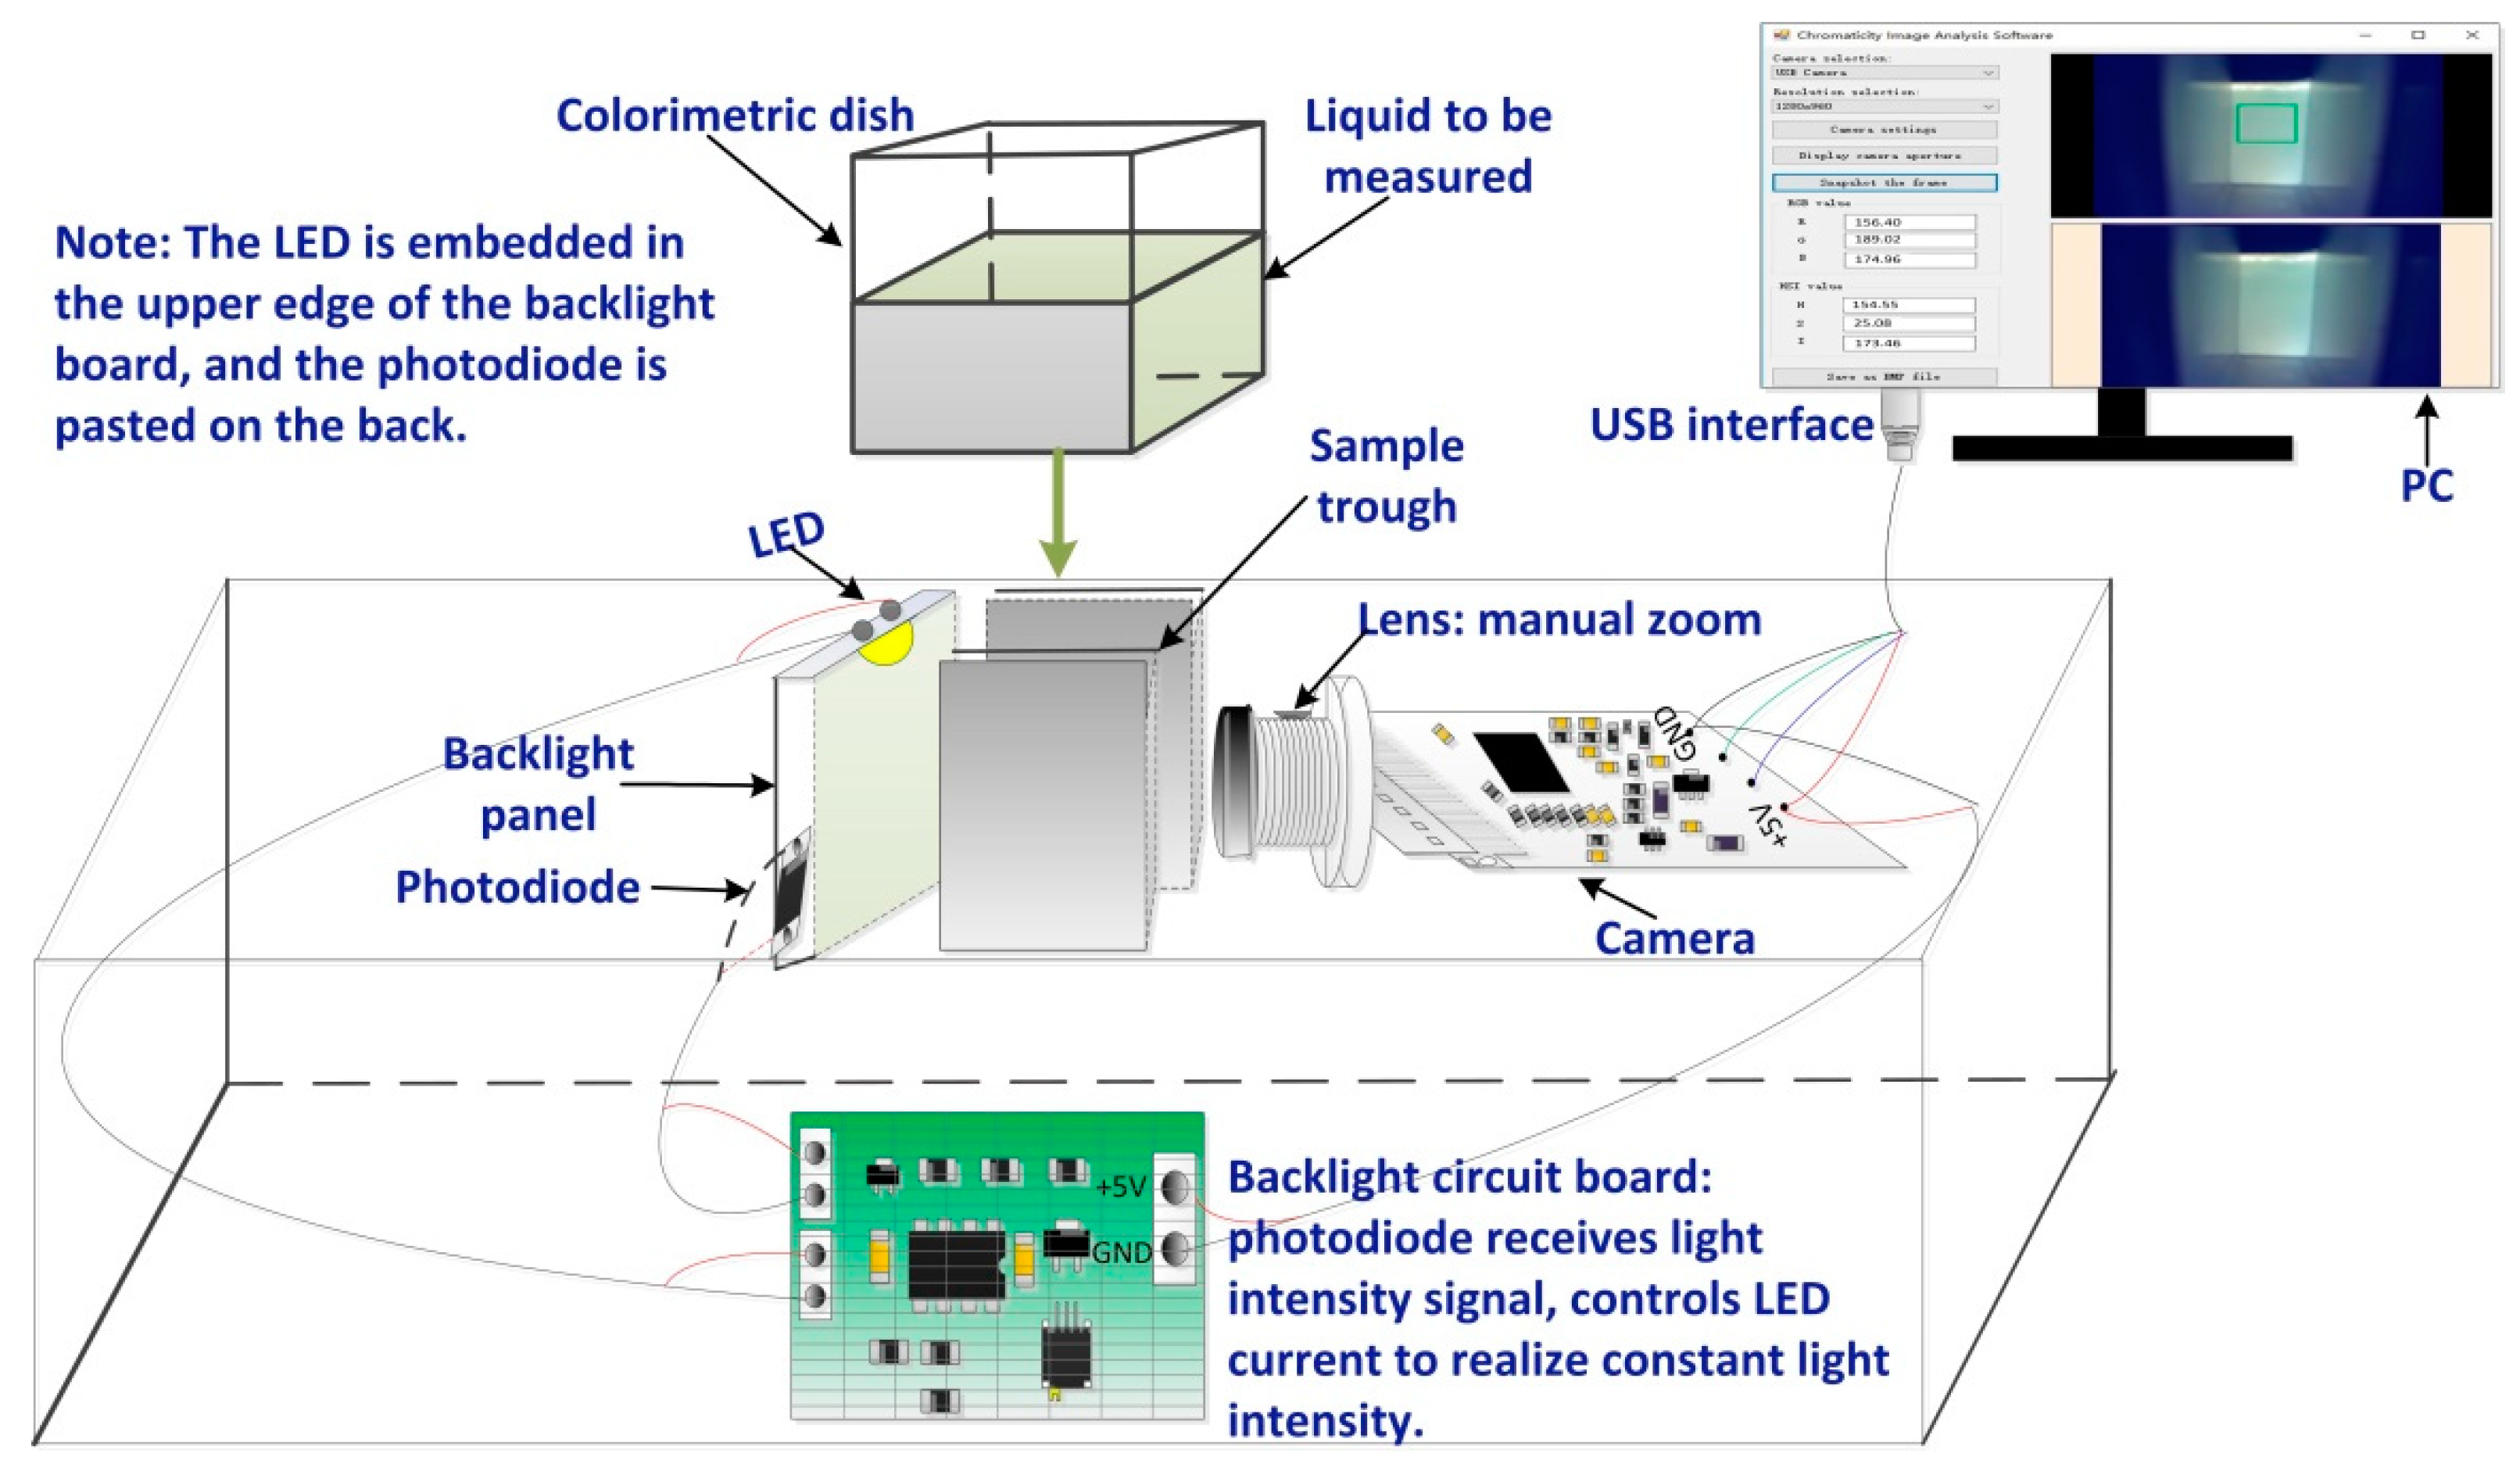
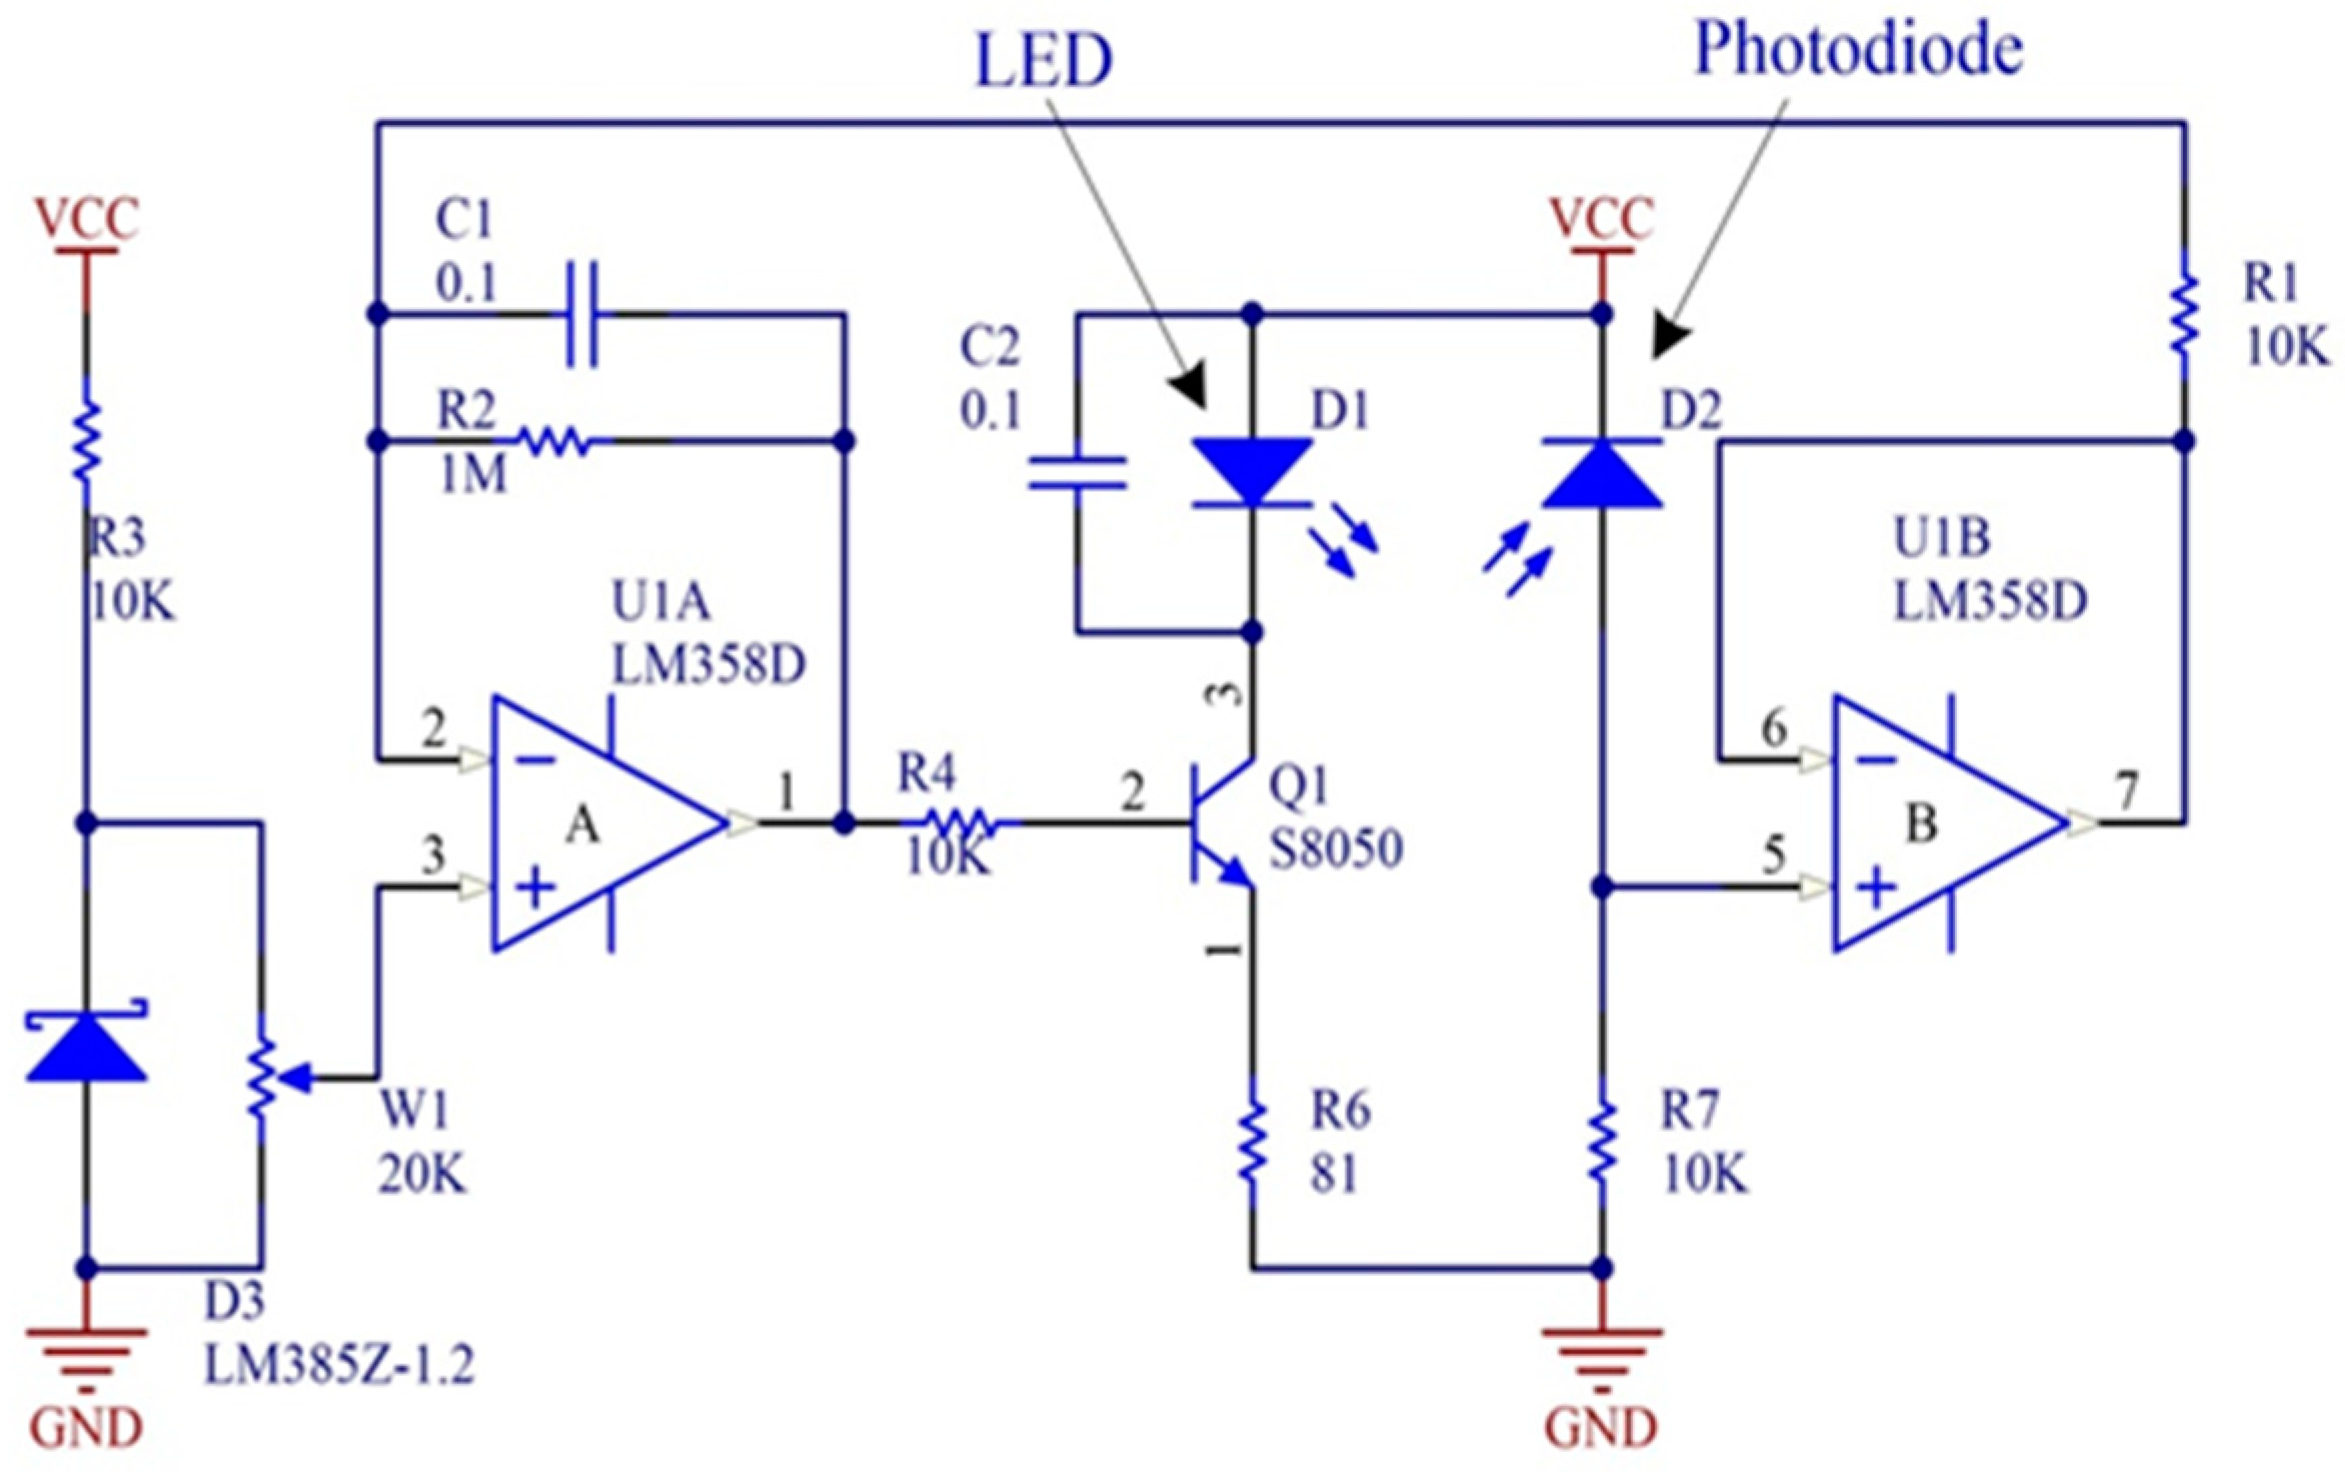
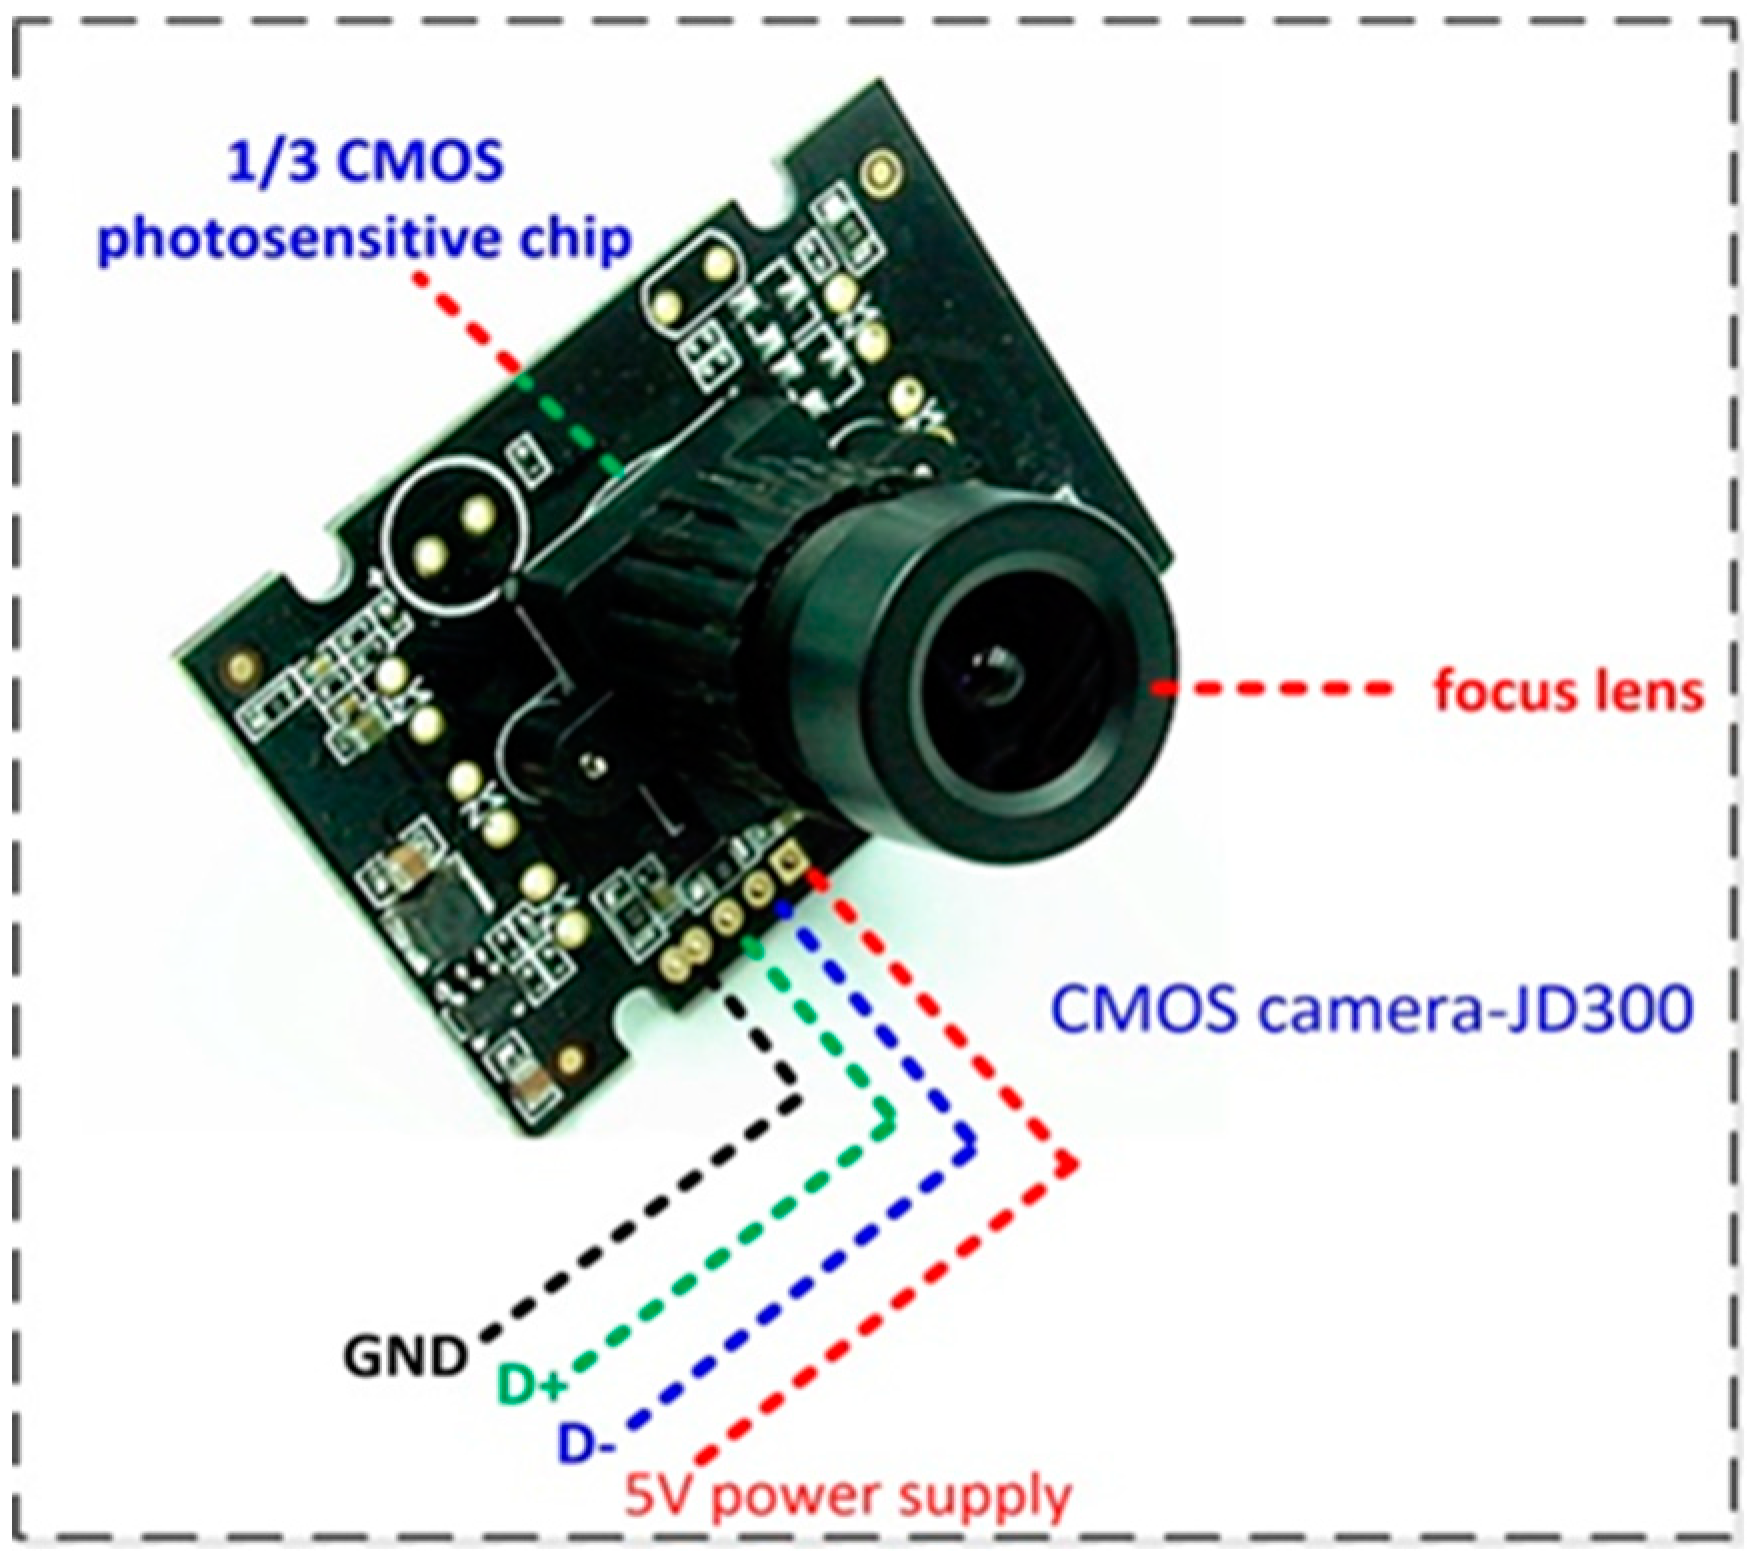
2.1.1. Image Acquisition Device
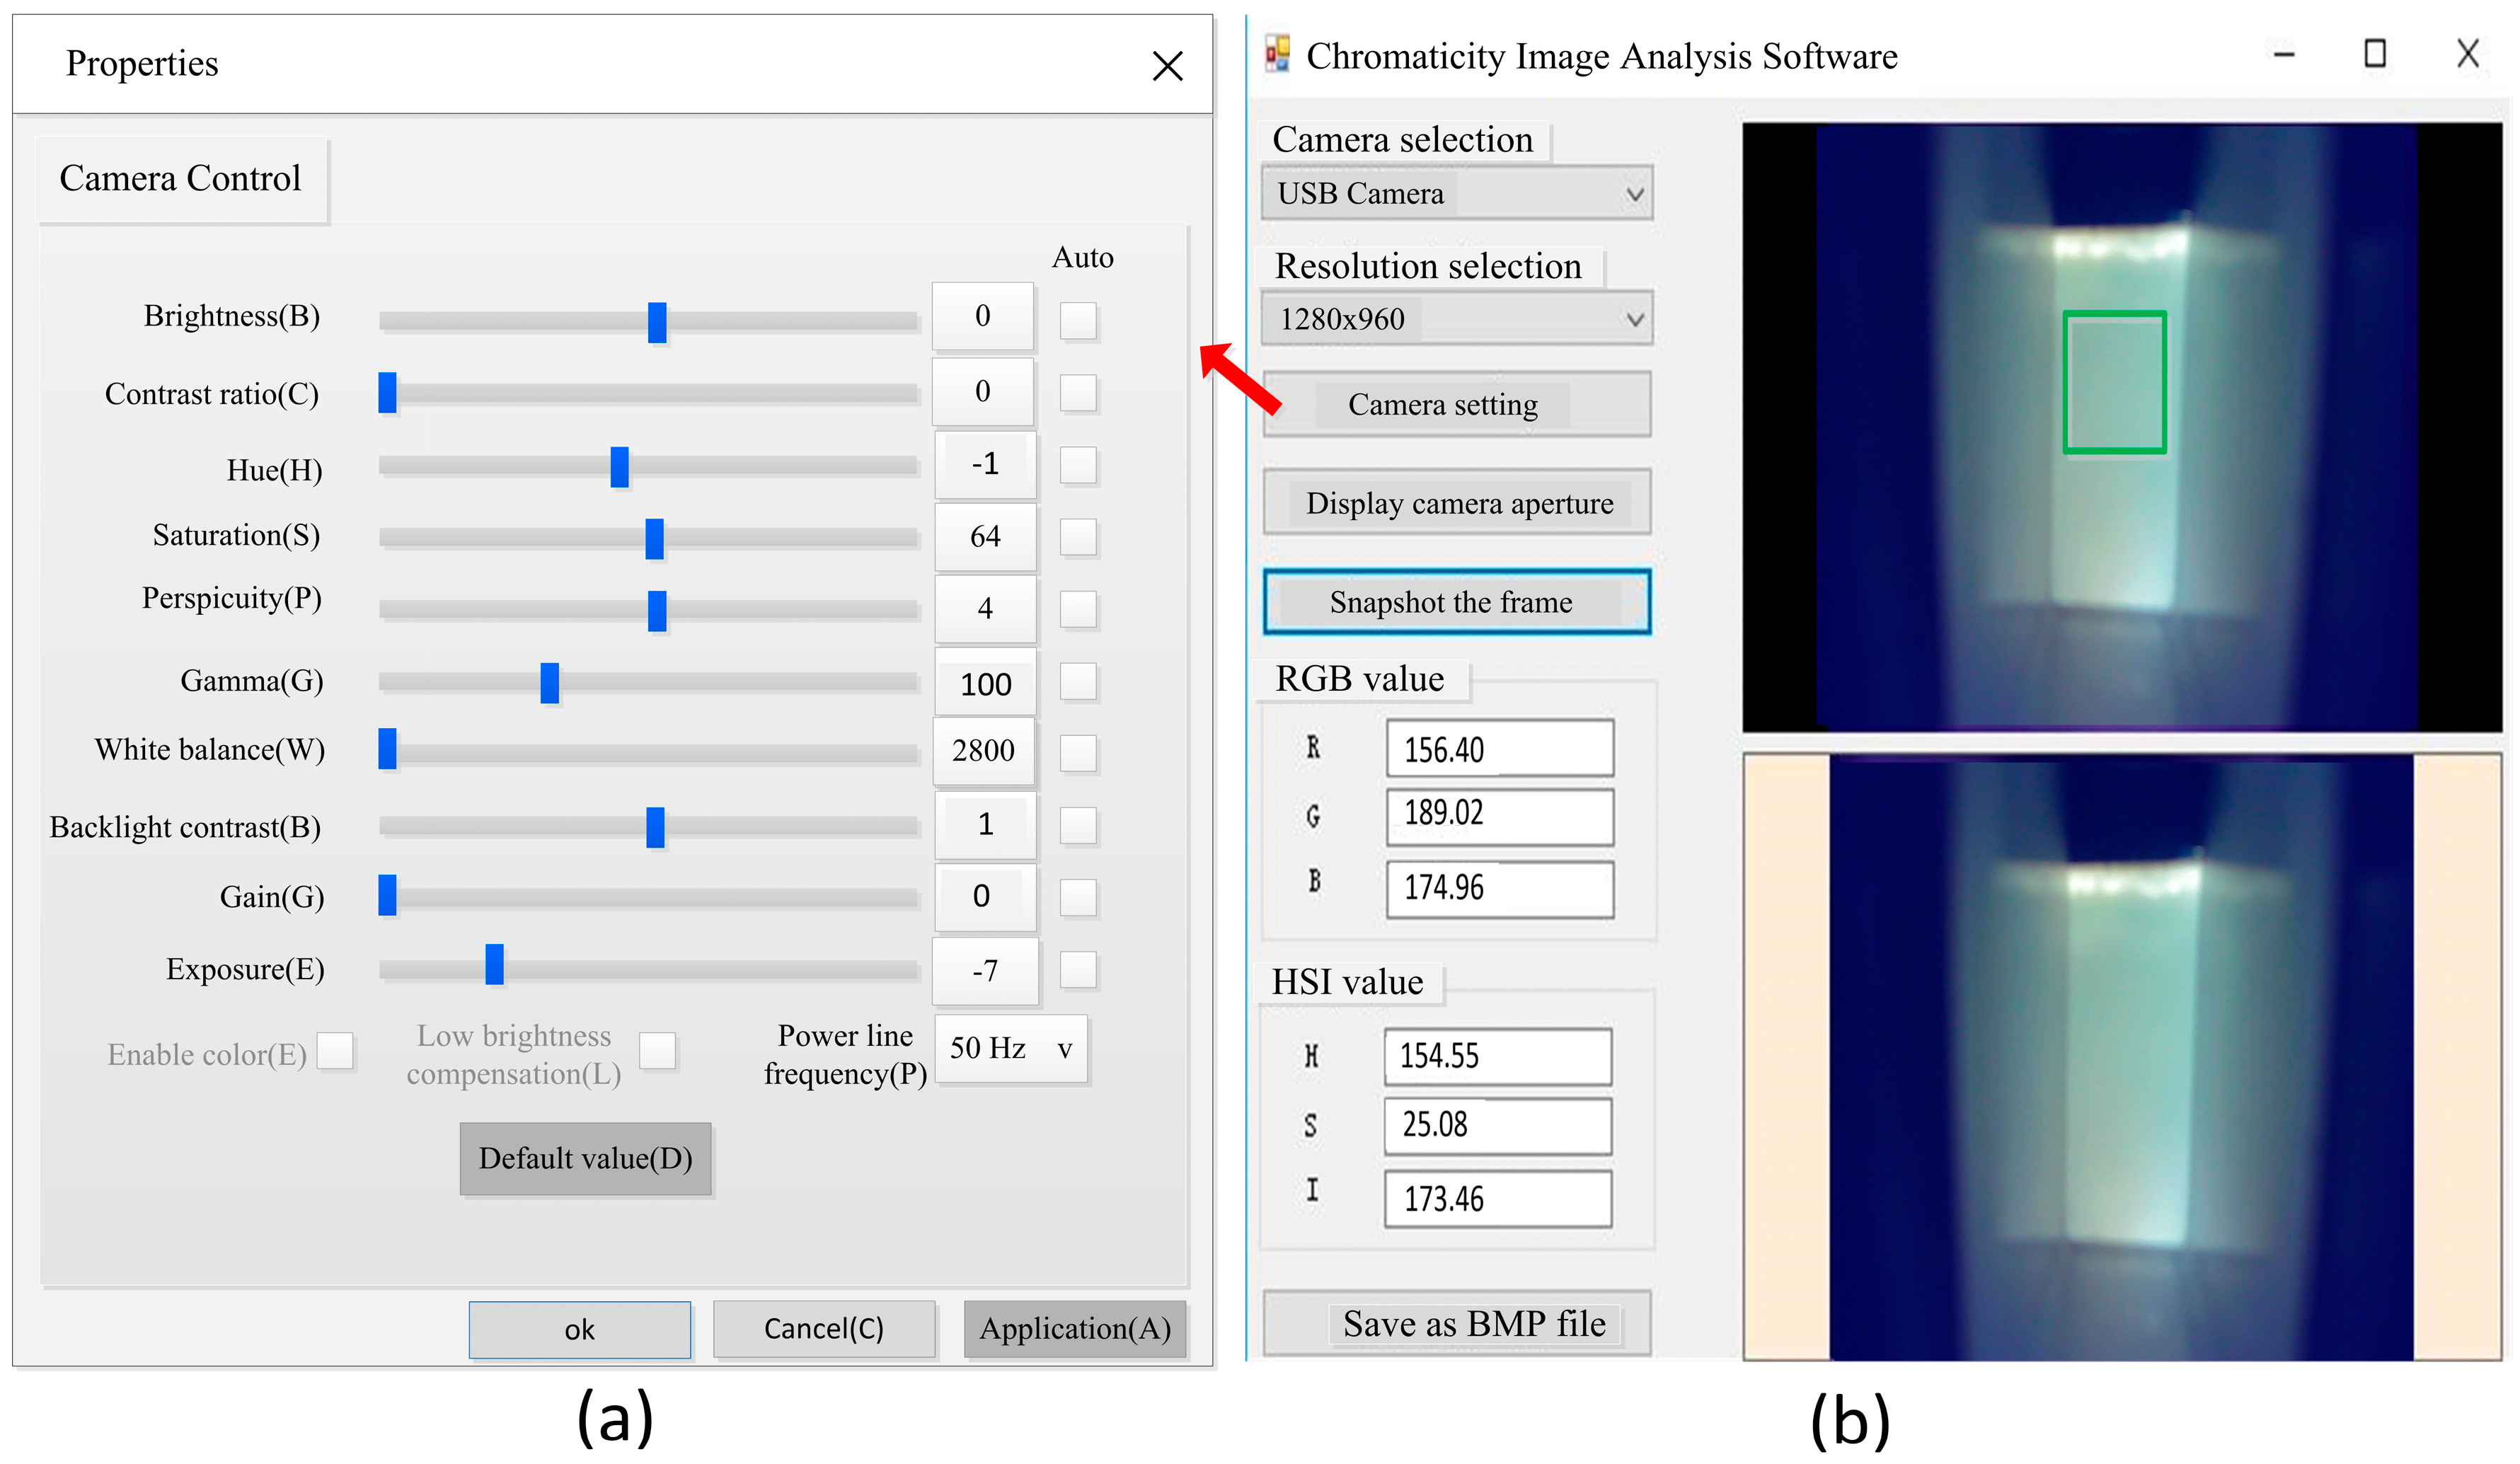
2.1.2. Software Design
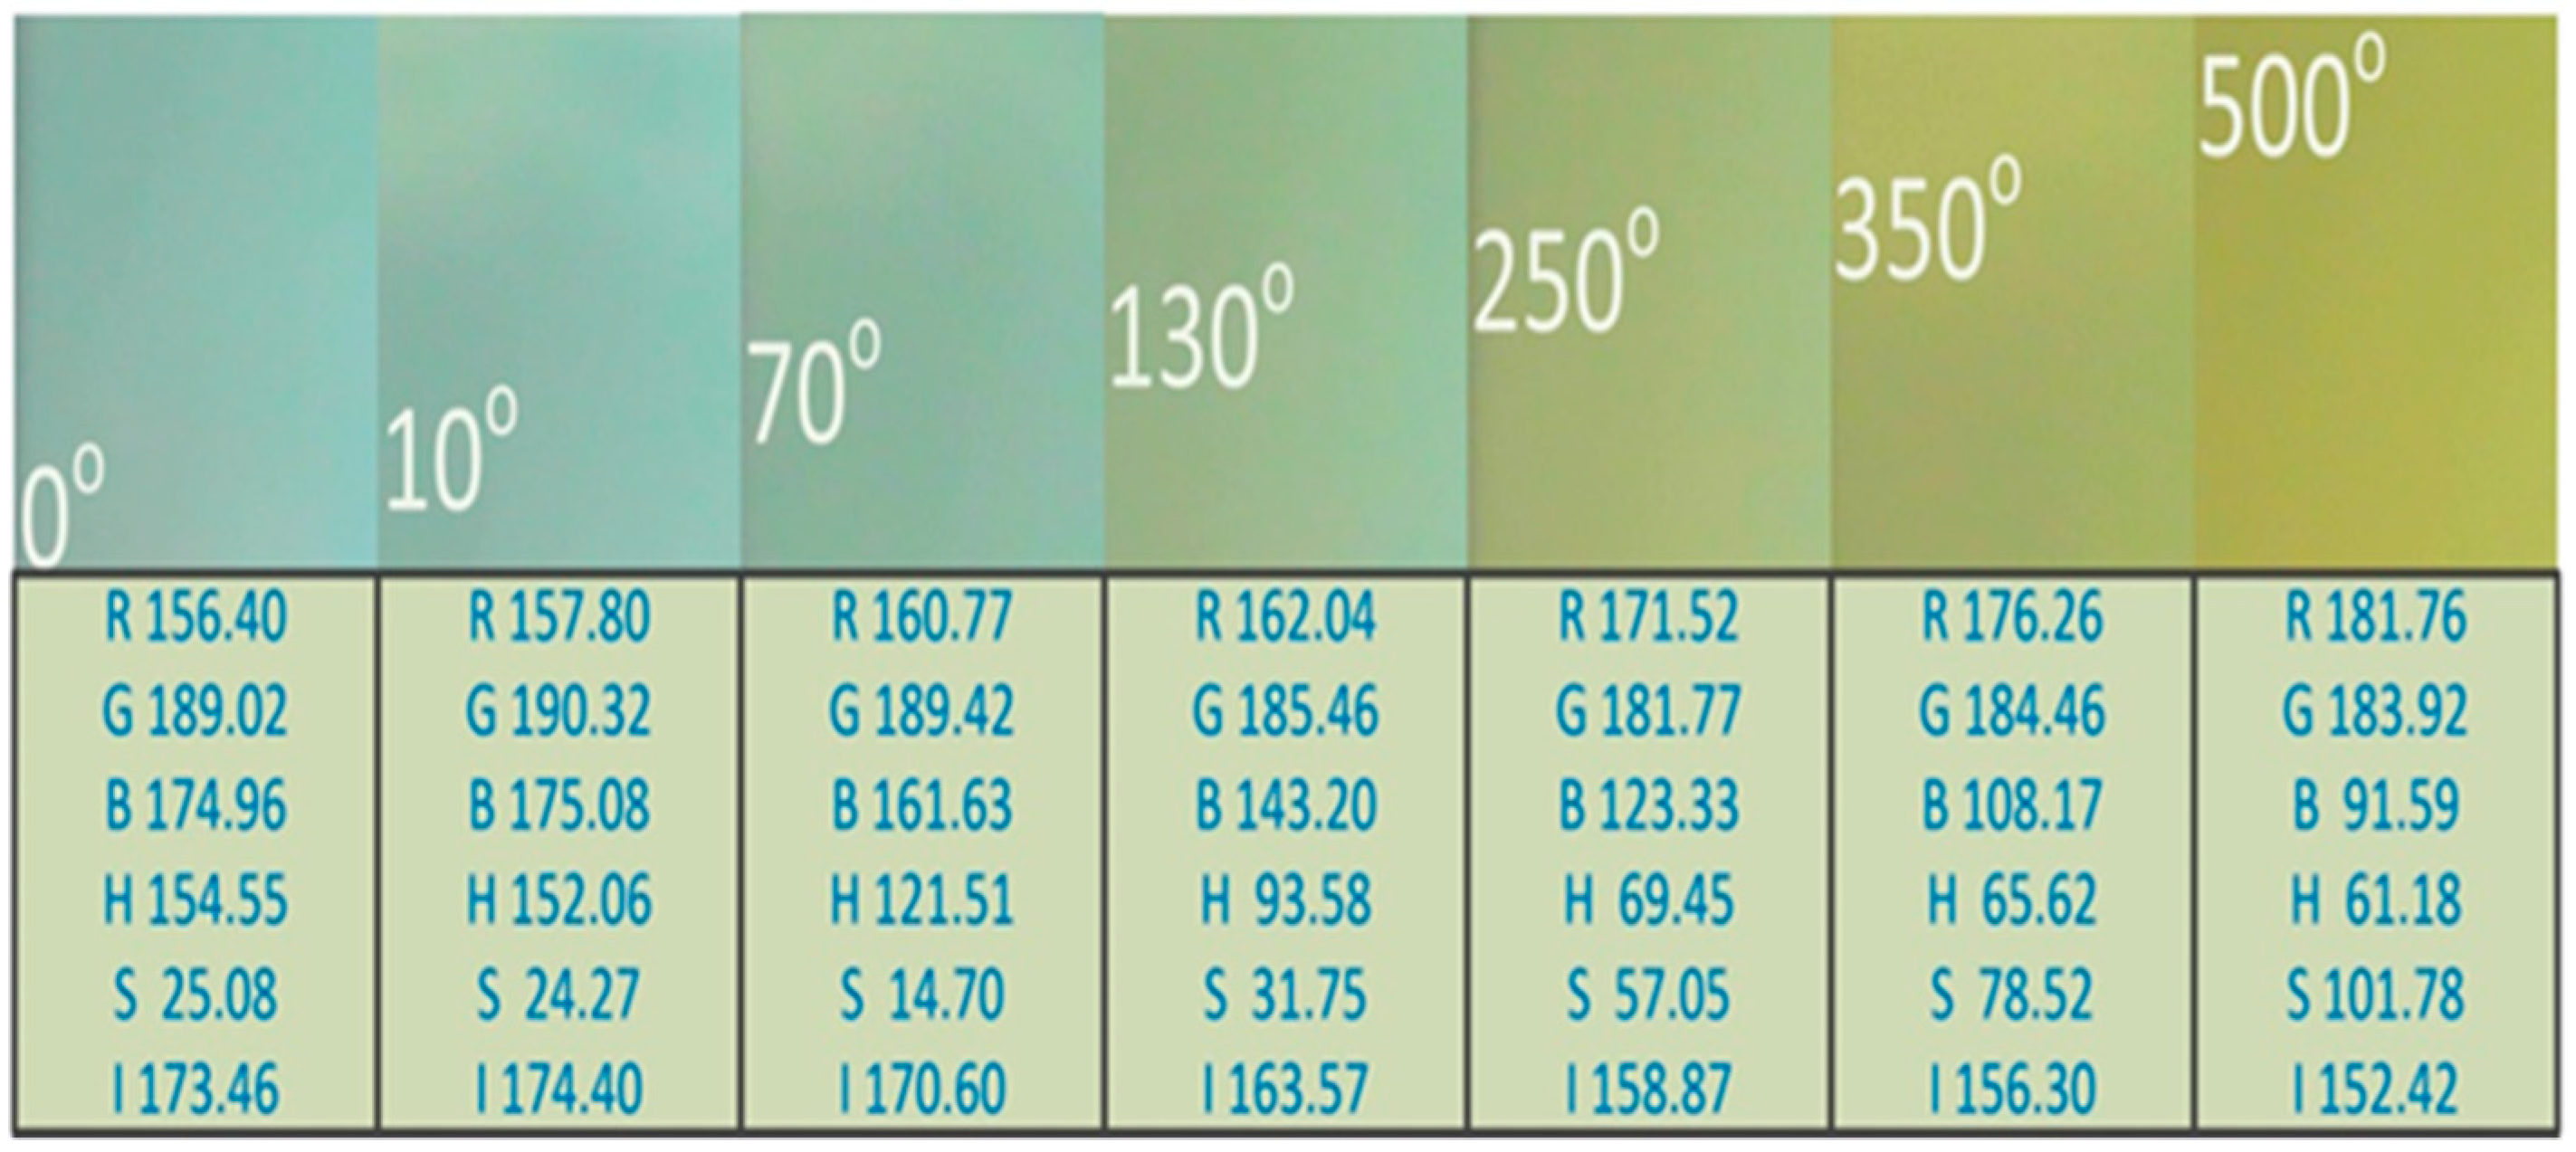
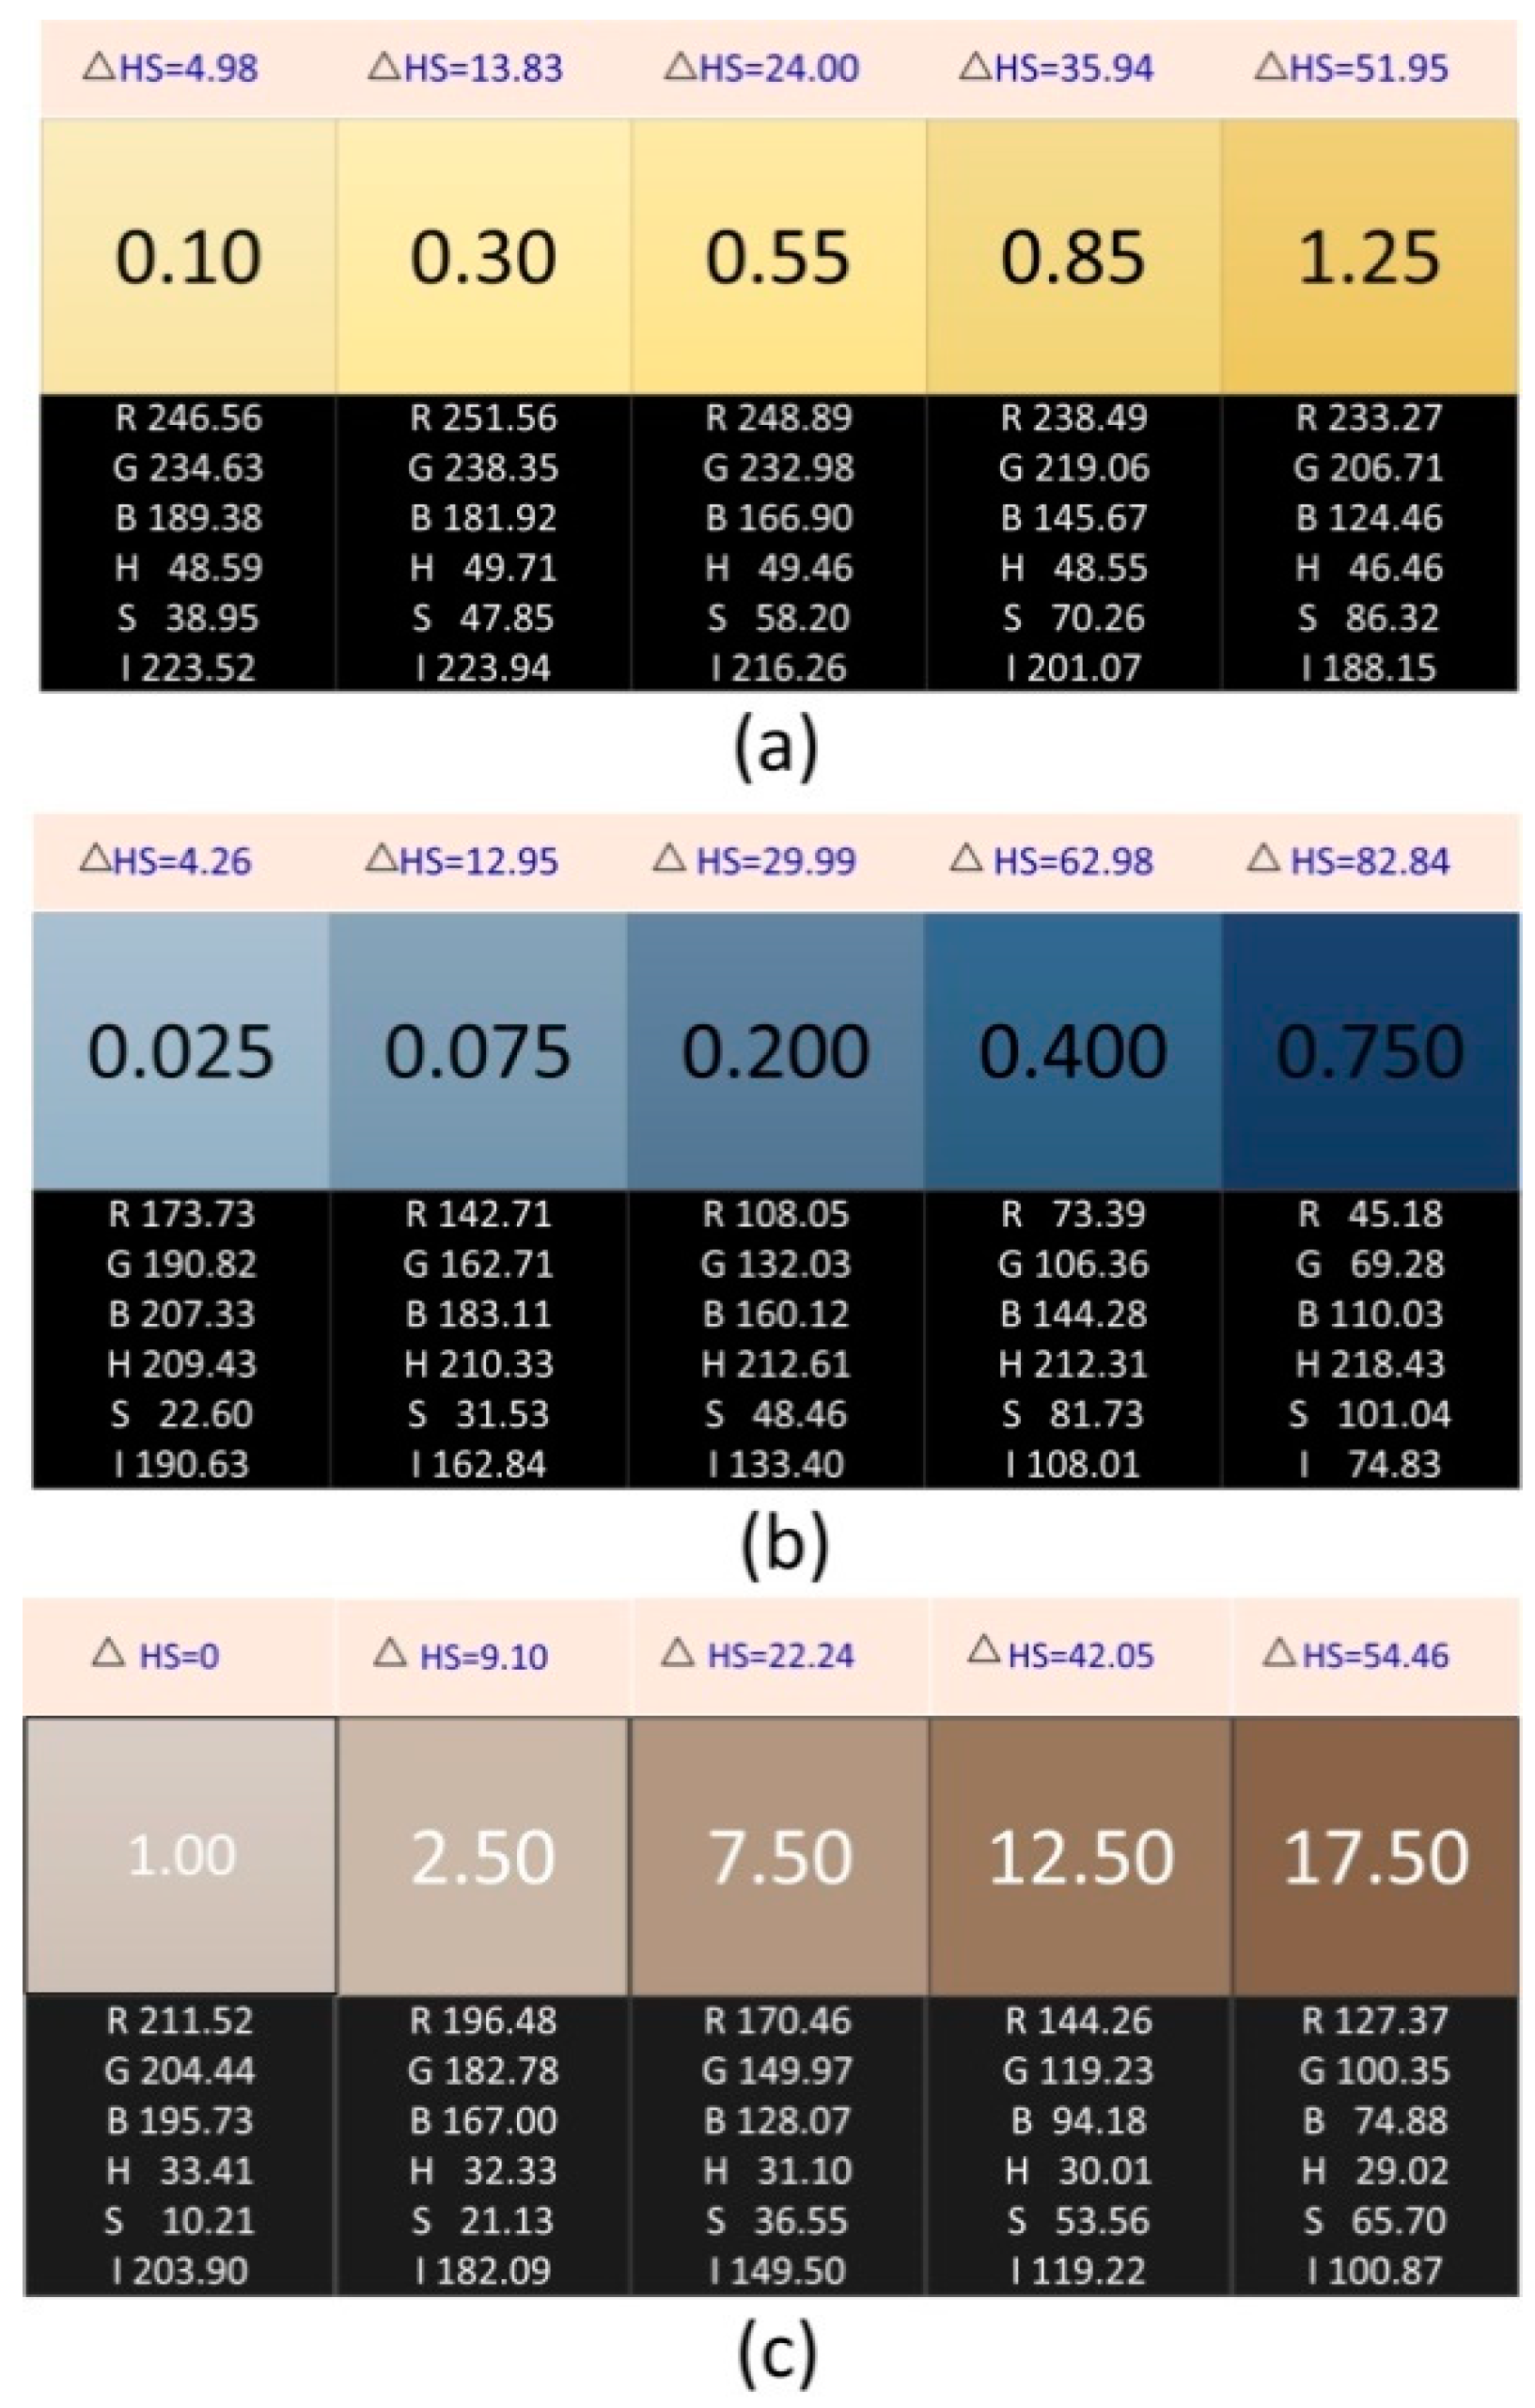
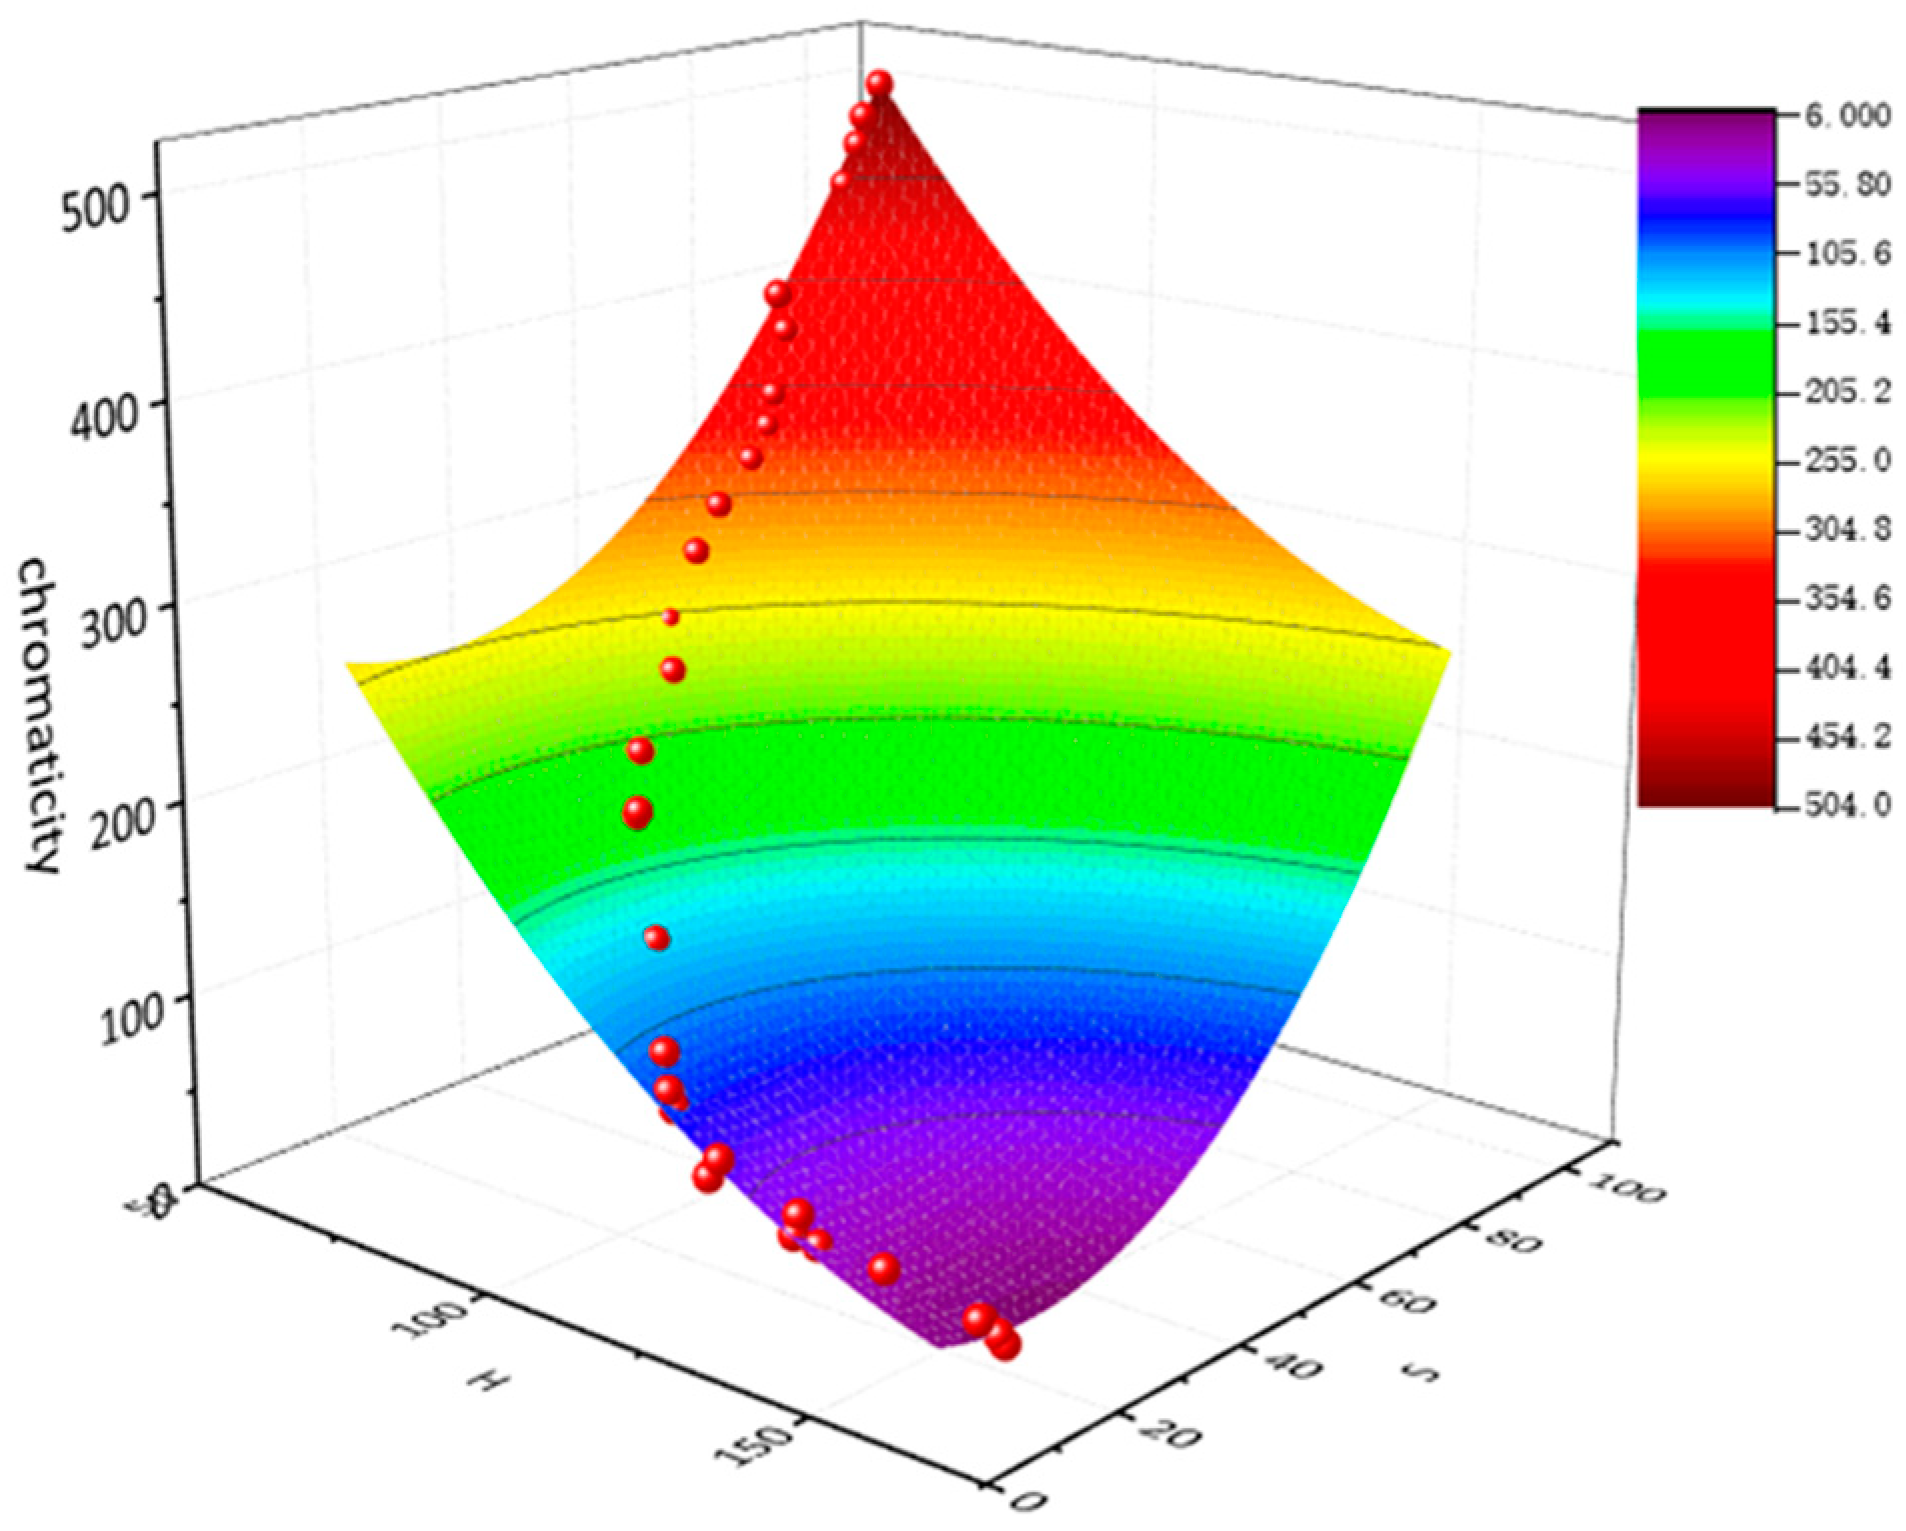
2.2. Preparation and Information Acquisition of Chromaticity Standard Solution
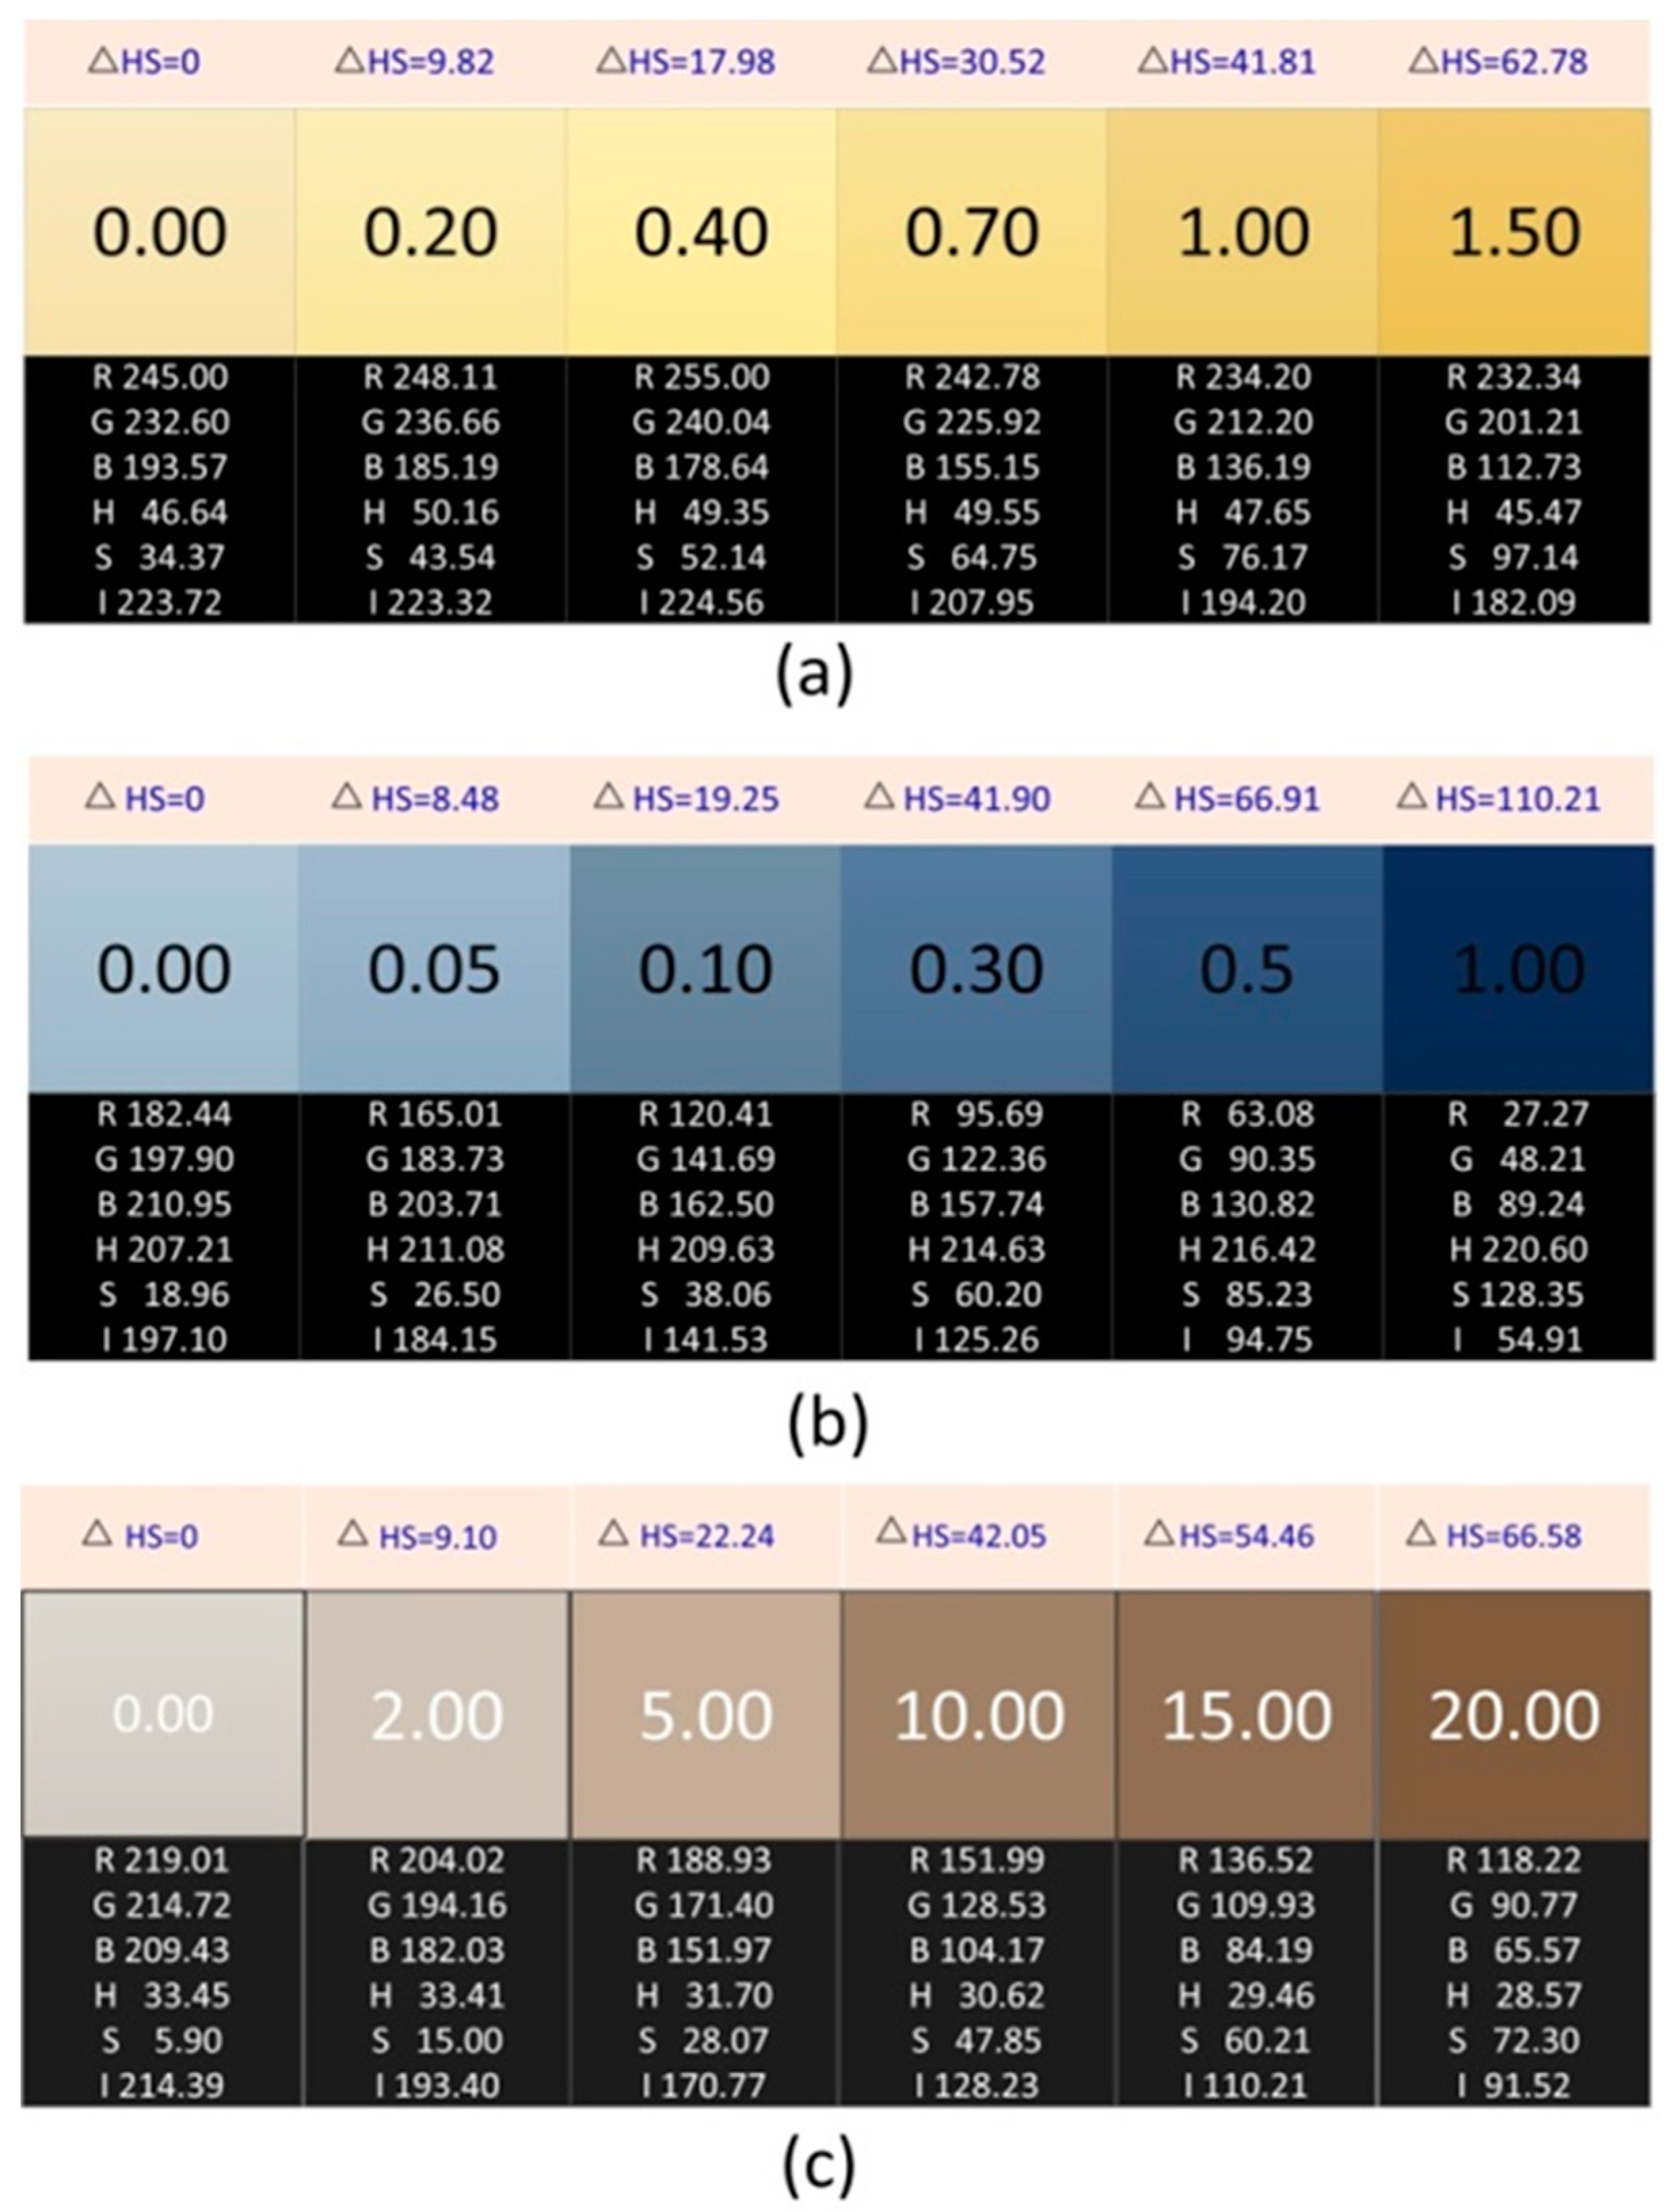
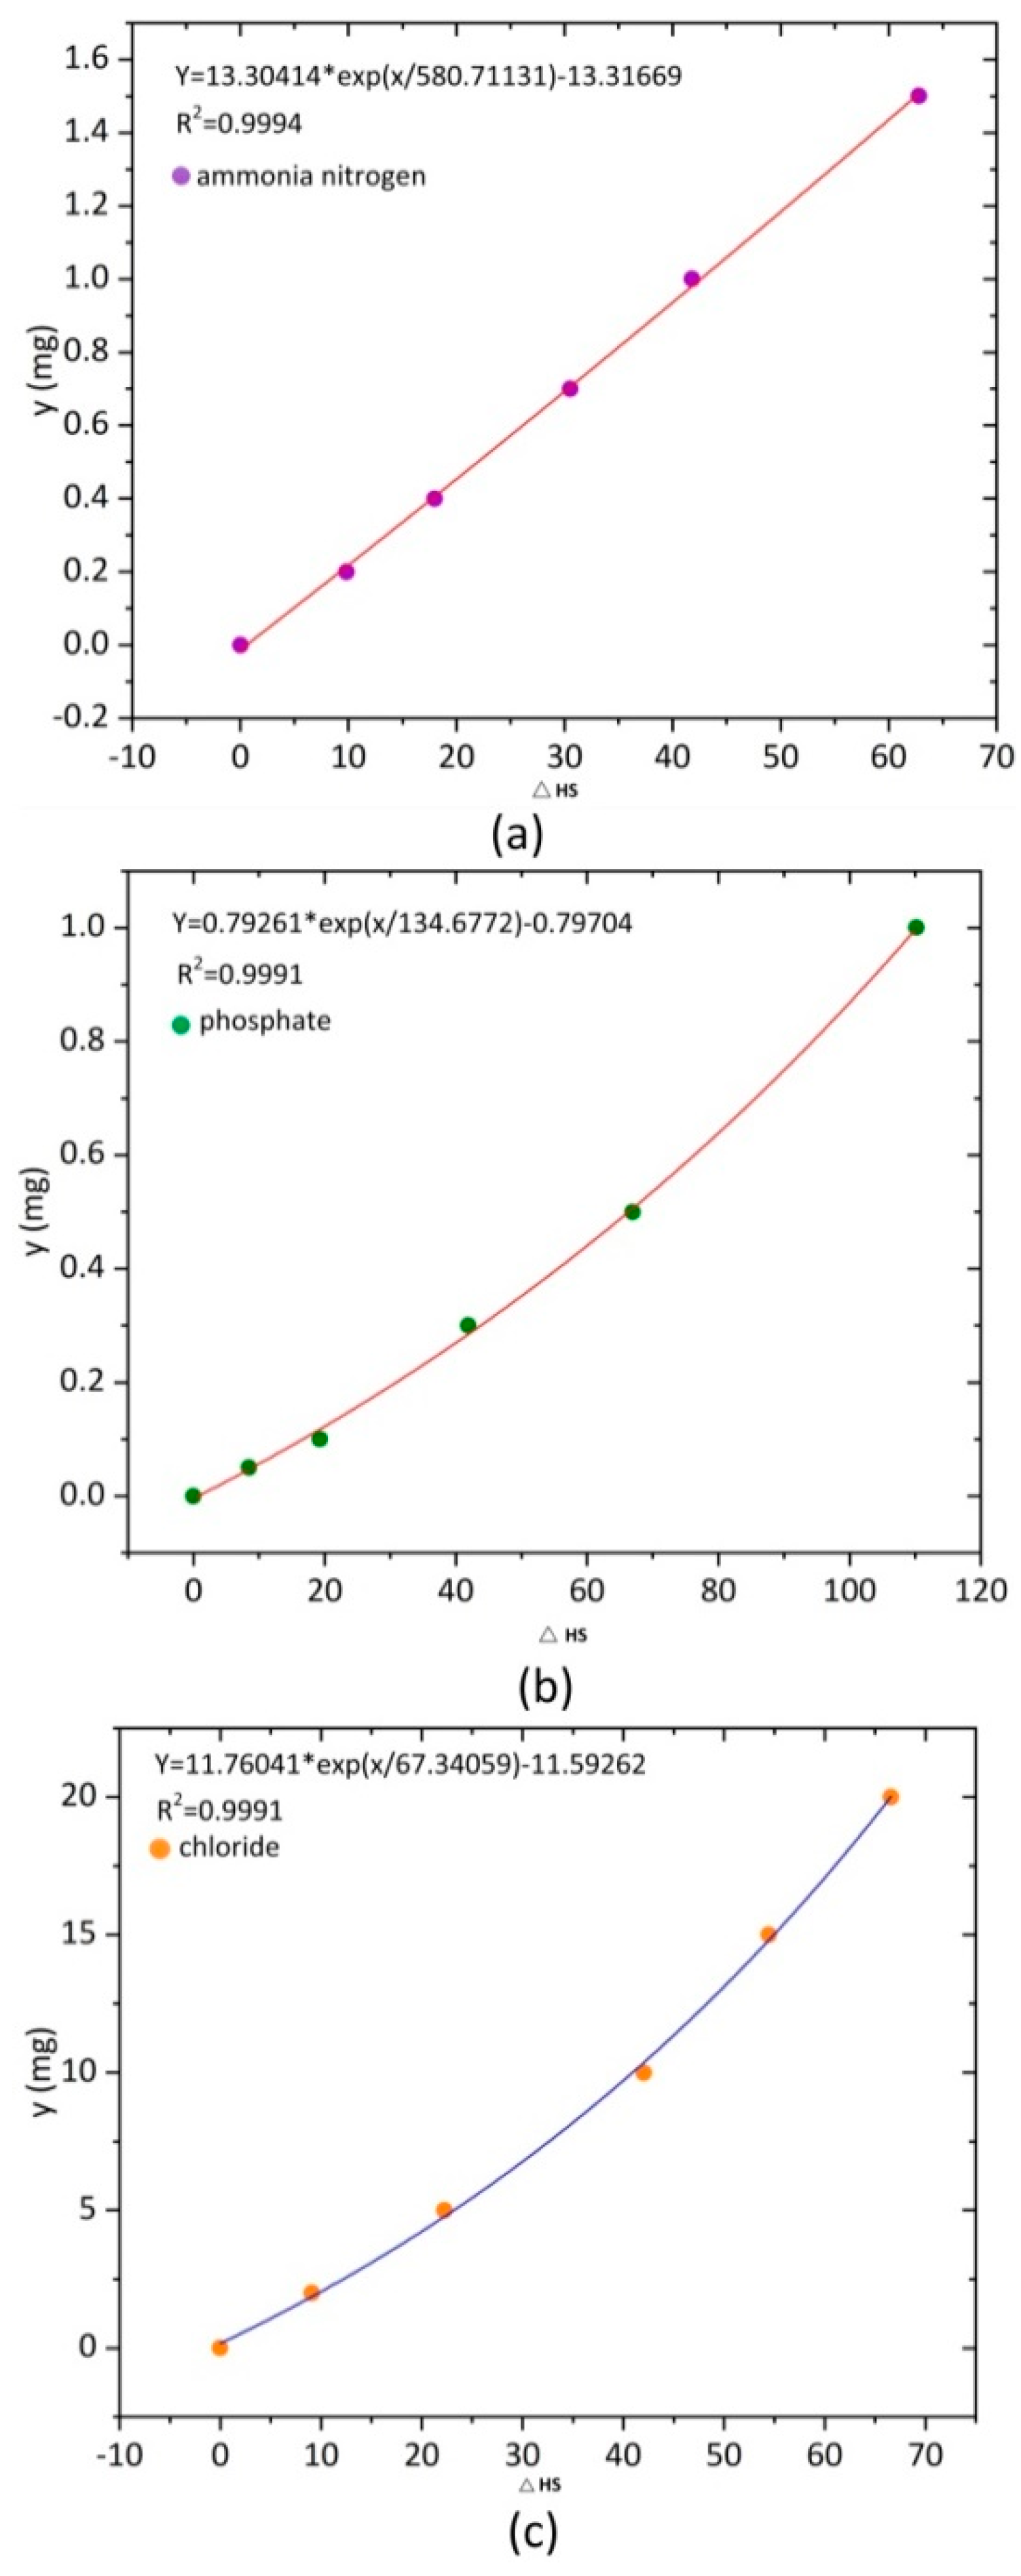
2.3. Preparation and Data Acquisition of Standard Solutions of Ammonia Nitrogen, Phosphate, and Chloride
3. Results
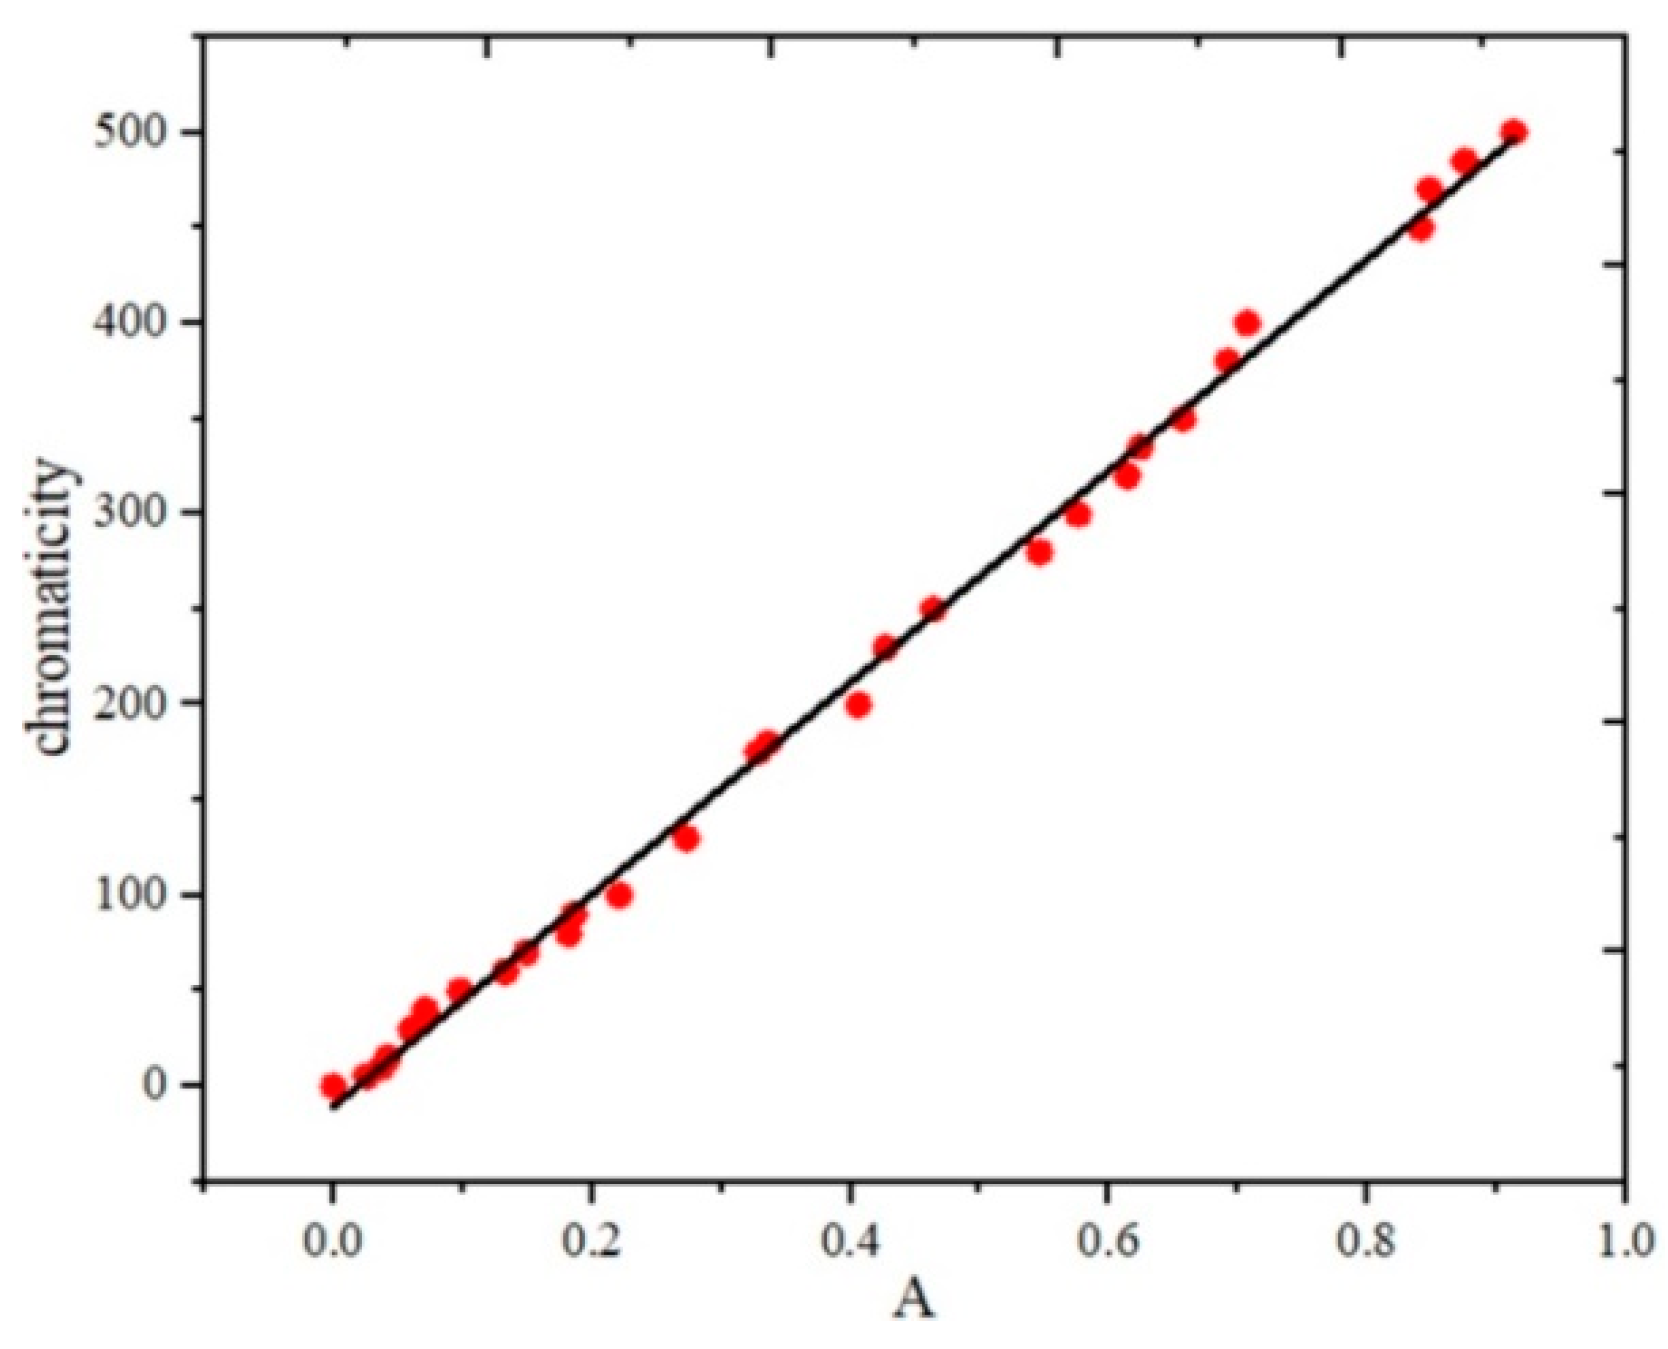
3.1. Fitting Results
3.2. Measurement Results
3.3. Contrast Experiment of Standard Chromaticity Solution
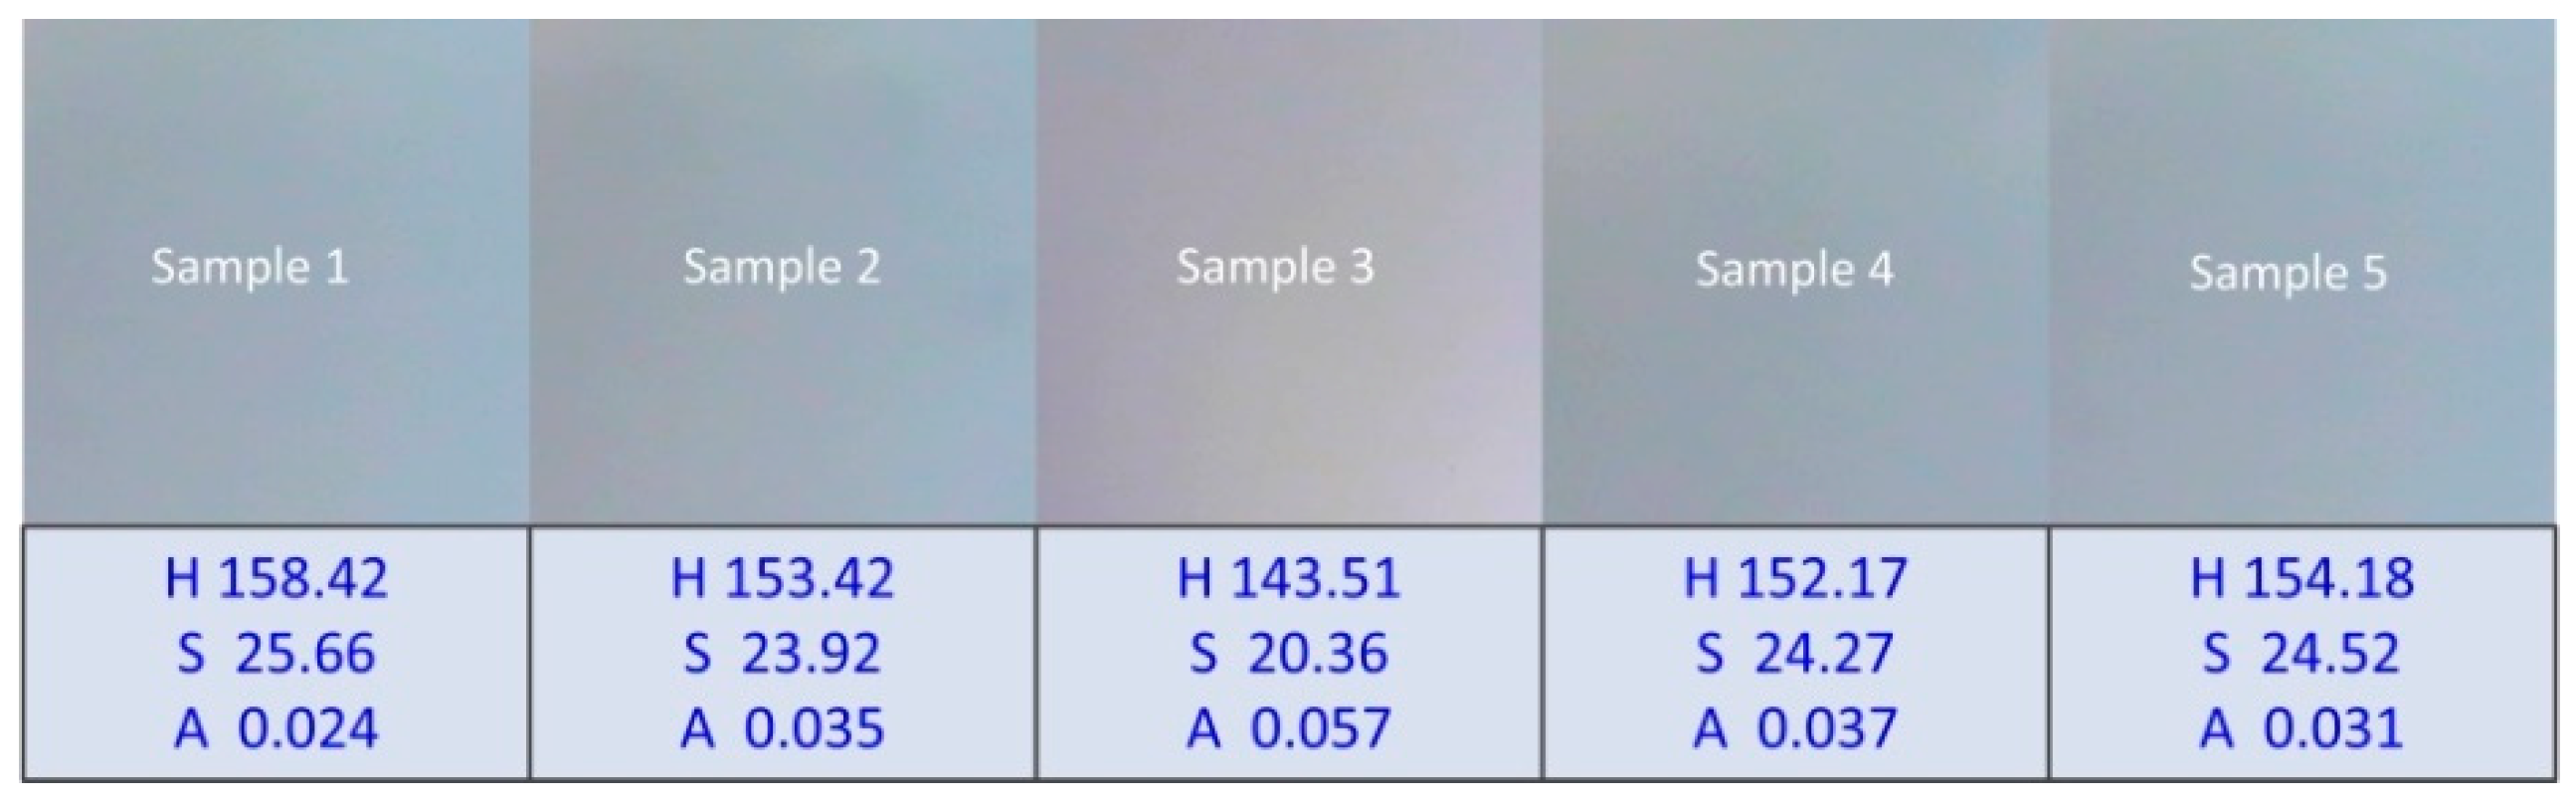
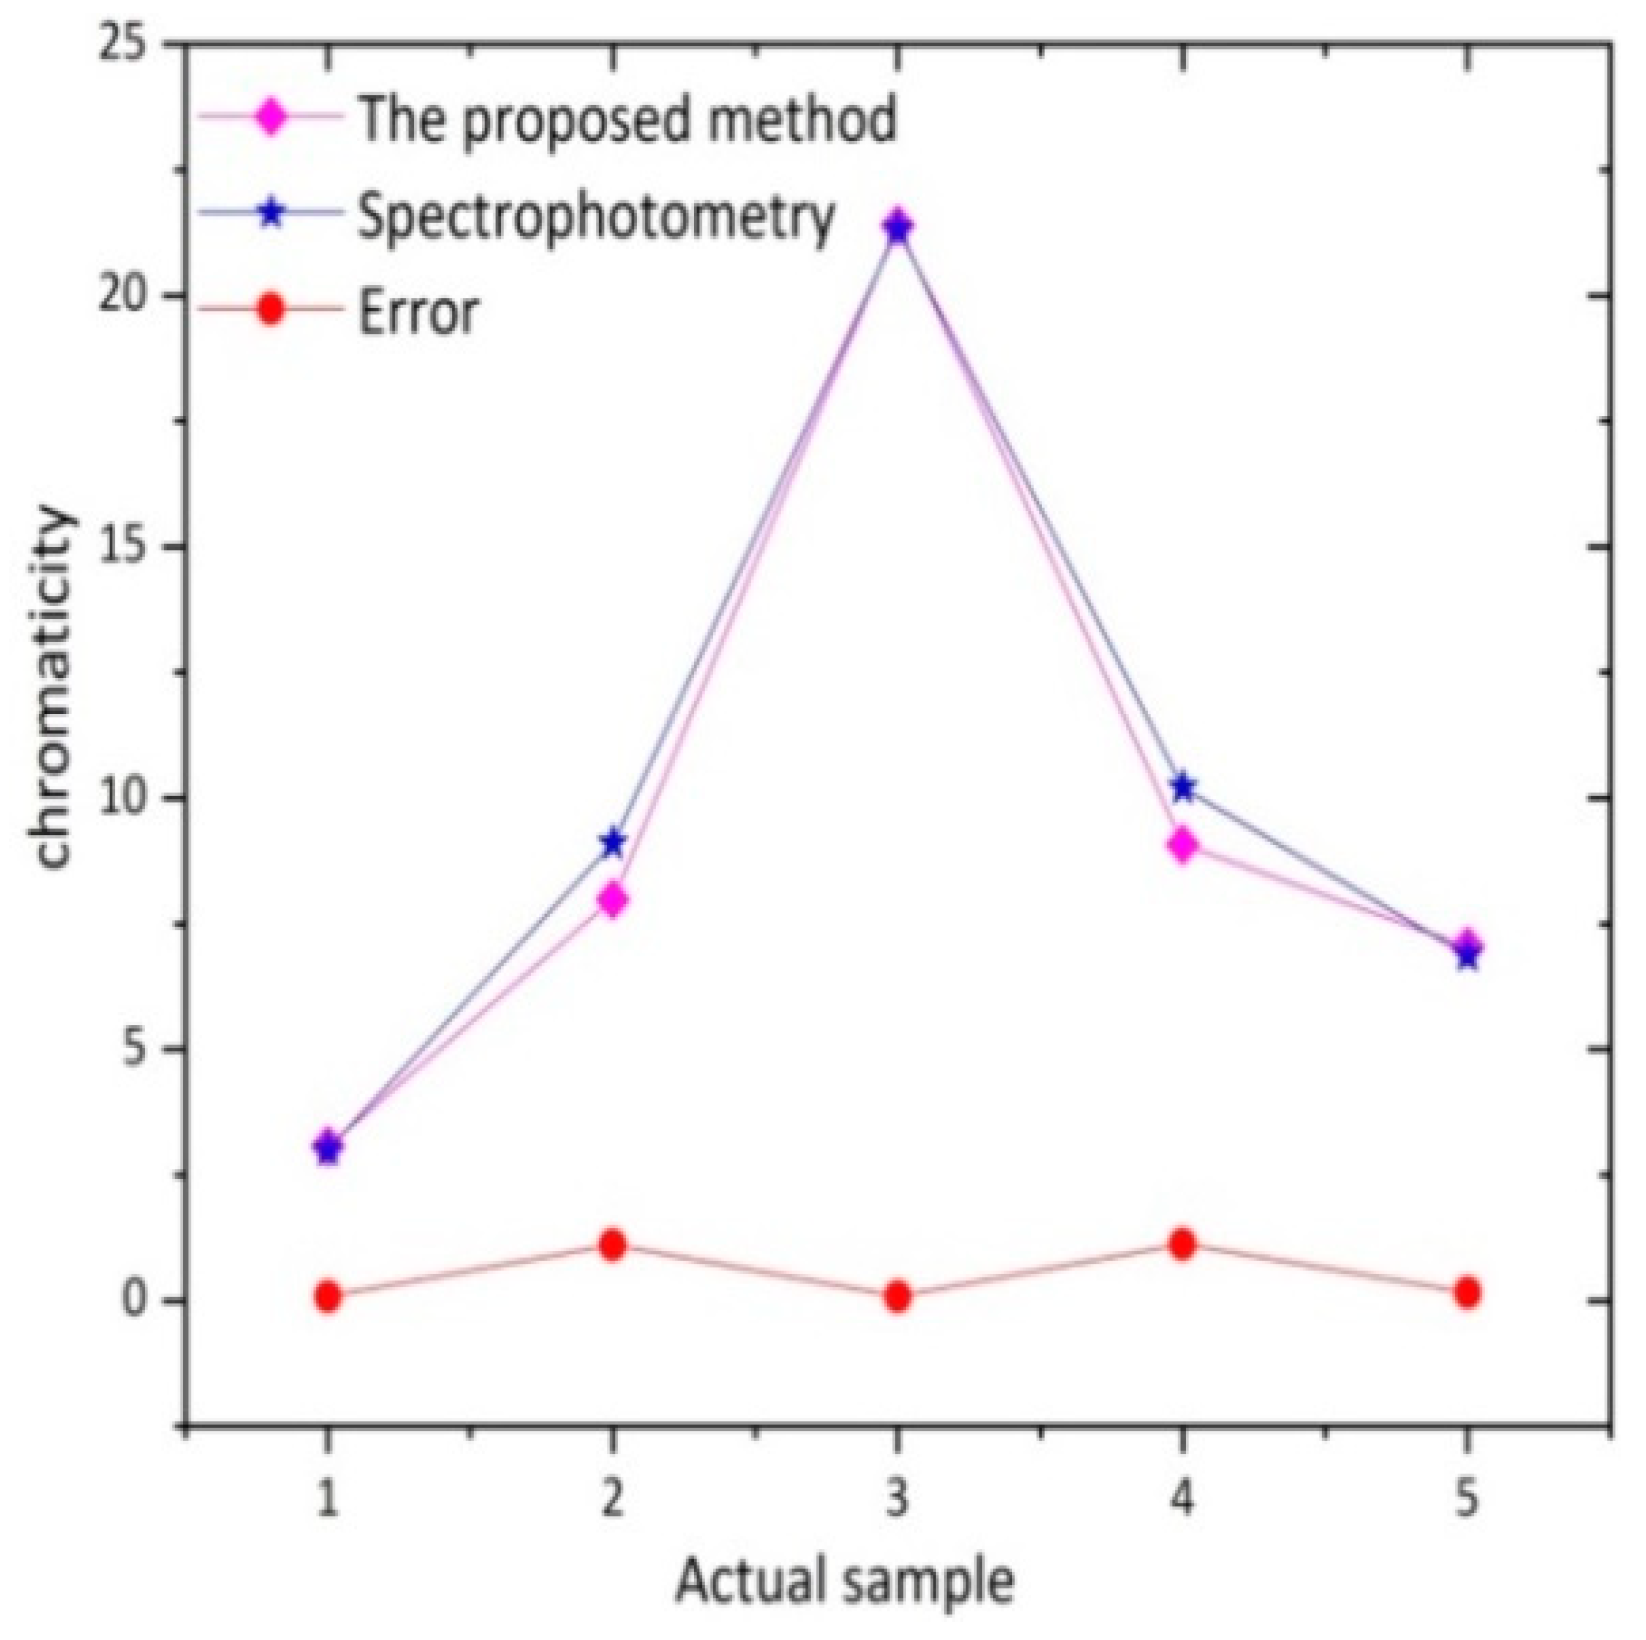
3.4. Contrast Experiment of Actual Water Sample
4. Discussion and Further Application
4.1. Camera Combined with Image Processing Technology instead of Photoelectric Instrument to Detect Colorable Substances in Water
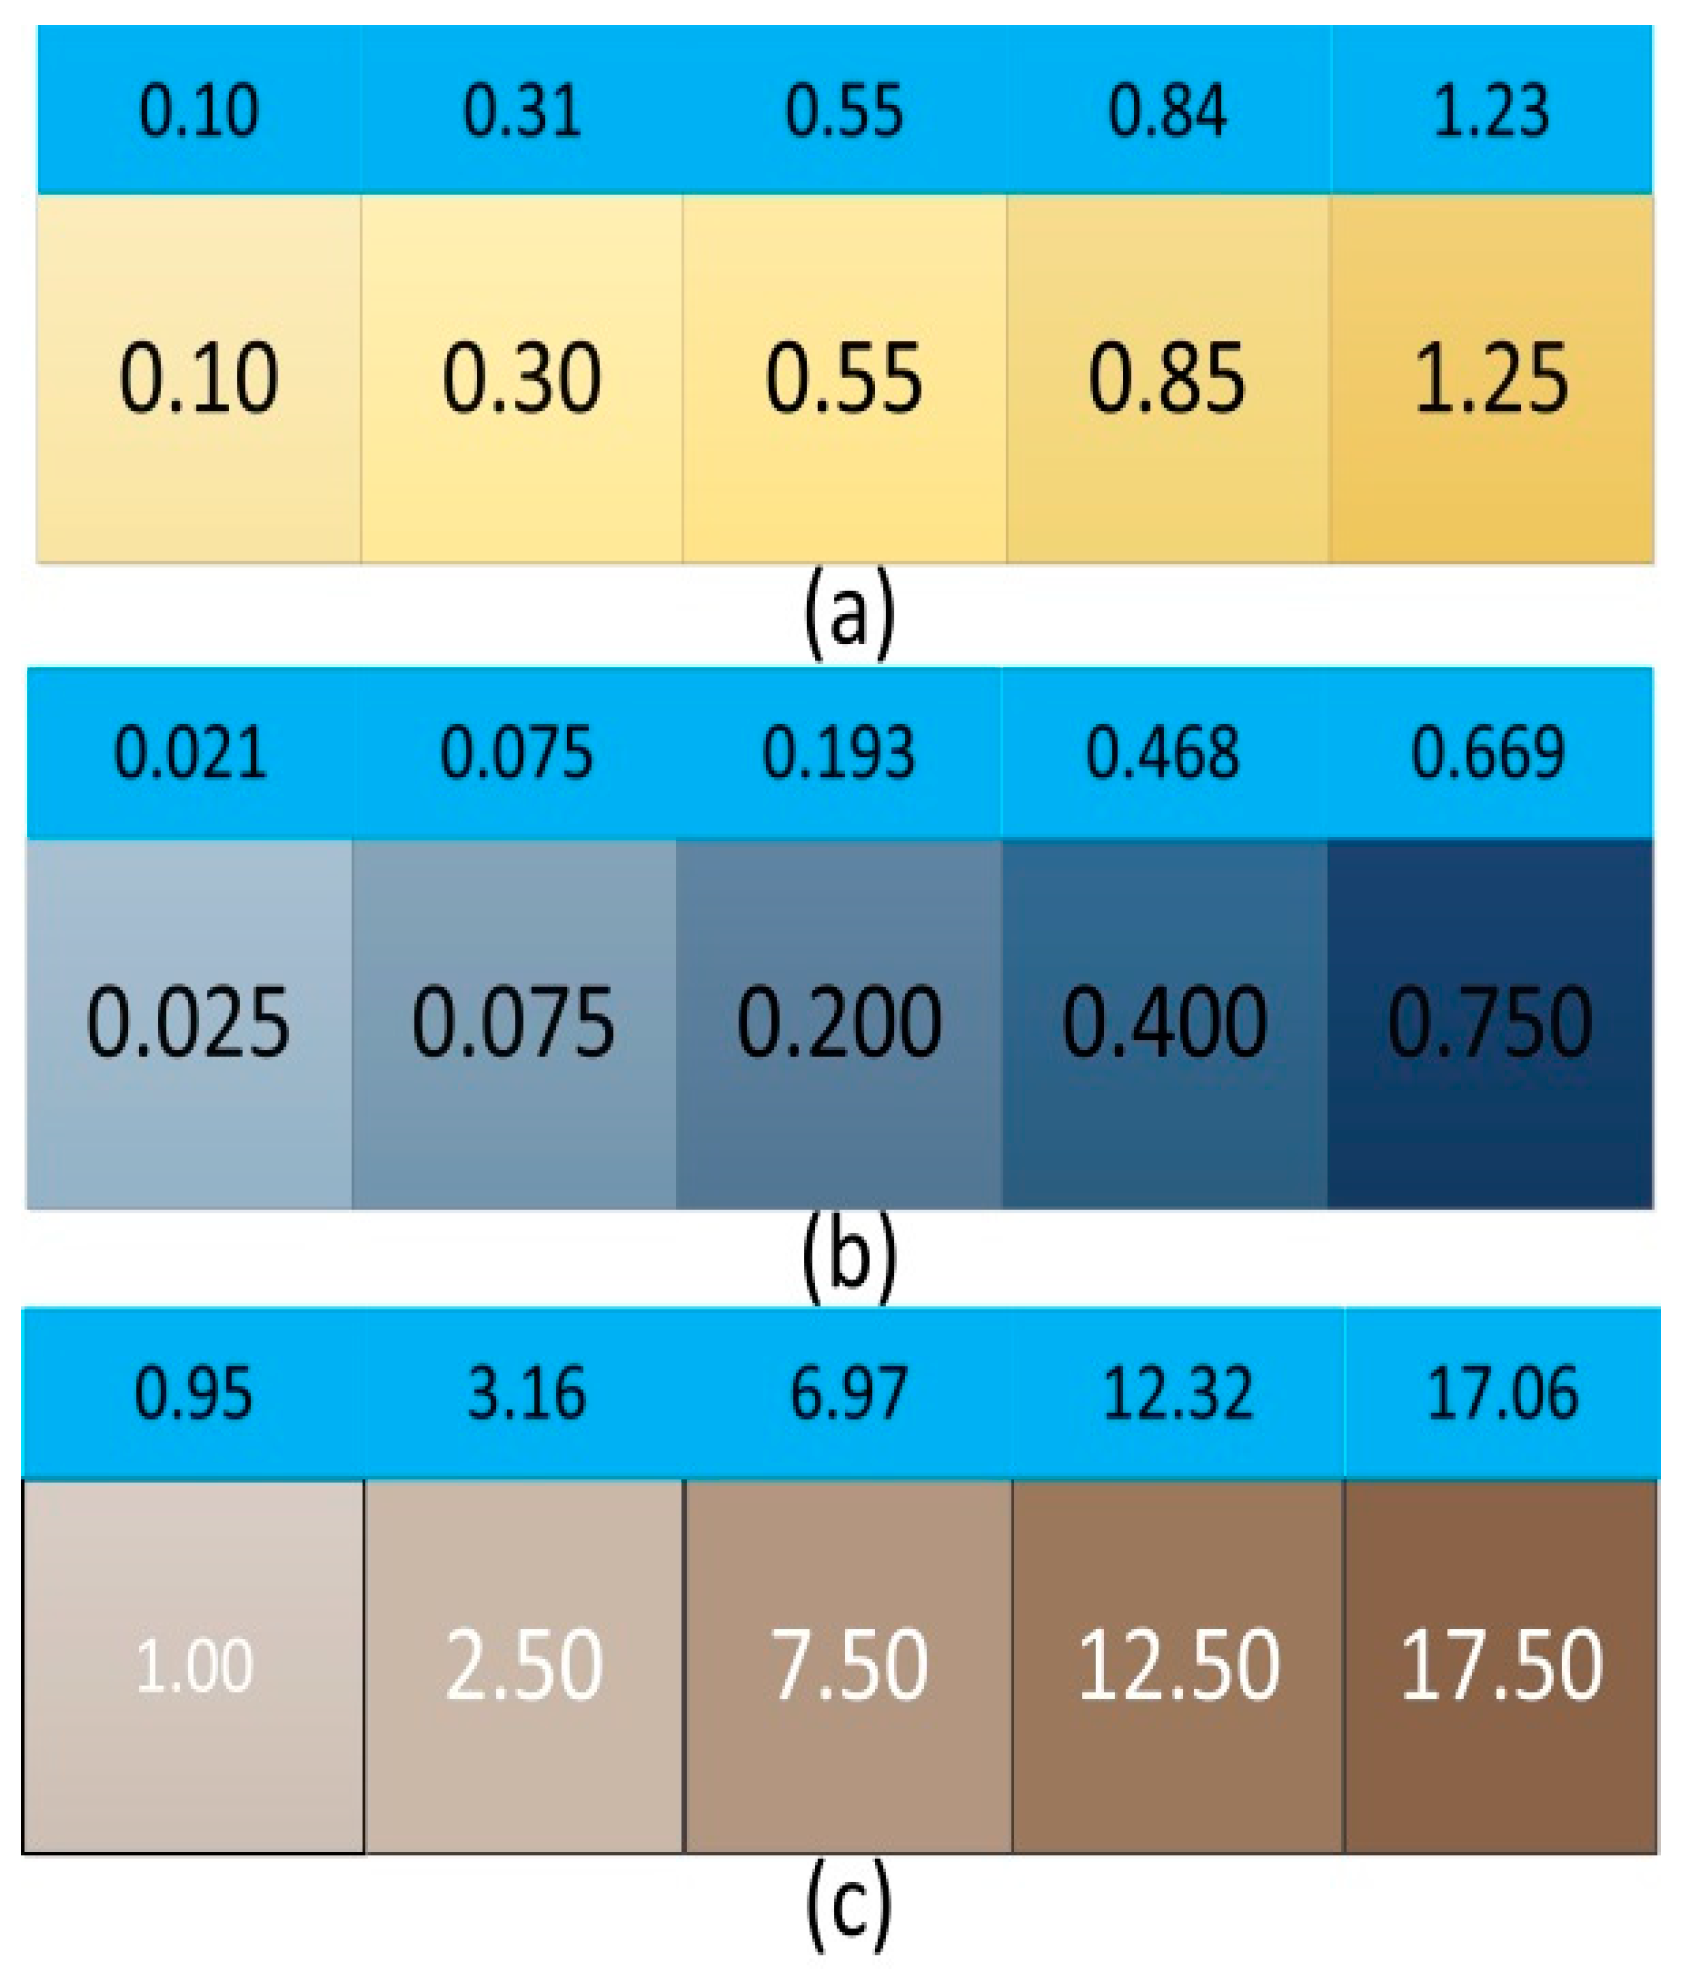
4.2. Application in the Detection of Ammonia Nitrogen, Phosphate, and Chloride in Water
4.3. Comparison of Water Quality Detection Methods based on Camera Image
5. Conclusions
Author Contributions
Funding
Acknowledgments
Conflicts of Interest
References
- Xiao, Y.H.; Räike, A.; Hartikainen, H.; Vähätalo, A.V. Iron as a source of color in river waters. Sci. Total Environ. 2015, 536, 914–923. [Google Scholar] [CrossRef] [PubMed]
- Breneman, I.V.J.; Blasinski, H.; Farrell, J. The Color of Water: Using Underwater Photography to Estimate Water Quality. Proc. SPIE 2014, 90230R. [Google Scholar] [CrossRef]
- Wang, Y.; Kidger, T.E.; Tatsuno, K. The water colority measurement based on HSV chromaticity. Proc. SPIE 2014, 1002124. [Google Scholar] [CrossRef]
- Jin, X.; Xiang, C.; Qi, D. A on Industrial Water Treatment Technology, 3rd ed.; Chemical and Chemical Press: Beijing, China, 2003; pp. 37–38. [Google Scholar]
- Grabas, M. Organic matter removal from meat processing wastewater using moving bed biofilm reactors. Environ. Prot. Eng. 2000, 26, 55–62. [Google Scholar]
- ISO. Clear Liquids—Estimation of Colour by the Platinum-Cobalt Scale—Part 1: Visual Method, ISO 6271-1-2004; ISO: Geneva, Switzerland, 2004. [Google Scholar]
- Wang, A. Study on the determination of water colority. Environ. Monit. China 2000, 16, 37–40. [Google Scholar]
- Zhao, X.; Shen, W. Standard for water color determination based on three-wavelength luminous transmittance. Chin. J. Environ. Eng. 2013, 7, 4766–4772. [Google Scholar]
- Funt, B.; Xiong, W. Estimating Illumination Chromaticity via Support Vector Regression. In Proceedings of the Color and Imaging Conference, Scottsdale, AZ, USA, 1 January 2004. [Google Scholar]
- Zeng, F.; Luo, X. Determination of the colority of water samples by spectrophotometry. Ind. Water Treat. 2006, 26, 69. [Google Scholar]
- Peng, P.; Huang, H.; Ren, H.; Ma, H.; Lin, Y.; Geng, J. Exogenous N-acyl homoserine lactones facilitate microbial adhesion of high ammonia nitrogen wastewater on biocarrier surfaces. Sci. Total Environ. 2018, 624, 1013–1022. [Google Scholar] [CrossRef]
- Camargo, J.A.; Alonso, Á.; Puente, M.D.L. Eutrophication downstream from small reservoirs in Mountain Rivers of Central Spain. Water Res. 2005, 39, 3376–3384. [Google Scholar] [CrossRef]
- Bian, X.; Fan, J.; Duan, H. Measurement of cyanogen chloride in drinking water with isonicotinic acid-pyrazolone spectrophotometry. Mod. Prev. Med. 2009, 36, 3328–3329. [Google Scholar]
- Li, G.; Tong, Y.; Li, J. Research on ultraviolet-visible absorption spectrum preprocessing for water quality contamination detection. Optik 2018, 164, 277–288. [Google Scholar] [CrossRef]
- Brkić, B.; Giannoukos, S.; Taylor, S. Mobile mass spectrometry for water quality monitoring of organic species present in nuclear waste ponds. Anal. Methods UK 2018, 10, 5827–5833. [Google Scholar] [CrossRef] [Green Version]
- Charulatha, G.; Srinivasalu, S.; Maheswari, O.U. Evaluation of ground water quality contaminants using linear regression and artificial neural network models. Arab. J. Geosci. 2017, 10, 128. [Google Scholar] [CrossRef]
- Mori, Y.; Hopmans, J.W.; Mortensen, A.P. MultiFunctional Heat Pulse Probe for the Simultaneous Measurement of Soil Water Content, Solute Concentration, and Heat Transport Parameters. Vadose. Zone J. 2003, 2, 561–571. [Google Scholar] [CrossRef]
- Domask, W.G.; Kobe, K.A. Mercurimetric Determination of Chlorides and Water-Soluble Chlorohydrins. Anal. Chem. 2002, 24, 989–991. [Google Scholar] [CrossRef]
- Kónya, J.; Nagy, N.M. Determination of water-soluble phosphate content of soil using heterogeneous exchange reaction with 32 P radioactive tracer. Soil Till. Res. 2015, 150, 171–179. [Google Scholar] [CrossRef]
- Bogoslovskiy, V.V.; Chernova, N.S. Potentiometric determination of the content of water-soluble organic amides. Fibre Chem. 2007, 39, 73–75. [Google Scholar] [CrossRef]
- Gil, S.; Reisin, H.D.; Rodríguez, E.E. Using a digital camera as a measuring device. Am. J. Phys. 2006, 74, 768–775. [Google Scholar] [CrossRef]
- Levin, N.; Benâ Dor, E.; Singer, A. A digital camera as a tool to measure colour indices and related properties of sandy soils in semi-arid environments. Int. J. Remote Sens. 2005, 26, 5475–5492. [Google Scholar] [CrossRef]
- Rossel, R.V.; Fouad, Y.; Walter, C. Using a digital camera to measure soil organic carbon and iron contents. Biosyst. Eng. 2008, 100, 149–159. [Google Scholar] [CrossRef]
- Suzuki, Y.; Endo, M.; Jin, J.; Iwase, K.; Iwatsuki, M. Tristimulus colorimetry using a digital still camera and its application to determination of iron and residual chlorine in water samples. Anal. Sci. 2006, 22, 411–414. [Google Scholar] [CrossRef] [PubMed]
- Hoguane, A.M.; Green, C.L.; Bowers, D.G.; Nordez, S. A note on using a digital camera to measure suspended sediment load in maputo bay, mozambique. Remote Sens. Lett. 2012, 3, 259–266. [Google Scholar] [CrossRef]
- Tang, B.; Sapiro, G.; Caselles, V. Color image enhancement via chromaticity diffusion. IEEE Trans. Image Process. 2001, 10, 701–707. [Google Scholar] [CrossRef] [PubMed]
- Cao, P.; Zhao, W.; Liu, S.; Shi, L.; Gao, H. Using a Digital Camera Combined with Fitting Algorithm and T-S Fuzzy Neural Network to Determine the Turbidity in Water. IEEE Access 2019, 7, 83589–83599. [Google Scholar] [CrossRef]
- Bao, X.; Liu, S.; Song, W. Using a PC camera to determine the concentration of Nitrite, Ammonia Nitrogen, Sulfide, Phosphate, and Copper in Water. Anal. Methods UK 2018. [Google Scholar] [CrossRef]
- Scatena, F.N. Drinking water quality. Drink. Water For. 2000, 2000, 7. [Google Scholar]
- White, M.; Feighery, L.; Bowers, D.; O’Riain, G.; Bowyer, P. Using digital cameras for river plume and water quality measurements. Int. J. Remote Sens. 2005, 26, 4405–4419. [Google Scholar] [CrossRef]
- Goddijn, L.M.; White, M. Using a digital camera for water quality measurements in Galway Bay. Estuar. Coast. Shelf. Sci. 2006, 66, 429–436. [Google Scholar] [CrossRef]
- San, L.H.; Jafri, M.M.; Abdullah, K. Aerial Photogrammetry Method for Water Quality Monitoring Using Digital Camera. Open Environ. Sci. 2009, 3, 20–25. [Google Scholar] [CrossRef] [Green Version]
- Leeuw, T.; Boss, E. The HydroColor App: Above Water Measurements of Remote Sensing Reflectance and Turbidity Using a Smartphone Camera. Sensors 2018, 18, 256. [Google Scholar] [CrossRef]


| Chromaticity (°) | |||||
|---|---|---|---|---|---|
| Standard solution | 20 | 55 | 150 | 265 | 430 |
| HS surface fitting | 18.07 | 50.00 | 151.63 | 264.54 | 456.72 |
| Error | 1.93 | 5.00 | 1.63 | 0.46 | 26.72 |
| Methods | Standard Solution (°) | Mean Error (°) | Std Dev (°) | ||||
|---|---|---|---|---|---|---|---|
| Standard solution | 20 | 55 | 150 | 265 | 430 | ||
| The proposed method | 18.07 | 50.00 | 151.63 | 264.54 | 456.72 | 7.15 | 5.46 |
| Spectrophotometry | 10.77 | 60.74 | 156.25 | 270.63 | 453.87 | 10.14 | 5.51 |
| Methods | Sample 1 | Sample 2 | Sample 3 | Sample 4 | Sample 5 |
|---|---|---|---|---|---|
| The Proposed Method (°) | 3.08 | 7.99 | 21.40 | 9.08 | 7.04 |
| Spectrophotometry (°) | 3.00 | 9.10 | 21.32 | 10.21 | 6.88 |
| Error (°) | 0.08 | 1.11 | 0.08 | 1.13 | 0.16 |
| Methods | Chromaticity (°) | t | p |
|---|---|---|---|
| The Proposed Method | 9.72 ± 3.09 | −0.09 | 0.93 |
| Spectrophotometry | 10.10 ± 3.06 |
| Solutes | Maximum Error (mg/L) | Minimum Error (mg/L) | Mean Deviation (mg/L) |
|---|---|---|---|
| Ammonia nitrogen | 0.02 | 0.00 | 0.008 |
| Phosphate | 0.081 | 0.000 | 0.031 |
| Chloride | 0.66 | 0.05 | 0.372 |
© 2019 by the authors. Licensee MDPI, Basel, Switzerland. This article is an open access article distributed under the terms and conditions of the Creative Commons Attribution (CC BY) license (http://creativecommons.org/licenses/by/4.0/).
Share and Cite
Cao, P.; Zhu, Y.; Zhao, W.; Liu, S.; Gao, H. Chromaticity Measurement Based on the Image Method and Its Application in Water Quality Detection. Water 2019, 11, 2339. https://doi.org/10.3390/w11112339
Cao P, Zhu Y, Zhao W, Liu S, Gao H. Chromaticity Measurement Based on the Image Method and Its Application in Water Quality Detection. Water. 2019; 11(11):2339. https://doi.org/10.3390/w11112339
Chicago/Turabian StyleCao, Pingping, Yuanyang Zhu, Wenzhu Zhao, Sheng Liu, and Hongwen Gao. 2019. "Chromaticity Measurement Based on the Image Method and Its Application in Water Quality Detection" Water 11, no. 11: 2339. https://doi.org/10.3390/w11112339