1. Introduction
It is acknowledged by many researchers [
1,
2,
3,
4,
5,
6] that urban water management needs a shift in practices. Water supply requires the replacement of unsustainable technical solutions, like creating ever new reservoirs, abstracting more groundwater, transferring water from other river basins, with the use of alternative water sources (treated, desalinated, and rain-harvested water), and water demand management, including policies that encourage water-use efficiency. However, this approach is obstructed by an increased uncertainty linked to the reaction of the public to different water demand management measures. Water end users tend to believe that water is abundant and attribute it to a hedonistic dimension linking its overuse to a higher quality of life. These attributions to water constitute difficult to foresee effects of different water demand management strategies to water demand behavior [
7].
In terms of water demand management, there are two main categories of available strategies: price and non-price. Price strategies consist of the manipulation of water prices to reduce water demand. Non-price strategies consist of awareness raising approaches, water use restrictions, water metering, incentives for water saving devices, leakage control and reduction, and water reuse [
8]. Nevertheless, whatever strategy is applied, it remains undisputed that households’ behavior is the factor that links population and domestic water consumption [
9].
The Water Framework Directive (2000/60/EC) [
10] requires European Union (EU) member states to ensure that users pay for the negative impact of water services on the environment, according to the “polluter-pays” principle, in order to reduce the impact and promote economic instruments [
11].
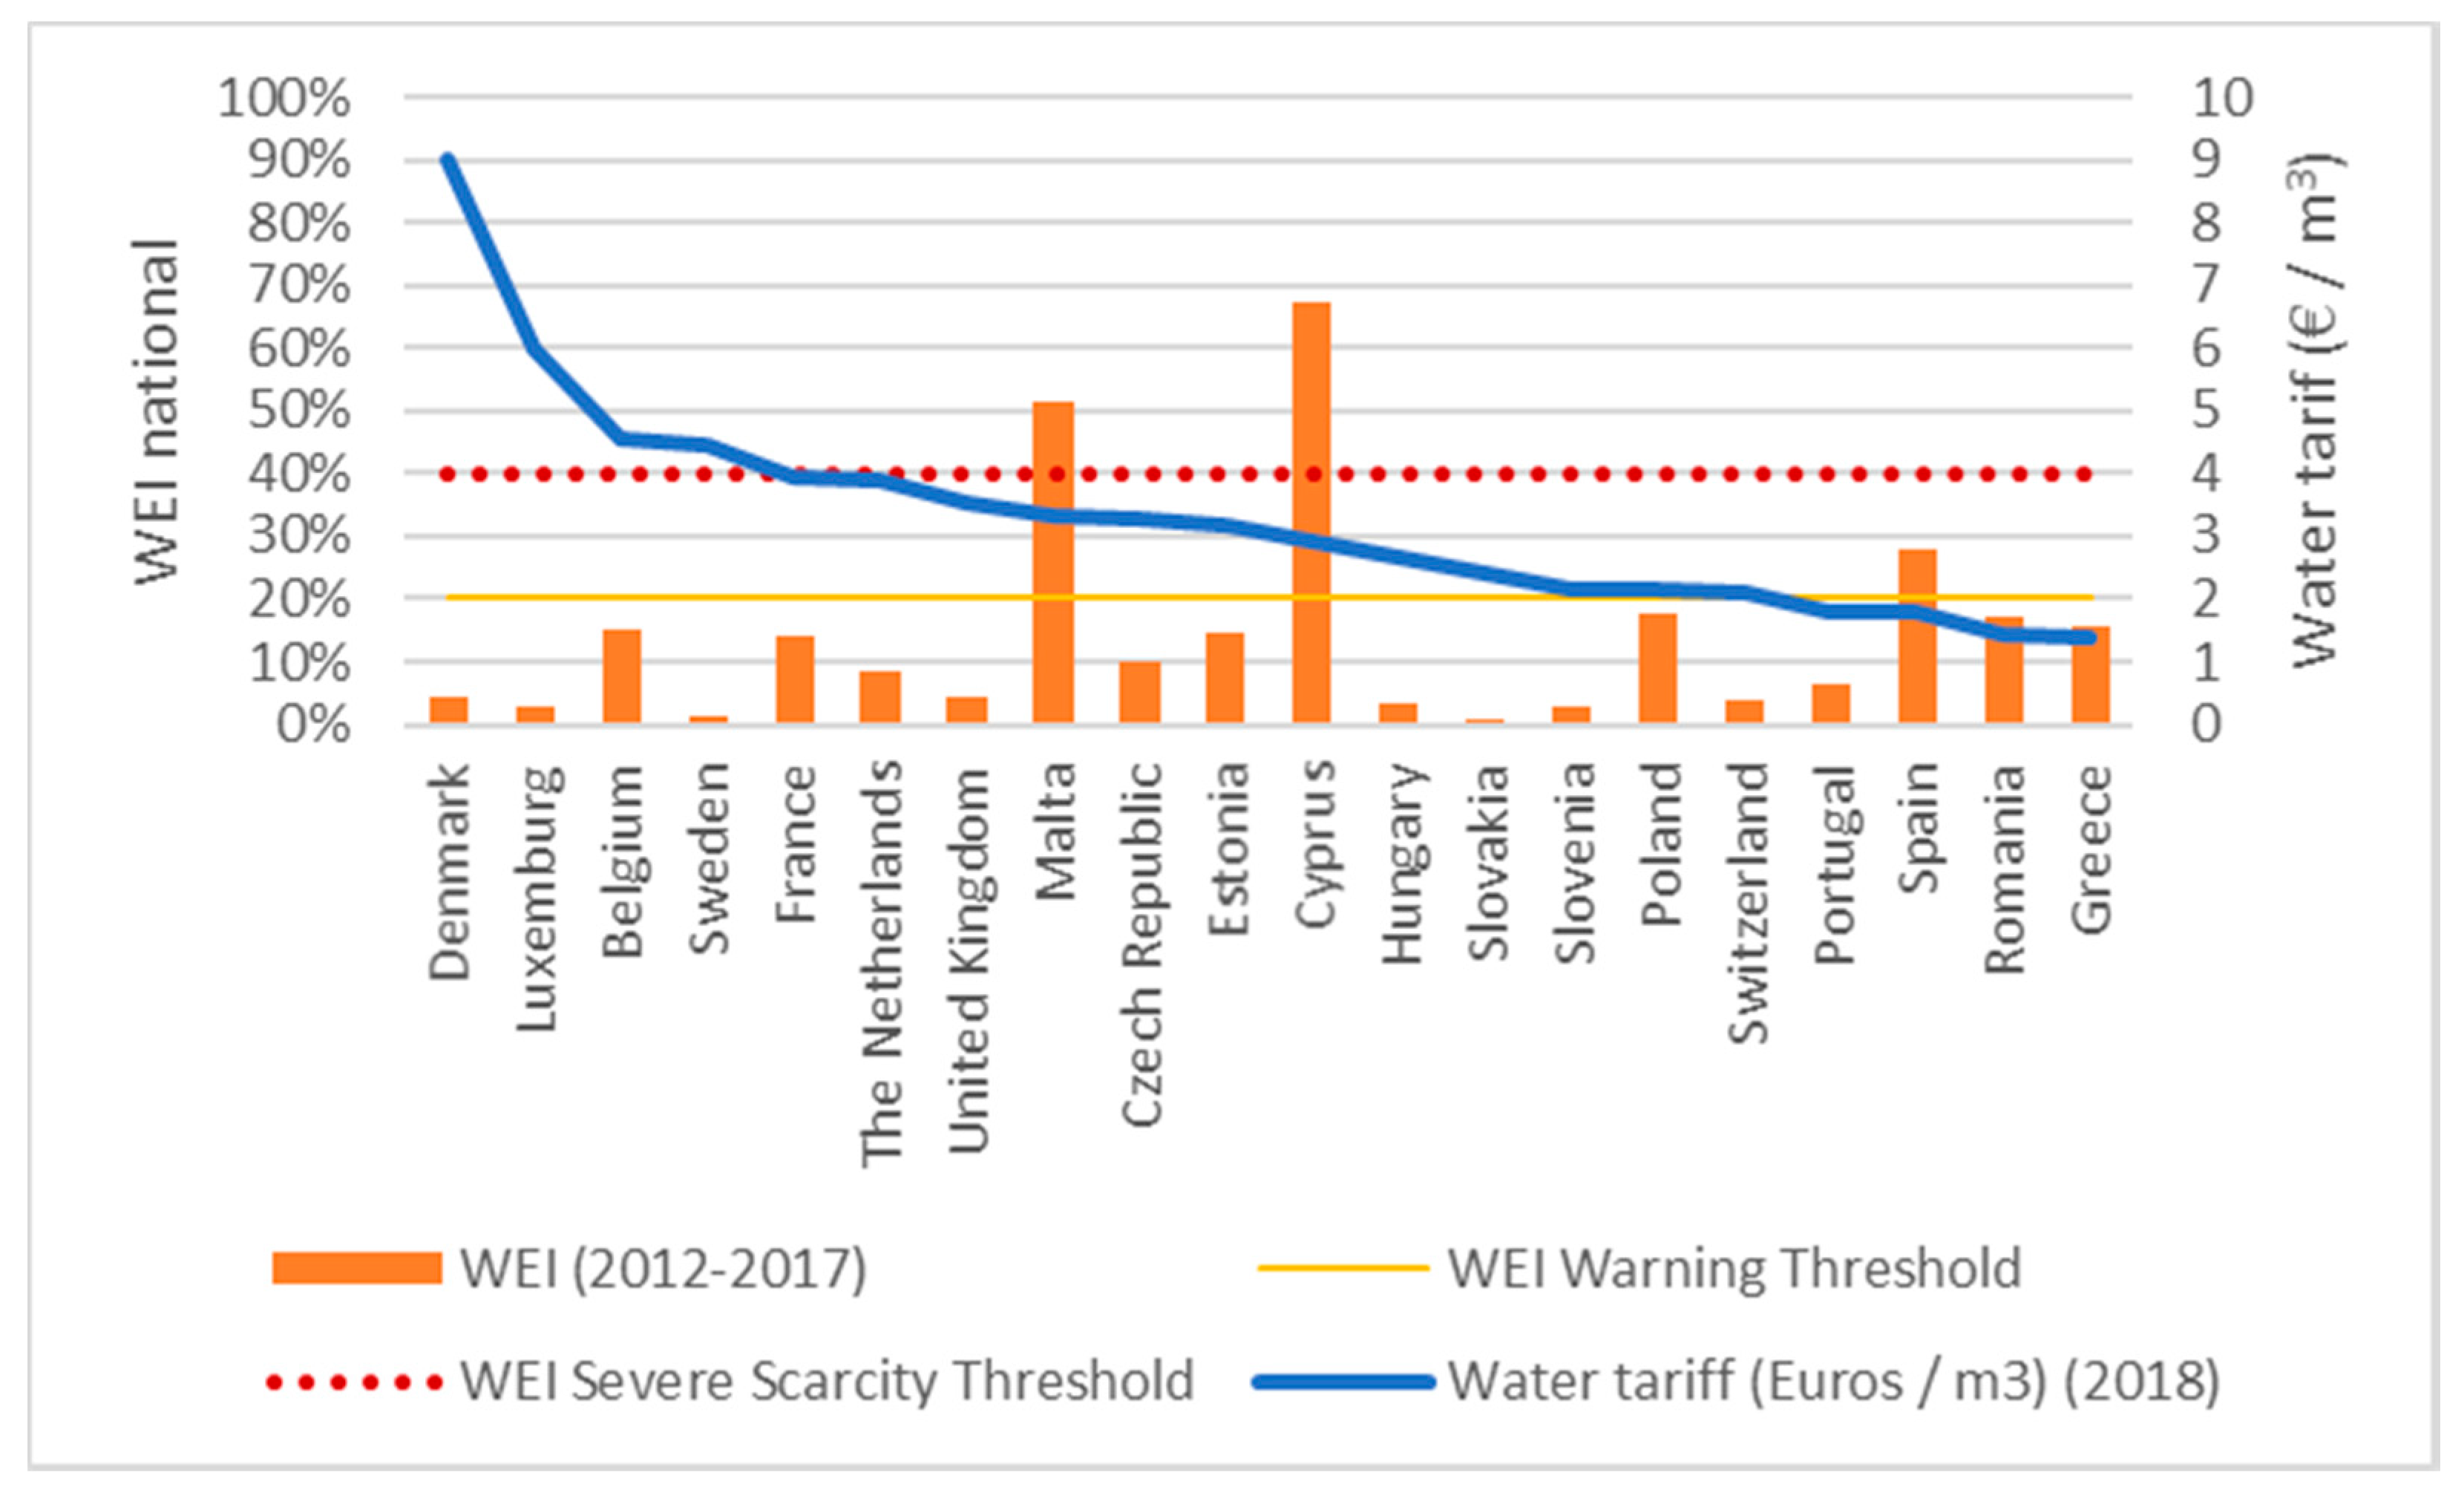
Figure 1 presents average water prices across EU countries [
12] and the water exploitation index (WEI). (The Water Exploitation Index (WEI) is an indicator, used by the European Environment Agency, for estimating the vulnerability of a country or river basin due to decreased quantity of water resources in respect of their water use needs.) For the corresponding EU countries [
13]. Contrary to expectations that countries with a high WEI would have a higher average water price (like Spain, Malta, and Cyprus), average water prices do not seem to correlate with water scarcity problems. This is supported by additional evidence reporting that water demand is price inelastic and exhibits low price elasticity (a price elasticity of −0.5 equals to a 5% decrease of water demand if price is increased by 10%) [
11].
Non-price demand management strategies such as water metering, incentives for water saving appliances, and awareness raising campaigns have been proposed and/or implemented for various applications.
Water metering has been identified as a prerequisite for effective water demand management policies [
11]. Imposing restrictions of certain water uses is a reactionary water demand management approach [
14] that produces results when imposed. Water restrictions could also be capable of creating risk perception, when imposed rarely. However, it has been concluded that in areas where restrictions due to drought conditions are common, households are more willing to deal with short time restrictions rather than pay to alleviate them [
15].
In terms of retrofitting water saving appliances, the effectiveness of this measure is entirely due to the ratio of water used between the new and old appliance. In general, toilet cistern and washing machine replacement gives the higher water conservation [
16]. However, one must take into consideration the behavior shift of someone that retrofits a water saving appliance (i.e., “since it is water saving, I can use it more”).
Awareness raising campaigns are a tool used for educating the public. These campaigns mainly warn the public that water resources are at risk and encourage conservation. However, the public’s uncertainty regarding the actual state of water resources and the frequent use of campaigns to preserve the long-term state of the resources, may actually decrease the effectiveness of awareness raising campaigns, just as people eventually ignored the boy who cried wolf [
17]. Furthermore, it has been concluded that campaigns work better when relevant climate conditions like drought exist [
16]. The reason for this is that when the risk of water scarcity is low, citizens tend to believe that water is affluent, thus paying no attention to water saving awareness campaigns [
18].
Sustainable resource governance has been a research focus for at least the past decade [
19]. It has been concluded that governance needs to shift towards an adaptive model that utilizes learning outcomes and alters their processes on the way [
19]. Applying an adaptive approach to water resources management in decision making is challenging since it requires managing both supply and demand of water within a complete urban water cycle framework [
20]. Such an approach, however, requires tools that can analyze and simulate the complete cycle including both the physical and social dimensions [
21].
The scientific community has advanced creating simulation tools that are able to simulate the urban water cycle as realistically as possible. In particular, several tools exist for the management of the urban water system that models water supply and demand within a common framework [
20,
22,
23]. However, even these comprehensive approaches cannot effectively simulate the socioeconomic component and quantify how behaviors are shaped by external stress factors, such as climatic, economic, and political conditions. Furthermore, the scientific community is currently working to create methods for estimating urban water demand, focusing mainly in bottom-up approaches [
24,
25]. Nevertheless, there is still only a small number of scientific works that aim to assess how urban domestic water demand is affected from external shaping factors [
26,
27,
28].
In this research project, an agent-based modeling (ABM) tool will be used to simulate the behavior of the water users of the urban water system. Particularly, the urban water agents’ behavior (UWAB) tool will be used. The UWAB simulates the water demand behavior of households and how it is influenced by water demand management policies and external (e.g., climatic, environmental, social) pressures [
26].
2. Materials and Methods
This work presents the implementation of the UWAB tool [
26,
29,
30,
31] in a series of scenarios for different water demand and supply levels and assesses the effect of different water demand management strategies on the urban water system of Athens. UWAB was created to simulate the effects of environmental pressures and water demand management policies on the water saving behavior of urban households [
26,
29,
30,
31]. UWAB’s reactive agents represent urban households whose attitudes towards water conservation are influenced by their social network and by other external factors, such as water policies (i.e., water price changes, awareness raising campaigns, drought awareness, and restrictions).
UWAB and its application to the Athens urban water system has been extensively described in [
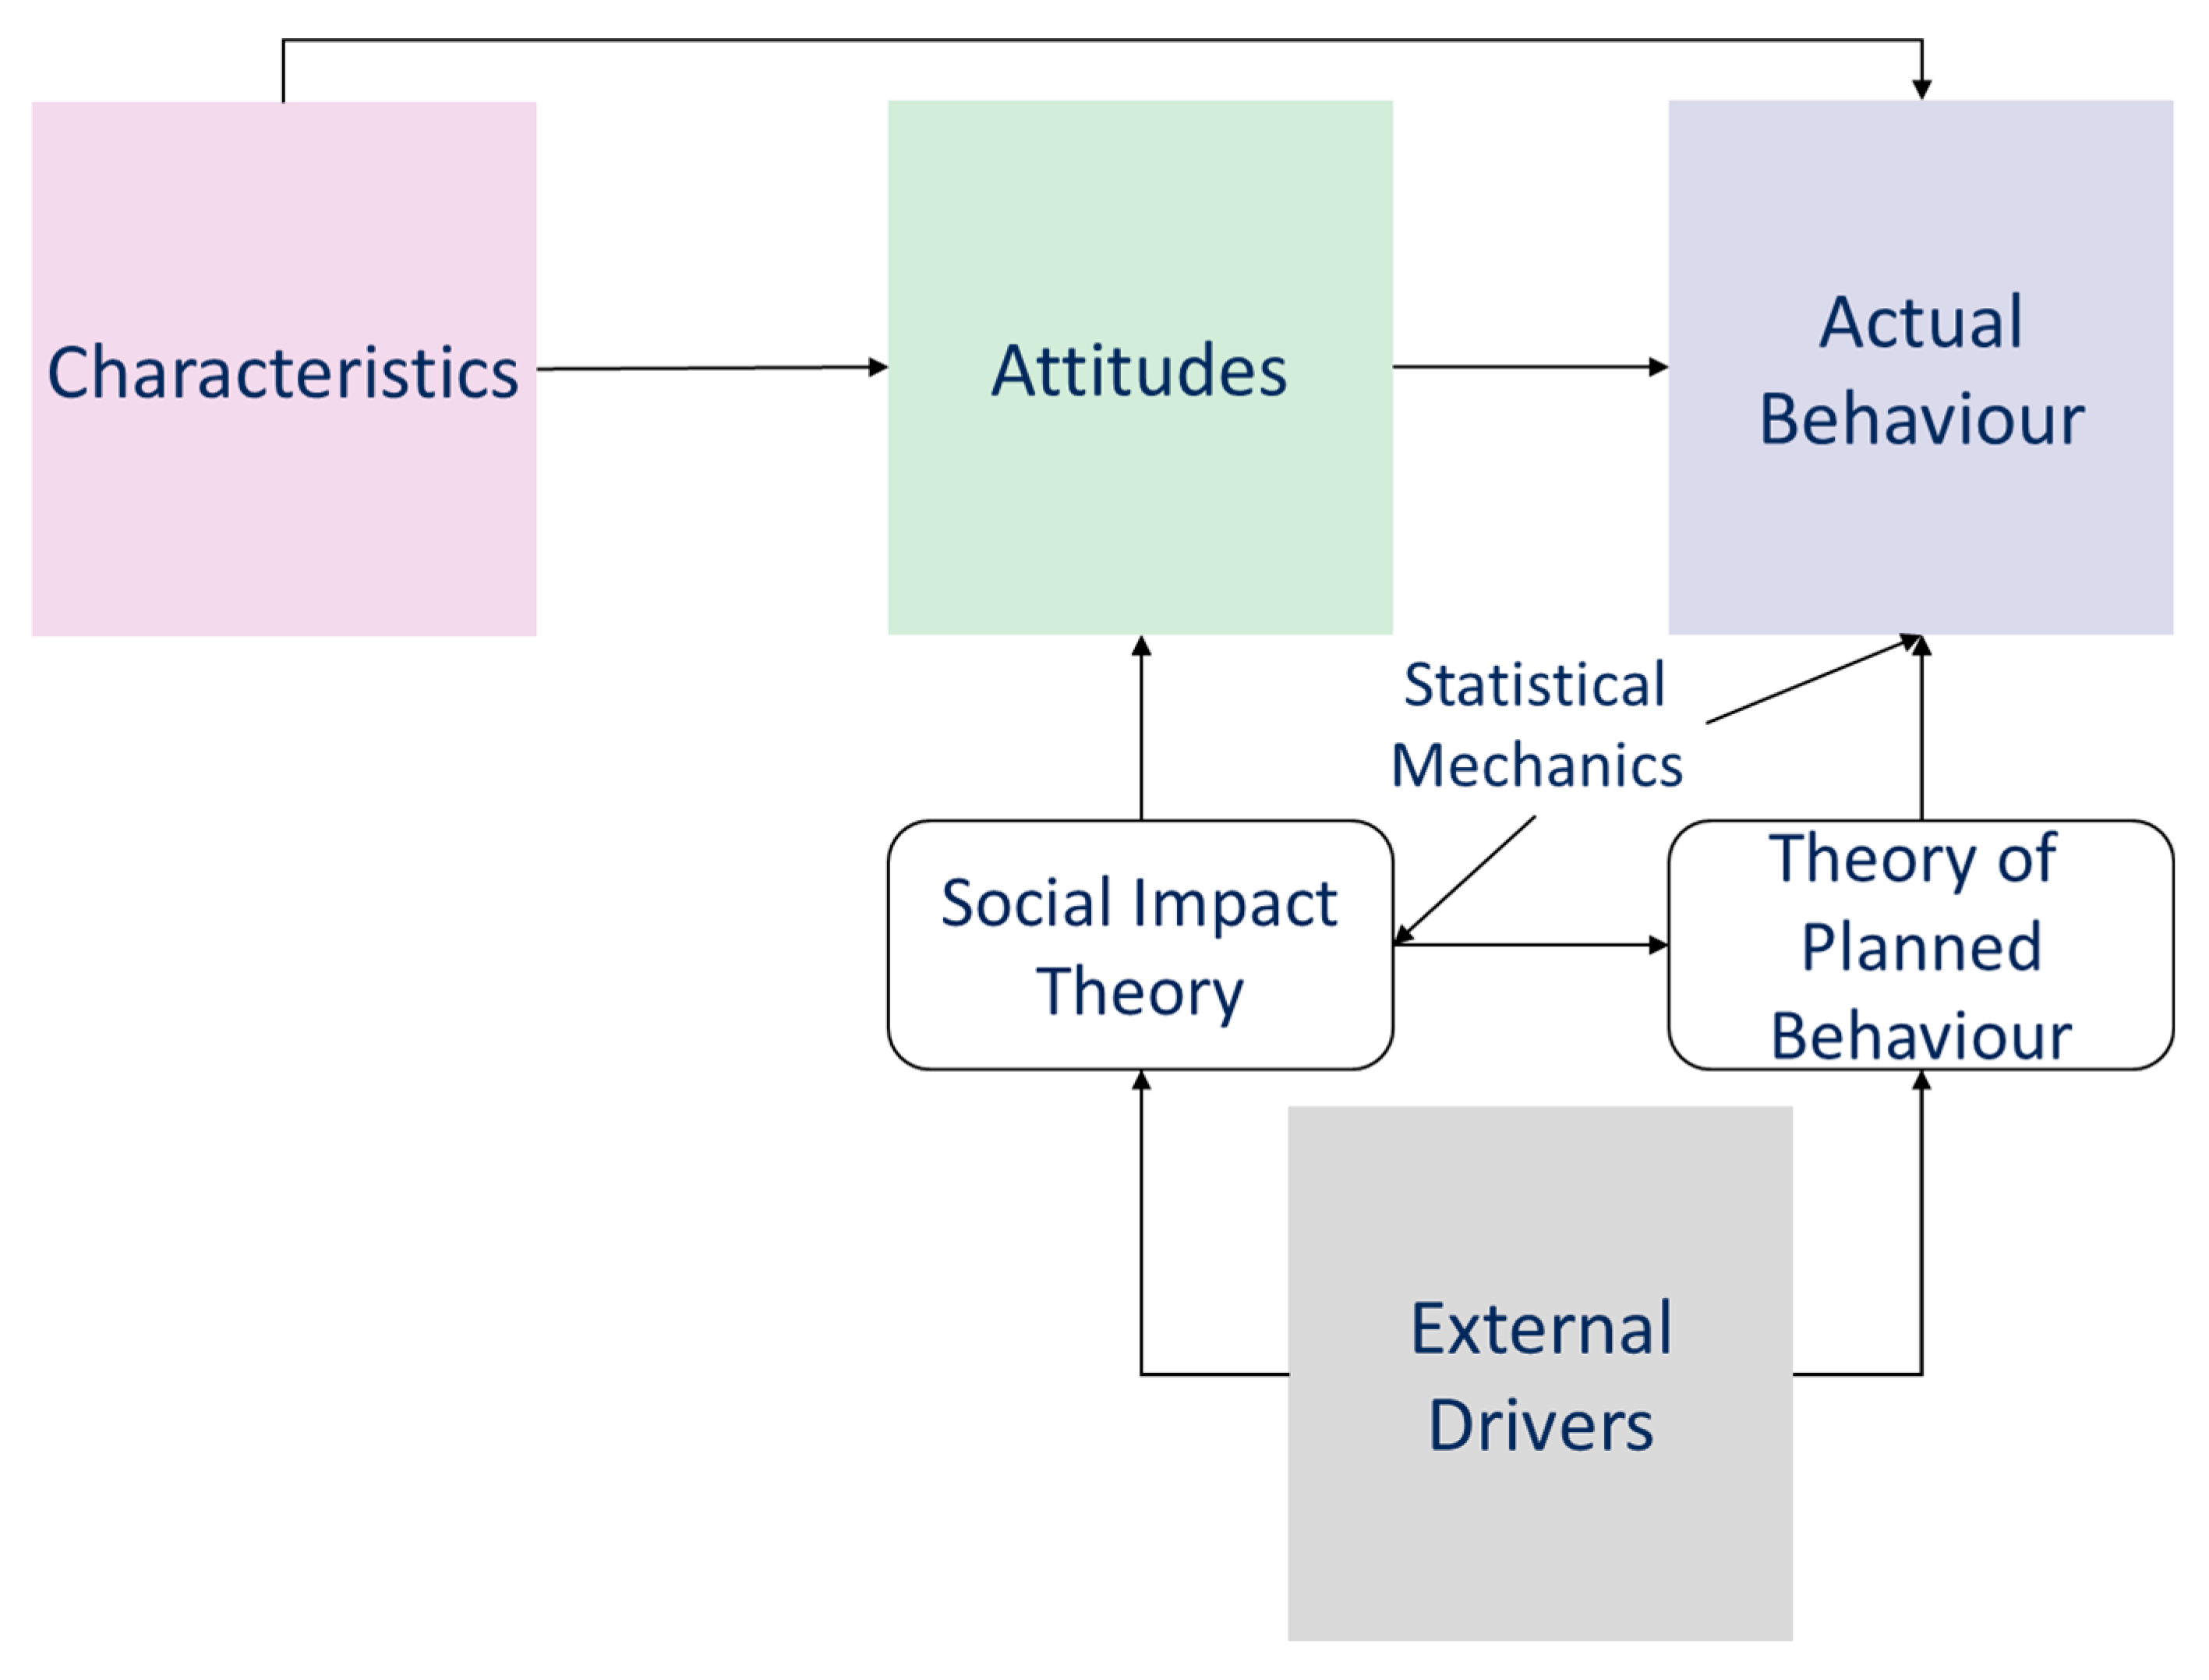
26]. However, for matters of completeness, the following describes the procedure followed by UWAB’s household agents. As seen in
Figure 2, household agents have specific sociodemographic characteristics and water demand types that influence their water demand behavior. The agents shape their water conservation attitude (against or in favor to), following the social impact theory [
32], which is influenced by external factors (water policies and water drought conditions) and their social network. If an agent’s attitude is in favor of water conservation then the agent’s strength of intention is estimated, following the theory of planned behavior [
33], in order to choose a water conservation behavior. The agents’ social network is depicted using the scale-free network [
34]. At the end of each time step UWAB calculates the number of household agents that have selected each water conservation level. The resulting water consumption can be then calculated by aggregating the water consumption of the different water demand types and water conservation levels.
UWAB has been applied in the case of Athens, Greece and was calibrated to depict the historical drought of the 1990s in Athens, Greece [
26]. This calibrated model is used in this study to assess the effect of water demand management strategies to the Athens urban water system. In this work, seven water demand management strategies, five water demand scenarios, and 10 synthetic water supply decades of net inflow to the Athens urban water system were developed and examined. Firstly, the baseline water demand scenario was used to select those synthetic water supply decades that created an imbalance in the system. This process identified three water supply time series, which were used to assess the impact of the different water demand scenarios without implementing any water demand management policies. This was done to identify the behavior of the urban water system against different water demand volumes under a “do nothing” scenario. This procedure identified which combination of water supply time series and water demand scenarios caused the Athens urban water system to fail by not being able to meet the requested water demand. Then, experiments of water demand management strategies were created to assess the effect of different demand management strategies to these “extremes” and to decrease or even eliminate unmet water demand.
The purpose of this exercise is to demonstrate the ability of UWAB to support decisions-makers in planning water demand management strategies. It does not aim to propose measures for the Athens urban water system, although the results of the scenarios provide a “glance” into what-if scenarios regarding the evolution of the system’s performance.
2.1. Water Demand Management Strategies
Seven water demand management strategies were designed following the basic notions of the demand management strategy that was applied during the Athens drought period of 1988–1994 [
26,
29,
30,
31]. The designed water demand management strategies are built trying to answer what-if questions, adding extra measures serially and assessing the effect of these supplementary measures to the domestic water demand behavior. These water demand management strategies are presented in
Table 1.
2.2. Water Demand Scenarios
The UWAB model was calibrated using the Athens drought period of 1988–1994 [
26] and was updated to account for sociodemographic differences reported in the most recent Greek National Statistical Office’s data (the 2011 Census). These included the household population, the distribution of the household members, age levels, housing conditions, and education levels. In terms of the income level, it was decided to be left at the same levels as those of the 1990s, representing the economic crisis (OECD, 2013). Furthermore, based on the results of an online survey in 2015, 30% of the household-agents population was set to have an initial positive attitude towards water conservation. This value is not far from the calibrated parameter value of the model (26%) [
26].
Five water demand scenarios were built: a baseline scenario, an increased water demand behavior scenario, and three population increase scenarios.
The baseline scenario is based on the water demand of 2009, while the increased water demand behavior scenario is based on an increase of the frequencies of use due to an (assumed post crisis) quality of life increase. The Athenian population has been projected to either remain unchanged or slightly decrease in the next decade, due to both an aging population and a persisting economic crisis [
35]. However, the total water withdrawal from the water treatment plants of the Athens Water Supply and Sewerage Company (EYDAP S.A.) could increase, if EYDAP S.A. decides to directly provide water to more municipalities. The population increase scenarios assess cases of 7%, 12%, and 22% increase of the population served by EYDAP S.A. that correspond to an increase in water demand of around 30%, 45%, and 50%, respectively, compared to current water withdrawals.
The water demand scenarios are the same with those examined in a recent raw water cost study [
36] for EYDAP S.A. In that study, which was formally adopted by both ministry of Public Works and EYDAP S.A., the 95% reliability factor was considered as the lowest acceptable level for the safe operation of the Athens hydrosystem. The water demand scenarios are presented in
Table 2.
Based on EYDAP data [
37], the abstracted water from the four water treatment plants is used as follows: 50% for domestic use, 28% is lost from the distribution system, and the remaining 22% is used from municipal, industrial, and commercial activities.
2.3. Water Supply Time Series
The urban water optioneering tool (UWOT) [
1] of the Athens hydrosystem used for this part of the work was taken from a former study [
38]. This model was calibrated to recreate the results of the Hydronomeas model [
39], which is used by EYDAP to analyze the Athens hydrosystem, for a 99% reliability level. The UWOT model of Athens external hydrosystem uses as input time series the net water inflow to the four water reservoirs that supply water to Athens (Hylike, Marathons, Mornos, and Evinos).
The 100 years monthly time series were divided into decades and 10 different time series of net inflow were created for each one of the reservoirs. The initial water storage of the reservoirs was set to that of the 30th of September 2014. The synthetic time series were created using the Castalia software [
40,
41] and historical time series of precipitation and evapotranspiration for the four river basins that provide inflow to the corresponding reservoirs [
38]. The simulation ran, with a monthly time step, from October 2014 to September 2024.
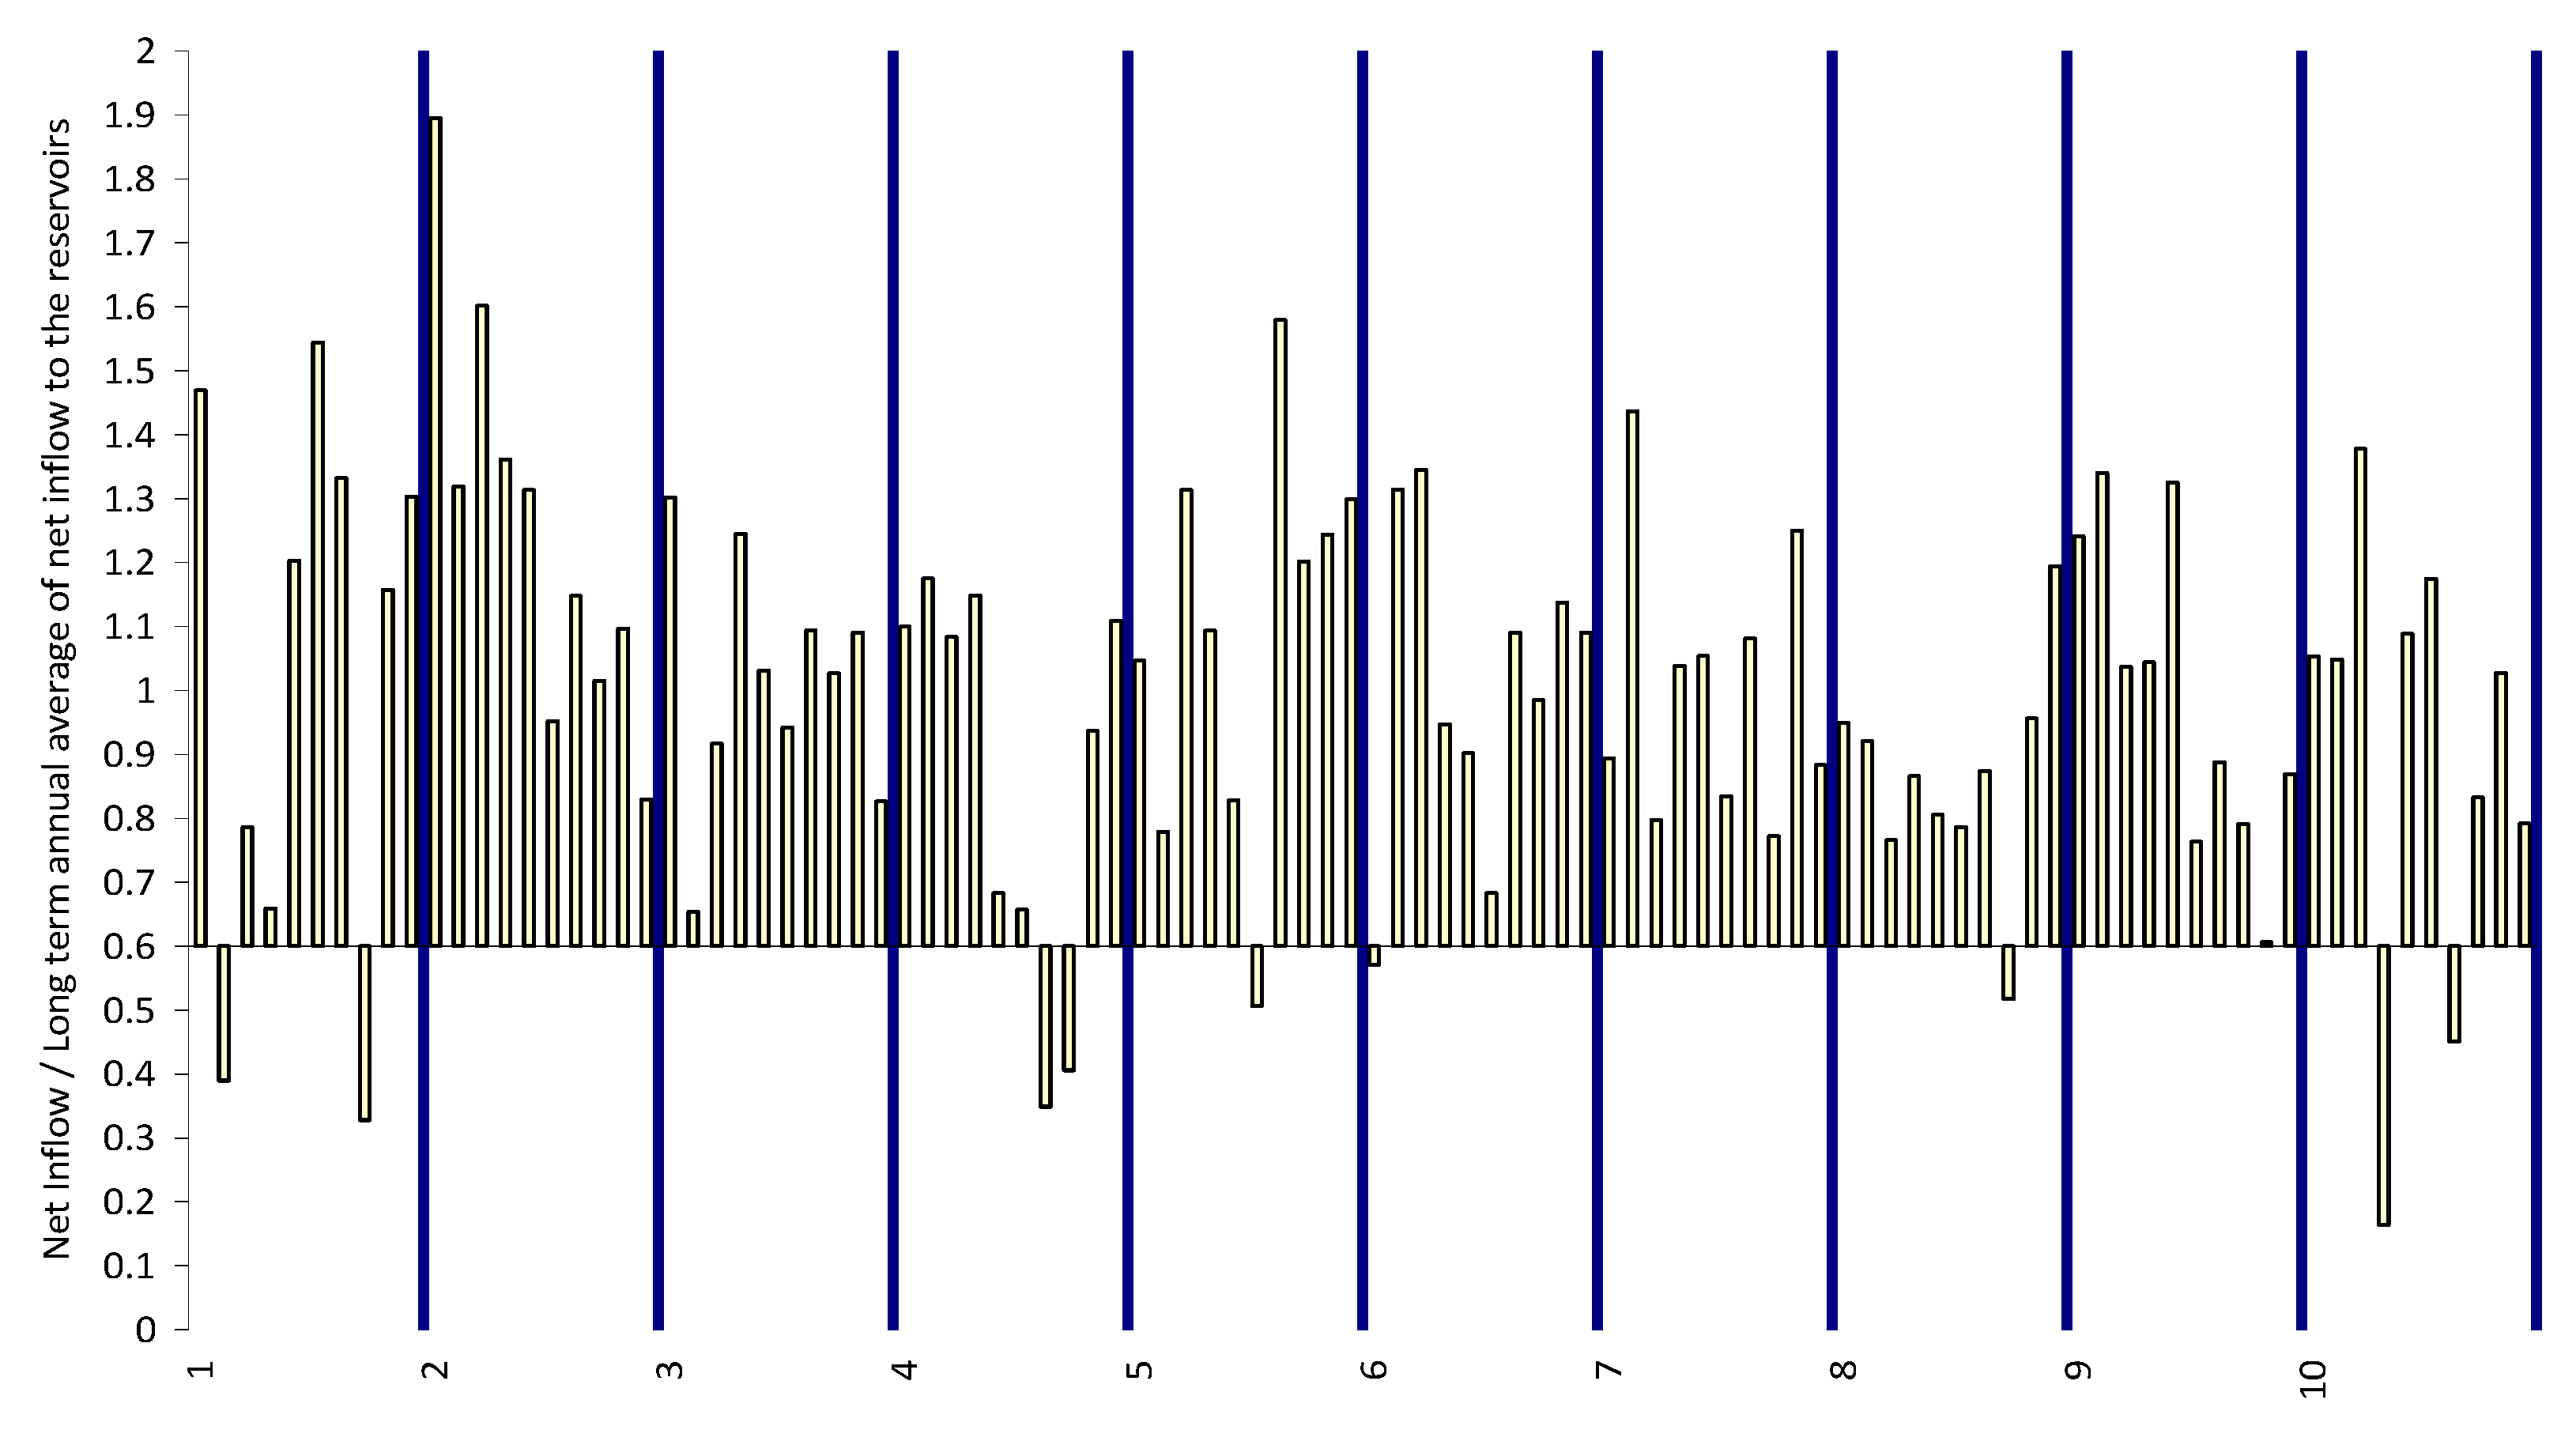
The experiments of water demand management strategies are built by taking into account an external (natural) pressure: water availability. Water availability is important for UWAB model since it is one of the factors affecting domestic water demand behavior of the household-agents. In the case of the Athens drought this factor was set based on historical information available, regarding the onset and the end of the drought period. For the purposes of the scenarios, a low water supply index was estimated by comparing the average net inflow with the long term annual average net inflow. The low water supply index was set to zero, signifying a “normal” year, if the average annual net inflow was more than 60% that of the long-term annual average. The low water supply index was set to one, indicating a year of reduced net inflow to the reservoirs, if the average annual net inflow was less than 60% that of the long-term annual average (
Figure 3). This threshold of 60% identified three decades, numbered 1, 4, and 10, which include two years with low available water storage and these were selected as the “worst case” scenarios used to test the water demand management strategies.
3. Results
The following paragraphs present the effect of each water demand scenario to the Athens’ hydro system for the three water supply scenarios that were identified as “worst cases” (1st, 4th, and 10th time series in
Figure 3) without implementing any water demand management strategy.
UWOT was used to produce the households’ water demand time series. UWOT was setup to model the water consumption of the average Athenian household of 2013 using the results of an online survey [
30] and the results of the UWAB calibration to the Athens urban water system [
26]. It was assumed that the types of appliances have not changed from those used in estimating water demand for the Athens drought period case study of the 1990s [
26]. However, the water consumption of some of these appliances, the kitchen sink, the hand basin and the washing machine, has been updated to more recent technologies with lower consumption. These in-house water appliances and their corresponding water consumption are:
Conventional kitchen sink (consuming 2.1 liters per use [
42])
Conventional hand basin (consuming 2.1 liters per use [
42])
Conventional dish washer (consuming 35 liters per use [
8])
Conventional toilet cistern (consuming 9 liters per use [
8])
Conventional washing machine (consuming 60 liters per use [
42])
Conventional shower head (consuming 60 liters per use [
43])
Conventional 30-meter hose for outdoor uses (consuming 10 liters per use [
43])
The mean frequencies of use for each appliance were estimated to allow UWOT to simulate the water demand of Athenian households that adds up to a total water withdrawal from the water treatment plants equal to the water demand scenario consumption. Scenario 1 (baseline) and 2 have different frequencies of use (see
Table 2) while water demand scenarios 3, 4, and 5 use the setup of the water demand scenario 1. The frequencies of use of the appliances were assigned higher than that of the Athens drought period case study to depict the increase of living standards and the decrease of water use of several appliances (kitchen sink, wash basin and washing machine).
There is almost a 50% difference between the frequencies of use used for the water demand scenario 1 (baseline) for the different water user types with those reported by the respondents of the online survey [
30]. This discrepancy is mainly attributed to the fact that the estimated frequencies of use were reverse engineered to result in a predetermined water demand per water user type (which is itself a scenario rather than current reality). It should also be noted that these average frequencies are in fact compensating for households that are empty most of the day (employed young people) as well as houses that are mostly full (retired or families with small children). As such, these should not be expected to match well with actual reported frequencies of specific households. It is highlighted that there is more than one combination of mean frequencies of use for the selected appliances that will result in the required water demand and as such the frequencies are not to be treated as findings of the study but rather as simply scenarios whose purpose is to parameterize UWOT (
Table 3).
The water demand was used to produce water bills for the household agents using the tariffs of December 2013 [
44]. UWAB ran without any water demand management strategy in place and household agents’ water conservation attitude was influenced by their social network (in and out of the area under investigation) and by drought conditions. The calibrated experimental variables were used [
26]. The model results were estimated by the mean value of ten consecutive UWAB simulations to decrease the effects of outliers. The simulation ran, with a monthly time step, from October 2014 to September 2024.
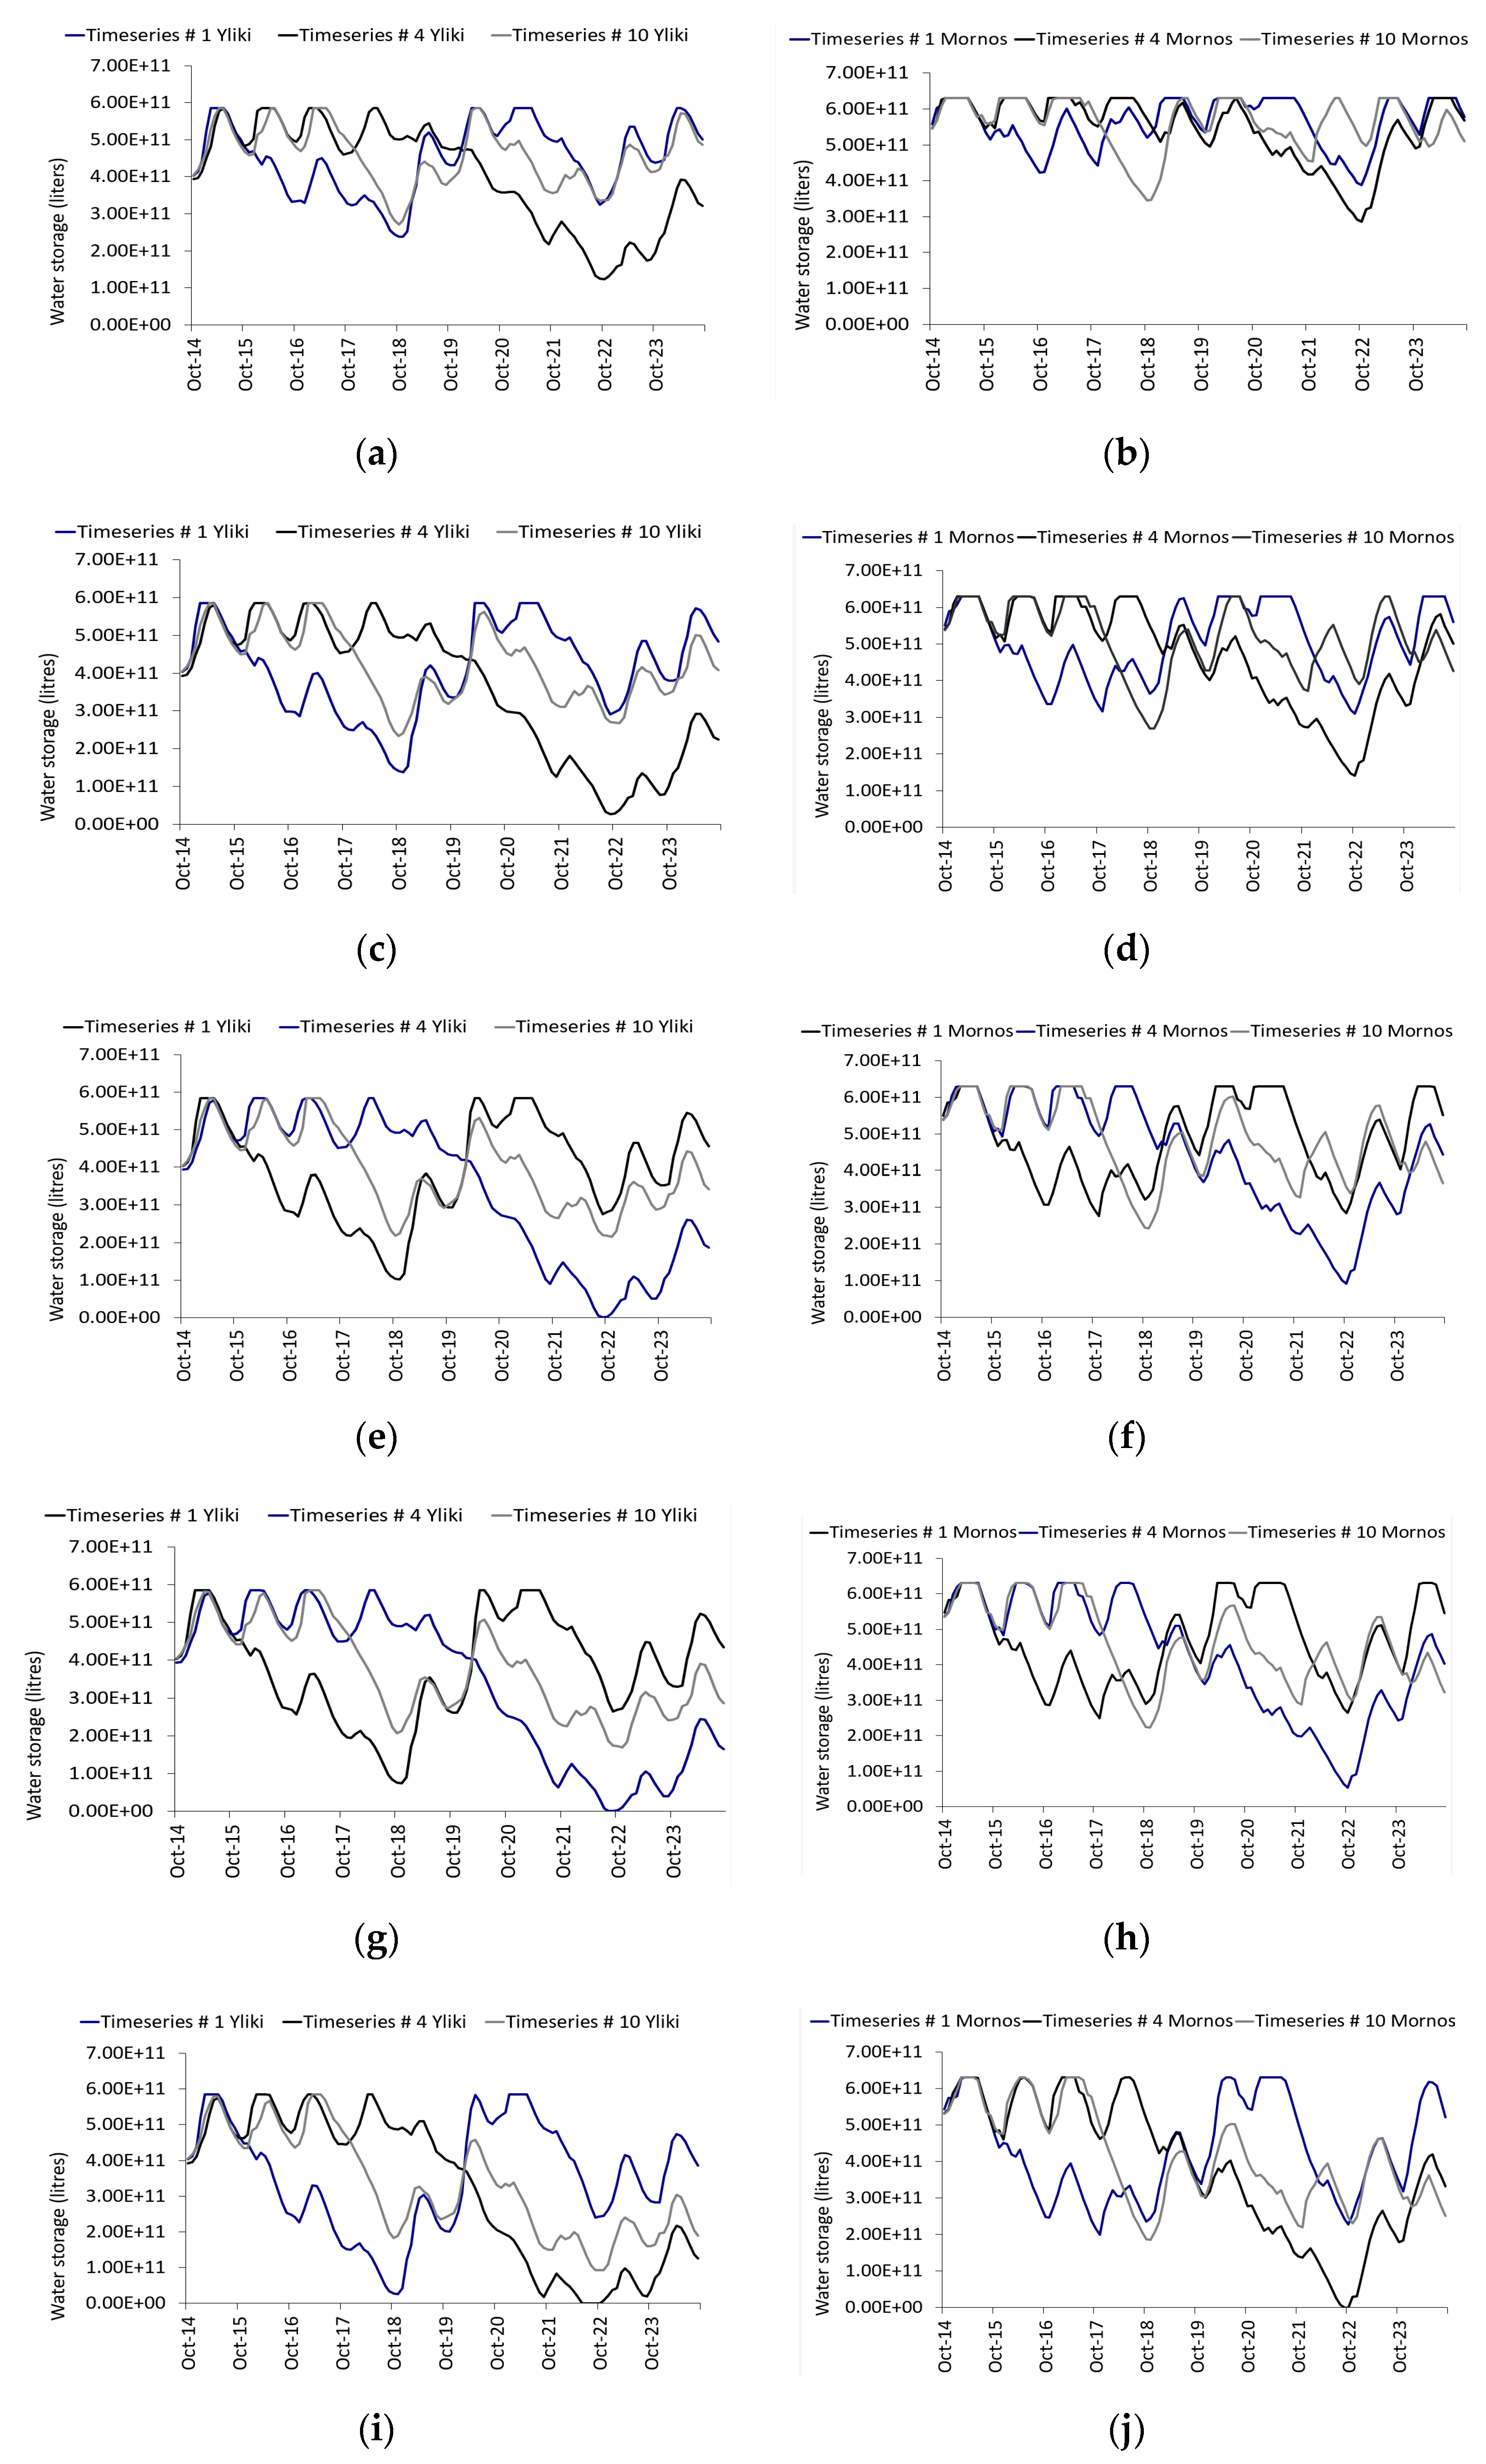
The reaction to the water demand Scenario 1 (baseline) of the two main water supply reservoirs of Athens, Hylike, and Mornos for the three water supply time series (number 1, 4, and 10) that demonstrated a low water availability (see
Figure 3) is satisfactory without any failures present for water demand Scenarios 1 and 2 (see
Figure 4a–d). For water demand Scenarios 3, 4, and 5 the hydrosystem failed (see
Figure 4e,g,i) to provide the water demanded in water supply scenario 4, resulting in:
Scenario 3: 1350 million liters of unmet demand in September 2022 from the Hylike reservoir (see
Figure 4e)
Scenario 4: 13.700 million liters of unmet water demand in August 2022 and 708 million liters of unmet water demand in September 2022 from the Hylike reservoir (see
Figure 4g)
Scenario 5: 62.900 million liters of Hylike’s unmet water demand from June to September 2022 and a total of 27.200 million liters of Mornos’ unmet water demand during September and October 2022 (see
Figure 4i,j)
Table 4 summarizes all the combinations of water demand scenarios and water supply time series and presents those that failed to meet the required demand. These were water demand scenarios 3, 4, and 5 for the water supply time series 4.
Testing Alternative Water Demand Management Strategies
Seven experiments of the water demand management strategies are investigated using UWAB. These experiments are implemented to those “challenging” water demand scenarios 3, 4, and 5 and for the specific water supply time series 4.
Table 5 presents the assessed strategies and how they combine different policies in time and the occurrence of drought in two consecutive months. The simulation ran, with a monthly time step, from October 2014 to September 2024.
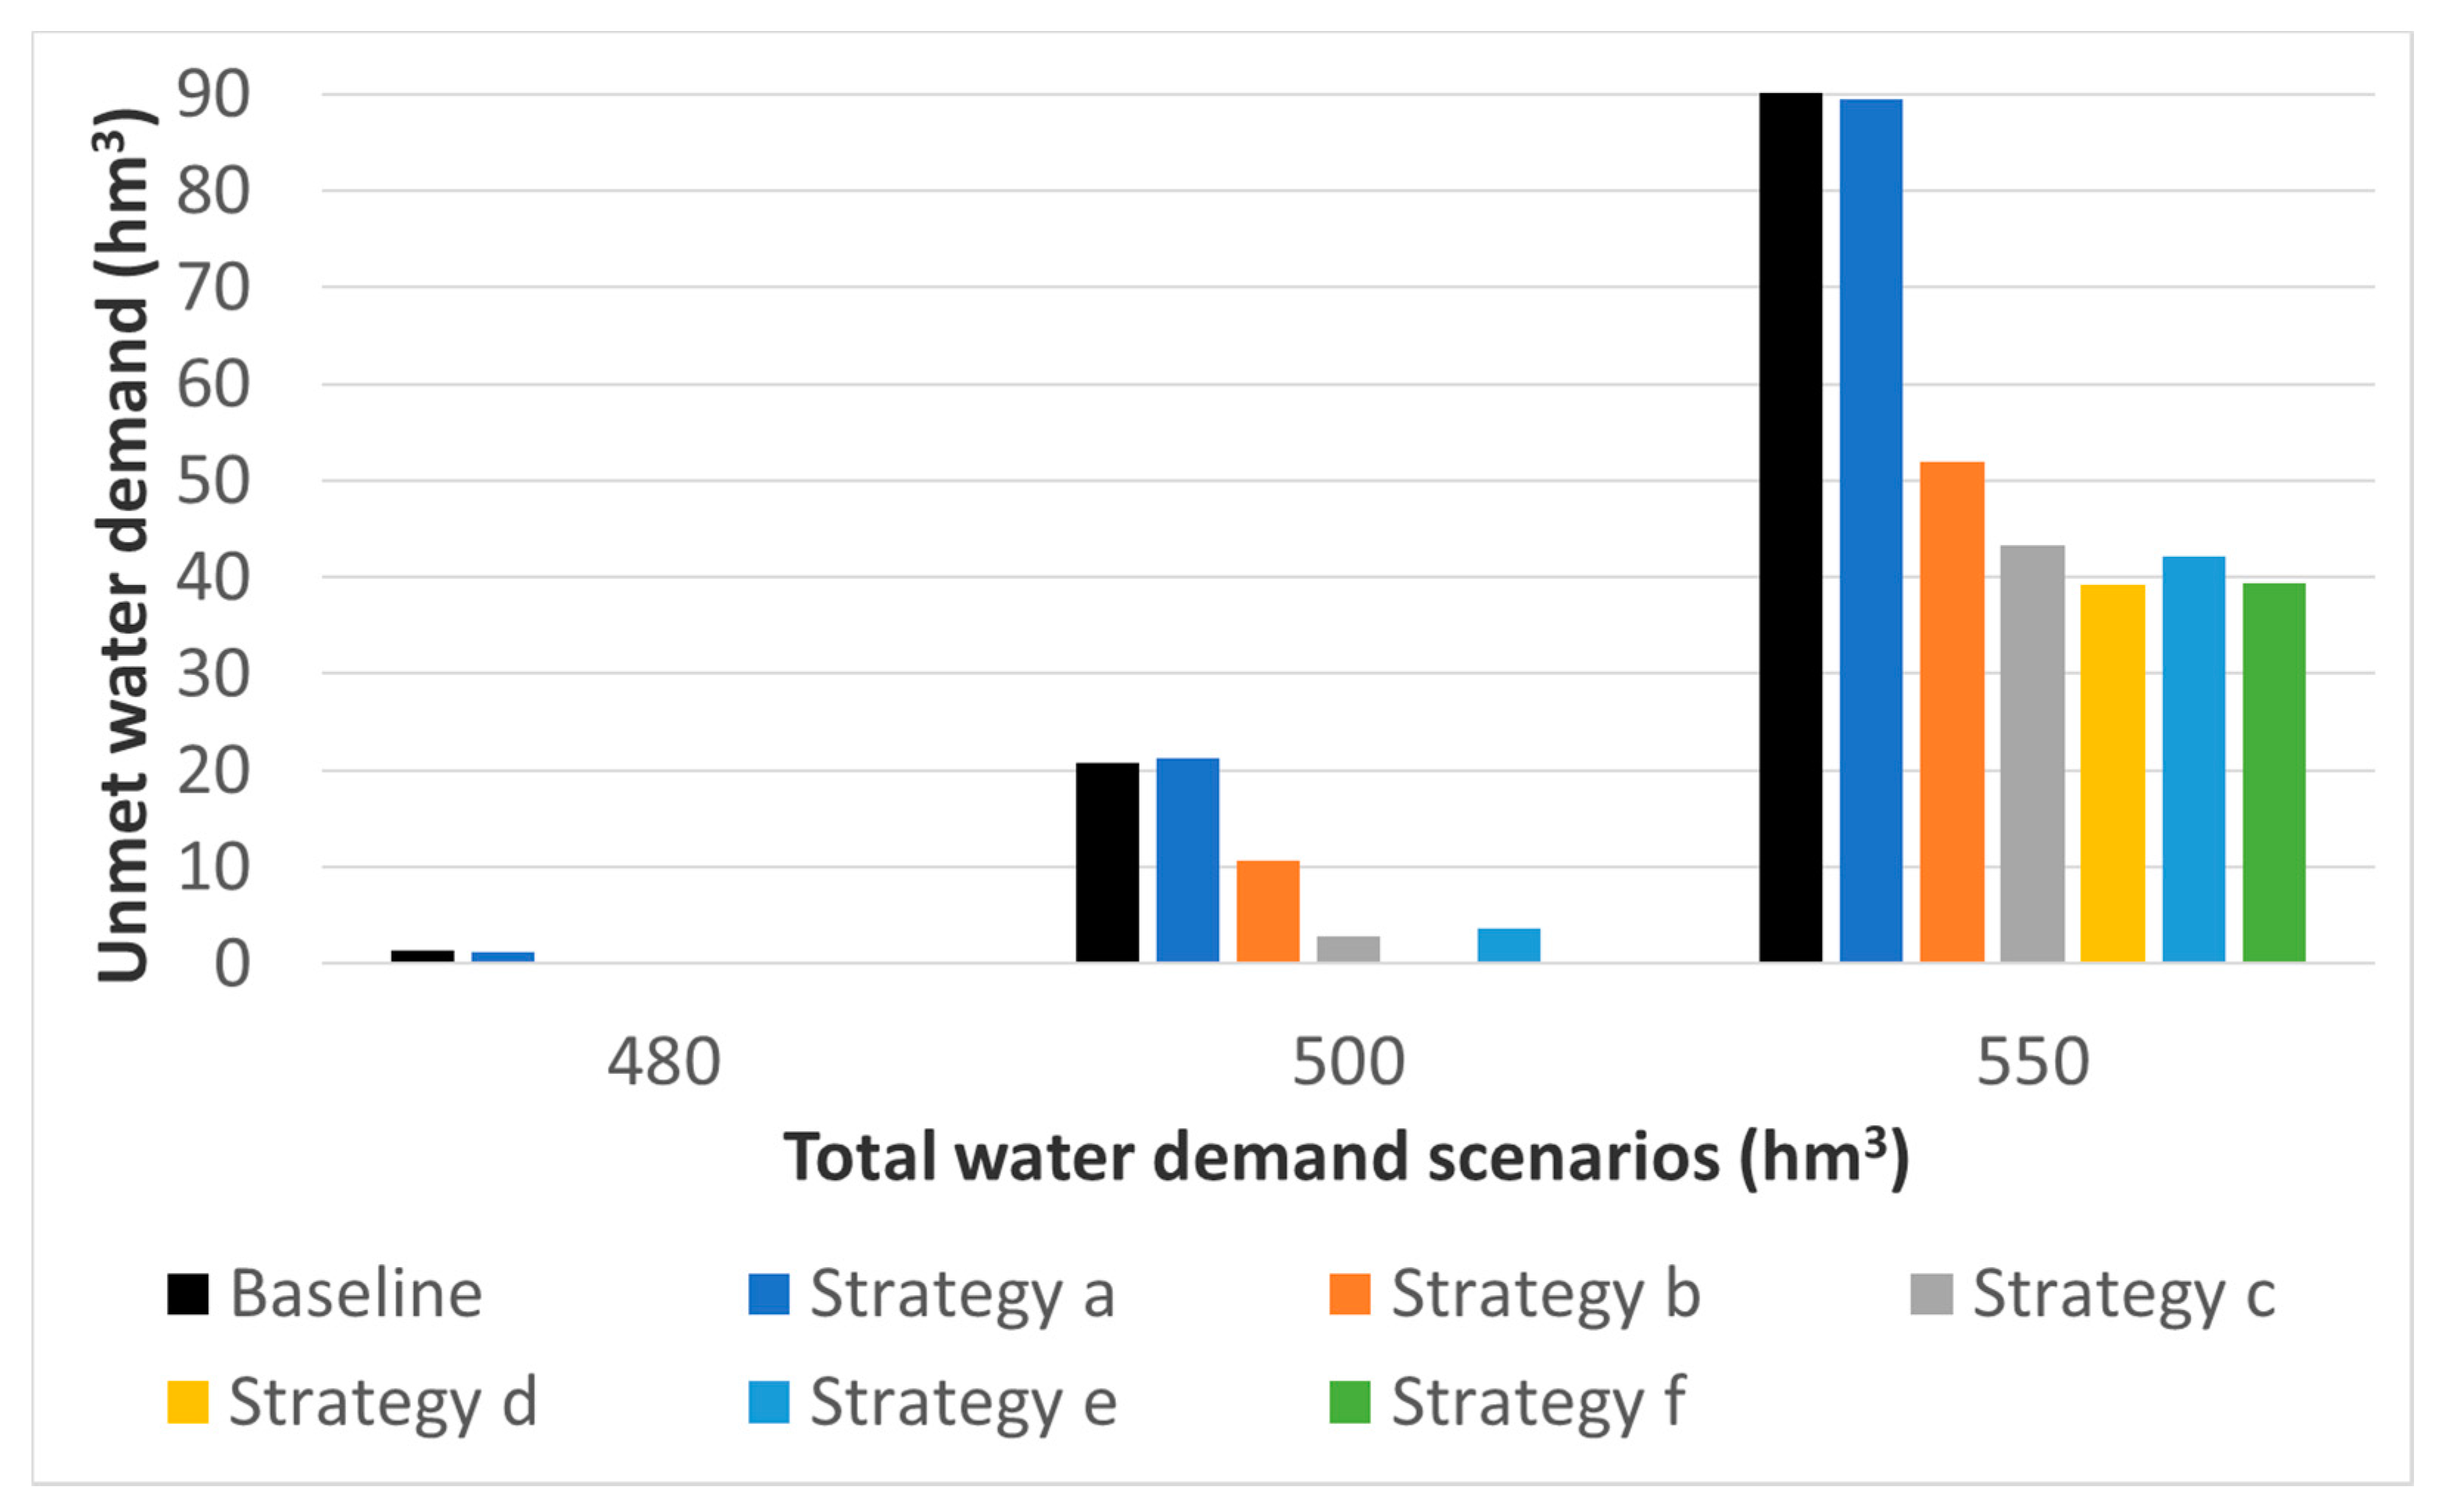
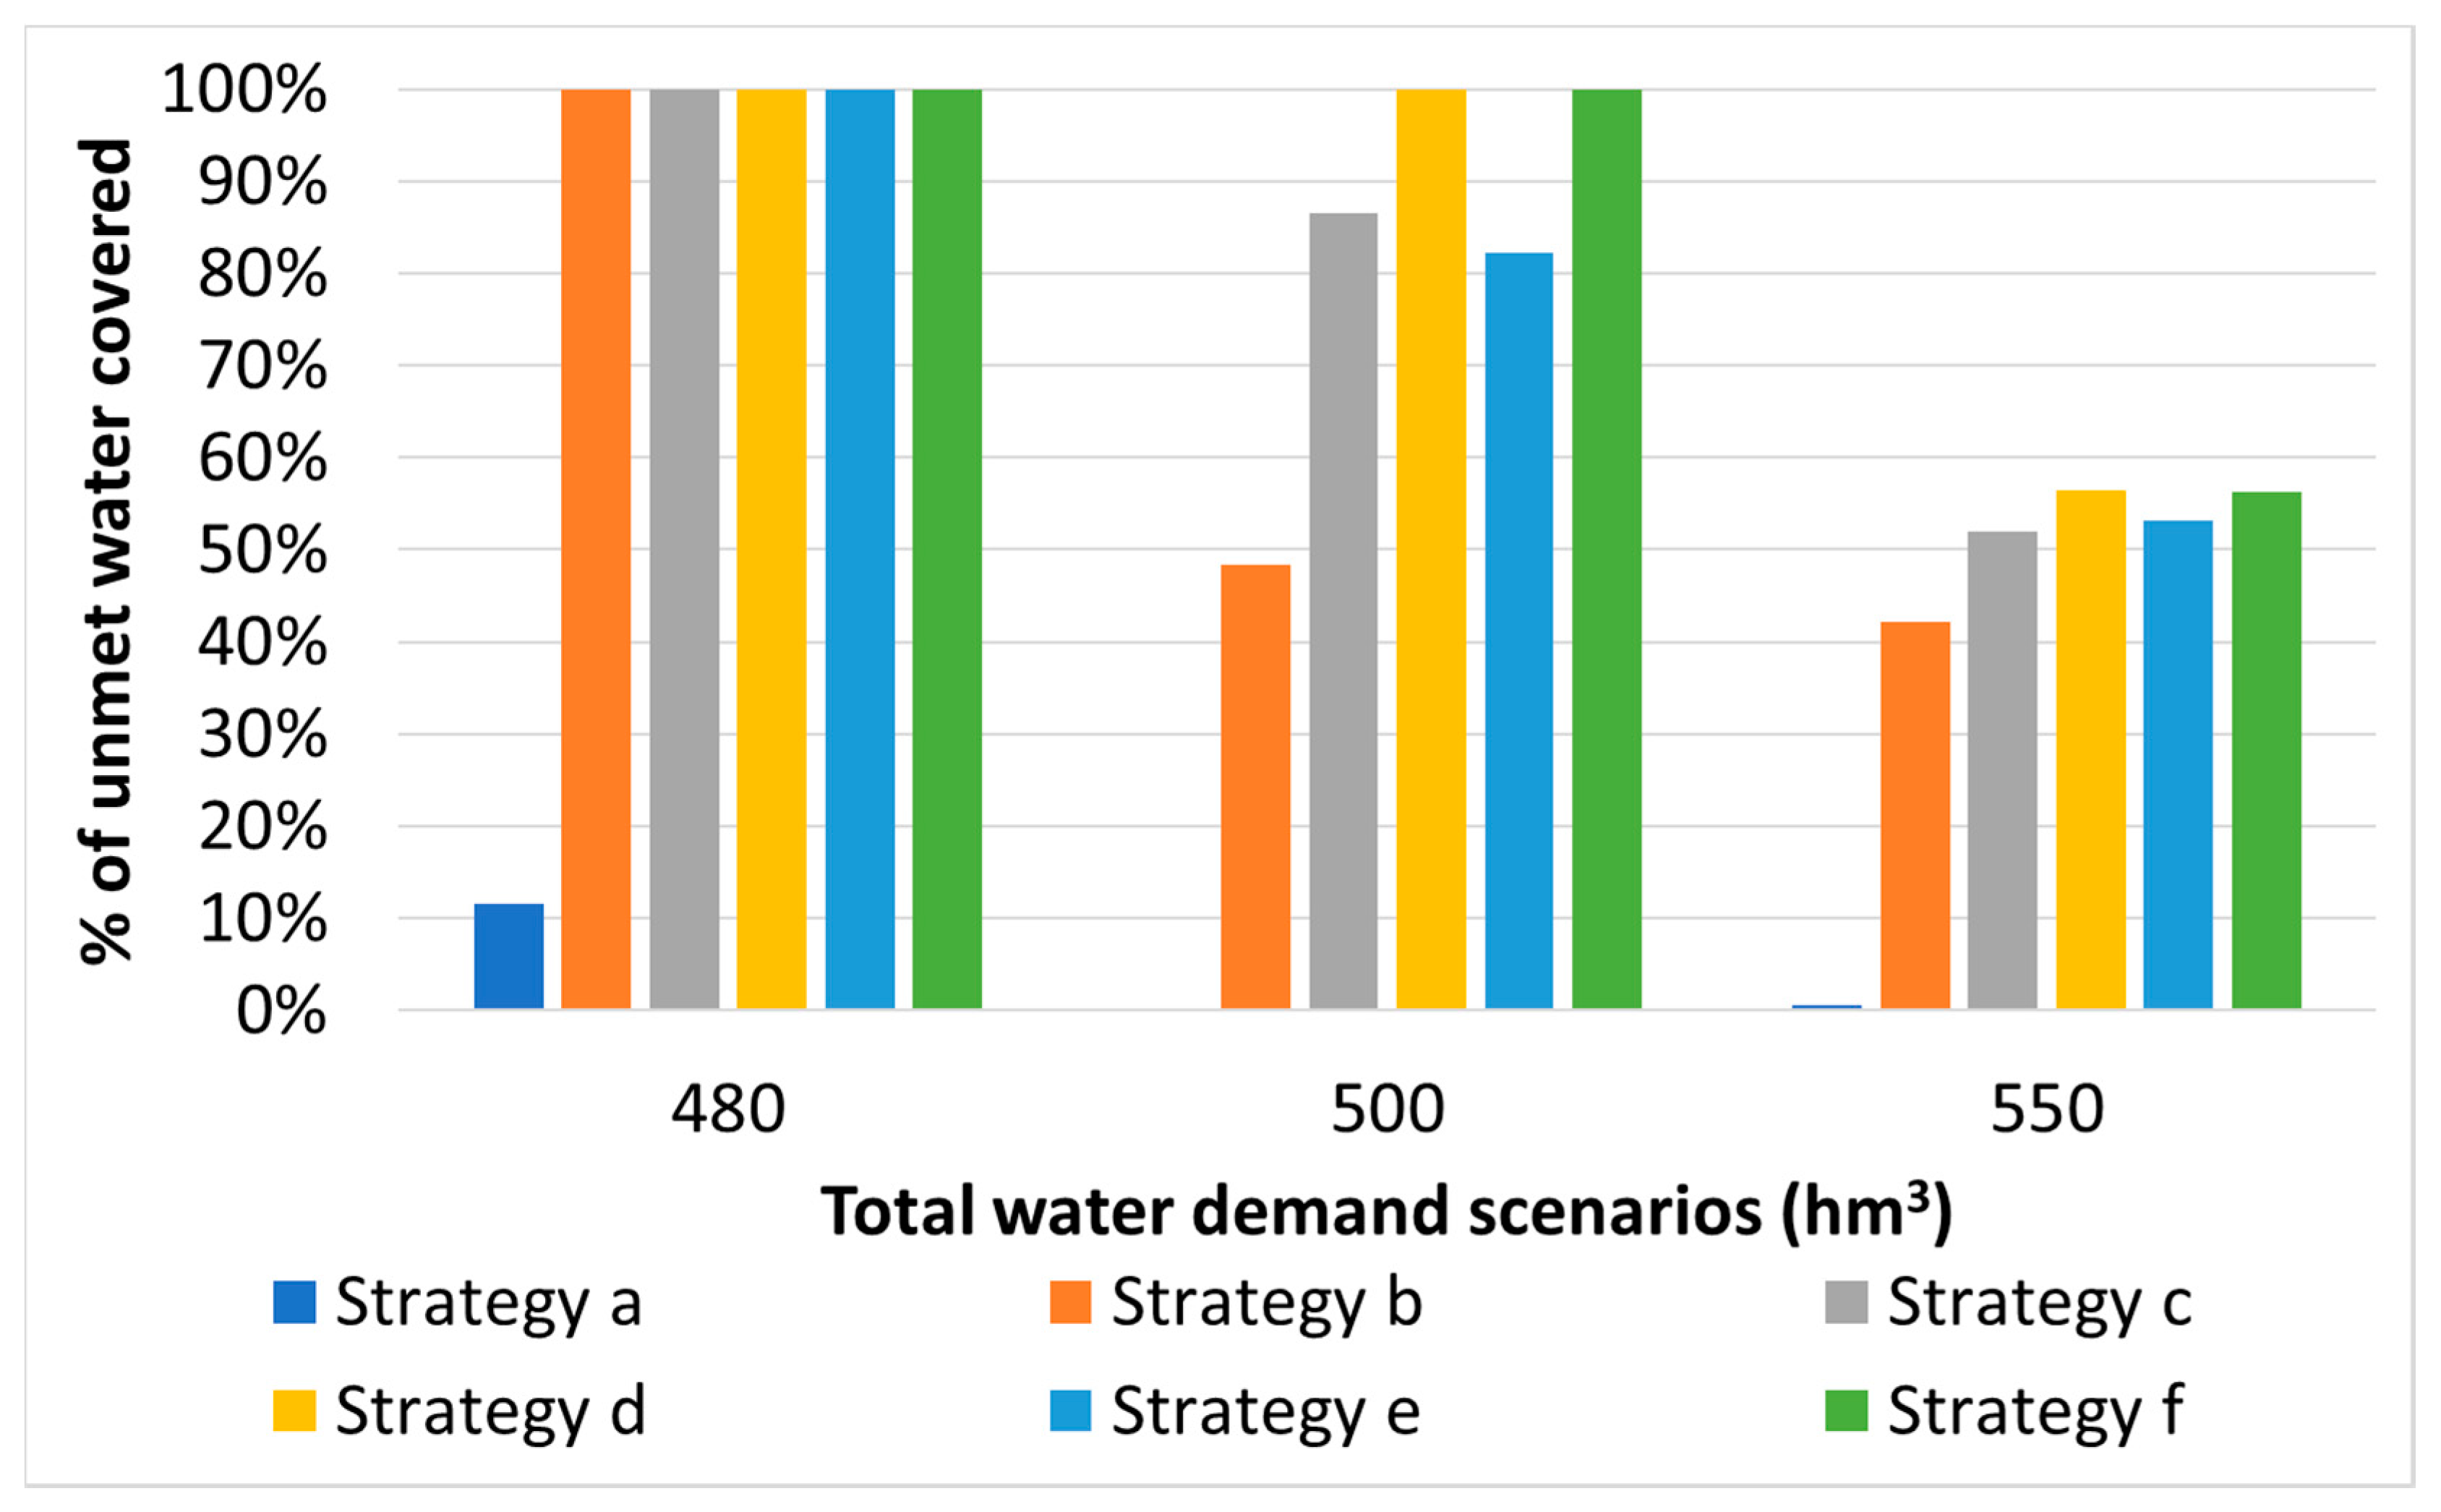
Figure 5 presents the unmet total volume of water per water demand scenario and water demand strategy. The most challenging months were those of July–November of 2022 when drought and water demand was at their highest ranges.
In the water demand scenario 3 (480 hm
3 in
Figure 5) the hydrosystem and, in particular, the Hylike reservoir failed to provide 1.35 hm
3 in the Baseline scenario (see also
Figure 4e). While water demand management strategy a did not manage to keep the hydrosystem from failing, unmet volume of water demand was decreased by 12% (1.35 to 1.19 hm
3). Strategy b managed to meet all the requested water demand, showing the importance of using awareness campaigns as a precautionary measure to increase water saving awareness, resulting in significant, and in this case adequate, water conservation behavior.
Additionally, in the water demand scenario 4 (500 hm
3 in
Figure 5), the hydrosystem and more specifically the Hylike reservoir failed to provide all required water (see also
Figure 4g). Water demand strategy a was not able to decrease the unmet volume at all. Strategies b, c, and e all failed to adequately decrease water demand but were able to significantly decrease the unmet water volume by 48%, 86%, and 82% accordingly. Water demand management strategies d and f were able to eliminate unmet water demand. These include restrictions as well as awareness raising campaigns and water price increases.
Finally, in the water demand scenario 5 (550 hm
3 in
Figure 5) both the Mornos and the Hylike reservoirs were not able to meet all the requested demand (see also
Figure 4h,i). While none of the strategies managed to keep the hydrosystem from failing, the unmet water demand was decreased as follows:
Strategy a decreased average unmet demand by 1% for both reservoirs
Strategy b decreased average unmet demand by 98% for Mornos and 30% for Hylike reservoir
Strategy c decreased average unmet demand by 100% for Mornos and 39% for Hylike reservoir
Strategy d decreased average unmet demand by 100% for Mornos and 43% for Hylike reservoir
Strategy e decreased average unmet demand by 100% for Mornos and 40% for Hylike reservoir
Strategy f decreased average unmet demand by 100% for Mornos and 43% for Hylike reservoir
4. Discussion and Conclusion
The aim of this work was to assess the ability of UWAB [
26,
29,
31] to investigate the response of the hydrosystem to different water demand scenarios and water demand management strategies (see
Table 6).
Figure 6 shows the % decrease of the volume of unmet water demand for each water demand scenario that failed and each water demand management strategy. The scenarios examined illustrate the necessity to use awareness campaigns proactively to avoid water supply shortage even in cases of drought. Nevertheless, a further increase of the population and persistence in drought conditions may require more strict measures. None of the selected water demand management strategies was able to alleviate the effects of the increased water demand that was brought by a 20% increase of the population. However, the tested strategies did not account at all for the possibility of reducing other types of water demand such as commercial, municipal, untreated, industrial, or other that correspond to 22% of the total water demand of Athens. In addition, these strategies have not taken into consideration a decrease in the water lost by the distribution system which corresponds to 28% of the total water demand of Athens. With these in mind, it could be possible to alleviate effects of as much as 20% increase of the served population if policies are implemented that also aim in the reduction of other types of water demand and/or water losses.
The results demonstrate that it is possible to use UWAB to simulate the effects of different water demand management strategies to the urban water system. In the model’s real-world application, it is suggested that water companies can use UWAB to calculate the duration of awareness raising campaigns and associate it with drought indicators as means to initiate timely water demand management measures. The results also lead to the conclusion that water price change strategies do not achieve a substantially higher decrease in water demand than awareness raising campaigns and restrictions. This coincides with the literature review findings (see
Figure 1) that water prices are not used as a means to increase water saving throughout the EU, even in countries with severe water scarcity.
The results illustrate the usability of UWAB to support decision makers in applying a more adaptive urban water management approach. Using UWAB the decision maker may identify not only how “strict” water demand management measures are needed to alleviate water supply potential issues but also when and for how long to deploy them. UWAB provides the possibility to test the effect of water demand management strategies implemented for different durations and frequencies allowing the user (i.e., water company or policy maker) to learn and adapt. This work adds to a completely new type of “test-bed” tools that aim to stress-test and assess the resilience of the urban water system, enabling a new way of designing, evaluating, and managing water policy strategies [
45].


