Abstract
Groundwater and soil pollution caused by (PAHs) spills, mostly from the oil industry and petrol stations in urban areas, represent a major environmental concern worldwide. However, infiltration into groundwater is decreasing due to the natural attenuation processes of PAHs in the vadose zone, which protect invaluable groundwater resources against contamination. This study was conducted to evaluate the effect of improper management of the petroleum industry on the groundwater and soil surrounding the petrol station and an oil refinery unit and, furthermore, to prepare the polluted risk intensity (PRI) map. Fifty-one soil samples and twenty-five water samples were analyzed for Light Non-aqueous Phase Liquid (LNAPLs), and one soil sample for Dense Non-Aqueous Phase Liquid (DNAPLs); furthermore, six soil samples analyzed for Tetraethyl Lead (TEL) analysis. The results showed that seventeen wells were polluted with LNAPLs and the soils were highly contaminated with different DNAPLs components and mainly was in the form of Polycyclic Aromatic Hydrocarbons (PAHs). Seven factors introduced to the GIS platform to produce PRI map, which is the distance to source, depth to water table, slope, lineaments, lithology, soil, and recharge rate. The final map revealed that the eastern and western parts of the study area are at a very high-risk level, whereas the center is at a very low to low-risk level.
Keywords:
LNAPL; DNAPL; groundwater and soil contamination; oil leakage; Sulaymaniyah; Kurdistan region; Iraq 1. Introduction
The crucial role groundwater plays as a decentralized source of drinking water and other human utilities for thousands of rural and urban families cannot be overstated. Groundwater is less susceptible to contamination and pollution when compared to surface water. Also, the natural impurities in rainwater, which recharge groundwater systems, are removed during infiltration through soil strata.
Polynuclear aromatic hydrocarbons (PAHs) are a group of pollutants that are present at high concentrations in the groundwater and soils of many hydrocarbon industries areas. PAHs are a group of DNAPL compounds that form during a spill or incomplete burning of oil and coal, garbage, or other organic substances; agricultural runoff; etc. [1,2,3].
Groundwater from aquifers is an important drinking water resource, which is, however, particularly vulnerable to contamination. Also, in the previous century, human activities have a significant impact on surface and groundwater, leading to the release of several types of pollutants. Recently, some of the lands are polluted by-products of petroleum origin (hydrocarbons, solvents, etc.) and used as an energy source in Sulaymaniyah City. There are different pollutants affecting soil and subsoil and groundwater, such as fuel and oil products, crude oil, hydrocarbon residues, and other products resulting from the operation. These types of products (mainly hydrocarbons) have a harmful risk, affecting the quality of groundwater, which becomes unsafe for use for a long time (drinking water, irrigation, and industrial uses). It is also harmful to human health, ecosystem, and vegetation. Aromatic compounds having a strong feature of poison and carcinogenic and, not least, affect the environment security, presenting risks of explosion and fire, when the floating oil reach the groundwater in the basement of various buildings [4].
Nonaqueous phase liquids (NAPLs) are hydrocarbons that exist as a separate, immiscible phase when in contact with water and/or air. Differences in the physical and chemical properties of water and NAPL result in the formation of a physical interface between the liquids, which prevents the two fluids from mixing [5]. NAPLs are typically classified as either light nonaqueous phase liquids (LNAPLs), which have densities less than that of water, or dense nonaqueous phase liquids (DNAPLs), which have densities greater than that of water [5,6,7].
Light nonaqueous phase liquids deteriorate groundwater quality at many locations across the world. The most common LNAPL-related groundwater contamination problems result from the release of petroleum products [8]. These products are typically multicomponent organic mixtures composed of chemicals with varying degrees of water solubility. Some additives (e.g., methyl tertiary-butyl ether and alcohols) are highly soluble. Other components (e.g., benzene, toluene, ethylbenzene, and xylenes) are slightly soluble. Many components (e.g., N-dodecane and N-heptane) have relatively low water solubility under ideal conditions. In general, LNAPLs represent potential long-term sources for continued groundwater contamination at many sites [9,10].
Vertical migration of LNAPLs progress might be disturbed by the presence of low permeability aquifer zones, which result in lateral migration. As the gas phase is absent in the saturated zone, a system containing DNAPL can be regarded as a three-phase system: solid, liquid, and immiscible liquid [11,12]. Contaminant distribution in the three-phase system is less complex than the one in the four-phase system of the unsaturated zone. Though the saturated zone is a three-phase system, DNAPL in the gas phase may affect the groundwater quality [5]. In the case where the whole volume of DNAPL is not exhausted for residual saturation, DNAPL continues migrating vertically until reaching a layer possessing lower permeability [13]. Then, it starts to migrate laterally. Permeability in the vertical direction is usually smaller than in the horizontal direction, and one can, therefore, expect the pollution to spread horizontally in particular. In the case of a “bowl-shaped boundary”, DNAPL becomes stratified, forming a sort of reservoir. The presence of various less permeable aquifer “interbeds” is relatively frequent, and the contamination may thus occur in many “hanging reservoirs” in various silt and clay interbeds, as well as in low reservoirs. Soluble fractions of DNAPL dissolve into the water both from zones of residual saturation and from the reservoirs. In the saturated zone, the direction of pollution spread corresponds mostly to the direction of the groundwater flow but even in such a system, slight deviations caused by different petrographic, tectonic or hydraulic parameters of saturated rocks can be observed [11]. The direction of pollution spread may be even opposite to the groundwater flow in special cases The NAPL transport through rocks depends largely on the rock composition and the existence of possible preferential ways possessing higher permeability or, conversely, on the presence of interbeds of less permeable materials [3].
DNAPLs (mainly PAHs) are often linked to oil spills. PAHs are usually found as a mixture containing two or more of these compounds [14]. As researchers said that the compounds can enter the food chain through organisms such as plankton or fish, the toxicity of PAHs can vary from being nontoxic to extremely toxic. Pyrene is one PAH compound that has a notable for being the first chemical carcinogen to be discovered. The Environmental Protection Agency (EPA) has classified seven PAH compounds as probable human carcinogens, as well as, PAHs is known for their carcinogenic, mutagenic, and teratogenic properties [15]. In addition, high prenatal exposure to PAH is associated with lower IQ and childhood asthma [16].
Good quality freshwater resources are getting limited with an uneven geographical distribution during the last few decades, mainly due to pollution pressures from anthropogenic activities. This problem is enhanced for the groundwater resources, which degrade at an even faster pace due to the increasing pressure from climate change, population growth, and economic activities [5]. The assessment and mapping of groundwater pollution risk is a widely used, modern approach, to recognize and demarcate areas that are more prone to contamination than others, as a result of the physical protective mechanisms and the existing pollution pressure. The output from this process is important since it allows the prioritization of groundwater bodies based on their degree of groundwater pollution risk, which can then dictate the need for preventive and/or restoration measures.
Sulaymaniyah City is in the northeast of Iraq, and it is underdeveloped regarding human population, construction, factories, and petrol station development, and therefore groundwater under the hazardous of pollution.
The concept of “paying for our past” has become an undesirable reality that all related parties, in any contaminated asset, land, water, or air, have somehow come to terms with since the second half of the past century. Industrialization and frequent incidents of oil spillage in the developed countries as well as in nearly all countries are some of the most common reasons for the pollution of the environment in the past and present [17].
Despite the extensive presence of contaminated sites in many countries, only those which are considered for redevelopment are investigated, and the required steps toward remediation are taken. These sites are mainly happened to be in the urbanized areas that underlain contaminated soils or groundwater. Due to the long industrial history of Kurdistan cities in general and the City of Sulaymaniyah in particular, which have been or still is in contact or adjacent to some types of pollution associated industries and activities are often areas of concern. Distribution and storage of oil and benzene, chemical industries, sewage works, oil refinery, and municipal waste disposal are few of the common activities that are associated with contaminated land.
In last year’s many due to rapid urbanization in Sulaymaniyah city many legal and illegal petrol stations and oil refinery factories are established, unfortunately, the lack of environmentally aware and policy made the owners dispose of the waste to the environment improperly (Figure 1). Three different sites have been selected to observe the main objective of this desk study including Goezha and Aqary petrol stations and Sulaymaniyah Oil Refinery Directorate.

Figure 1.
Improper management of oil products, (A) Pool of oil in O.R, (B) Soil polluted by oil product, (C) area around O.R polluted by oil products, (D) Oil leakage from old tanks.
The main purposes of this article as the first attempt in the region are, first, to assesses the groundwater and soil pollution by oil product and, second, to delineate risk intensity map (PRI) of the studied area. The novelty of the applied method in this study refers to recording the actual contaminant spreading in the ground and the achieved data can be managed in Geographic Information Systems (GIS) to facilitate groundwater environmental risk assessment. In addition, the PRI map was designed based on the combination of several specific parameters which is control geologically the spreading of the pollutant in the unsaturated and saturated zone, and these parameters have been weighted based on its efficacy in the system. The results of this study will also form the basis for future similar studies in the world.
1.1. Description of the Study Area
The study area is in the northeastern part of Iraq and comprises an area of the Sulaymaniyah City Center. Geographically, the area is projected in Zone 38N and extends between latitudes (0535171) North and longitudes (3935839) East (Figure 2). The three selected sites (Goezha and Aqary Petrol Stations and Sulaymaniyah Oil Refinery Directorate) are located to the southwest, center, and southwest of Sulaymaniyah City, respectively, with locations of (0535171 N, 3935839 E), (0538790 N, 3934886 E), and (0534051 N, 3935410 E).
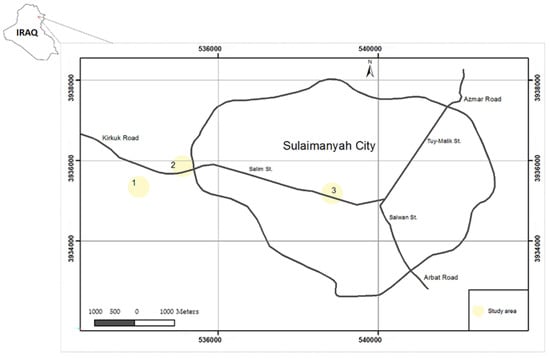
Figure 2.
Location of the study area and the sampling locations.
1.2. Geology and Hydrogeology of the Study Area
Geologically, there are many stratigraphic units exposed and cropping out in the study area. The age of these units ranges from lower Cretaceous to Quaternary deposits; the oldest rocks are cropping out in the crest of anticlines in the Balambo Formation, belonging to the (Valanginian–Turonian) age, whereas the younger units exposed along with the anticline limbs and in the trough of synclines. The selected stations located in the Quaternary deposits and Tanjero Formation (Figure 3.) Quaternary deposits are composed of a mixture of clay, silt, sand, and gravel with varied thickness ranged between (5–15) m. The Tanjero clastic Formation comprises two divisions. The lower part comprises pelagic marl and occasional beds of argillaceous limestone with siltstone beds. The upper part comprises silty marl, sandstone, conglomerate, and sandy or silty organic detrital Limestone; [18]. Figure 4 illustrates the stratigraphic column of the study area.
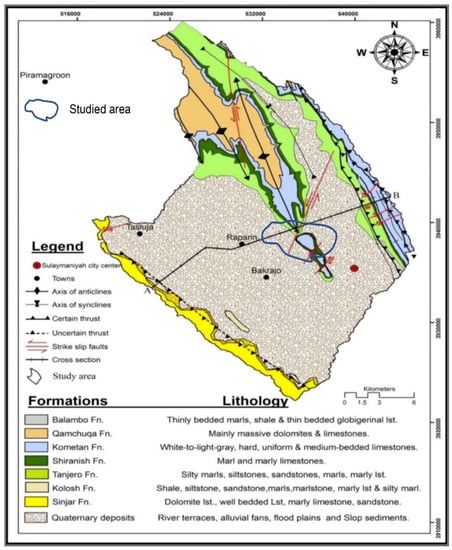
Figure 3.
Geological map of the study area (based on [22]).
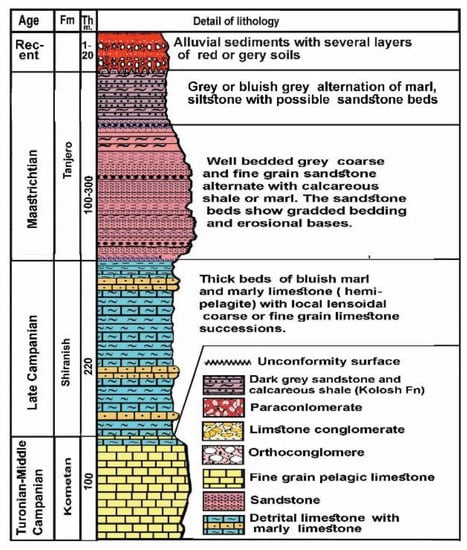
Figure 4.
Stratigraphic column of the study area (based on [23]).
Hydrogeologically, the studied sites cover a different type of aquifer. Intergranular aquifers (quaternary deposits) are characterized by a productive aquifer, in terms of water quantity, because it has excellent porosity and permeability, leading to easy transport of the different types of contaminant toward the soil and groundwater. Variation in permeability from one site to another within the same aquifer horizon, are typical characteristics of this aquifer [19]. In some areas, percolations of groundwater from this aquifer downward to underlying Tanjero and Shiranish Formations are expected. It is expected that they can store water in quantities significant enough for exploitation by shallow wells and springs because these two formations act as a barrier to moving further down while the fine clastic acts as a lateral boundary (barrier) for Intergranular Aquifers [20]. Tanjero Formation also considers as an aquitard in most of the aquifer classification. However, according to the results of many drilled water wells by Groundwater Directorate in Sulaymaniyah, Tanjero Formation relatively is a good aquifer regarding the porosity and permeability. The discharge of the high productive wells which drilled in Tanjero Formation is >7.5 ℓ/sec. Thus, it might be considered as a good local aquifer in some place in Sulaymaniyah City. Therefore, its act as a good pathway for pollutant transportation through it because of the presence of sandstone and siltstone bed. In some classifications, the Tanjero Formation is classified as a semiconfined aquifer because of the presence of Shiranish Formation beneath it and the presence of marl bed in the lower part of it [21]. Regarding depth to groundwater at all three different studied sites, the depth ranged between 16 and 23 m. Also, the direction of groundwater movement is toward Tanjero River (South of Sulaymaniyah City) according to the authors of [21].
2. Materials and Methods
The current work originally evaluated the possibility of soil and groundwater contamination from DNAPL and LNAPL components related to several hydrocarbon activities. The first step started with a site reconnaissance survey of the studied sites and the surrounding area, to identify potential issues that have not been recorded previously. Therefore, a detailed site reconnaissance survey was conducted to provide an opportunity to highlight required information from all studied sites to assist the next step of data collection and sampling process. To get the recommended methodology in this research and to achieve the objective of this study as well, field work had been performed to collect required samples of both water and soil. Soil and water samples from each site had been collected in different ways according to the site situations in terms of accessibility to the site, construction development, and human populations. The detail of work procedure is presented in Figure 5.
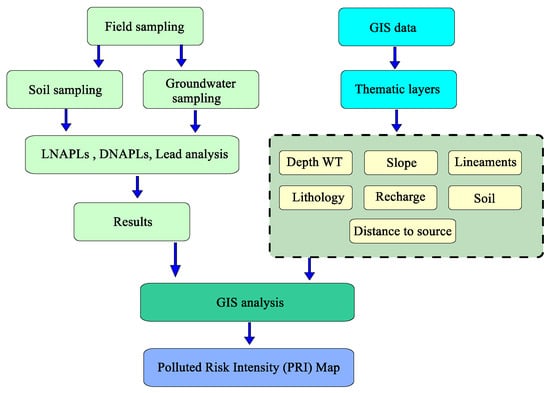
Figure 5.
Overall flowchart of the methodology of the present study.
2.1. Soil Sampling
Soil contamination may be more likely if the site has or had different industrial activities, such as an oil refinery factory or petrol station, and the distribution of contaminant might be in both vertical and horizontal directions. In terms of vertical spreading of pollutant, several pits have been excavated at all studied sites. Within the research works, five pits excavated at Sulaymaniyah Oil Refinery Directorate, Figure 6. Furthermore, six pits excavated at Ashty Petrol Station with different depth. The depth of excavated pits based on the ground condition in terms of the presence of oil wastes and the felling of oil smelling (volatile component), the detail description of soil profile is presented in the Table 1. From these excavated pits, thirty-two soil samples were collected from different horizons for LNAPLs analysis (tetrachloroethene, trichloroethane, methylene chloride, chloroform, chloroethene, dichlorobenzene, ethyl benzene, toluene, xylenes, and freon), see Table 2 and Figure 5. Furthermore, six surface soil samples were collected for tetraethyl lead (TEL) analysis in Sulaymaniyah Oil Refinery Directorate, Table 3. Only one sample was taken for DNAPL due to high-cost analysis and the limited funds for the project. All samples stored in a particular container provided by CRSA Italian Laboratory.
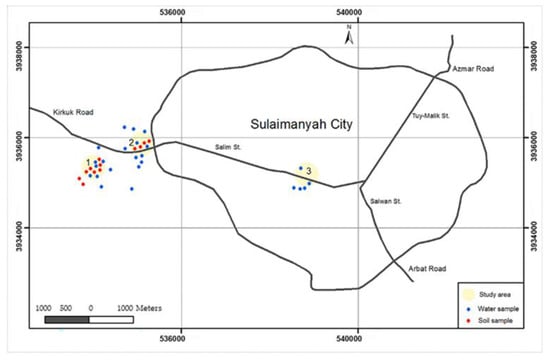
Figure 6.
Location map of the water and soil sample collected in the study area. (1) Oil Refinery. (2) Chalaka Petrol Stations. (3) Aqary Petrol Stations.

Table 1.
Soil profile description.
Table 2.
Surface and subsurface soil sample geographic locations.
Table 3.
Soil Samples locations for tetraethyl lead analysis at Sulaymaniyah Oil R.D.
2.2. Water Sampling
Twenty-five water samples were collected from wells around the Sulaymaniyah Oil Refinery Directorate, and Ashty and Aqary petrol stations, see Figure 6 and Table 4, directly from water table using a specific local cylinder as shown in Figure 7. The cylinder fixed with the sensor head of an electrical sounder device, by lowering the device into the well until the cylinder penetrates the water table and lets it fill with water. Following this step is considered a useful way for collecting several contaminated water samples with oil components. The water samples analyzed for LNAPLs components (tetrachloroethene, trichloroethane, methylene chloride, chloroform, chloroethene, dichlorobenzene, ethyl benzene, toluene, xylenes, and freon).
Table 4.
Groundwater and surface water samples locations and depth.
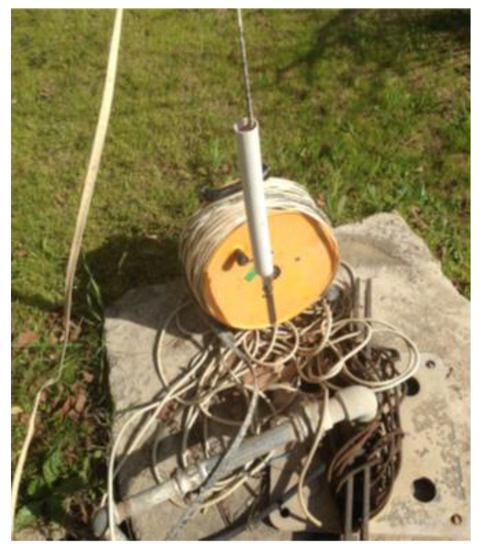
Figure 7.
Local cylinder fixed with electrical sounder.
Due to the penetrating properties of several of the oil components in water and the ability to dissolve some LNAPL components in water that then migrate to deep groundwater, it is important to detect the oil pollutant in the depth inside the well. For that reason, well pump has been generated until DWL has been stabled, then the water sample from the pump pipe outlet collected. After finishing field work and all water and soil samples have been collected. Water samples have been placed in a provided container specified for liquid material (PET glass), the container fully filled with a water sample and avoid any effect of an air bubble in order to prevent the air reaction and migrate some component into the air, and then, soil sample situated in a specified container for soil.
2.3. Laboratory Analyses
All organic composition analyses of the collected water and soil samples were analyzed in the laboratory of the C.R.S.A Med Ingegneria Laboratory Company in Italy using EPA (3550 C, 5030 A, 5035 A, 8260 C, 8270 D) standard laboratory procedures. The recommended method to analyze the soil samples are EPA 5035A, 2002, and EPA 5035A, 2006, which are the closed system purge and trap and extraction methods for volatile organics in soil and waste samples, respectively, although the recommended methods for groundwater sample analysis are EPA 5030C, 2003, and EPA 8260C [24,25], which are described as purge and trap procedures for the analysis of volatile organic compounds (VOCs) in aqueous samples and water-miscible liquid samples [26,27,28,29].
In all of the solid samples, several compounds belonging to less volatile or nonvolatile proportions that are extractable by organic solvents were analyzed. Amounts of TPH were determined using infrared spectroscopy. A saturated hydrocarbon fraction, a fraction of aromatic hydrocarbons and a fraction of persistent organochloric substances were analyzed using gas chromatography measurements [30,31,32]. In some soil samples of the Sulaymaniyah Oil Refinery Directorate, TEL (tetraethyl lead) was analyzed. In some soil samples, chlorinated aliphatic (carcinogenic and noncarcinogenic), halogenated aliphatic (carcinogenic and noncarcinogenic), phenol nonchlorinated, chlorinated phenols, and polycyclic aromatic hydrocarbons) were also analyzed [33,34]. Solid samples collected for the analysis of nonvolatile substances were dried at room temperature and then ground and sifted on a sifter (2 mm pinhole diameter). For samples prepared in this way, TPH was extracted by chlorofluorocarbon and analyzed on Perkinelmer 783 IR spectrophotometer. The next fraction was subjected to extraction with a mixture of dichloromethane and methanol 95:5 volume ratio. An aliquot of this extract was then fractionated (column chromatography, silica gel) into a fraction of saturated hydrocarbons and a fraction of aromatic hydrocarbons. The distribution of individual hydrocarbons in both fractions was determined using Agilent Technologies AT 6890 gas chromatograph equipped with flame ionization detector (FID).
For the purpose of the analysis of persistent organochloric substances (especially PCB), a portion of the extract was again purified by column chromatography (on a column with modified silica gel) and analyzed using Agilent Technologies AT 6890 gas chromatograph equipped with an electron capture detector (ECD).
Water samples were tested on TPH, polycyclic aromatic hydrocarbons (PAH), polychlorinated biphenyls (PCB) and VOC. TPH analysis was again similar to the analysis of solid samples. PAH and PCB were first isolated by a microextraction with n-hexane. In the case of PCB, a gas chromatograph with ECD detector was used. For PAH analysis, liquid chromatography (Agilent Technologies AT 100 with fluorescence detector) was employed. VOCs were determined both in water and in solid samples using instrumental arrangements containing a “headspace”—a Tekmar-Dohrmann device for VOC isolation 7050 HT—connected to an AT 5890 gas chromatograph equipped with FID and ECD detectors.
Both water and soil samples had been analyzed and examined through C.R.S.A Med Ingegneria Laboratory Company in Italy for looking after NAPLs components.
2.4. Mapping Spatial Distribution of Impacted Petrol Component
The GIS technique was used to map spatially distributed of each petrol component, namely, LNAPLs in water and soil samples and DNAPLs. The inverse distance weighted (IDW) technique was applied to show the intensity of quantitatively distribution or to interpolate of each component over the studied area. Interpolation is the process of using points with known values or sample points to estimate values at other unknown points. It can be used to predict unknown values for any geographic point data. There are two categories of interpolation techniques: deterministic and geostatistical. Deterministic interpolation techniques create a surface based on measured points or mathematical formulas such as IDW. Geostatistical interpolation techniques, such as Kriging, are based on statistics. The IDW are based on the extent of similarity of cells and it is applied in this study because us quite useful with the available data in this study. In addition, the accuracy of Inverse Distance Weighted with the other interpolation method such as Kriging is almost the same.
2.5. Mapping Polluted Risk Intensity (PRI)
The main aim of this study is to map the intensity of distributed polluted component as a result of dealing with petrol component in the study area. Therefore, PRI map was developed in order to assess and map the general intensity of polluted risk assessment. The difference between groundwater risk intensity and intensity of groundwater vulnerability refer to that, GIS based PRI was used to produce likelihood of release of hazards, likelihood of detection of hazards, consequence of hazards and residual risk of groundwater contamination in terms of hydrocarbon products in the groundwater basin of Halabja-Saidsadiq, whereas groundwater vulnerability used to assess intrinsic aquifer vulnerability to pollution PRI map was designed based on the specific condition of geological and hydrogeological conditions in this specific studied area. Several parameters expected to have a direct impact on mapping PRI, namely distance to pollutant sources (Ds), depth to water table (D), slope degree (Sr), lineament density (Ln), lithology of unsaturated zone(L), soil type (S) and aquifer recharge rates (R). The index value of PRI is calculated from the following equation,
where r is the rate value and w is the weight value of each parameter.
The PRI index value is resulting from the assessment of each parameter with a weighting factor ranging from 1 to 5 (w index) and the value of each hydrogeological parameter with values ranging from 1 to 10 (r index) based on their impact on the intensity risk assessment [35]. The algebraic addition of the seven maps using the GIS technique produced the intensity risk assessment index which was classified on 5 intensity classes.
To achieve the intrinsic PRI map, the scope of soil and groundwater pollution was analyzed by developing the seven map layers. Each parameter has a specific rate and weight value based on its impact on the dispersion of contaminant and risk assessment systems.
In the procedure of weight evaluation, the significance and weight of each parameter were compared with each parameter in this study. It was done throughout the execution of the views of the expert that have worked in this field. Each parameter has a specific weight value that it merits by assuming the method of straightforward additive weighting. Then these weights have been applied for organizing the comparison matrix of the AHP to get the right weight for each parameter.
The weight of each parameter in this model was calculated using Analytical Hierarchical Process (AHP) method. The AHP is a way to deal with basic leadership that includes organizing different decision criteria onto a hierarchy, evaluating the virtual impact on these criteria, evaluating alternative to each criterion and confirming the validity of these alternatives. The crucial of the Analytic Hierarchy Process (AHP) are an arrangement of axioms that precisely delimit the degree of the environmental issue [36]. It depends on the very much characterized numerical structure of reliable networks and their related right eigenvector’s capacity to produce genuine or estimated weights, [37]. The AHP technique compares criteria or parameters with reverence to a criterion, in an ordinary, pairwise mode. To do this, the AHP utilizes an essential absolute numbers scale that has been confirmed practically and by physical and decision problem trial. The basic scale has been appeared to be a scale that catches singular inclinations as for quantitative and subjective traits similarly too or superior to different scales [38,39]. This pairwise comparison is used to resolve the relative significance of each parameter in terms of each criterion. In standard analytic hierarchy studies, the 9-point scale is used, where each point equates to an expression of the relative significance of two factors. This revision uses a scale with values ranging from 1 to 9: one denotes less importance, whereas nine denotes extreme importance. This will allow the decision maker to evaluate the contribution of each factor to reach the objective separately through pairwise evaluation.
The standard structure to the decision issue is formed and consists of numbers, which were represented by symbol m; while alternatives were given numbers represented by symbol n. Each alternative can be assessed in terms of the decision criteria as well as each criterion being predicted by its weight. The values of aij (i = 1, 2, 3, …, m) and (j = 1, 2, 3, …, n) are used to signify the performance values in terms of the ith and jth in a matrix [40]. The archetypal comparison matrix for any problem and the relative significance of the criteria can be represented in a decision matrix as follows,
The following equation was applied to calculate the priority vector by normalizing the eigenvalue to (1) (divided by their sum), as follows
where Egi is the eigenvalue for the row i (Egi = ) and n is the number of elements in row i. The lambda max (λmax) was achieved from the following formula,
where aij is the sum of criteria in each column in the matrix and Wj is the weight value for each criterion, which corresponds to the priority vector in the matrix of decision. Therefore, in this study, λmax = 7.03. The consistency index (CI) is determined by the following formula,
where n is the size of the matrix. In this study, n = 7 and λmax = 7.03; therefore, CI = 0.005. The consistency ratio (CR) was obtained according to the authors of [39] as follows,
where RI7 is random index (RI = 1.32) for n = 7 (Table 4); this table displays the mean random index value for matrixes with different size. If the CR is less than 0.1, the ratio indicates a reasonable consistency level in the pairwise comparison. In this study, CR = 0.004 < 0.1 and the pairwise comparison matrices were prepared for seven parameters (Table 5).
Table 5.
Random inconsistency indices for different values of (n) [41,42].
3. Results and Discussions
3.1. Groundwater Samples
The results of all groundwater samples presented in the Table 6 and the polluted wells shows in the Table 7. The spatial distribution of selected LNPLs in groundwater is shown in Figure 7. Accordingly, the results of LNPLs showed that eleven wells around the Ashty petrol station are polluted and six wells around the Sulaymaniyah Oil Refinery Directorate are polluted, and the concentrations exceed the maximum permissible limit of the [40,43] guidelines.
Table 6.
LNPL concentrations in water samples.
Table 7.
Polluted wells with LNAPLs according to the standard given in [40,43].
Petrol station and oil refined sites could have various hazardous effects on the groundwater and the environment surrounding it. Three different sites have been studied, which includes the Aqary and Chalka Petrol Stations and the Sulaymaniyah Oil Refinery Directorate.
3.2. Soil Samples
The results of all soil samples are presented in Table 8 for NAPL, and the spatial distribution of the selected NAPLs in soil is shown in Figure 8. The results show that four components of LNAPLs (trichloroethene and xylenes) have been acting as contaminants in this site and the area surrounding it, see Table 9.
Table 8.
LNPL concentration in soil samples.
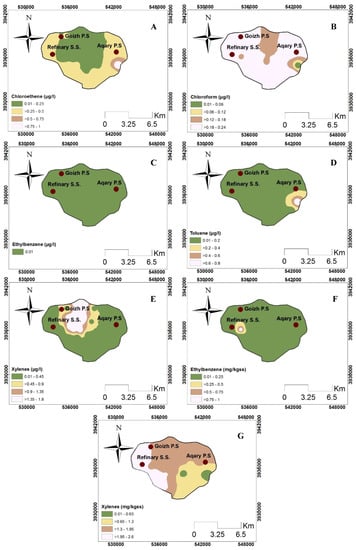
Figure 8.
Spatial distribution of the selected LNAPL components over the studied area: (A–E) in water samples, and (F,G) in soil samples.
Table 9.
Polluted soil samples with LNAPL according to World Health Organization (WHO) and Environmental Protection Agency (EPA) standards.
Soil samples were collected in both Sulaymaniyah Oil R.D. and Goezha (Chalaka) Petrol station, the result shows that the soil in both areas is highly contaminated with different DNAPLs components and mainly was in form of polycyclic aromatic hydrocarbons (PAHs), Table 10 and Table 11.
Table 10.
Result of DNAPL for the SR33 soil sample.
Table 11.
Result of DNAPL components at Chalka P.S. and Sulaimaniyah Oil R.D.
From the results it concluded that the distribution of several toxic DNAPLs component in the studied area which having health diseases namely cancer including (naphthalene, acenaphthene, phenanthrene, anthracene, acenaphthylene, chrysene, and pyrene). Pyrene is a PAH compound that is notable for being the first chemical carcinogen to be discovered. EPA has classified these seven PAH compounds as probable human carcinogens as well as PAHs known for their carcinogenic, mutagenic, and teratogenic properties. In addition, high prenatal exposure to PAH is associated with lower IQ and childhood asthma [44].
3.3. LEAD Sample Results
The six soil samples of the lead investigation show that the area around the TEL tank is at a high level; however, it is below the World Health Organization (WHO) standard, which is 10 ppm (0.01 ppm in the water, see Table 12), but the presence of this tank might increase the risk of soil and groundwater pollution in the area. As well as, the tank in the area might be leaking as the result showed a high level of Lead and the tank should be removed from the area safely. Table 13 illustrates the results of polluted areas and depth of pollution over the studied areas, the highest pollution area and depth of pollution was recorded in Goezha P.S. with 960 m2 and 10 m, respectively. While in Aqary P.S.and Sulaimaniyah Oil R.D, the polluted area was 250 and 140 m2, and polluted depth was 10 and 3 m, respectively. This refers to the periods of service of each station, Goezha P.S. serviced longer period than the other two stations.
Table 12.
Lead concentration of the Sulaymaniyah Oil Refinery soil samples.
Table 13.
Result of area and depth of pollution in ground at all studied site.
3.4. Polluted Risk Intensity (PRI) Map
The seven rated maps are shown in Figure 9. Figure 9A shows the distance to pollutant sources, based on this map, the studied area classified into four rate zones, the higher rate refers to the closeness from the sources. Figure 9B refers to the rate value based on the depth to the water table, the shallowest water table means the higher rate value and has the potential impact on groundwater pollution. The studied area classified as rate value of 4 in terms of slope rate, Figure 9C, because the slope degrees in this area less than 7 degrees, so this is helping the contaminant to stay for a long period and then migrate significantly toward the soil and groundwater zones.
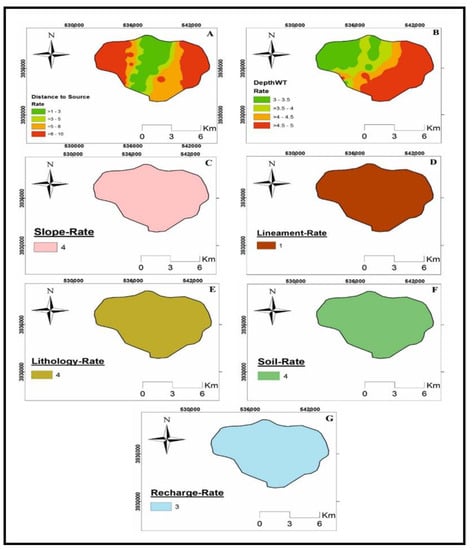
Figure 9.
Seven rated maps for polluted risk intensity (PRI) map construction.
Lineaments are structurally controlled linear or curvilinear features, which are identified from the satellite imagery by their relatively linear alignments.
These features express the surface topography of the underlying structural features. Lineaments represent the zones of faulting and fracturing resulting in increased secondary porosity and permeability. These factors are hydrogeologically very important as they the pathways for movement of contaminant toward the earth ground and groundwater aquifers. Areas with high lineament density are good for groundwater potential zones [45]. The lineament density map of the studied area is calculated using the line density analysis tool in ArcGIS software. The studied area has been grouped into one class of lineament density which is considered to be very low-density rate, so it has no significant impact on the soil and groundwater polluted risk assessment, Figure 9D. The lithology of the unsaturated zone and soil type in the studied area recognized as an alluvial deposit (a mixture of gravel, sand, and clay) and silty loam respectively, so they are rated as 4 which are moderately help contaminant to move through it toward the groundwater zone, Figure 9E, F. In addition, the recharge rate of groundwater aquifer in this area as calculated by [20] by 50–100 mm/year for both Tanjero and Alluvial deposits; therefore, this factor ranked third in the risk assessment system, Figure 9G).
After generating all the required layers, each pixel was classified and rated, then, multiplied by their respective weighting factor which was calculated by the AHP method, Table 14. A sum of seven map layers was entered on the Map Algebra tool of the GIS throughout the summation of the products of multiplying the weight of each criterion (W) by the rating value of the parameter. This assisted in generating the Intensity Risk Map. The resulted index was divided into several groups, small value designated low risk and large one is communicated to those areas that have high risk in terms of pollution potential.
Table 14.
Results of pairwise comparisons matrix for selecting suitable significance weights.
Figure 10 shows the constructed PRI map of the studied area with five zones of the risk index value. These classes are very low, low, moderate, high and very high-risk index. The map obviously illustrates the area near to the petrol and refinery stations of very high and high-risk intensity, which covers an area of almost 50% of all studied areas. Although the area away from the station the impact of petrol contaminant decreases gradually, three classes, namely, moderate, low, and very low, mostly occupy the center of the studied area, which covers approximately 50% of the whole studied area. These results confirm that distance to the source, water table, soil and properties of unsaturated zone plays an important role in the distribution of contaminant and mapping risk assessment in this specific studied area.
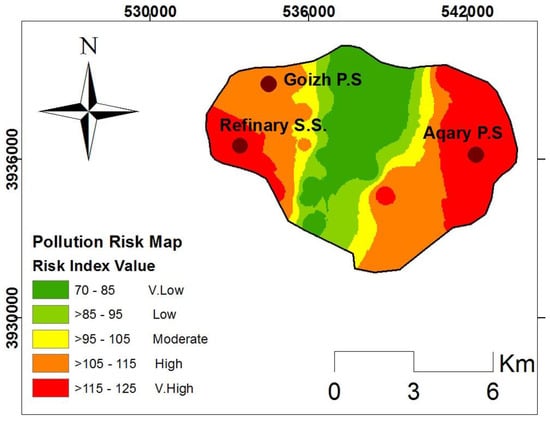
Figure 10.
The final PRI map of the studied area.
3.5. Pollutant Dispersion
From the collected data at each site and their subsequent laboratory analysis, the result of all samples (groundwater, surface water, and soil sample) has been plotted in ArcView GIS, so as to estimate pollutant dispersion at each site.
The pollutant dispersion at Chalak P.S. and Sulaimaniyah Oil.R.D and the site of collected sample site. The area of both sites is 35,000 and 55,000 m2, respectively. As we can see, at Goezha P.S., pollutant has been dispersed with the direction of dip of geological strata to the direction of south west of the site which is the direction of groundwater movement as well. Horizontal pollutant dispersion can be classified as two group based on intensity of pollutant quantity which are intensively polluted area and moderately polluted area. The area of polluted land at this site can be estimate as 300,000 m2 with intensive degree and 660,000 m2 with moderately degree. So, the total area of pollution is 960,000 m2 while, vertical diffusion of pollutant at this site can be estimate to about (10) m in depth of ground earth.
In addition, at Sulaymaniyah Oil R.D. pollutant has been dispersed horizontally rather than vertically., pollutant dispersed at this site with same direction of geological strata and the direction of groundwater movement with the area of about 140,000 m2 and to the depth for about 3 m.
The most interesting feature that been noted during this research, is the pollution feature at the Groundwater Directorate Well. This site has been contaminated with the NAPLs component such as (Chloroform, Chloroethene and Toluene), while this site is far from all studied sites and any other petrol station in terms of distance, but according to our memorise, in the past there was a unboxed sewerage channel near to this directorate. This channel was a main sewerage system for the industrial area, were all car repair worker disposed their liquid waste (Oil, Benzene, Naphtha, etc) in this channel and with the time it infiltrated to the surrounding groundwater and soil, but nowadays, this unboxed sewerage system changed to the boxed sewerage system.
The pollutant dispersion at Aqary P.S. and the site, pollutant has been dispersed with different direction. Defiantly, this site is located at the end of a small hill and the strata here has a different dip direction, so dispersion seen as a circle around the site of the main pollutant source. Horizontal pollutant dispersion also divided into intensively polluted area and moderately polluted area. The area of Aqary P.S. is 5000 m2, while the area of polluted land with intensive scale at this site can be estimate as 70,000 m2, and the area of polluted with moderately scale is 180,000 m2. So, the total area of pollution at this site is 250,000 m2. Unfortunately, the vertical diffusion of pollutants at this site in soil cannot be estimated, as the site has been developed in terms of construction and the ground material had been replaced. Unluckily soil and ground material at this site had been transported to different unknown site, so the pollutant also has been transported from here and caused to pollutant dispersion in the other are without present of any petrol station in it. while the groundwater has been polluted based on collected sample from drilled wells to the different depth as some water sample collected as Sulaymaniyah Library Building and Sulaymaniyah Veterinary Directorate.
Results of polluted of soil and groundwater as a result of some Polycyclic Aromatic Hydrocarbons Spills, needs broad public understanding of the risks associated with these compounds. Proper management and careful handling of petroleum products reduces the possibility of spills. Replacing old and leaking surface and subsurface storage tanks with new double wall tanks equipped with leak detectors and cathodic protection could significantly improve the quality of our precious and fragile groundwater resources.
4. Conclusions
The improper management of hydrocarbon waste disposal by the petrol stations and oil refinery is the number one environmental problem in the study area. In the last years, much illegal oil refinery established and does not follow the regulations of the Governorate environmental policy. In this study soil and groundwater samples were collected in the vicinity and surrounding area of the petrol stations and oil refinery companies. It concluded that many wells are polluted with LNAPLs and DNAPLs and the concentrations exceed the WHO limit. A risk pollution map is prepared based on seven factors, which are the distance to source, depth to water table, slope, lineaments, lithology, soil, and recharge rate. The produced map revealed that the area near to the petrol and refinery stations of very high and high-risk intensity, which covers an area of almost 50% of all studied areas in the eastern and western parts. While the area away from the station the impact of petrol contaminant decreases gradually and with low to very low risk. The geology, hydrogeology, and the properties of the soils play an important role in dispersing and the size of plume by the organic products. In the case of the future program plan to drill water wells, it is better to avoid all areas encompassed by the moderate to very high zone. A strategic plan is needed for restricting the illegal petrol and refinery stations and unurgent plan is required for remediation of the polluted groundwater and soils by PAHs. The applications in [6,46] are applicable for groundwater remediations in the study area.
Author Contributions
D.A.M.A.A.M., T.O.A., and P.M.A.-J. performed the methodology, validation, investigation, formal analysis, software, and writing of the draft manuscript. N.A.-A. performed validation, visualization, project management, writing of the draft form of the manuscript, and writing—review and editing.
Funding
This research was funded by Governorate of Sulaymaniyah grant number 252 and the APC was funded by Lulea University of technology.
Acknowledgments
Special thanks are extended to Babarasul Ghafour Essa, Director of Groundwater Directorate, Sulaymaniyah, for the support of the idea. Special thanks go to Mohamed Mahmood in the Oil Distribution Directorate for his significant information. Additionally, we would like to give special thanks to Bahman Hama Tofiq in the Oil Refinery Directorate for his help and collaboration. The authors also acknowledge the CRSA Laboratory in Italy for analyzing the soil and water samples. Thanks go to Lulea University and University of Sulaimani for supporting the joint work of researchers from both universities.
Conflicts of Interest
The authors declare no conflict of interest.
References
- Wang, L.W.; Yang, Z.F.; Niu, J.F.; Wang, J.Y. Characterization, ecological risk assessment and source diagnostics of polycyclic aromatic hydrocarbons in water column of the Yellow River Delta, one of the most plenty biodiversity zones in the world. J. Hazard. Mater. 2009, 169, 462–463. [Google Scholar] [CrossRef]
- Yu, Y.; Li, Y.X.; Shen, Z.Y.; Yang, Z.F.; Mo, L.; Kong, Y.H.; Lou, I.C. Occurrence and possible sources of organochlorine pesticides (OCPs) and polychlorinated biphenyls (PCBs) along the Chao River, China. Chemosphere 2014, 114, 137–141. [Google Scholar] [CrossRef]
- Ugochukwu, U.C.; Ochonogor, A. Groundwater contamination by polycyclic aromatic hydrocarbon due to diesel spill from a telecom base station in a Nigerian City: Assessment of human health risk exposure. Environ. Monit. Assess. 2018, 190, 249. [Google Scholar] [CrossRef]
- Marinescu, M.; Toti, M.; Tanase, V.; Carabulea, V. An assessment of the effects of crude oil pollution on soil properties. Ann. Food Sci. Technol. 2010, 11, 94–99. [Google Scholar]
- Huling, S.G.; Weaver, J.W. Dense Non-Aqueous Phase Liquids; EPA Ground Water Issue, EPA/540/4-91-002; U.S. Environmental Protection Agency: Washington, DC, USA, 1991; p. 21.
- Baker, R.S.; Nielsen, S.G.; Heron, G.; Ploug, N. How effective is thermal remediation of DNAPL source zones in reducing groundwater concentrations? Groundw. Monit. Remediat. 2016, 36, 38–53. [Google Scholar] [CrossRef]
- Pankow, J.F.; Cherry, J.A. (Eds.) Dense Chlorinated Solvents and Other DNAPLs in Ground Water; Waterloo Press: Portland, OR, USA, 1996. [Google Scholar]
- Newell, C.J.; Acree, S.D.; Ross, R.R.; Huling, S.G. Ground Water Issue: Light Nonaqueous Phase Liquids; Technical Report No. PB-95-267738/XAB; Groundwater Services, Inc.: Houston, TX, USA, 1995. [Google Scholar]
- Newell, C.J.; Acree, S.D.; Ross, R.R.; Huling, S.G. Light Nonaqueous Phase Liquids; EPA Groundwater Issue, EPA/540/S-95/500; U.S. Environmental Protection Agency: Washington, DC, USA, 1995.
- U.S. Department of Health and Human Services, Public Health Service Agency for Toxic Substances and Disease Registry. Toxicological Profile for Dichlorobenzene (Update); U.S. Department of Health and Human Services: Atlanta, GA, USA, 2006; p. 493.
- Konečný, F.; Boháček, Z.; Müller, P.; Kovářová, M.; Sedláčková, I. Contamination of soils and groundwater by petroleum hydrocarbons and volatile organic compounds—Case study: ELSLAV BRNO. Bull. Geosci. 2003, 78, 225–239. [Google Scholar]
- McCaulou, D.R.; Jewett, D.G.; Huling, S.G. Nonaqueous Phase Liquids Compatibility with Materials Used In Well Construction, Sampling, and Remediation; EPA Groundwater Issue, EPA/540/S-95/500; U.S. Environmental Protection Agency: Washington, DC, USA, 1995.
- Mercer, J.W.; Cohen, R.M.; Matthews, J. DNAPL Site Evaluation; C.K. Smoley: Boca Raton, FL, USA, 1993; p. 314. [Google Scholar]
- Hamamin, D.F. Passive soil gas technique for investigating soil and groundwater plume emanating from volatile organic hydrocarbon at Bazian oil refinery site. Sci. Total Environ. 2018, 622, 1485–1498. [Google Scholar] [CrossRef]
- Jung, K.H.; Yan, B.; Moors, K.; Chillrud, S.N.; Perzanowski, M.S.; Whyatt, R.M.; Hoepner, L.; Goldstein, I.; Zhang, B.; Camann, D.; et al. Repeated exposure to polycyclic aromatic hydrocarbons and asthma: Effect of seroatopy. Ann. Allergy Asthma Immunol. 2012, 109, 249–254. [Google Scholar] [CrossRef]
- Igwe, C.J.; Ikaogo, P.O. Environmental effects of polycyclic aromatic hydrocarbons. J. Nat. Sci. Res. 2015, 5, 117–132. [Google Scholar]
- Harris, M.; Herbert, S. Contaminated Land: Investigation, Assessment and Remediation; Thomas Telford Publications: London, UK, 1994. [Google Scholar]
- Sharbazheri, K.; Ghafor, I.; Muhammed, Q. Biostratigraphy of the cretaceous/tertiary boundary in the Sirwan Valley (Sulaimani Region, Kurdistan, NE Iraq). Geol. Carpathica 2009, 60, 381–396. [Google Scholar] [CrossRef]
- Stevanovic, Z.; Iurkiewicz, A. Hydrogeology of Northern Iraq, General Hydrogeology and Aquifer System, 1st ed.; Food and Agriculture Organization of the United Nations: Rome, Italy, 2004; Volume 2. [Google Scholar]
- Qaradaghy, R.A.Q. Vulnerability and Risk Intensity Maps of Groundwater Aquifers in Sulaymaniyah Sub-basin Iraqi Kurdistan Region. Master’s Thesis, School of Science, University of Sulaimani, Sulaymaniyah, Iraq, August 2015; p. 136, Unpublished. [Google Scholar]
- Al-Manmi, D.A.M. Chemical and Environmental Study of Groundwater in Sulaymaniyah City and its Outskirts. Master’s Thesis, College of Science, University of Baghdad, Baghdad, Iraq, April 2002; p. 295, Unpublished. [Google Scholar]
- Bety, A.K.H.S. Urban Geomorphology of Sulaymaniyah City, Using Remote Sensing and GIS Techniques, Kurdistan Region, Iraq. Ph.D. Thesis, University of Sulaimani, Sulaymaniyah, Iraq, July 2013; p. 253, Unpublished. [Google Scholar]
- Karim, K.H.; Salih, A.O.; Ahmad, S.H. Stratigraphic Analysis of Azmir-Goizha anticline by Nannofossils. J. Zankoy Sulaimani Part A 2013, 15, 103–124. [Google Scholar] [CrossRef]
- USEPA. Method 5030C: The Closed System Purge and Trap and Extraction for Volatile Organics in Soil and Waste Samples, SW-846. Available online: https://www.epa.gov/sites/production/files/2015-12/documents/5035C.pdf (accessed on 20 May 2018).
- USEPA. Method 8260C: Volatile Organic Compounds by Gas Chromatography/Mass Spectrometry (GC/MS), SW-846. Available online: https://www.epa.gov/sites/production/files/2015-07/.../epa-8260c.pdf (accessed on 20 May 2018).
- USEPA. Method 5035A: Closed-System Purgeand-Trap and Extraction for Volatile Organics in Soil and Waste Samples. In Test Methods for Evaluating Solid Waste, Physical/Chemical Methods, SW-846. Available online: http://www.epa.gov/epaoswer/hazwaste/test/main.htm (accessed on 15 March 2018).
- USEPA. Method 5021A: Volatile Organic Compounds in Various Sample Matrices Using Equilibrium Headspace Analysys. In Test Methods for Evaluating Solid Waste, Physical/Chemical Methods, SW-846. Available online: http://www.epa.gov/epaoswer/hazwaste/test/main.htm (accessed on 15 March 2018).
- Jerry, R. Schoenleber Field Sampling Procedures Manual; New Jersey Department of Environmental Protection: Trenton, NJ, USA, 2005; p. 574.
- Turner, M.F. Analytical Method Development for Determination of Volatile Organic Compounds in Calcareous Desert Soil. Ph.D. Thesis, University of Nevada, Las Vegas, NV, USA, 2009. [Google Scholar]
- Ciesielczuk, T.; Kusza, G.; Poluszyńska, J. Assessment of PAHs and the total content of organic matter in landfill leachate and groundwater. Ecol. Chem. Eng. 2006, 13, 1225–1230. [Google Scholar]
- Ciesielczuk, T.; Nabzdyjak, T. Distribution of aliphatic and polycyclic aromatic hydrocarbons in groundwaters in the airport fuel store area. Ecol. Chem. Eng. 2006, 13, 531–538. [Google Scholar]
- Ciesielczuk, T.; Kusza, G.; Poluszyńska, J.; Kochanowska, K. Pollution of flooded arable soils with heavy metals and polycyclic aromatic hydrocarbons (PAHs). Water Air Soil Pollut. 2014, 225, 2145. [Google Scholar] [CrossRef]
- Michałowicz, J.; Duda, W. Phenols—Sources and Toxicity. Pol. J. Environ. Stud. 2007, 16, 347–362. [Google Scholar]
- Krantzberg, G.; Tanik, A.; do Carmo, J.S.A.; Indarto, A.; Ekdal, A.; Gurel, M.; Pehlivanoglu Mantas, E.; Wang, Z.; Wang, G.; Zhao, C.; et al. Advances in Water Quality Control; Scientific Research Publishing, Inc.: Wuhan, China, 2010. [Google Scholar]
- Ciurean, R.L.; Schröter, D.; Glade, T. Conceptual frameworks of vulnerability assessments for natural disasters reduction. In Approaches to Disaster Management-Examining the Implications of Hazards, Emergencies and Disasters; IntechOpen: London, UK, 2013. [Google Scholar]
- Saaty, T.L. Axiomatic foundation of the analytic hierarchy process. Manag. Sci. 1986, 32, 841–855. [Google Scholar] [CrossRef]
- Merkin, B.G. Group Choice; John Wiley & Sons: New York, NY, USA, 1979. [Google Scholar]
- Saaty, T.L. The Analytic Hierarchy Process: Planning, Priority Setting, Resources Allocation; McGraw: New York, NY, USA, 1980. [Google Scholar]
- Saaty, T.L. How to make a decision: The analytic hierarchy process. Interfaces 1994, 24, 19–43. [Google Scholar] [CrossRef]
- Environmental Protection Agency. 2018 Edition of the Drinking Water Standards and Health Advisories; Environmental Protection Agency: Washington, DC, USA, 2018.
- Chang, C.W.; Wu, C.R.; Lin, C.T.; Lin, H.L. Evaluating digital video recorder systems using analytic hierarchy and analytic network processes. Inf. Sci. 2007, 177, 3383–3396. [Google Scholar] [CrossRef]
- Isalou, A.A.; Zamani, V.; Shahmoradi, B.; Alizadeh, H. Landfill site selection using integrated fuzzy logic and analytic network process (F-ANP). Environ. Earth Sci. 2013, 68, 1745–1755. [Google Scholar] [CrossRef]
- World Health Organization. Guidelines for Drinking-Water Quality, 4th Edition. Recommendations; WHO: Geneva, Switzerland, 2011; p. 56. [Google Scholar]
- Abdel-Shafy, H.I.; Mansour, M.S. A review on polycyclic aromatic hydrocarbons: Source, environmental impact, effect on human health and remediation. Egypt. J. Pet. 2016, 25, 107–123. [Google Scholar] [CrossRef]
- Pinto, D.; Shrestha, S.; Babel, M.S.; Ninsawat, S. Delineation of groundwater potential zones in the Comoro watershed, Timor Leste using GIS, remote sensing and analytic hierarchy process (AHP) technique. Appl. Water Sci. 2017, 7, 503–519. [Google Scholar] [CrossRef]
- Hernández-Espriú, A.; Martínez-Santos, P.; Sánchez-León, E.; Marín, L.E. Free-product plume distribution and recovery modeling prediction in a diesel-contaminated volcanic aquifer. Phys. Chem. Earth Parts A/B/C 2012, 37, 43–51. [Google Scholar] [CrossRef]
© 2019 by the authors. Licensee MDPI, Basel, Switzerland. This article is an open access article distributed under the terms and conditions of the Creative Commons Attribution (CC BY) license (http://creativecommons.org/licenses/by/4.0/).