Article

Precipitation and Flow Variations in the Lancang–Mekong River Basin and the Implications of Monsoon Fluctuation and Regional Topography

1
Institution of International Rivers and Eco-security, Yunnan University, Kunming 650091, China
2
Yunnan Key Laboratory of International Rivers and Transboundary Eco-Security, Kunming 650091, China
*
Author to whom correspondence should be addressed.
Water 2019, 11(10), 2086; https://doi.org/10.3390/w11102086
Submission received: 28 August 2019 / Revised: 3 October 2019 / Accepted: 4 October 2019 / Published: 6 October 2019
(This article belongs to the Section Hydrology)

Abstract

:
In the Lancang–Mekong River Basin, monsoon fluctuation affects profoundly the spatial and temporal distributions of precipitation, which is the major cause of the uncertainty in hydrological processes and water resources. This study investigated the implications of monsoon fluctuation and regional topography on precipitation variation in the Lancang–Mekong River Basin, and it examined the potential link between monsoons and river flow. The results indicated that the fluctuations of the western North Pacific summer monsoon (WNPSM) and the Indian summer monsoon (ISM) played different roles in precipitation variation. The areas in which precipitation variation was found synchronous with the WNPSM were much larger than those associated with the ISM. Significant positive correlation was found between precipitation during June–September (JJAS) and the WNPSM index (WNPMI) and the ISM index (IMI) over 29.3% and 12.8% of the basin, respectively, and that these areas were distributed mainly on the left and right bank downstream, respectively. A strong (weak) WNPSM was found to increase (decrease) moist westerlies that caused excess (deficient) orographic precipitation through the interaction with the Annamite Mountains. During strong (weak) WNPSM years, observed river flow during JJAS at the Mukdahan, Pakse, and Stung Treng stations in the downstream area were 8.0% (5.0%), 8.2% (12.6%), and 12.1% (19.5%) higher (lower) than the mean, respectively, showing that downstream river flow is modulated by the WNPSM intensity. These findings could support long-term hydrological predictions, and be beneficial for optimal flood control and water resource utilization in the basin.

1. Introduction

The Lancang–Mekong River Basin is the largest and most important river basin in Southeast Asia, and approximately 70 million people live within its six riparian countries [1]. The population of the basin relies heavily upon agriculture, and the annual regional grain yield is sufficient to feed 300 million people [2]. Food security and water-related occupations are highly vulnerable to the variabilities of precipitation and river flow [3].
The climate of the Lancang–Mekong River Basin is strongly affected by monsoon systems [4]. The interaction of various monsoon systems that include the Indian summer monsoon (ISM) and the western North Pacific summer monsoon (WNPSM) characterizes the complex climatic dynamics of this large basin [5,6,7]. Monsoon fluctuation primarily influences the distribution and intensity of precipitation and the consequent river flow during the rainy season [8,9,10], leading to uncertainty regarding regional hydrological processes and water resources [11].
An annual flood is the most pervasive physical event in the basin, the occurrences of which are generally relative to extreme precipitation. Excessive and intensive precipitation during the rainy season may induce a flood risk of different magnitudes, ranges and durations over the mainstream and various tributaries [2]. As the residents of the riparian countries are highly dependent on water resources to develop agriculture and inland fisheries, these uncertainties have important regional and socioeconomic impacts [12,13,14,15].
The influence mechanisms of monsoon fluctuation on precipitation anomalies have been discussed in previous studies [8,16,17,18]. During strong WNPSM years, anomalous westerlies from the Indian Ocean transport increasing quantities of moisture to the lower Lancang–Mekong River Basin, leading to higher regional precipitation [8,16]. In addition, Yang et al. (2018) found that when the ISM is abnormally strong, there is a convergence of warm, moist air from both the Bay of Bengal and the South China Sea over the western parts of the Lancang–Mekong River Basin, which leads to heavy precipitation [18].
Topography is responsible for much of the spatially heterogeneous pattern of precipitation in the Lancang–Mekong River Basin, because heavy orographic precipitation occurs frequently over windward areas [19,20]. Although some studies have researched the impact of monsoon variability on precipitation distribution by analyzing water vapor transport, the interaction of monsoon circulations with regional topographic features, and the implications regarding precipitation and river flow, have rarely been studied [21], impeding clarification of the relationship between monsoons and resulting flooding.
This study investigated the influences of monsoon fluctuation and regional topography on precipitation variation over the Lancang–Mekong River Basin, and it explored the potential link between monsoon intensity and river flow. The primary objectives of this study are: (1) To describe the spatiotemporal variations of precipitation in relation to monsoon variability; (2) To explore the interaction between regional topography and anomalous monsoon characteristics; and (3) To establish an association between monsoon fluctuation and the variation of both precipitation and river flow. The findings could improve hydrological predictions and provide enhanced support for flood control and water resource utilization in the Lancang–Mekong River Basin.

2. Materials and Methods
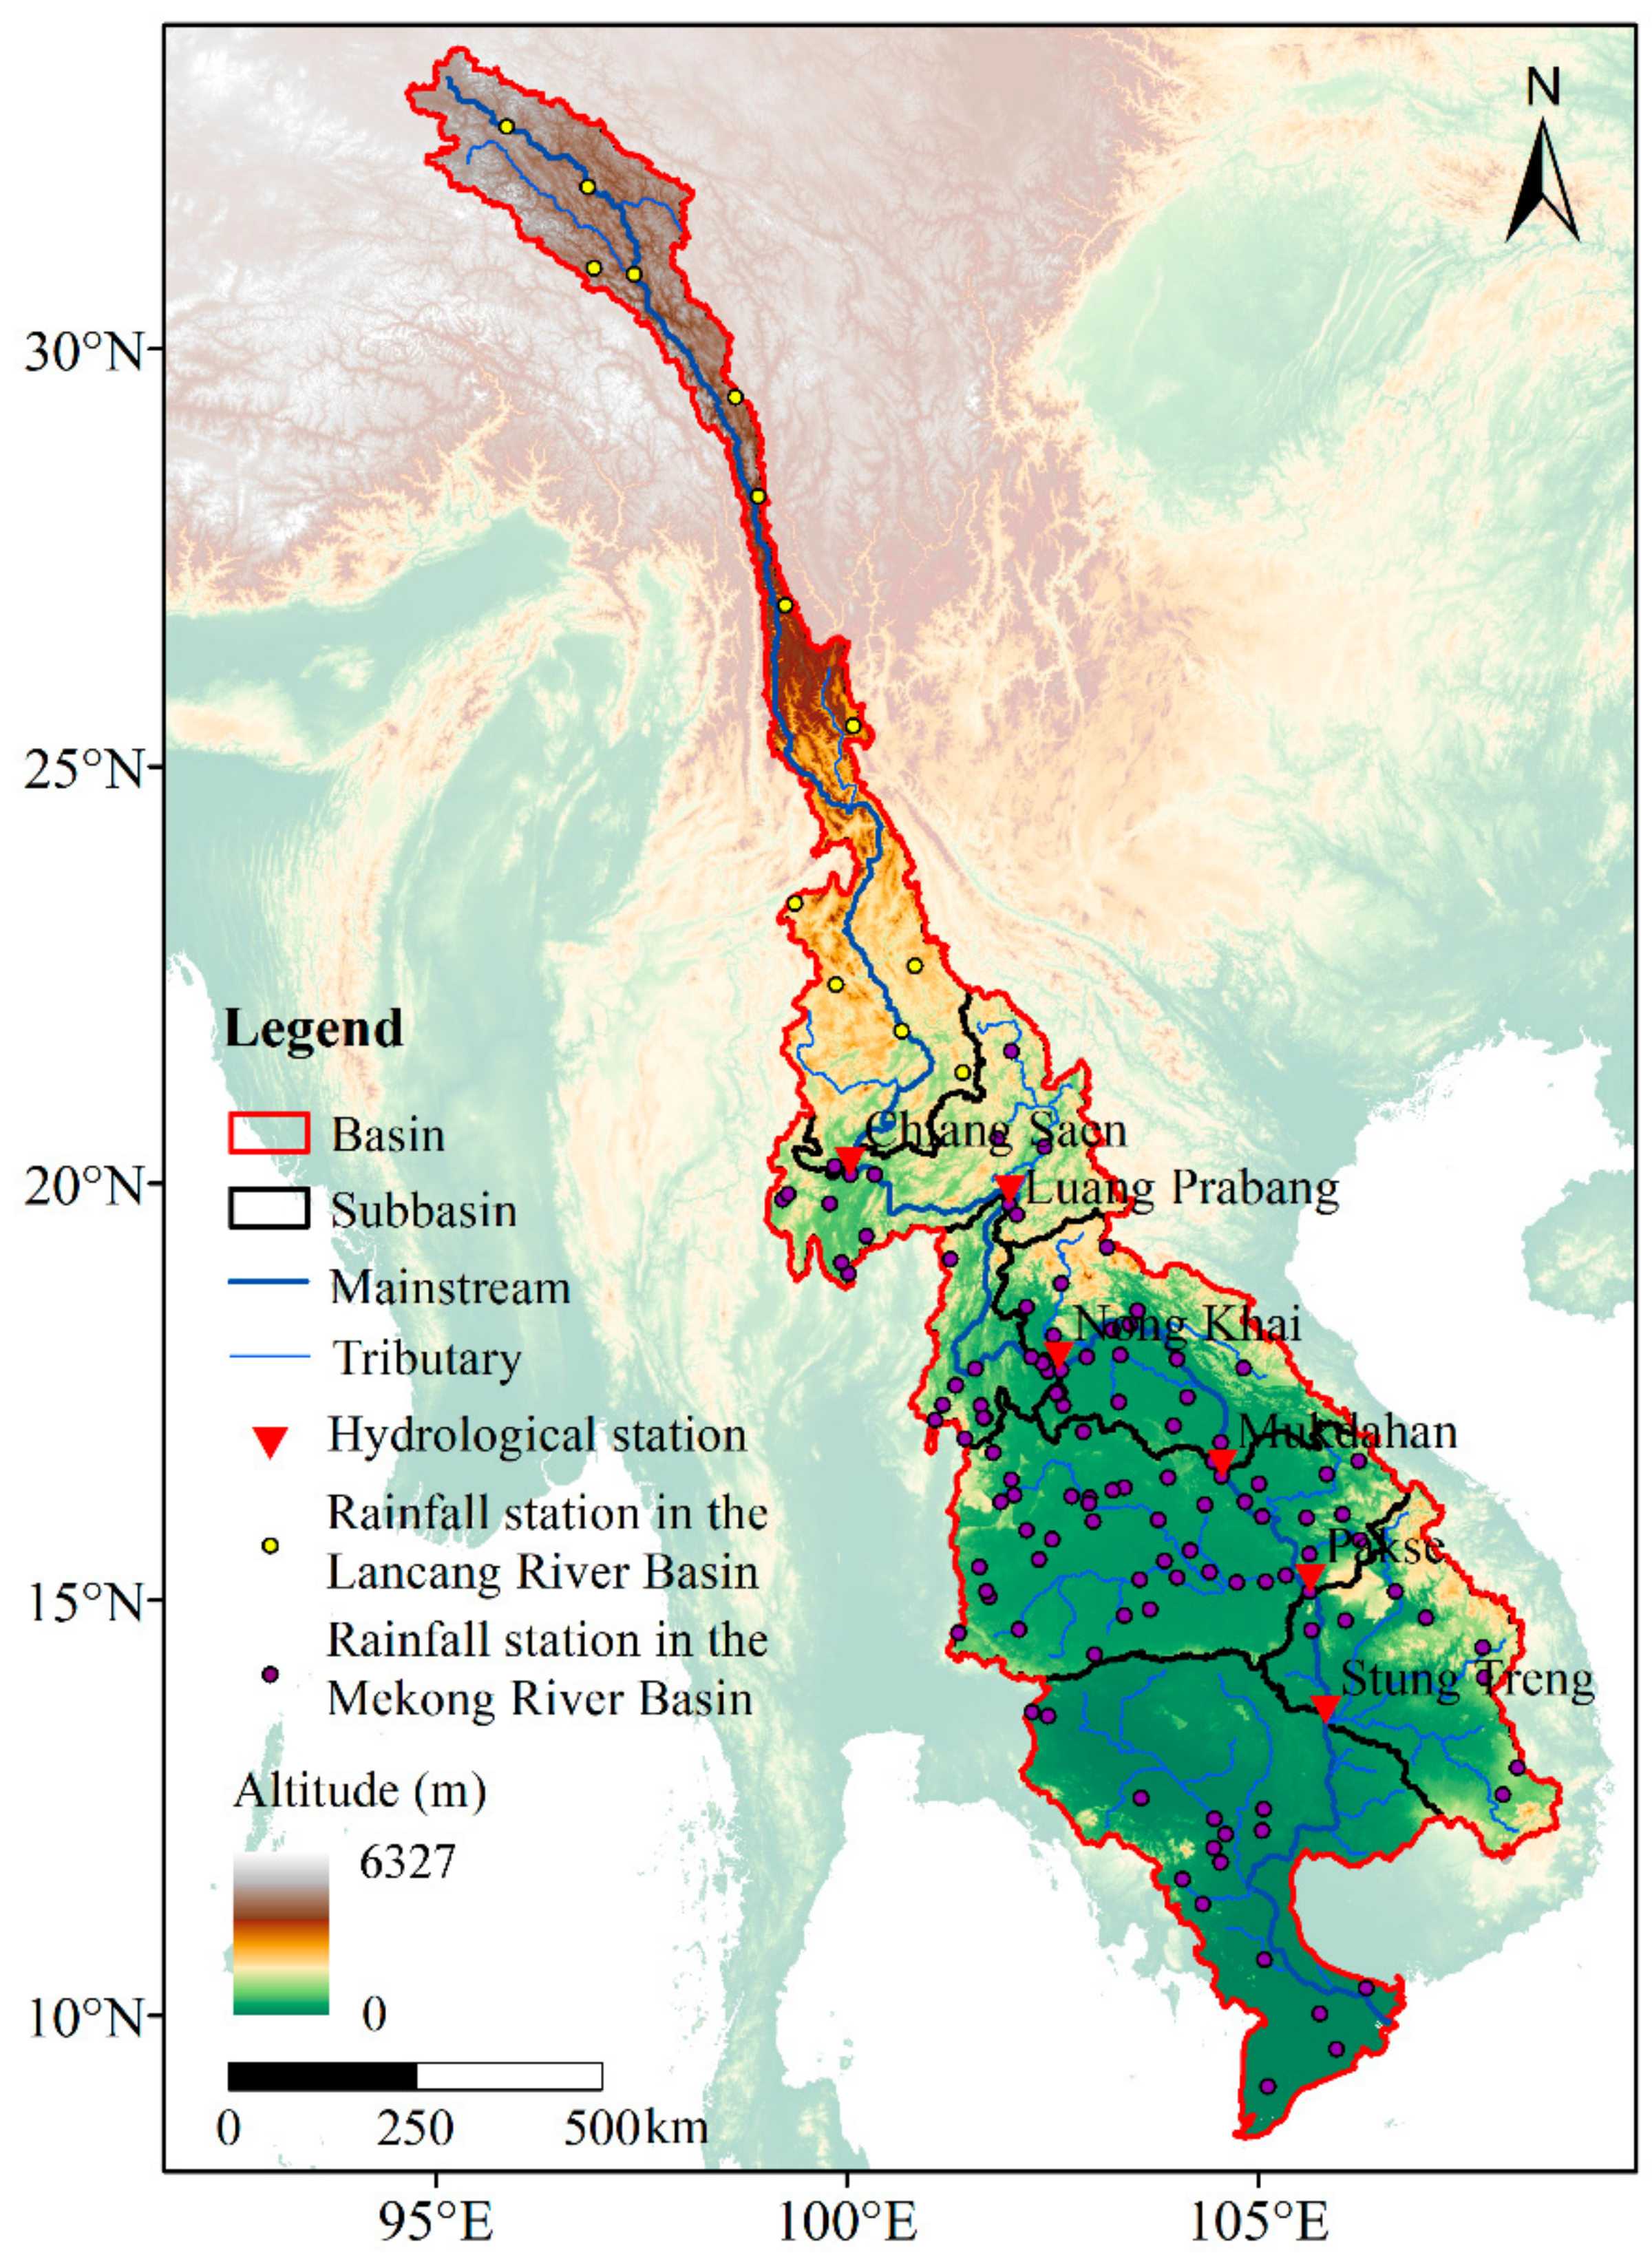
2.1. Study Area

The Lancang–Mekong River, which originates from the Tibetan Plateau, runs through China, Myanmar, Laos, Thailand, Cambodia and Vietnam, before flowing into the South China Sea (Figure 1). The river is 4880 km (3032 mi) in length and it drains a catchment area of 806 × 103 km2. The annual flow is 475 × 109 m3, which means the Lancang–Mekong River ranks as the eighth largest in the world in terms of flow.
From high mountains and deep gullies in the upstream of the basin, the geomorphology transforms to relatively flat terrain with medium-sized mountains and wide valleys in the downstream area with large tributary river systems [22]. The Lancang–Mekong River Basin is generally divided into the upper Lancang–Mekong River Basin (the Lancang River Basin in China) and the lower Lancang–Mekong River Basin. The latter mainly comprises five different physiographic regions: The Northern Highlands, Eastern Highlands, Korat Plateau, Tonle Sap Basin, and the Mekong Delta [23]. Of these, the Eastern Highlands area consists mostly of the western slopes of the Annamite Mountains that are shared by Laos and Vietnam. Enhanced precipitation occurs when moisture from the Indian Ocean crosses the Annamite Mountains, and the highest annual precipitation exceeds 4000 mm [10,24]
The Lancang–Mekong River Basin has two distinct seasons: A rainy season (May–October) and a dry season (November–April). Although interannual variation is high, monsoon precipitation during the rainy season can contribute more than 80% of the annual regional precipitation [23]. During the dry season, the basin is influenced mostly by dry air from the northeastern land. The clear difference between the two seasons generates a hydrological regime with a monomodal flood pulse that creates an ecosystem rich in biological diversity and production [21].
Annual river flow has marked regional distribution characteristics. Flow in the upper Lancang–Mekong River Basin accounts for 16% of the annual total, while most of the remainder is derived from the large tributaries in Laos and the 3S (Sekong, Sesan, and Srepok) river system on the downstream left bank.

2.2. Data Source

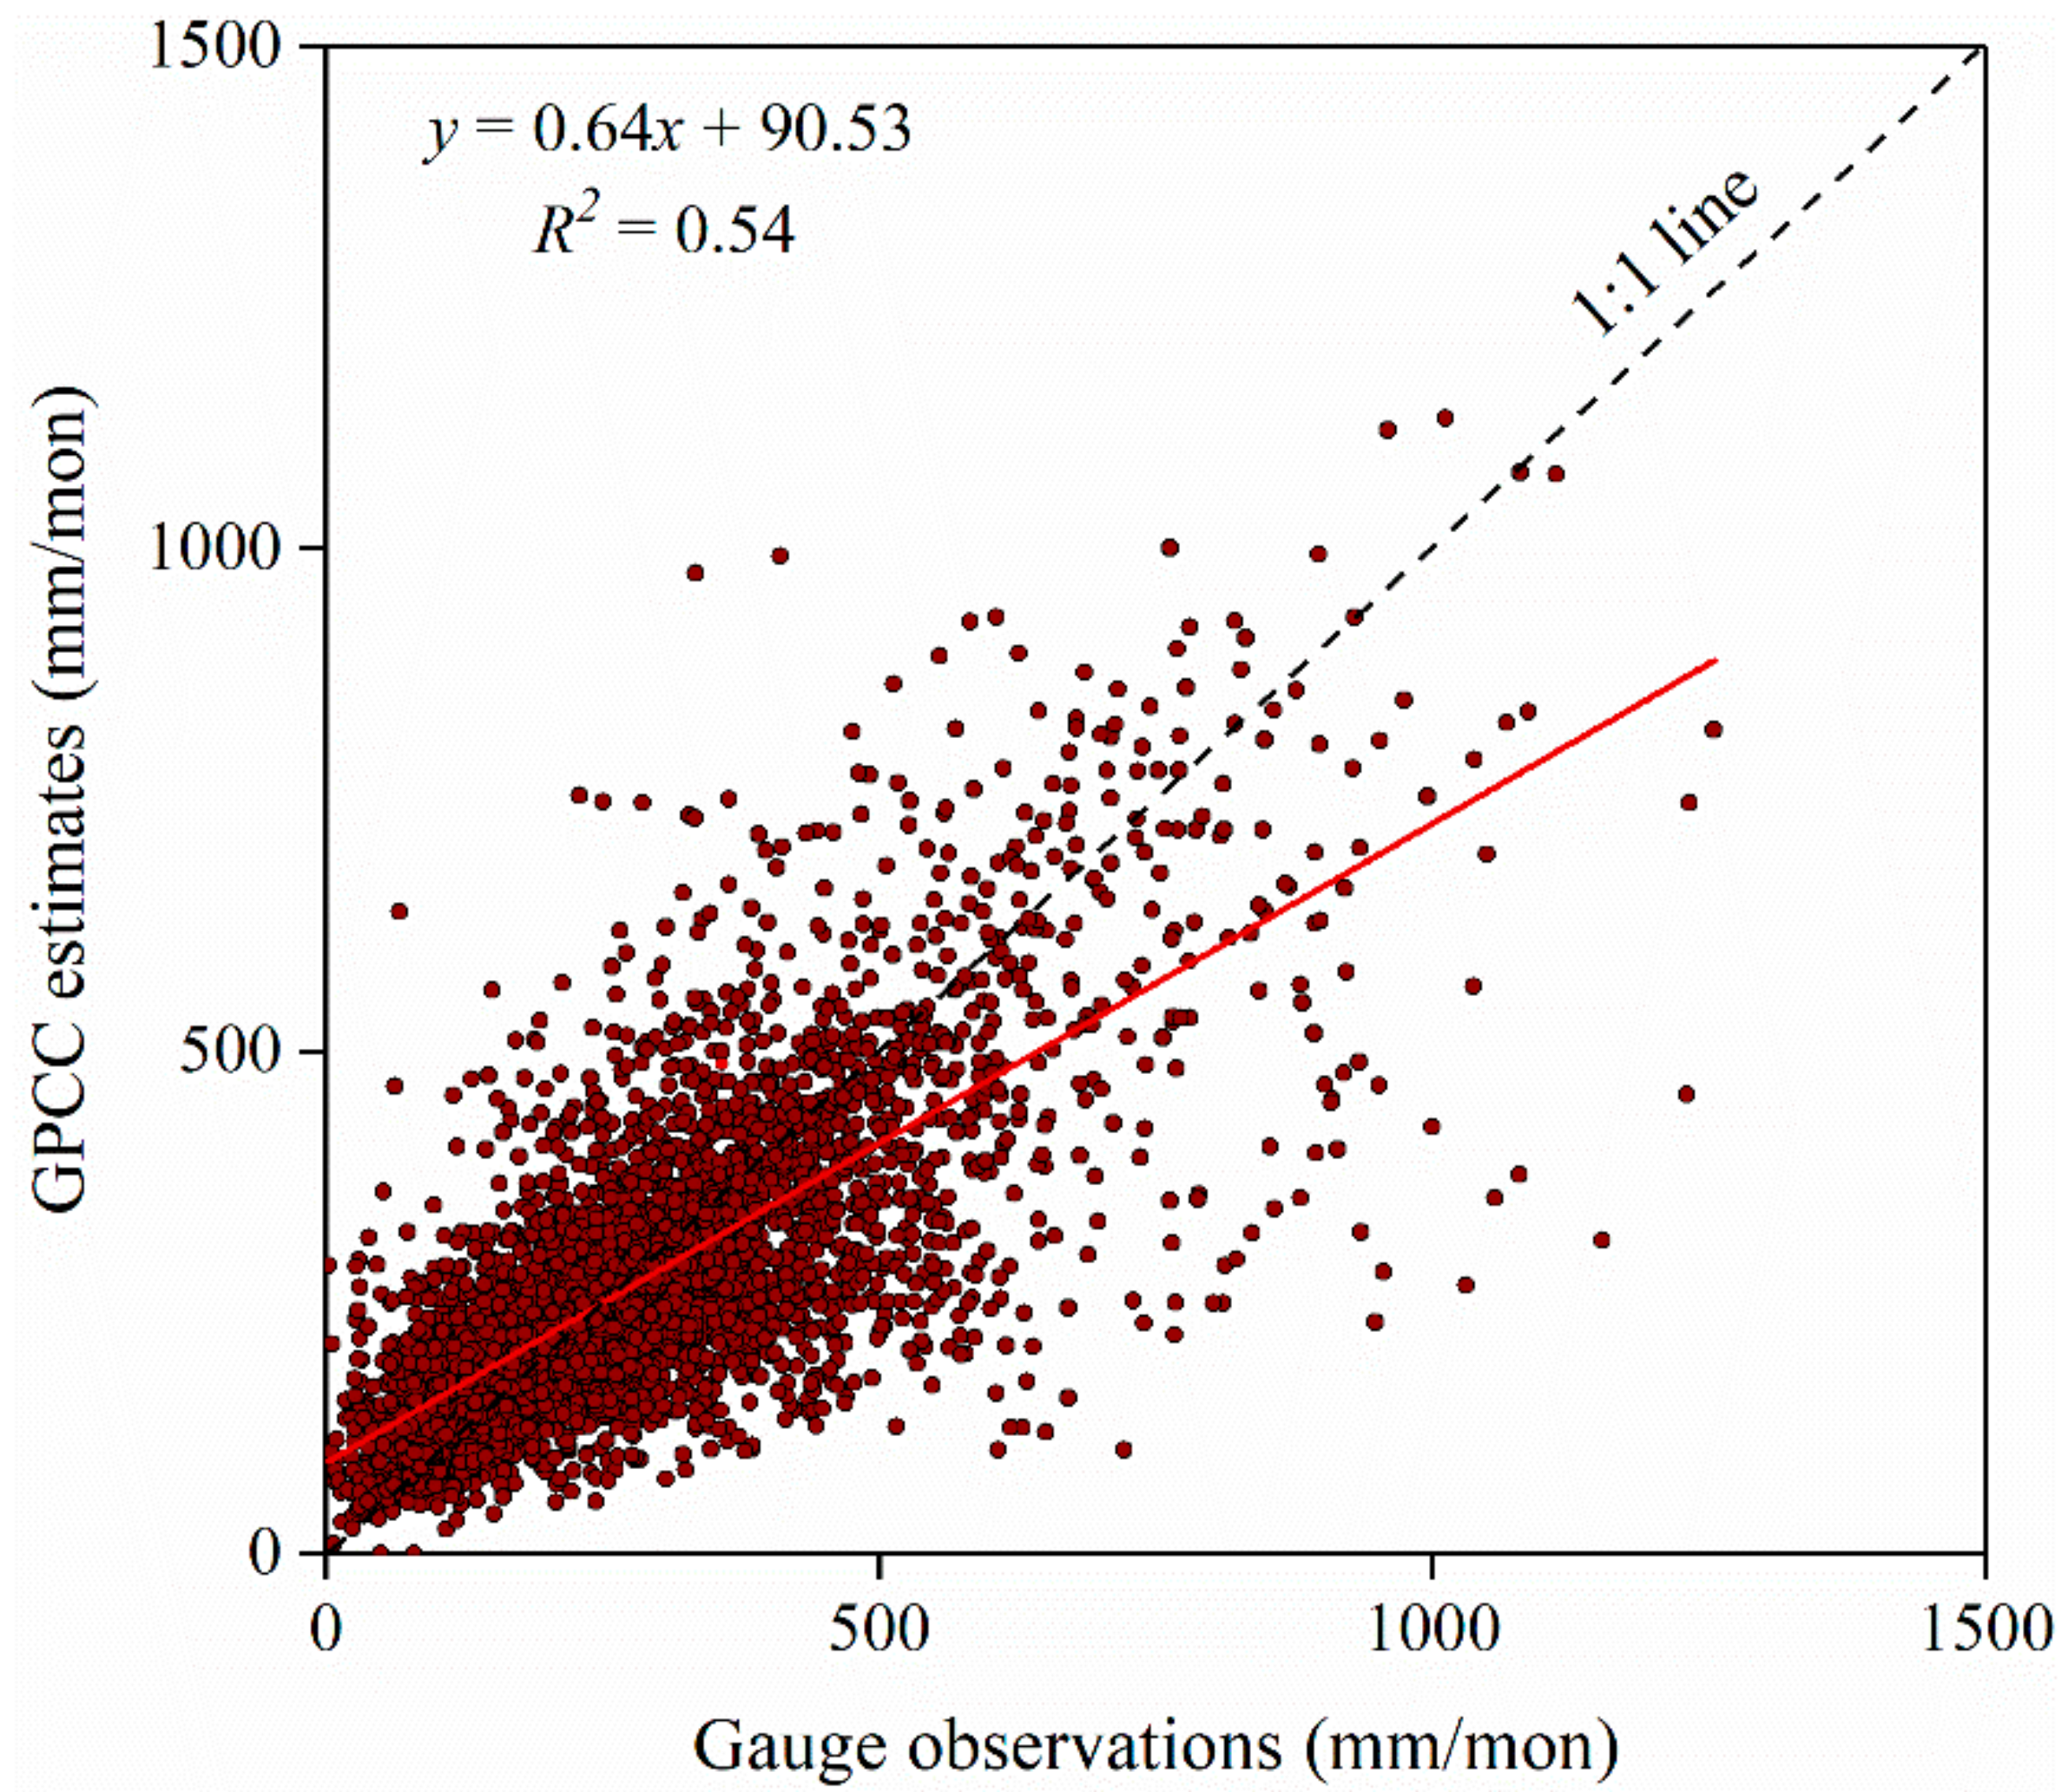
2.2.1. Global Precipitation Climatology Centre (GPCC) data

In consideration of sparsely and unevenly distributed rainfall stations and short observation records, the GPCC data were applied in precipitation analysis instead of gauge observations. The GPCC provides global gridded land surface precipitation estimates based on more than 85,000 stations worldwide [25,26,27]. This study used the recently published Full Data Monthly Product V.2018 (V8) with 0.25° spatial resolution to explore the long-term variations of regional precipitation during 1951–2015 [28].

2.2.2. Rain Gauge Data

Before using GPCC data, gauge observations during June–September (JJAS) were applied to evaluate the accuracy of the GPCC data in the study area. The rain gauge observation data were collected from the China Meteorological Administration (CMA) and the Mekong River Commission (MRC). In the lower Lancang–Mekong River Basin, observational data from 275 rainfall stations were collected from the MRC historical dataset. However, some of these data did not contain a full time series, or they had a low level of quality that did not meet the requirements of the evaluation. Hence, we selected observed monthly precipitation data during 1998–2005 from 13 and 116 stations in the upper and lower Lancang–Mekong River Basin, respectively. The locations of these stations are shown in Figure 1. Based on the location of each station, the corresponding GPCC grid was found, and the gridded precipitation was extracted for comparison with the gauge observation. This study utilized four statistical metrics for the evaluation, including the Pearson correlation coefficient (r), relative bias (BIAS), mean error (ME) and mean absolute error (MAE) [29].

2.2.3. Flow Data

Flow data at six hydrological stations on the mainstream (i.e., Chiang Saen, Luang Prabang, Nong Khai, Mukdahan, Pakse, and Stung Treng station) were used in this study (Figure 1); the drainage area and annual flow at each of these stations are listed in Table 1. Stung Treng station drains an area of 635 × 103 km2, i.e., about 79% of the basin area. In addition, the annual flow controlled by the Stung Treng station is approximately 413 × 109 m3, accounting for 87% of the entire basin.

2.2.4. Monsoon Index

To represent the interannual variability of the monsoons, the western North Pacific summer monsoon (WNPSM) index (WNPMI) and Indian summer monsoon (ISM) index (IMI) defined by Wang et al. (2001) [30] were adopted, respectively. The WNPMI was calculated using the difference in 850-hPa zonal winds between a southern area in 100° E–130° E, 5° N–15° N and a northern area in 110° E–140° E, 20° N–30° N, while the IMI was calculated using the difference in 850-hPa zonal winds between a southern area in 40° E–80° E, 5° N–15° N and a northern area in 70° E–90° E, 20° N–30° N.
This study directly applied the indices calculated from the International Pacific Research Center (IPRC). Based on the monsoon index, a strong (weak) monsoon year was defined as that in which the monsoon index was greater (less) than one standard deviation.

2.2.5. Wind Data

To analyze the wind field variation caused by the monsoon fluctuation over the basin, this study acquired wind data from the National Centers for Environmental Prediction/National Centers for Atmospheric Research (NCEP/NCAR) reanalysis dataset. Meridional wind speed (v) and zonal wind speed (u) data at 850-hPa with 2.5° spatial resolution were used to synthesize the wind field.

2.3. Precipitation Variation Analysis

The spatiotemporal pattern of the long-term variations of precipitation during JJAS over the Lancang–Mekong River Basin was examined by empirical orthogonal function (EOF) analysis on the basis of the covariance matrix. One of the major purposes of the EOF is to reduce the number of variables to study, while retaining most of the information contained in the original variables to interpret and understand the structure of data [31]. Prior to the EOF analysis, we picked out the region within the watershed boundary, and converted the original precipitation data into standardized data to remove the linear trend at each grid point. The EOF analysis was then used to examine the leading modes of spatial variability in precipitation during JJAS and get time series of the principal component (PC). In addition, the correlation analysis and composite difference analysis based on the spatial statistical analysis were also selected for the study, which were applied at each grid within the basin.

3. Results

3.1. Spatial Distribution of Precipitation

A scatterplot of monthly precipitation during JJAS from gauge observations against the GPCC estimates is presented in Figure 2. It showed a good agreement between the GPCC estimates and the gauge observations with r of 0.74. The BIAS and ME of the GPCC estimates were –4.4% and –12.5 mm, respectively, indicating a slight underestimation by the GPCC data. Generally, the GPCC estimates were found to be consistent with the gauge observations during JJAS, making them suitable to analyze precipitation characteristics in the Lancang–Mekong River Basin.
Precipitation during JJAS was found to vary in the range 330.4–2787.5 mm, and the mean throughout the entire basin was 1013.0 mm (Figure 3a). Precipitation during JJAS was lower in the upstream area, mostly less than 1000 mm, whereas precipitation in the midstream and downstream areas was abundant, and it increased with an east–west gradient. In the lower Lancang–Mekong River Basin, precipitation on the left bank exceeded 1000 mm, while precipitation on the right bank was lower, mostly less than 1000 mm. The highest precipitation occurred over the western slopes of the Annamite Mountains, and the least precipitation was recorded on the Korat Plateau. In most of the basin, precipitation during JJAS accounted for more than 60% of the annual total. In the lower Lancang–Mekong River Basin, precipitation in most areas of the left bank accounted for more than 70% of the annual total, while it represented less than 70% in most area of the right bank.
The coefficient of variation (Cv) of precipitation during JJAS was found in range of 0.07–0.55 (Figure 3b), and higher Cv values were concentrated mostly in the areas of the downstream left bank, which is also the area that generally experiences the largest precipitation.

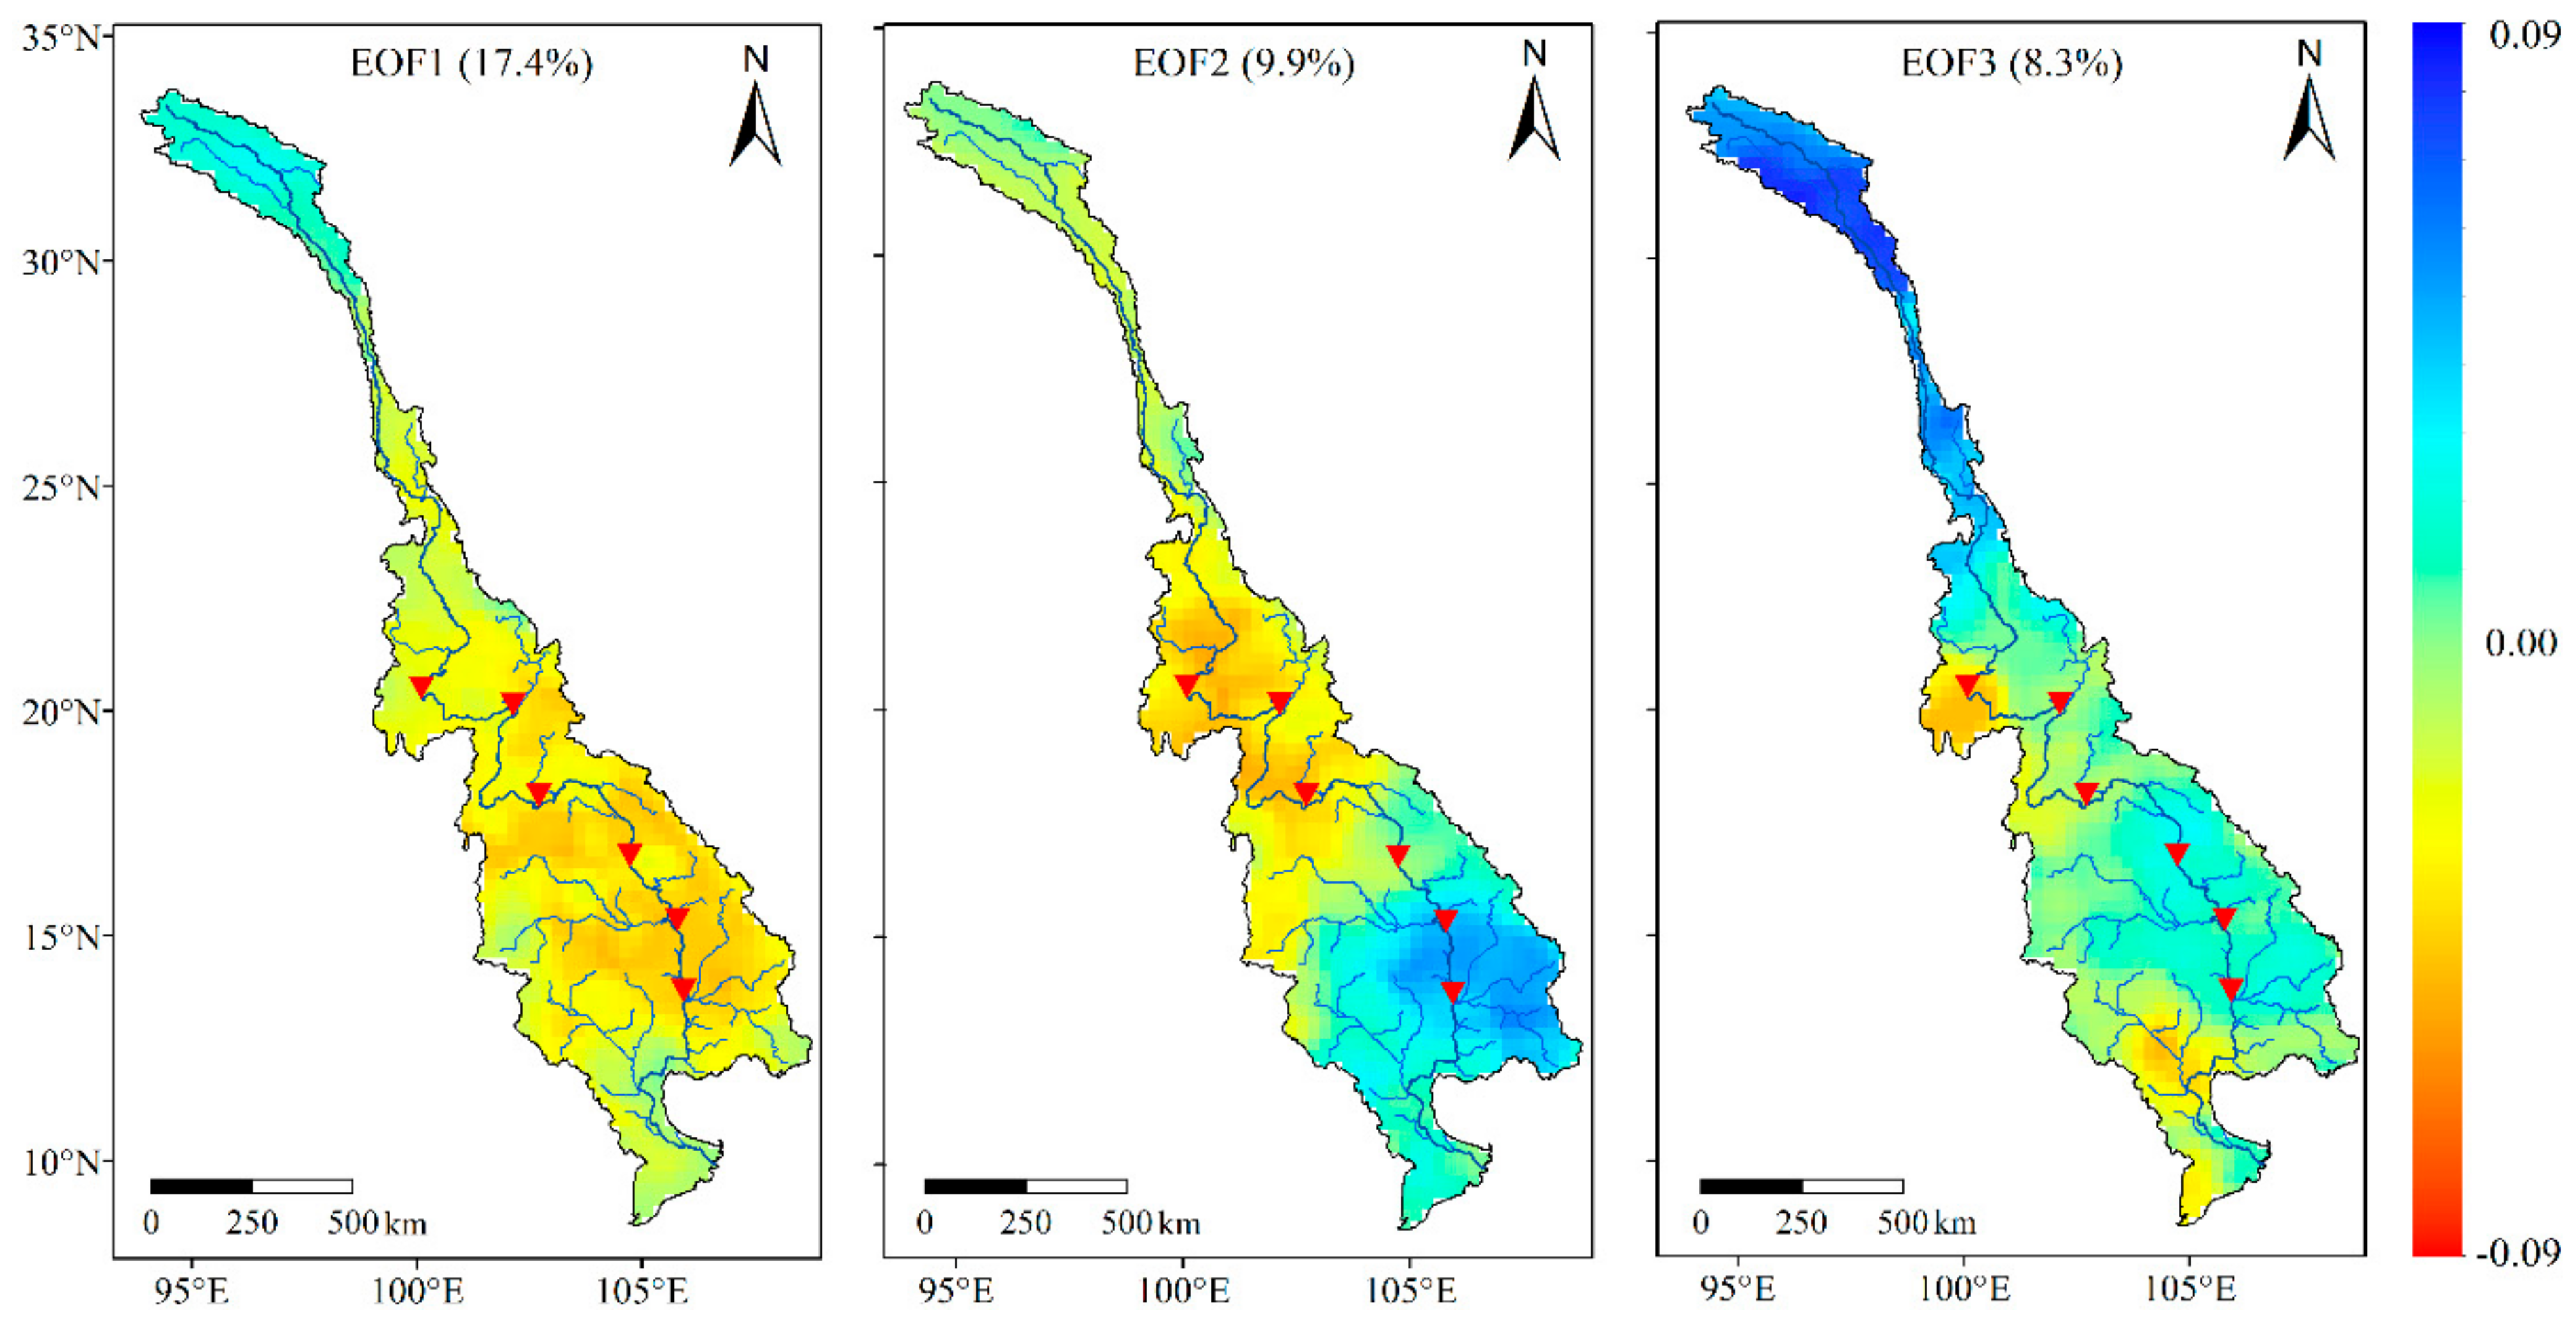
3.2. Spatiotemporal Variations of Precipitation

The correlation between precipitation and each of the two monsoon indices and their significance varied heterogeneously (Figure 4). Precipitation had some significant positive correlation with the WNPMI in 29.3% of the basin, where it was mainly distributed below Nong Khai station and especially on the left bank. Meanwhile, precipitation in the western Korat Plateau on the right bank was negatively and significantly correlated with the WNPMI.
However, significant, positive correlation between precipitation and the IMI was only found in 12.8% of the basin, where it was mostly located in the area near the western boundary of the lower Lancang–Mekong River Basin.
Major modes of precipitation variability within the basin were identified using the EOF method, and the spatial distribution of precipitation for the first three EOF modes is shown in Figure 5. The first three EOF modes explained 17.4%, 9.9% and 8.3% of the total variance, respectively. In the lower Lancang–Mekong River Basin, similar variations of precipitation were exhibited for the first EOF mode, which represented the overall precipitation variation trend. However, for the second and third EOF modes, the variations on the left and right bank of the downstream were inconsistent, showing the difference in precipitation variation. The patterns provided by the EOF analysis showed the main spatial characteristics of precipitation during JJAS, while their corresponding PCs described the temporal variability of these EOF modes. The variation of PC1 and the two monsoon indices are shown in Figure 6. It can be seen that the WNPMI exhibited significant negative correlation with PC1, whereas the association between the IMI and PC1 was not significant. These indicate that the WNPSM might exert considerable influence on the interannual variation of precipitation during JJAS.
During 1951–2015, there were 13 (10) strong (weak) WNPSM years and 10 (10) strong (weak) ISM years. Irrespective of the type of monsoon, precipitation over most of the basin increased (decreased) during strong (weak) monsoon years, and there were significant differences in precipitation between strong and weak monsoon years. During strong and weak WNPSM years, precipitation over the entire basin deviated from the mean by 2.5% and –5.1%, respectively, whereas the deviations for strong and weak ISM years were 3.3% and –3.2%, respectively, and only precipitation during the weak WNPSM years showed significant difference with the mean. The interannual variabilities of the monsoons and precipitation were found generally synchronous in the whole basin.
To explore the spatial differences in precipitation induced by monsoon fluctuation, the composite difference of precipitation between strong and weak monsoon years was calculated (Figure 7). For the WNPSM, the area with significant difference in precipitation accounted for 23.0% of the basin, where this was primarily concentrated on the downstream left bank, and the composite difference could reach 300 mm. Meanwhile, the significant negative difference mainly appeared on the right bank in the western Korat Plateau. Conversely, the area that had significant difference in relation to the ISM was much smaller, and accounted for only 13.7% of the basin, distributed mainly on the right bank of the lower Lancang–Mekong River Basin. Generally, the areas with significant difference in precipitation were in accord with the areas of the significant correlation map (Figure 4).

3.3. Topographic Interaction

In the lower Lancang–Mekong River Basin, topography is largely responsible for the spatially heterogeneous pattern of precipitation [19], making the role of topography in the relationship between the fluctuation of the WNPSM and precipitation variation worthy of investigation. For different intensities of WNPSM, the variations of precipitation with altitude along different latitudes are shown in Figure 8. It is evident that there was little difference in precipitation on the right bank, whereas precipitation on the left bank mainly increased with altitude, and was mostly more than 1000 mm. In addition, except for the area in the western end of the basin, precipitation over the right bank remained reasonably consistent, regardless of WNPSM intensities. However, on the left bank, precipitation during strong WNPSM years was obviously higher than the mean, and the precipitation values were approximately 8.8%, 11.6%, 10.5% and 1.4% higher than the mean at 13° N, 14° N, 15° N and 16° N, respectively. During the weak WNPSM years, the precipitation were about 14.9%, 16.2%, 18.6%, and 17.7% lower than the mean at 13° N, 14° N, 15° N and 16° N, respectively.
The great east–west topographic gradient of the Annamite Mountains amplified the effect of WNPSM fluctuation, highlighting the role of topography in determining monsoon precipitation. Moreover, in the western boundary of each cross section with slightly undulating terrain, the variation was opposite, in that the lowest precipitation occurred during the strong WNPSM years, and vice versa.
As shown in Figure 9a, the 850-hPa winds transported water vapor from the Indian Ocean to most of the basin. The composite difference map of 850-hPa winds between strong and weak WNPSM years showed that an anomalous cyclonic flow at 850-hPa with its center located at 20° N appeared over the subtropical western North Pacific (Figure 9b). On the southern flank of this cyclonic flow, anomalous westerlies prevailed from the Bay of Bengal to the Philippine Sea, crossing the lower Lancang–Mekong River Basin, which could transport more water vapor accordingly. As the Annamite Mountains lie almost perpendicular to these anomalous westerlies, monsoon precipitation on their windward side could increase substantially because of orographic uplift. Conversely, the flat terrain on the right bank could lead to much less variation in precipitation. Besides, the western boundary on the downstream right bank, blocked by the mountain ranges in the western Korat Plateau and western Cambodia, is controlled by the topography of leeward side. With the anomalous westerlies prevailing, the rain shadow effect on the leeward side would be enhanced due to the acceleration of water vapor transport, resulting in less precipitation in this region. Generally, any precipitation variation over the lower Lancang–Mekong River Basin could be partly attributable to the interaction between the anomalous westerlies caused by WNPSM fluctuation and the regional topography.

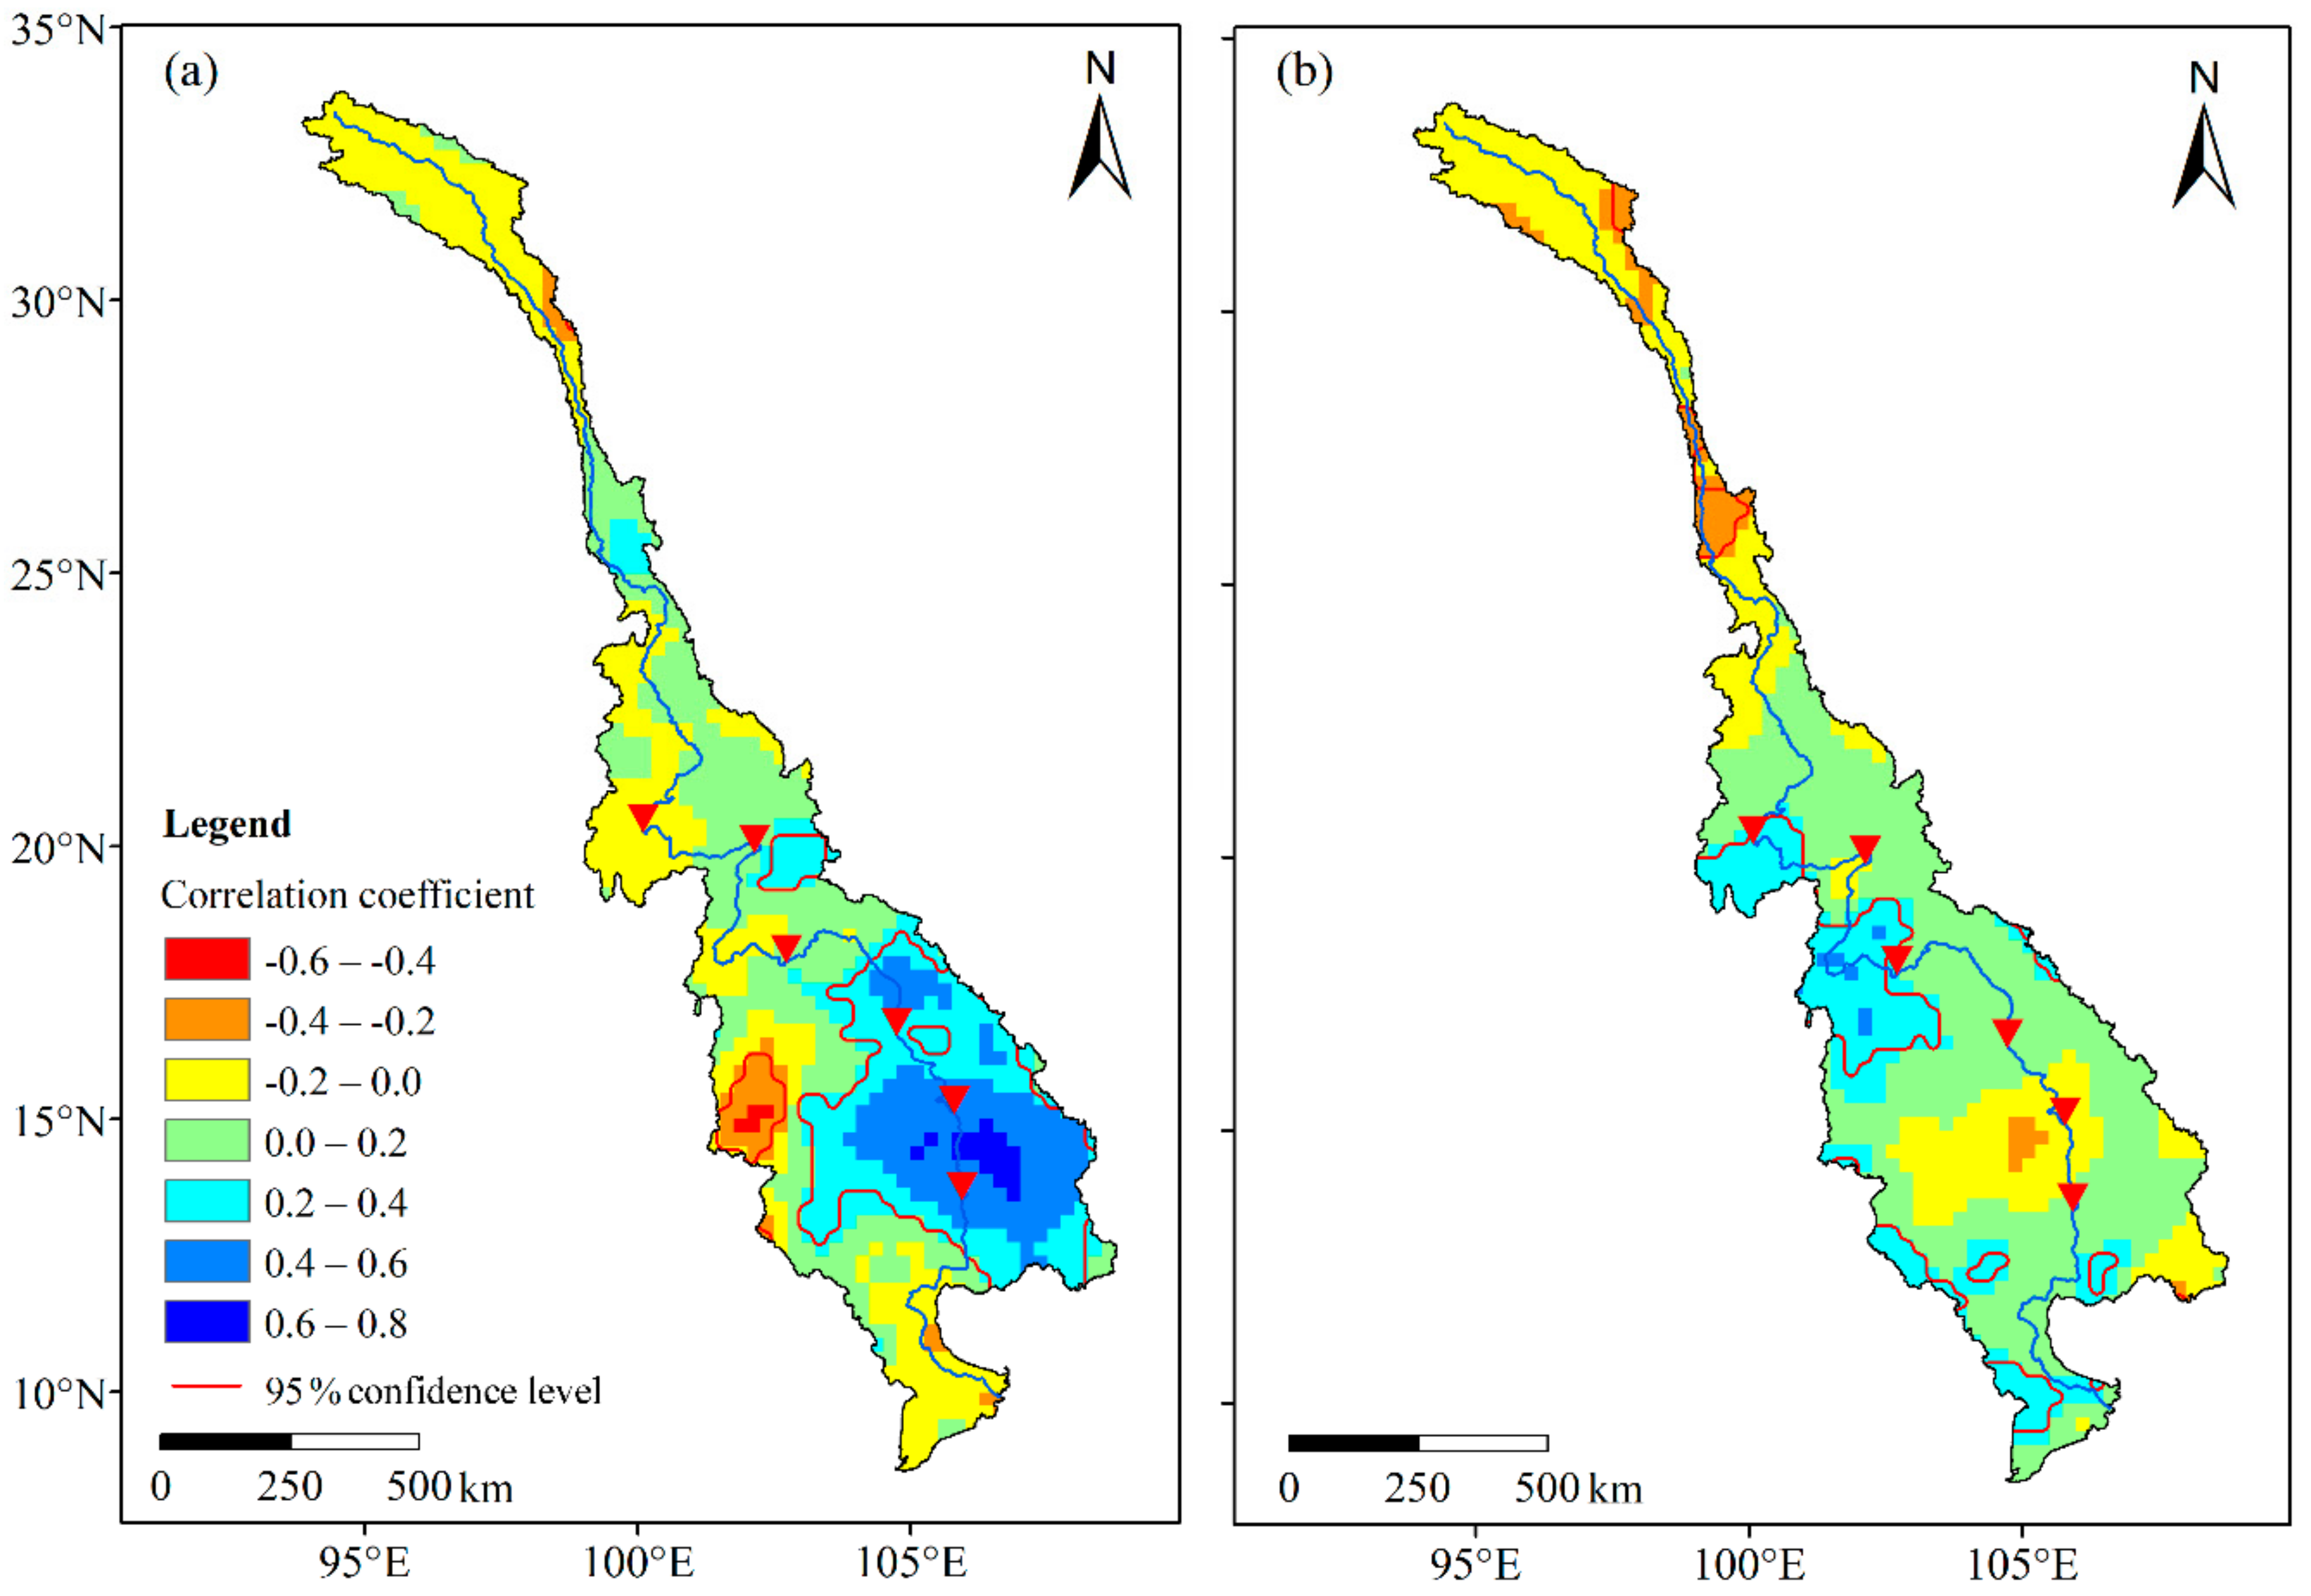
3.4. Link between Monsoon and River Flow

The mean flow at Stung Treng station during JJAS showed a significant positive correlation with the WNPMI, and the correlation coefficient was 0.53. However, the correlation between the mean flow at the Stung Treng station and the IMI was found not significant, indicating that flow variation in the Lancang–Mekong River Basin is affected primarily by WNPSM fluctuation and not by ISM variability. To explore the spatial distribution of the potential link between monsoon fluctuation and river flow variation, six sub-basins were partitioned according to the locations of the hydrological stations used in this study (Figure 1). The correlation coefficients between the mean flow and the monsoon indices in each sub-basin during JJAS were calculated, and they are displayed in Table 2. Below Nong Khai station, river flow in the three sub-basins (i.e., Nong Khai-Mukdahan, Mukdahan-Pakse, and Pakse-Stung Treng) was found to exhibit some significant positive correlation with the WNPMI. It is worth noting that the annual flow in these three sub-basins contributes 65% of the total, and that the left bank of these areas, where precipitation variation has previously been proven to be profoundly affected by WNPSM fluctuation, provides about 50% of the total flow. However, no significant correlation was found between sub-basin flow and the IMI, suggesting ISM fluctuation has much less effect on flow variation in each sub-basin.
Flow anomalies during JJAS at six hydrological stations under different intensities of the WNPSM were compared (Figure 10). At Luang Prabang and Nong Khai station, there was little difference in flow anomalies between strong and weak WNPSM years. However, the difference tended to increase downstream from Nong Khai station, and reached its greatest value at Stung Treng station. During strong (weak) WNPSM years, river flow at the Mukdahan, Pakse and Stung Treng stations were 8.0% (5.0%), 8.2% (12.6%) and 12.1% (19.5%) higher (lower) than the mean, respectively. The differences in flow anomalies between strong and weak WNPSM years highlight the nonnegligible influence of WNPSM fluctuation on river flow variation in the lower Lancang–Mekong River Basin.

4. Discussion

This study investigated how fluctuation of both the WNPSM and ISM might affect precipitation and flow variation in the Lancang–Mekong River Basin through the interaction with regional topography. To clarify the impact of the variability of monsoon circulation on the regional hydrological processes, we first explored the areas affected by the two monsoons using spatial statistical analysis and EOF analysis, and we analyzed precipitation and river flow variations induced by WNPSM and ISM fluctuations. In conjunction with synthetic wind fields, we then studied the effect of regional topography on the variation of water vapor transport, and its implications regarding precipitation and river flow were researched comprehensively. The results indicated that WNPSM fluctuation exerted substantial influence on precipitation and river flow variations more widely than the ISM, and that the affected areas were mainly distributed on the downstream left bank with rugged terrain.
In previous research, the WNPSM was proven responsible for rainy season precipitation over southeastern parts of the basin [8], while the ISM primarily influenced rainy season precipitation over western parts of the basin [18], which correspond to the areas on the downstream left bank and right bank in this study, respectively. When the western Pacific circulation is strong, increasing water vapor from the Indian Ocean is driven over the lower Lancang–Mekong River Basin, resulting in more precipitation [8,16,32]. Our study revealed that for 29.3% of the whole basin, precipitation during JJAS was positively and significantly correlated with the WNPMI. It is interesting that these regions are mainly distributed on the downstream left bank, where the north–south Annamite Mountains partly determine the spatial heterogeneity of precipitation.
During the strong WNPSM years, uplift of the anomalous westerlies with increasing water vapor over the Annamite Mountains leads to excess orographic precipitation on their windward side, and vice versa. The higher Cv values on the windward side of the Annamite Mountains could be largely attributed to precipitation variation induced by interannual fluctuation of the WNPSM.
Meanwhile, the occurrence of anomalous westerlies would intensify the rain shadow effect on the leeward side over the western boundary of the lower Lancang–Mekong River Basin, due to the acceleration of water vapor transport, resulting in less precipitation in this region. Clearly, regional topography plays an important role in terms of the effects of the fluctuation of the WNPSM on precipitation variation, which should be investigated further in future researches.
Large rivers are comprehensive integrators of the spatially heterogenous precipitation and hydrological processes with the Lancang–Mekong River Basin [33,34]. The interannual variation in precipitation caused by monsoon fluctuation might translate into similar changes in river flow. Because of the large amount and high variability of the regional precipitation, the downstream left bank was found to contribute substantially to the river flow and to its interannual variation. Hence, the river flow regime in this region during the rainy season is worthy of close attention. In future applications, the forecast of the WNPSM and ISM would be helpful to predict precipitation and streamflow.
Several large densely populated and flood-prone river basins in South and Southeast Asia, such as the Indus, Ganges, Yarlung Tsangpo–Brahmaputra, Irrawaddy and Lancang–Mekong River Basin, are characterized predominantly by the influences of strong monsoons and complex topography [35,36,37,38,39,40,41]. The comprehensive effects of monsoon fluctuation and regional topography determine the spatiotemporal distributions and variations of precipitation, and there are certain areas that make major contributions to both the amount and the variabilities of the river flow. An understanding of the causative mechanism of monsoon fluctuation on river flow variation in such areas could be beneficial for long-term hydrological prediction, which could provide support for optimal flood control and water resource utilization in South and Southeast Asia.

5. Conclusions

This study investigated the influence of monsoon fluctuation on precipitation and river flow variations over the Lancang–Mekong River Basin, the role of regional topography of which was further examined. The following conclusions were received.
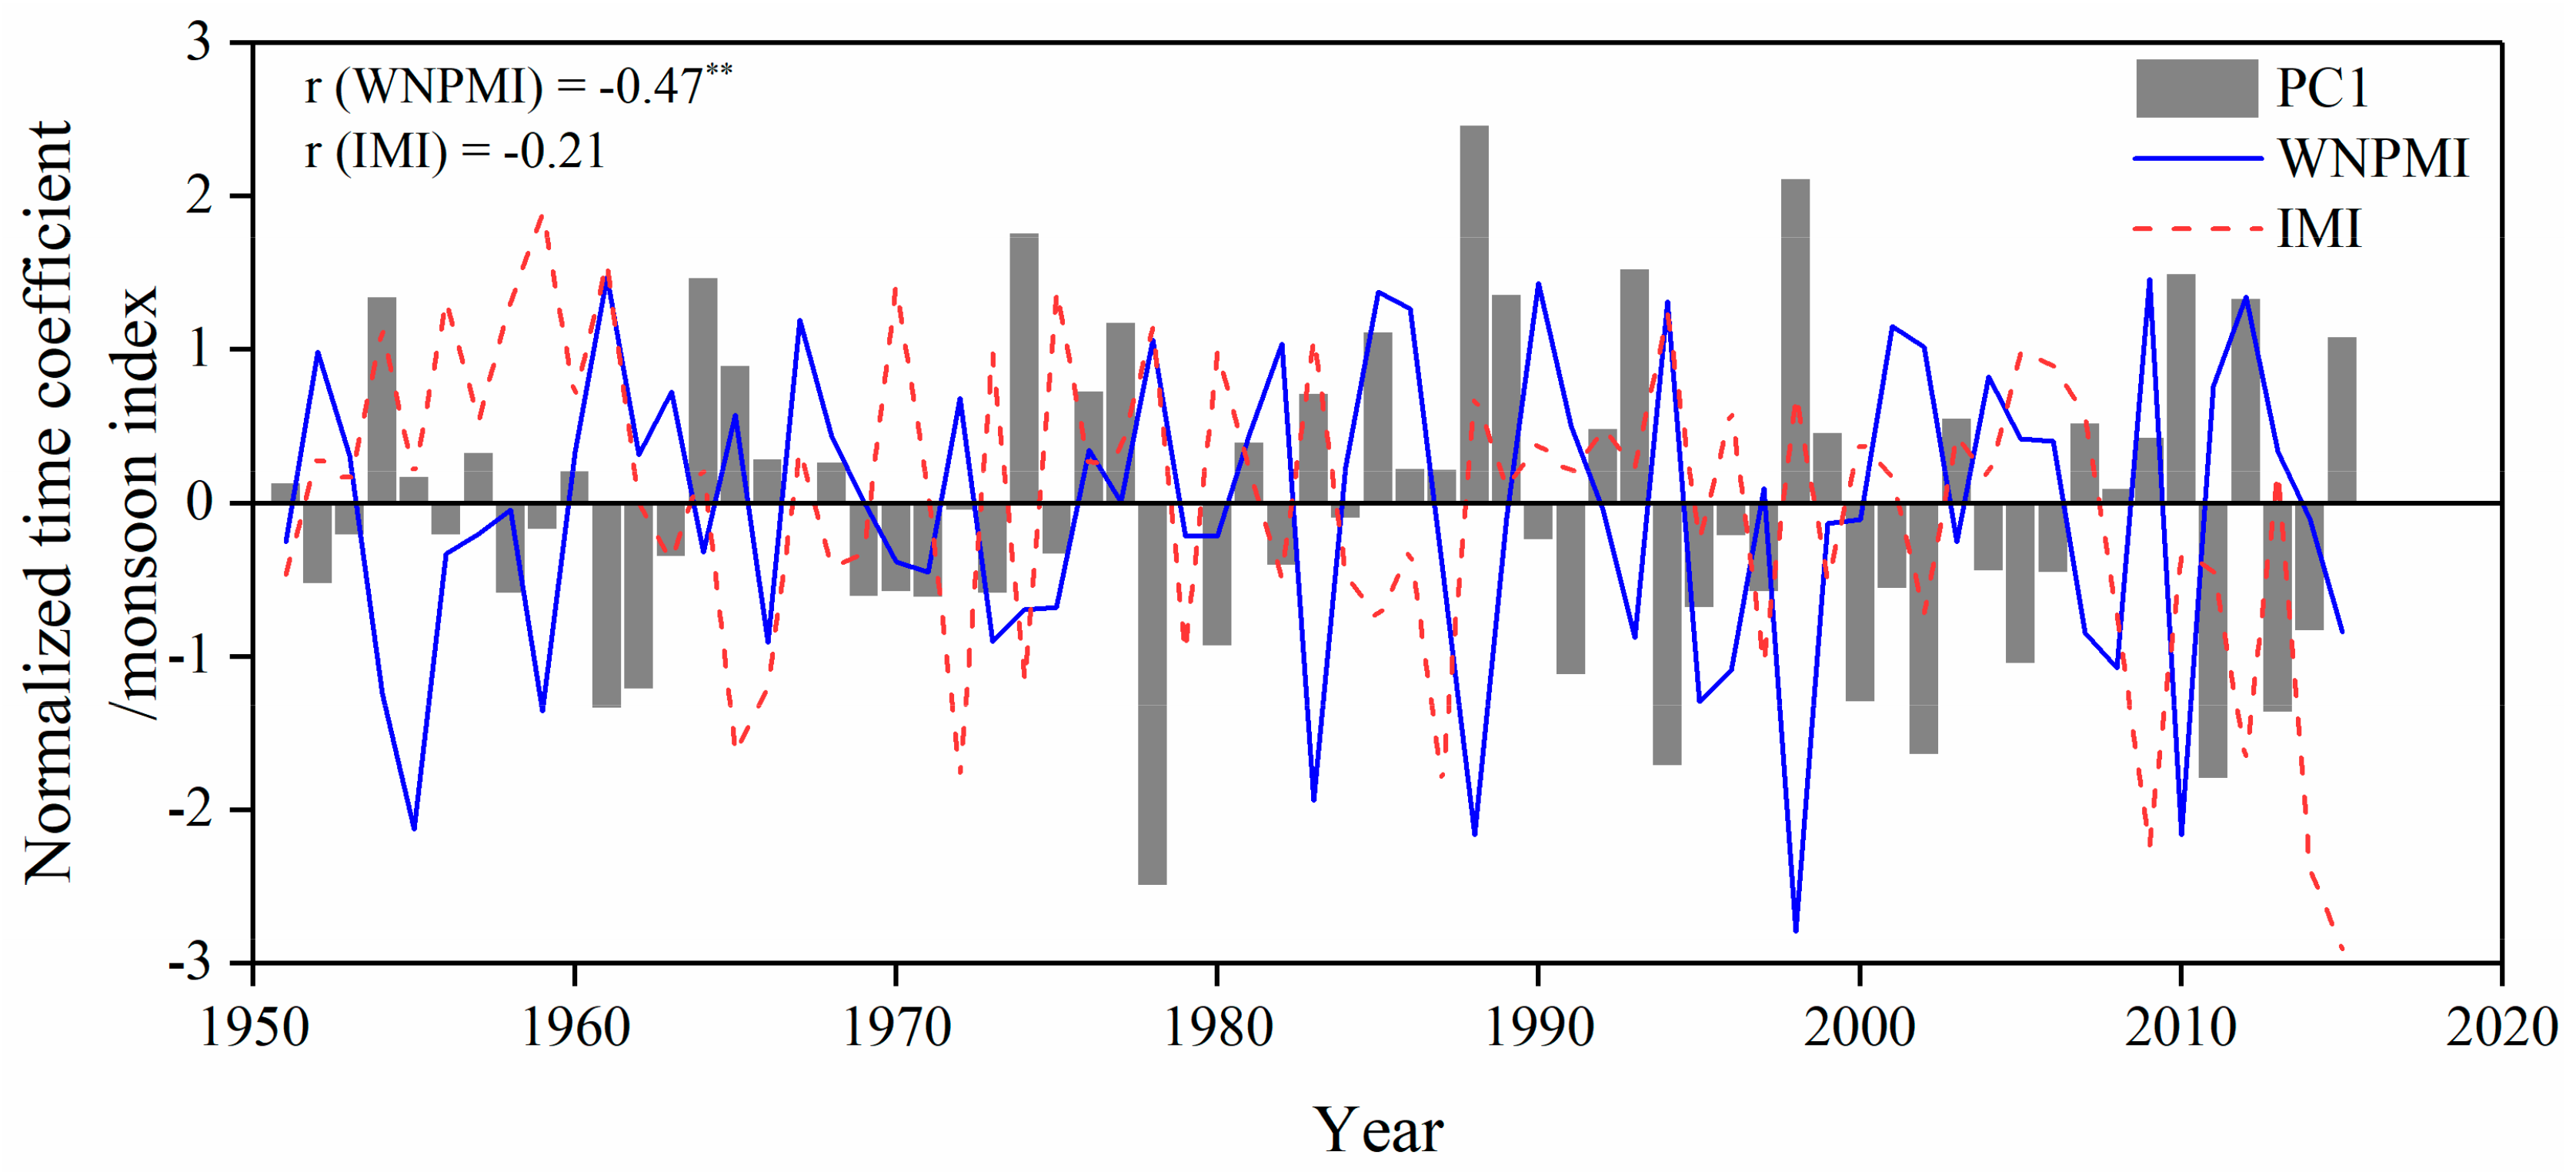
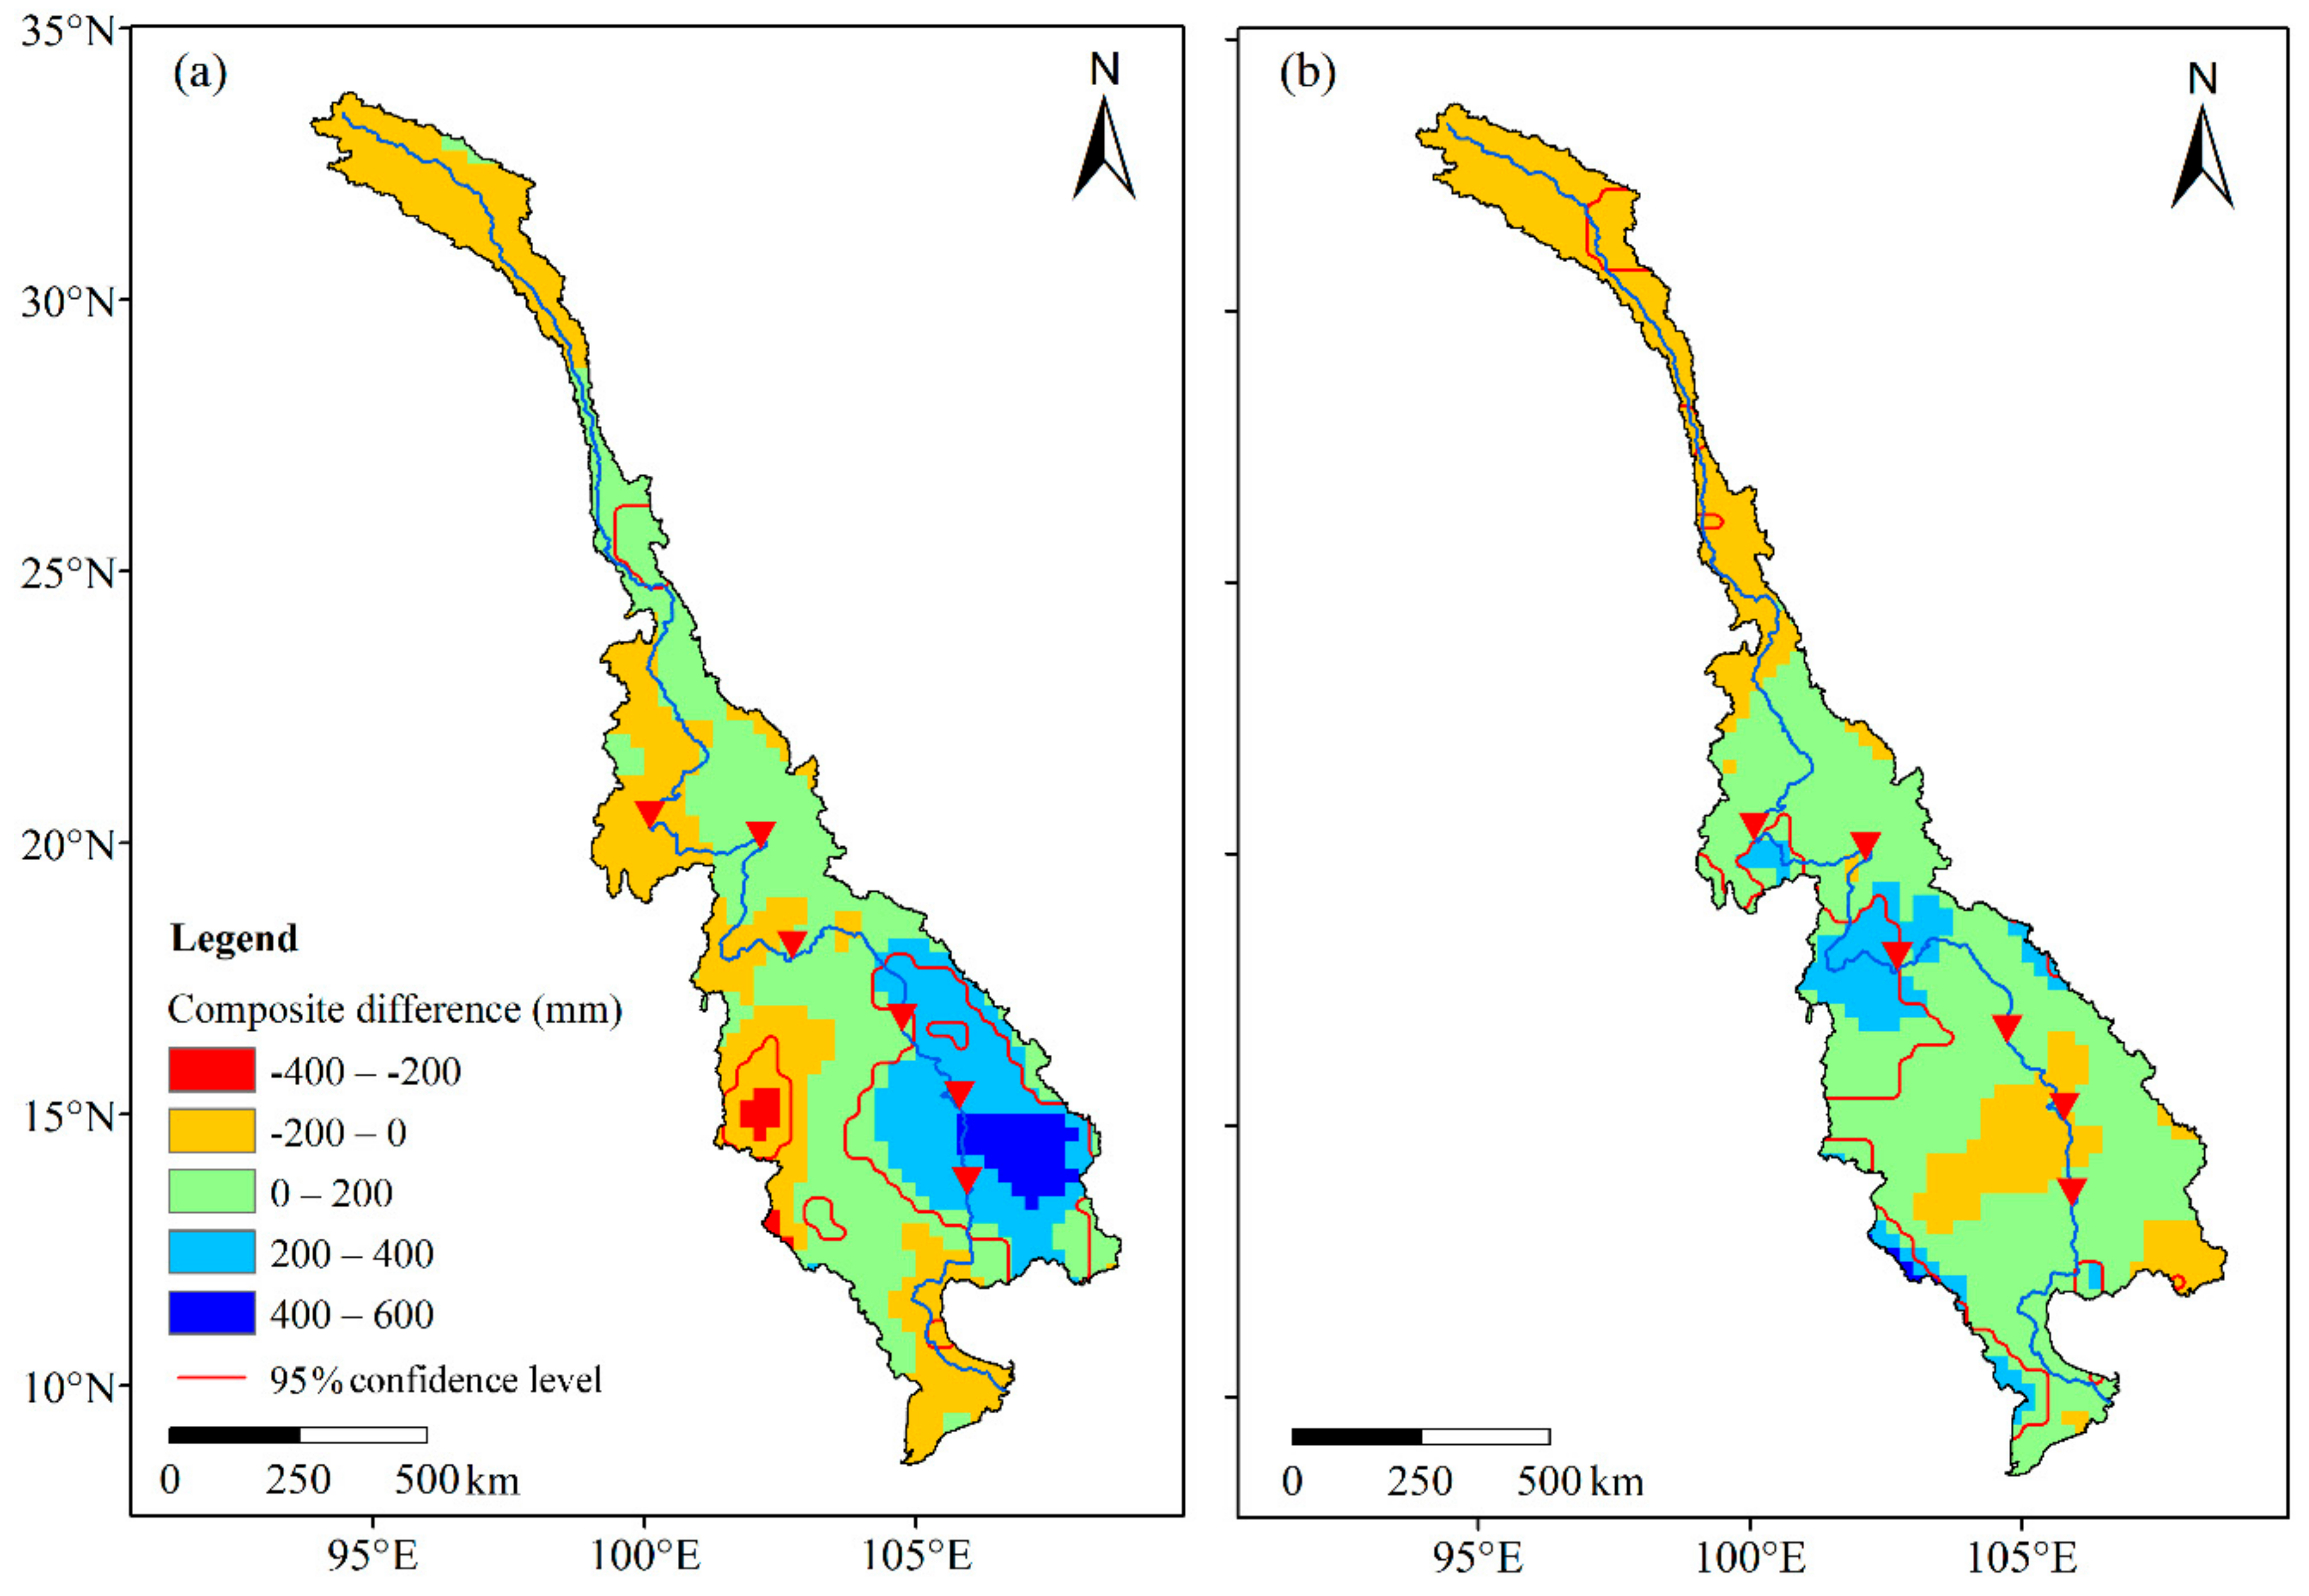
  • Changes in precipitation were found more synchronous with the WNPSM than with the ISM. Fluctuation of the WNPSM primarily influenced precipitation variation on the downstream left bank, and 29.3% of the basin was found to exhibit significant positive correlation with the WNPMI. In comparison, fluctuation of the ISM mainly affected the western boundary of the lower Lancang–Mekong River Basin, and the affected area was much less.
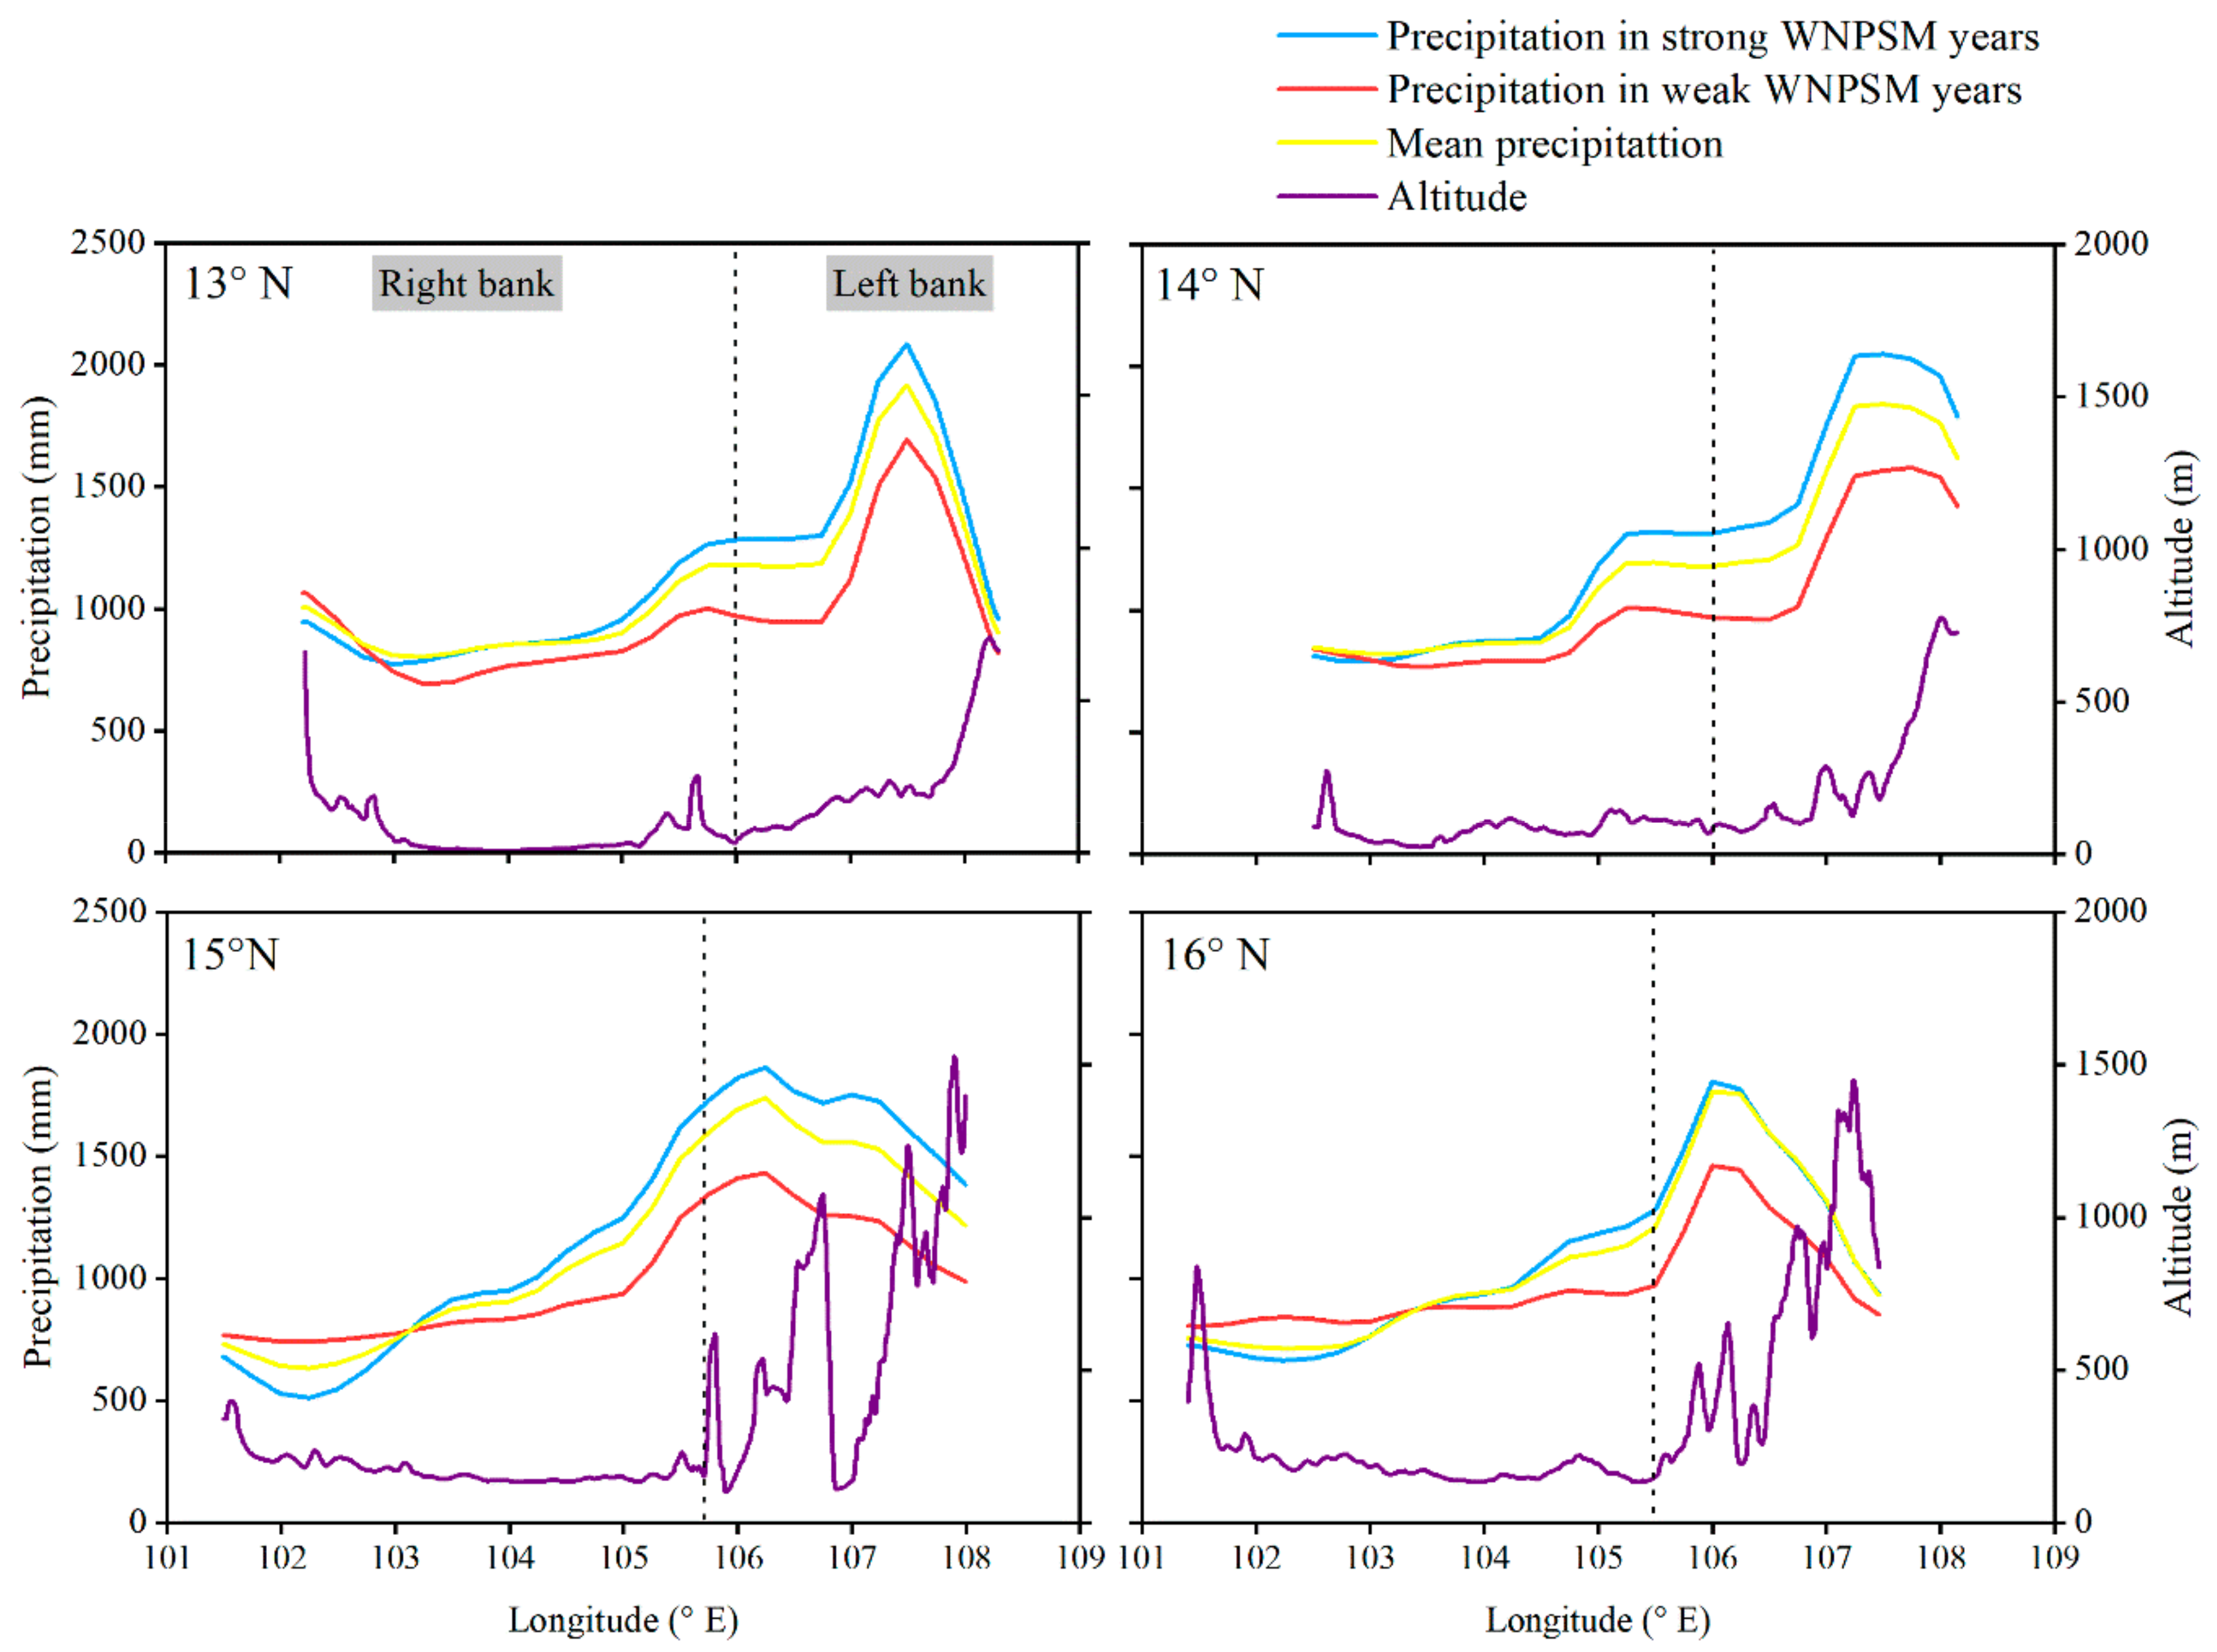
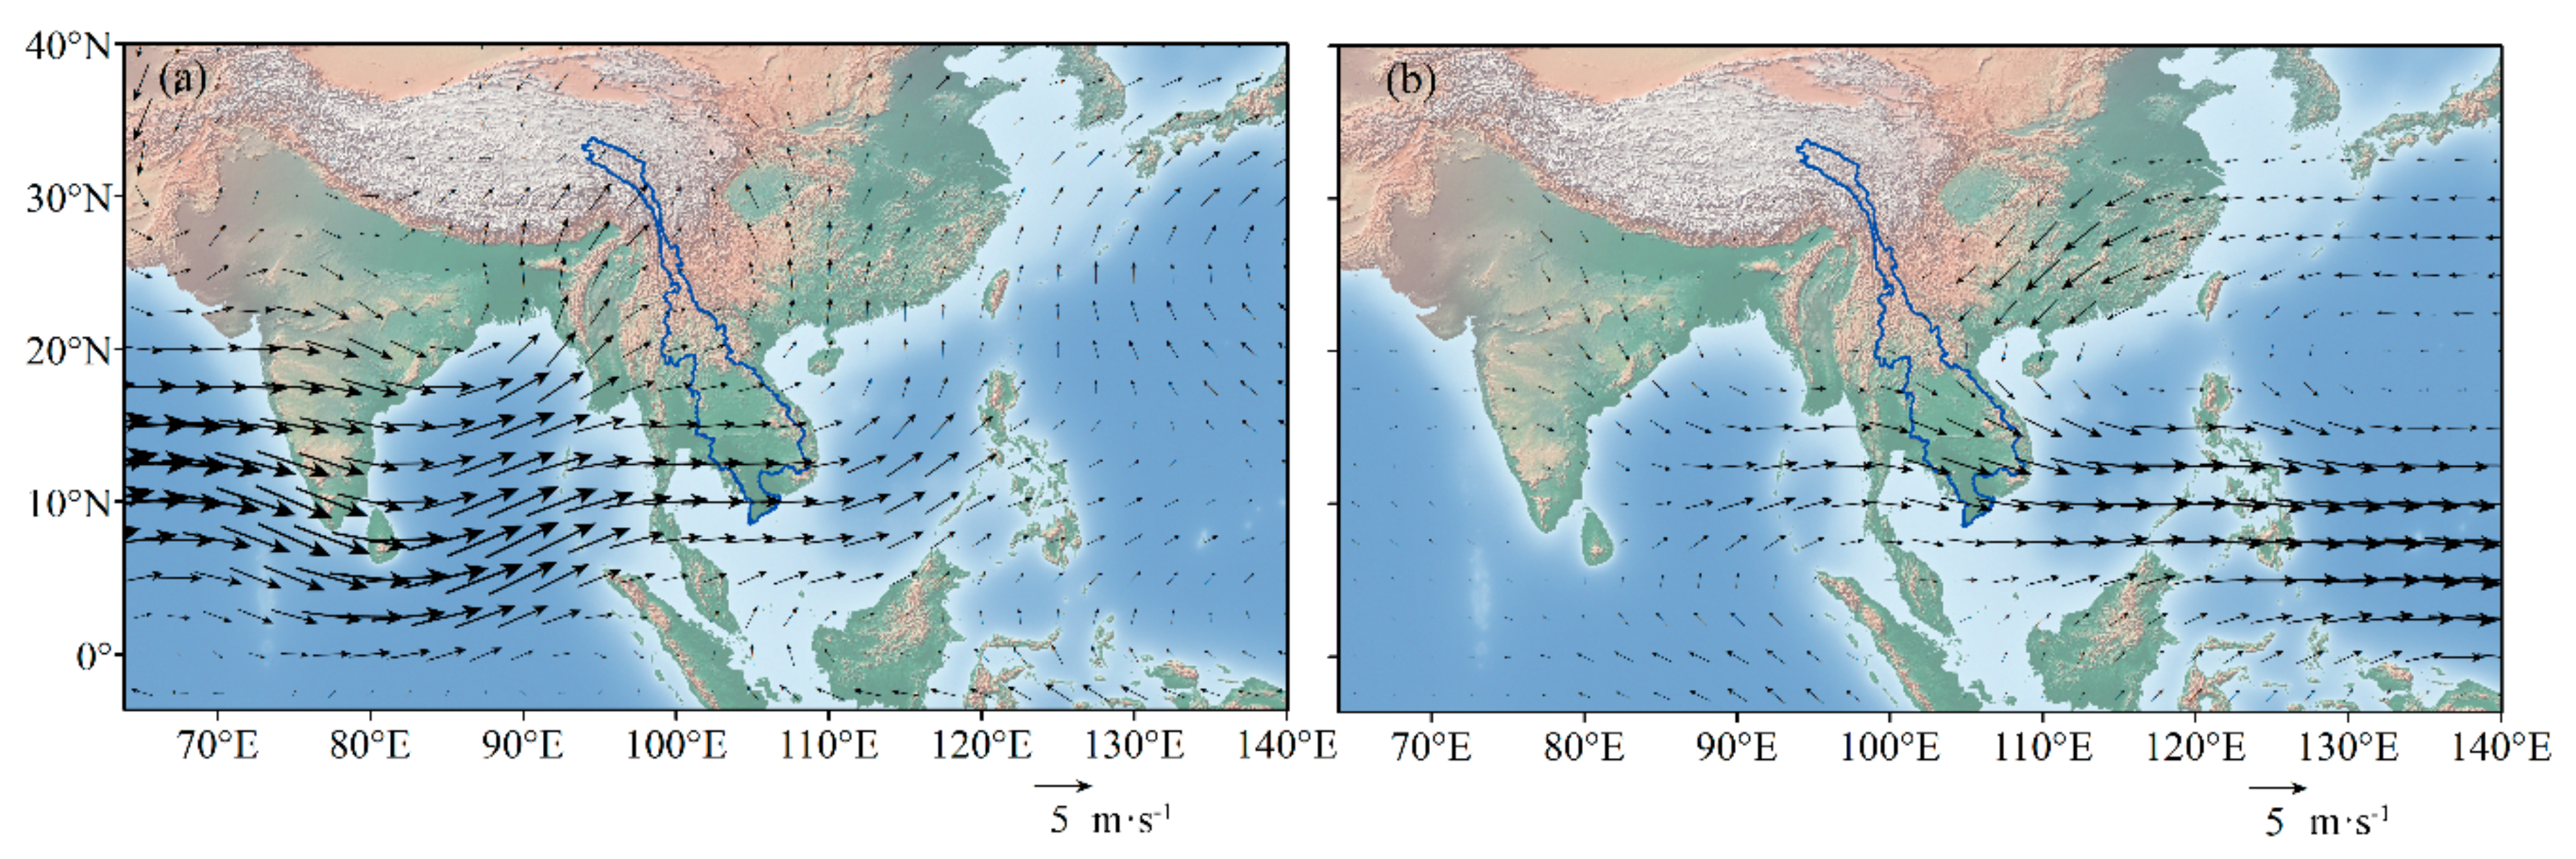
  • Topographic features amplified the effects of WNPSM fluctuation. During the strong WNPSM years, the anomalous westerlies crossing the Annamite Mountains carried greater quantities of water vapor that result in enhanced orographic precipitation on the windward side, and vice versa.
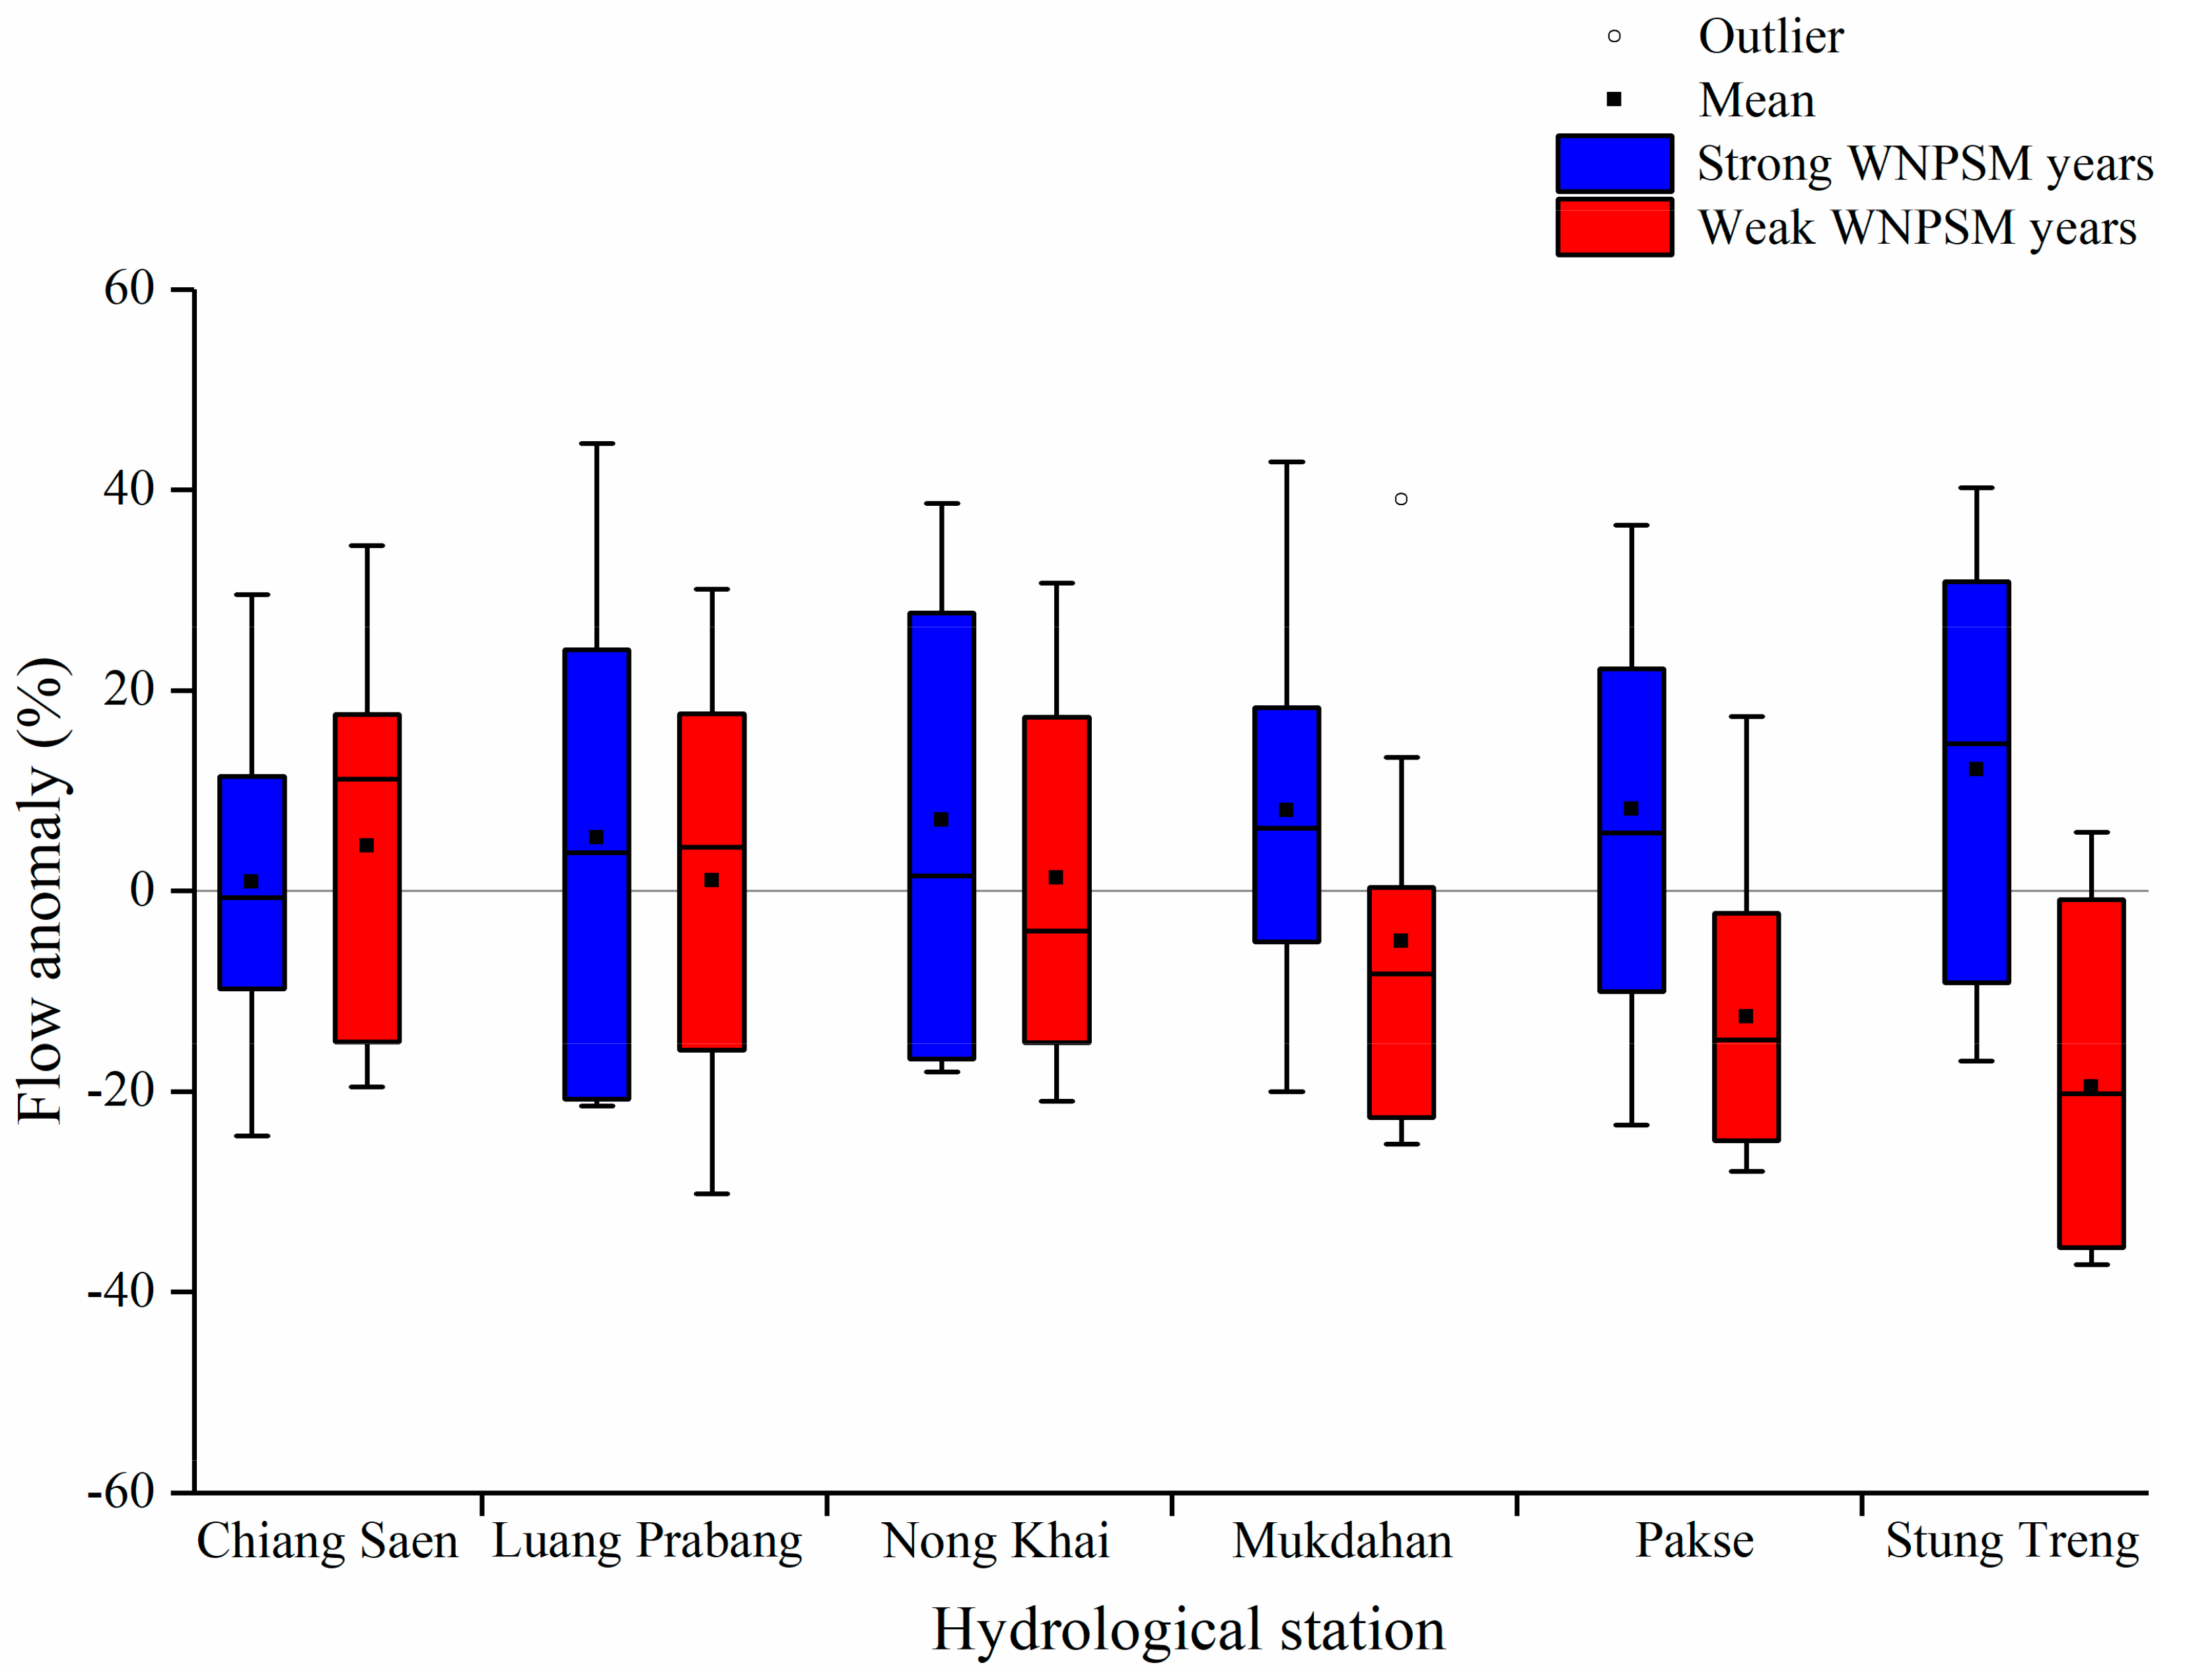
  • River flow below Nong Khai station was found to be positively and significantly correlated with the WNPMI, which was consistent with the area where most of this river flow was generated, and precipitation variation was induced by WNPSM fluctuation. At the Mukdahan, Pakse and Stung Treng stations, the differences in flow between strong and weak monsoon years were 13.0%, 20.7% and 31.6%, respectively, indicating that the WNPMI would be helpful for long-term hydrological predictions.

Author Contributions

Data curation, X.L.; Formal analysis, X.F.; Methodology, X.F.; Resources, X.L.; Supervision, X.L.; Validation, X.L.; Writing—original draft, X.F; Writing—review & editing, X.L.

Funding

This study was supported by the National Key R&D Program of China (2016YFA0601601), the National Natural Science Foundation of China (41601026) and the Science and Technology Planning Project of Yunnan Province (2017FB073).

Acknowledgments

The authors are gratefully acknowledging the editors of the journal and the anonymous reviewers for their useful and detailed comments that improved the overall quality of the manuscript.

Conflicts of Interest

The authors declare no conflict of interest.

References

  1. Framing research on Water Resources Management and Governance in Cambodia: A Literature Review; Working paper 37; CDRI (Cambodia Development Resource Institute): Phnom Penh, Cambodia, 2008.
  2. State of the Basin Report; MRC (Mekong River Commission): Vientiane, Laos, 2010.
  3. Food and Agriculture Organization of the United Nations. Available online: http://www.fao.org/nr/water/aquastat/basins/mekong/ (accessed on 12 July 2019).
  4. Ruan, Y.F.; Yao, Z.J.; Wang, R.; Liu, Z.F. Ranking of CMIP5 GCM skills in simulating observed precipitation over the Lower Mekong Basin, using an improved score-based method. Water 2018, 10, 1868. [Google Scholar] [CrossRef]
  5. Xue, Z.; Liu, J.P.; Ge, Q. Changes in hydrology and sediment delivery of the Mekong River in the last 50 years: Connection to damming, monsoon, and ENSO. Earth Surf. Process. Landf. 2011, 36, 296–308. [Google Scholar] [CrossRef]
  6. Buckley, B.M.; Fletcher, R.; Wang, S.Y.S.; Zottoli, B.; Pottier, C. Monsoon extremes and society over the past millennium on mainland Southeast Asia. Quat. Sci. Rev. 2014, 95, 1–19. [Google Scholar] [CrossRef] [Green Version]
  7. Nguyen, T.V.; Mai, K.V.; Nguyen, P.N.B.; Juang, H.M.H.; Nguyen, D.V. Evaluation of summer monsoon climate predictions over the Indochina Peninsula using regional spectral model. Weather Clim. Extrem. 2019, 23, 100195. [Google Scholar] [CrossRef]
  8. Delgado, J.M.; Merz, B.; Apel, H. A climate-flood link for the lower Mekong River. Hydrol. Earth Syst. Sci. 2012, 16, 1533–1541. [Google Scholar] [CrossRef] [Green Version]
  9. Unverricht, D.; Nguyen, T.C.; Heinrich, C.; Szczuciński, W.; Lahajnar, N.; Stattegger, K. Suspended sediment dynamics during the inter-monsoon season in the subaqueous Mekong Delta and adjacent shelf, southern Vietnam. J. Asian Earth Sci. 2014, 79, 509–519. [Google Scholar] [CrossRef]
  10. Tatsumia, K.; Yamashikib, Y. Effect of irrigation water withdrawals on water and energy balance in the Mekong River Basin using an improved VIC land surface model with fewer calibration parameters. Agric. Water Manag. 2015, 159, 92–106. [Google Scholar] [CrossRef]
  11. Hoang, L.P.; Lauri, H.; Kummu, M.; Koponen, J.; van Vliet, M.T.H.; Supit, I.; Leemans, R.; Kabat, P.; Ludwig, F. Mekong River flow and hydrological extremes under climate change. Hydrol. Earth Syst. Sci. 2016, 20, 3027–3041. [Google Scholar] [CrossRef] [Green Version]
  12. Lauri, H.; de Moel, H.; Ward, P.J.; Räsänen, T.A.; Keskinen, M.; Kummu, M. Future changes in Mekong River hydrology: Impact of climate change and reservoir operation on discharge. Hydrol. Earth Syst. Sci. 2012, 16, 4603–4619. [Google Scholar] [CrossRef]
  13. Arias, M.E.; Cochrane, T.A.; Piman, T.; Kummu, M.; Caruso, B.S.; Killeen, T.J. Quantifying changes in flooding and habitats in the Tonle Sap Lake (Cambodia) caused by water infrastructure development and climate change in the Mekong Basin. J. Environ. Manag. 2012, 112, 53–66. [Google Scholar] [CrossRef]
  14. Sridhar, V.; Kang, H.; Ali, S.A. Human-induced alterations to land use and climate and their responses for hydrology and water management in the Mekong River Basin. Water. 2019, 11, 1307. [Google Scholar] [CrossRef]
  15. Yuan, L.; He, W.J.; Liao, Z.Y.; Degefu, D.M.; An, M.; Zhang, Z.F.; Wu, X. Allocating water in the Mekong River Basin during the dry season. Water. 2019, 11, 400. [Google Scholar] [CrossRef]
  16. Liu, Y.Y.; Ding, Y.H. Influence of the western North Pacific summer monsoon on summer rainfall over the Yangtze River Basin. Chin. J. Atmos. Sci. 2009, 33, 1225–1237. (In Chinese) [Google Scholar]
  17. Tsai, C.; Behera, S.K.; Waseda, T. Indo–China monsoon indices. Sci Rep. 2015, 5, 8107. [Google Scholar] [CrossRef] [PubMed]
  18. Yang, R.; Zhang, W.K.; Gui, S.; Tao, Y.; Cao, J. Rainy season precipitation variation in the Mekong River basin and its relationship to the Indian and East Asian summer monsoons. Clim. Dyn. 2018, 52, 5691–5708. [Google Scholar] [CrossRef] [Green Version]
  19. Chang, C.P.; Wang, Z.; Mcbride, J.; Liu, C.H. Annual cycle of Southeast Asia-Maritime Continent rainfall and the asymmetric monsoon transition. J. Clim. 2005, 18, 287–301. [Google Scholar] [CrossRef]
  20. Wang, Z.; Chang, C.P. A numerical study of the interaction between the large-scale monsoon circulation and orographic precipitation over South and Southeast Asia. J. Clim. 2012, 25, 2440–2455. [Google Scholar] [CrossRef]
  21. Räsänen, T.A.; Kummu, M. Spatiotemporal influences of ENSO on precipitation and flood pulse in the Mekong River Basin. J. Hydrol. 2013, 476, 154–168. [Google Scholar] [CrossRef]
  22. Overview of the Hydrology of the Mekong Basin; MRC (Mekong River Commission): Vientiane, Laos, 2005.
  23. Costa-Cabral, M.C.; Richey, J.E.; Goteti, G.; Lettenmaier, D.P.; Feldkötter, C.; Snidvongs, A. Landscape structure and use, climate, and water movement in the Mekong River basin. Hydrol. Process. 2008, 22, 1731–1746. [Google Scholar] [CrossRef]
  24. Luo, X.; Wu, W.Q.; He, D.M.; Li, Y.G.; Ji, X. Hydrological simulation using TRMM and CHIRPS precipitation estimates in the Lower Lancang–Mekong River Basin. Chin. Geogr. Sci. 2019, 29, 13–25. [Google Scholar] [CrossRef]
  25. Becker, A.; Finger, P.; Meyer-Christoffer, A.; Rudolf, B.; Schamm, K.; Schneider, U.; Ziese, M. A description of the global land-surface precipitation data products of the Global Precipitation Climatology Centre with sample applications. Earth Syst. Sci. Data 2013, 5, 71–99. [Google Scholar] [CrossRef]
  26. Schneider, U.; Becker, A.; Finger, P.; Meyer-Christoffer, A.; Ziese, M.; Rudolf, B. GPCC’s new land surface precipitation climatology based on quality-controlled in situ data and its role in quantifying the global water cycle. Theor. Appl. Climatol. 2013, 115, 15–40. [Google Scholar] [CrossRef]
  27. Fuchs, T.; Schneider, U.; Rudolf, B. The Global Precipitation Climatology Centre (GPCC)—In situ observation-based precipitation climatology on regional and global scale. In Proceedings of the EGU General Assembly, Vienna, Austria, 19–25 April 2009. [Google Scholar]
  28. Schneider, U.; Finger, P.; Meyer-Christoffer, A.; Ziese, M.; Becker, A. GPCC Global Precipitation Analysis Products of the GPCC; Deutscher Wetterdienst: Offenbach, Germany, 2018. [Google Scholar]
  29. Duan, Z.; Liu, J.Z.; Tuo, Y.; Chiogna, G.; Disse, M. Evaluation of eight high spatial resolution gridded precipitation products in Adige Basin (Italy) at multiple temporal and spatial scales. Sci. Total Environ. 2016, 573, 1536–1553. [Google Scholar] [CrossRef] [PubMed] [Green Version]
  30. Wang, B.; Wu, R.; Lau, K.M. Interannual variability of the Asian summer monsoon: Contrasts between the Indian and the western North Pacific-East Asian monsoons. J. Clim. 2001, 14, 4073–4090. [Google Scholar] [CrossRef]
  31. Tošić, I.; Hrnjak, I.; Gavrilov, M.B.; Unkašević, M.; Marković, S.B.; Lukić, T. Annual and seasonal variability of precipitation in Vojvodina, Serbia. Theor Appl Climatol. 2014, 117, 331–341. [Google Scholar] [CrossRef]
  32. Hsu, H.H.; Zhou, T.; Matsumoto, J. East Asian, Indochina and Western North Pacific Summer Monsoon - an update. Asia-Pac. J. Atmos. Sci. 2014, 50, 45–68. [Google Scholar] [CrossRef]
  33. Kale, V. On the link between extreme floods and excess monsoon epochs in South Asia. Clim. Dyn. 2011, 39, 1107–1122. [Google Scholar] [CrossRef]
  34. Sang, Y.F.; Singh, V.P.; Gong, T.L.; Xu, K.; Sun, F.B.; Liu, C.M.; Liu, W.B.; Chen, R.Z. Precipitation variability and response to changing climatic condition in the Yarlung Tsangpo River basin. China. J. Geophys. Res. Atmos. 2016, 121, 8820–8831. [Google Scholar] [CrossRef]
  35. Nishat, B.; Rahman, S.M.M. Water resources modeling of the Ganges–Brahmaputra–Meghna River Basins using satellite remote sensing data. J. Am. Water Resour. Assoc. 2009, 45, 1313–1327. [Google Scholar] [CrossRef]
  36. Curtis, S.; Crawford, T.; Rahman, M.; Paul, B.; Miah, M.G.; Islam, M.R.; Patel, M. A hydroclimatological analysis of precipitation in the Ganges–Brahmaputra–Meghna River Basin. Water 2018, 10, 1359. [Google Scholar] [CrossRef]
  37. Webster, P.J.; Toma, V.E.; Kim, H.M. Were the 2010 Pakistan floods predictable. Geophys. Res. Lett. 2011, 38, 30–31. [Google Scholar] [CrossRef]
  38. Hartmann, H.; Andresky, L. Flooding in the Indus River basin -A spatiotemporal analysis of precipitation records. Glob. Planet. Chang. 2013, 107, 25–35. [Google Scholar] [CrossRef]
  39. Pervez, M.S.; Henebry, G.M. Spatial and seasonal responses of precipitation in the Ganges and Brahmaputra river basins to ENSO and Indian Ocean dipole modes: Implications for flooding and drought. Nat. Hazards Earth Syst. Sci. 2015, 15, 147–162. [Google Scholar] [CrossRef]
  40. Hasson, S.U.; Pascale, S.; Lucarini, V.; Böhner, J. Seasonal cycle of precipitation over major river basins in South and Southeast Asia: A review of the CMIP5 climate models data for present climate and future climate projections. Atmos. Res. 2016, 180, 42–63. [Google Scholar] [CrossRef] [Green Version]
  41. Dimri, A.P.; Thayyen, R.; Kibler, K.; Stanton, A.; Jain, S.K.; Tullos, D.; Singh, V.P. A review of atmospheric and land surface processes with emphasis on flood generation in the Southern Himalayan rivers. Sci. Total Environ. 2016, 556, 98–115. [Google Scholar] [CrossRef] [PubMed]
Figure 1. Topography, sub-basins, and the locations of rainfall and hydrological stations in the Lancang–Mekong River Basin.
Water 11 02086 g001
Figure 2. Scatterplot of monthly precipitation during June–September (JJAS) in 1998–2015 from gauge observations against the Global Precipitation Climatology Centre (GPCC) estimates.
Water 11 02086 g002
Figure 3. Spatial distribution of (a) precipitation during JJAS and proportion of precipitation during JJAS to annual precipitation and (b) coefficient of variation (Cv) of precipitation during JJAS.
Water 11 02086 g003
Figure 4. Correlation coefficients between precipitation and monsoon index ((a) western North Pacific summer monsoon index (WNPMI) and (b) Indian summer monsoon index (IMI)) during JJAS. In the regions enclosed by the red contour line, the correlation coefficients of precipitation during JJAS between strong and weak monsoon years are statistically significant at the 95% confidence level. For the WNPMI, significant positive correlations mainly concentrate on the left bank of the downstream, while it would be on the right bank of the downstream for the IMI.
Water 11 02086 g004
Figure 5. Spatial distributions of the first three empirical orthogonal function (EOF) modes during JJAS of 1951–2015.
Water 11 02086 g005
Figure 6. The variation of the first principal component (PC1), western North Pacific summer monsoon index (WNPMI), and Indian summer monsoon index (IMI) during JJAS of 1951–2015. The r is the correlation coefficient, and ** denotes statistical significance at the 99% confidence level.
Water 11 02086 g006
Figure 7. Composite difference of precipitation during JJAS between strong and weak monsoon ((a) western North Pacific summer monsoon (WNPSM) and (b) Indian summer monsoon (ISM)) years. In the regions enclosed by the red contour line, the composite differences of precipitation during JJAS between strong and weak monsoon years are statistically significant at the 95% confidence level. Significant composite differences mainly concentrate on the left bank of the downstream for the WNPSM, whereas this would be on the right bank of the downstream for the ISM.
Water 11 02086 g007
Figure 8. Precipitation during JJAS (left axis) in different types of WNPSM years, as well as altitude (right axis) along latitudinal cross sections at 13° N, 14° N, 15° N and 16° N.
Water 11 02086 g008
Figure 9. (a) Averaged 850-hPa winds and (b) composite difference of 850-hPa winds between strong and weak WNPSM years during JJAS (1951–2015).
Water 11 02086 g009
Figure 10. Flow anomalies during JJAS associated with WNPSM at six hydrological stations. Time series at Chiang Saen, Luang Prabang and Nong Khai stations are 1970–2012, and those at Mukdahan, Pakse and Stung Treng stations are 1951–2015.
Water 11 02086 g010
Table 1. Drainage area and annual flow at selected hydrological stations in the Lancang–Mekong River Basin.
Hydrological StationDrainage Area (103 km2)Annual Flow (109 m3)
Chiang Saen18985
Luang Prabang268123
Nong Khai302142
Mukdahan391240
Pakse545306
Stung Treng635413
Table 2. Correlation coefficients between monsoon index (WNPMI and IMI) and river flow in each sub-basin during JJAS (1970–2012).
Sub-basinWNPMIIMI
Above Chiang Saen−0.070.19
Chiang Saen-Luang Prabang0.200.16
Luang Prabang-Nong Khai0.110.20
Nong Khai-Mukdahan0.42 **−0.11
Mukdahan-Pakse0.34 *0.09
Pakse-Stung Treng0.58 **0.04
The * denotes statistical significance at the 95% confidence level, and ** denotes statistical significance at the 99% confidence level.

