Article

Statistical Analysis of Bed Load Transport over an Armored Bed Layer with Cluster Microforms

1
Key Laboratory of Water Cycle and Related Land Surface Processes, Institute of Geographic Sciences and Natural Resources Research, Chinese Academy of Sciences, Beijing 100101, China
2
University of Chinese Academy of Sciences, Beijing 100049, China
*
Authors to whom correspondence should be addressed.
Water 2019, 11(10), 2082; https://doi.org/10.3390/w11102082
Submission received: 9 August 2019 / Revised: 1 October 2019 / Accepted: 3 October 2019 / Published: 6 October 2019
(This article belongs to the Section Hydraulics and Hydrodynamics)

Abstract

:
River engineers have long been challenged by the need to predict sediment transport, especially over armored riverbeds. This study investigates the statistical properties of bed load transport over an armored bed layer with cluster microforms in laboratory experiments. Particle clusters on the sediment bed were formed by widely graded particles under constant flow. A series of key kinematic parameters computed from particle trajectories recorded by a digital camcorder, including mean squared particle displacement (MSD), particle number activity, particle velocities, step length, and rest period, were analyzed. The scaling growth of the MSD with time showed that the particle diffusion regime was superdiffusive at small time scales, but became subdiffusive at larger time scales. The particle number activity follows a negative binomial distribution, and the probability distributions of streamwise and transverse particle velocities displayed heavy asymptotic tails, which indicates the particle clusters might exert a dual impact on bed load transport: some particles are accelerated in the preferential paths between particle clusters, while others were obstructed by the particle clusters. In addition, the bed load diffusion regime varied with observation time scales. The findings of this study can gain insight into the bed load transport processes over armored riverbeds.

1. Introduction

In nature, a gravel stream bed that has a wide particle size distribution often develops an armored surface layer with various cluster microforms [1,2,3]. The term ‘‘cluster’’ describes a discrete, self-organized grouping of sediment particles that sit atop the surrounding bed surface [4]. Over the last two decades, river engineers have been challenged by the need to predict sandy sediment transport over armored gravel beds. Such phenomena are often observed in streams after dam removal or wildfires [5]. Despite the substantial efforts, including hiding-exposing correction [6] and surface-based transport mechanisms [7], our ability to estimate bed load flux on mixed-size gravel beds remains unsatisfactory [8]. A major obstacle is to quantify the impact of particle clusters on bed load transport.
Bed load transport is a highly stochastic process, which involves an enormous number of particle motions that can be viewed as a series of probabilistic events. It remains a challenge to explore the particle motions at the grain scale even in a well-controlled flume experiment due to complex flow-particle, particle-particle and particle-bed interactions. Fortunately, recent advances in image-processing technology allow us to track the trajectories of multiple sediment particles simultaneously, which provides a means to capture the details of instantaneous bed load particle motions [9,10,11,12] rather than the average quantities only.
A number of kinematic parameters of the bed load transport have been investigated in previous flume experiments to study the stochasticity in bed load particle motions, such as particle number activity, particle velocity, step length, and rest period between two particle steps [13,14,15,16,17], but the results were not always consistent among different studies. For example, the particle velocity was most often described by the thin-tailed probability density distributions (PDFs), such as the Gaussian [11,18] or exponential distributions [10,13,17]. This is consistent with the findings by Furbish and Schmeeckle [19] and Fan et al. [20] based on their theoretical derivations. However, other probability distributions, such as the chi-square [21], were also proposed for different experiments. For particle number activity, Ancey et al. [22] indicated that the theoretical PDF should be a negative binomial distribution when collective entrainment, in which a stationary particle can be destabilized by a moving particle, is considered. Roseberry et al. [13] stated that the PDF of the particle number activity can be modulated by turbulence structures induced by certain bed configurations. Early studies reported that the particle step length can also be described by the thin-tailed exponential distributions [23,24]. However, recent flume experiments [13] and field surveys [25] suggested that the gamma distribution might be a better fit for the experimental data. Notably, Ganti et al. [26] suggested that the step length distribution can be heavy-tailed with power-law tails due to the size heterogeneous of tracer grains in gravel-bed streams. For the rest period, some researchers proposed the exponential distributions [23,24], while others proposed the gamma [25,27] or power-law distributions [11]. Voepel et al. [28] argued that the distribution of the rest period was initially a power-law function and took an exponential form after a certain period. As listed above, the statistical characteristics of bed load particle motions are far from being well understood, and there is no consensus on the PDFs of the kinematic parameters of bed load transport.
A possible cause for the various distributions of the sediment parameters lies in the differences in experiment set-up. Most previous flume experiments used either uniform [13,17] or well sorted (narrowly graded) sediment particles [10,12,29] as bed material, which implies that the bed armoring and cluster forming processes might be absent in these experiments. Clusters have been shown to play an important role in affecting flow dynamics by introducing additional perturbations to bed stability [30], and particle movement [31], which might also affect the diffusion regime of bed load transport because of “broad” distributions (with a diverging first or second moment) and/or long-range autocorrelations in particle motions [32]. For instance, the rest period distribution could be altered by various physical processes, such as burial by particles and dunes [33], and trapping by sediment clusters [3]. Nonetheless, the experiments with widely graded bed material are rarely seen in the literature, and the understanding of the influence of particle clusters on bed load particle motions is still limited.
This study intends to investigate the statistical properties of the bed load particle motions over an armored bed layer with cluster microforms in a flume experiment. The trajectories of multiple individual grains are simultaneously tracked using photographic technology, which enables the fundamental kinematic parameters (the particle number activity, the particle velocity, the step length, and the rest period) of bed load transport to be computed and analyzed. The mean squared displacements (MSD) of bed load particles are also computed to reveal if anomalous particle diffusion occurs in our experiment. The connection between particle diffusion regimes and probability distributions of the kinematic parameters of bed load transport is also discussed. It has been reported that, if the probability density functions (PDFs) of these variables are all thin-tailed, normal diffusion will result for all time scales except at very short initial time due to particles’ inertia; in contrast, anomalous diffusion (super- or subdiffusion) may arise from the heavy-tailed PDFs of at least one of those variables [15], which cannot be described by traditional stochastic models that deal with the time-average transport rate of the moving particles [34]. In recent years, stochastic bed load transport models, including the random walk models (RWM) [35,36], the Exner-Based Master Equation (EBME) [37], the fractional advection-dispersion equation (FADE) [3], the episodic Langevin Equation (ELE) [15], and many others [22,38] have been developed to describe the time-varying characteristics of bed load transport process. The results from our experiment may provide data to calibrate the key parameters of these models and gain insight into the statistical properties of bed load transport over highly nonuniform sediment beds.

2. Theoretical Backgrounds

Nikora et al. [39] established a theoretical framework, which generalized the bed load transport as a particle diffusion process. Bed load transport can be viewed as an ensemble of sediment particles, each of which moves episodically through discrete steps separated by resting periods. Although the forms of individual particle motions may differ (i.e., rolling, sliding, and saltating), the bed load transport can be conceptualized as a random walk with two distinct states, namely the moving state and the resting state. In other words, we do not discriminate between different forms of particle motions and simply classify all active particles as “moving” particles. The diffusion regime of bed load transport can be determined by the temporal variation in displacements of bed load particles. The MSD, denoted by σ2, may be adopted to define the diffusivity of the bed load transport process, which can be expressed as [36]:
σ 2 = x 2 ( t ) x ( t ) 2
where x(t) is the displacement of an individual particle at time t, and the angle bracket denotes an ensemble average over all particles. The diffusion regime of bed load transport can be identified as normal (Fickian) or anomalous (non-Fickian) according to the scaling growth of the MSD of particle displacements with time t [15,39]:
σ 2 t γ
where γ is a power-law exponent of t. For normal particle diffusion, the exponent γ = 1 and σ2 grows linearly with time; for subdiffusion, 0 < γ < 1; for superdiffusion, γ > 1; and for ballistic transport, γ = 2 and σ2 grows the same as particles moving in different directions with no pauses or direction changes [36].
Theoretically speaking, the diffusion regime can be fully described by the collective behavior of bed load particles at the grain scale. Although some conceptual models, e.g., the symmetric/asymmetric random walks [36] and Langevin-Fokker Planck equations [15], have been proposed to quantify the connection between the particle diffusion regime and individual particle motions, the details have not been fully revealed. Normal diffusion is a corollary of the Central Limit Theorem (CLT), which states that the sum of a large number of statistically independent events will be Gaussian distributed, provided that the distribution of the individual events is not too broad. In case of bed load transport, the CLT requires that both the step length and rest period have converging first and second moments for normal diffusion to occur. For example, if both the step length and the rest period have the exponential probability distributions, the transport system is normally diffusive [36]. The exponential distributions for the step length s and the rest period t can be expressed in terms of the mean step length S ¯ and the mean rest period T ¯ as:
p s ( s ) ~ 1   S ¯ e s   S ¯
p t ( t ) ~ 1   T ¯   e t   T ¯
In normal diffusion, the probability in which a particle is found at a specific location decreases exponentially with the distance away from its original location. If the distributions of the step length and/or the rest period have thicker (heavier) tails than do the exponential distributions, anomalous diffusion may result. Weeks et al. [36] reported strong dependence of the diffusion regimes on the heavy-tailed distributions of the step length and the rest period. In their model, both the step length and the rest period are described by power-law distributions, which can be expressed as:
p s ( s ) ~ s μ
p t ( t ) ~ t ν
where μ, ν are the exponents characterizing the power-law decay rates. When μ, ν < 3, the distributions of the step length and the rest period are broad, implying an unusually large number of long particle steps and long particle rests than predicted by Gaussian models. Other heavy-tailed PDFs, such as the Pareto distribution [15] and the Mittag-Leffle (M-L) distribution [40], were also shown to significantly affect the diffusion regimes of bed load transport [11,15].
Particle number activity and particle velocity are also important stochastic parameters, the PDFs of which differ between normal and anomalous diffusion. The two components of bed load particle motions are key elements in describing the sediment flux and the dispersal of particles during transport. Instantaneous or time-averaged gradients in the particle activity affect particle flux, and the second moment of the particle velocity distribution influences the rate of diffusion of bed load particles in the presence of a particle activity gradient [38]. Roseberry et al. [13] defined the particle number activity as the number of moving particles per unit area per unit time. In the present study, the particle number activity is represented by the number of moving particles within the observation window between two consecutive video snapshots, which is essentially equivalent to that defined by Roseberry et al. [13] because the window size and the frame rate remain unchanged during our experiment. The particle number activity is a key element in describing the diffusive part of the bed load flux [38]. Ancey et al. [22] derived an analytical solution for particle number activity under equilibrium transport, which takes the form of negative binomial distribution as:
p γ ( n ) = Γ ( r + n ) Γ ( r ) n ! p r ( 1 p ) n
where n is particle number activity, r, p are parameters related to particle entrainment and deposition probabilities, and Γ ( ) denotes a gamma distribution.
Conventionally, the streamwise particle velocity was modeled by the exponential or Gaussian distributions [15,41]. For example, the exponential distribution for streamwise particle velocity can be expressed as [10,13,17,41]:
p V x ( V x ) = 1 V x ¯ e V x V x ¯
where V x ¯ is the mean particle velocity at equilibrium transport. Some researchers proposed that the PDFs of the streamwise particle velocity may be heavy-tailed in anomalous diffusion. For example, Bradley et al. [42] modeled the streamwise particle velocity in anomalous diffusion system with an α-stable distribution with a power-law asymptotic tail. The characteristic exponent α indicates the deviation from normal diffusion: the α-stable distribution is Gaussian if α = 2, and is heavy-tailed otherwise. Readers may refer to Bradley et al. [42] for more description on the α-stable distributions.
The cross-stream particle velocity was proposed to be modeled by the Gaussian distribution, which can be expressed as [10,17]:
p V y ( V y ) = 1 π δ V y e ( V y δ V y ) 2
where V y is the cross-stream particle velocity, and δ V y characterizes the order of magnitude of the cross-stream velocity fluctuation.
It is worth noting that the probability distributions reviewed in this section were proposed for bed load transport over uniform or well-sorted (narrowly graded) sediment beds. For bed load transport over nonuniform sediment beds, it is of importance to find a proper distribution that may well describe the key parameters of bed load particle motions and analyze their connection with the diffusion regimes of the bed load transport.

3. Experimental Techniques and Methodology

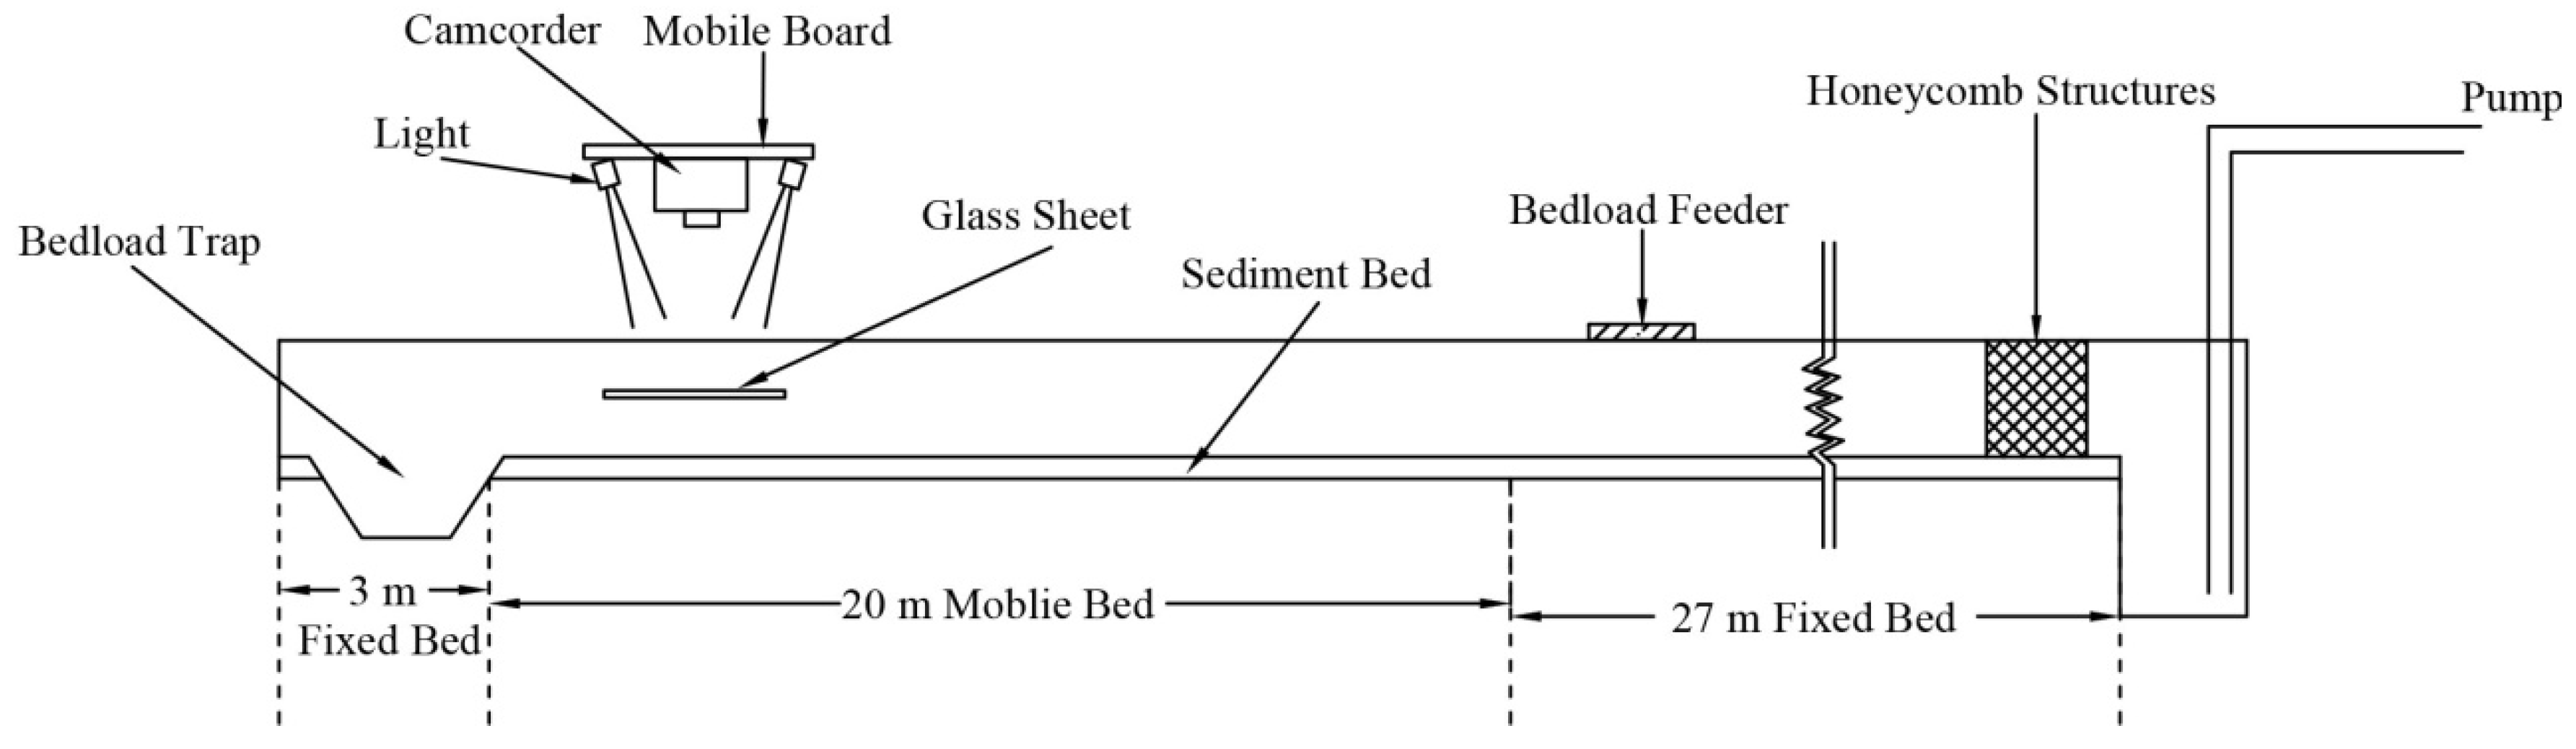
3.1. Experimental Setup

The experiment was conducted in a rectangular flume at China Institute of Water Resources and Hydropower Research (IWHR). The IWHR flume was 50 m long, 1 m wide, and 1.2 m deep with fixed glass walls on both sides of the flume, and the bed slope was 0.004 (Figure 1). A fixed-bed section (27 m in length) was placed after the flume entrance, which was packed with pebbles and cobbles in order to stabilize flow and dissipate flow energy. The test section (20 m in length) was placed between the fixed-bed section and the flume outlet, which was paved with widely graded sediment ranging from sand (0.25 mm) to pebbles (20 mm) (Table 1). The particle size distribution of the sediment bed was selected according to the sediment data at the Lujiahe Site in the middle Yangtze River, China, where strong bed armoring processes were observed. A bed load sediment trap was installed at the flume outlet to collect bed load sediment samples. A digital camcorder was mounted on top of the test section to record the motions of bed load particles at 10 frames per second with a resolution of 1280 × 720 pixels. The monitoring area was a 366 mm (streamwise) × 206 mm (cross-stream) region of the bed surface near the downstream end of the test section. A sheet of glass was placed on the water surface to reduce image distortion due to water surface oscillation.
Before the experiment started, the sediment bed was leveled and worked by uniform water flow to form an armored sediment bed with cluster microforms. The discharge was initially maintained at 80 L/s and then increased in a stepwise manner to 170 L/s. At each flow rate, the flow was maintained constant for sufficiently long time until the flume bed reached an equilibrium state. Moving grains were collected by the sediment trap installed at the flume outlet and continuously fed at the flume inlet. A quasi-steady armored bed layer was formed over the mobile section of the flume after 78 h, as the bed load transport rate approached a small and stable flux rate between 0.74 g/s and 1.05 g/s with an average value of 0.84 g/s for 9.3 h.
After the armored bed layer was formed, the tracer experiment was started with a constant flow rate of 130 L/s. The hydraulic parameters of the experiment were summarized in Table 2. The 3 mm black grains were used as tracer particles and fed at the flume entrance. The motions of the tracer particles were filmed by the 10 Hz digital camcorder when they passed the monitoring area, which can be processed using image processing techniques introduced in the following section.

3.2. Image Processing

The trajectory of a tracer particle can be obtained from a sequence of image frames extracted from video clips. There are two types of popular automated techniques in tracking tracer particles, namely the “shape-matching” approach and the “pattern-matching” approach [43,44]. However, both approaches may encounter difficulty if the tracer particles experience unusually long particle steps [29,39,42]. In our study, the centroids of the tracer particles in each image frame were manually marked with ImageJ program to avoid computer misjudgment. ImageJ is a public domain, Java-based image-processing software developed by the United States National Institutes of Health that has been widely used to track particle trajectories in sediment transport studies [11,13]. The particle trajectory can be automatically generated from the marked locations of tracer particles and converted into a series of streamwise and transverse coordinates, denoted by (xi, yi), that are functions of time ti. The streamwise and transverse particle velocities, Vx and Vy, can be readily computed as:
V x i = x i + 1 x i t i + 1 t i
V y i = y i + 1 y i t i + 1 t i
Considering small image distortion may exist, particle steps that are less than one pixel were excluded from the dataset. Because it is difficult to distinguish between the rolling, sliding and saltating modes of bed load particles on plan-view images, we define the step length as the distance a particle covers between two consecutive “resting” states. A particle was considered to be “resting” if the displacements in both the x- and y- directions in two sequential image frames were less than one pixel; otherwise, it was considered to be “moving”. Similarly, the rest period is defined as the period between two consecutive particle steps.

4. Experimental Results

In this study, we tracked the 3 mm tracer particles passing through the monitoring area in a 5 min video clip, in which 1267 particle steps containing over 300,000 centroid locations can be identified. We analyzed the temporal variation in the MSD and the probability distributions of the particle number activity, the particle velocity, the step length, and the rest period in Section 4.1, Section 4.2, Section 4.3 and Section 4.4, respectively. Fan et al. [45] argued that all tracers must be tracked because the loss of tracked particles may result in apparent but deceptive subdiffusion. In our experimental dataset, only 1% of the tracers were not tracked during the study period.

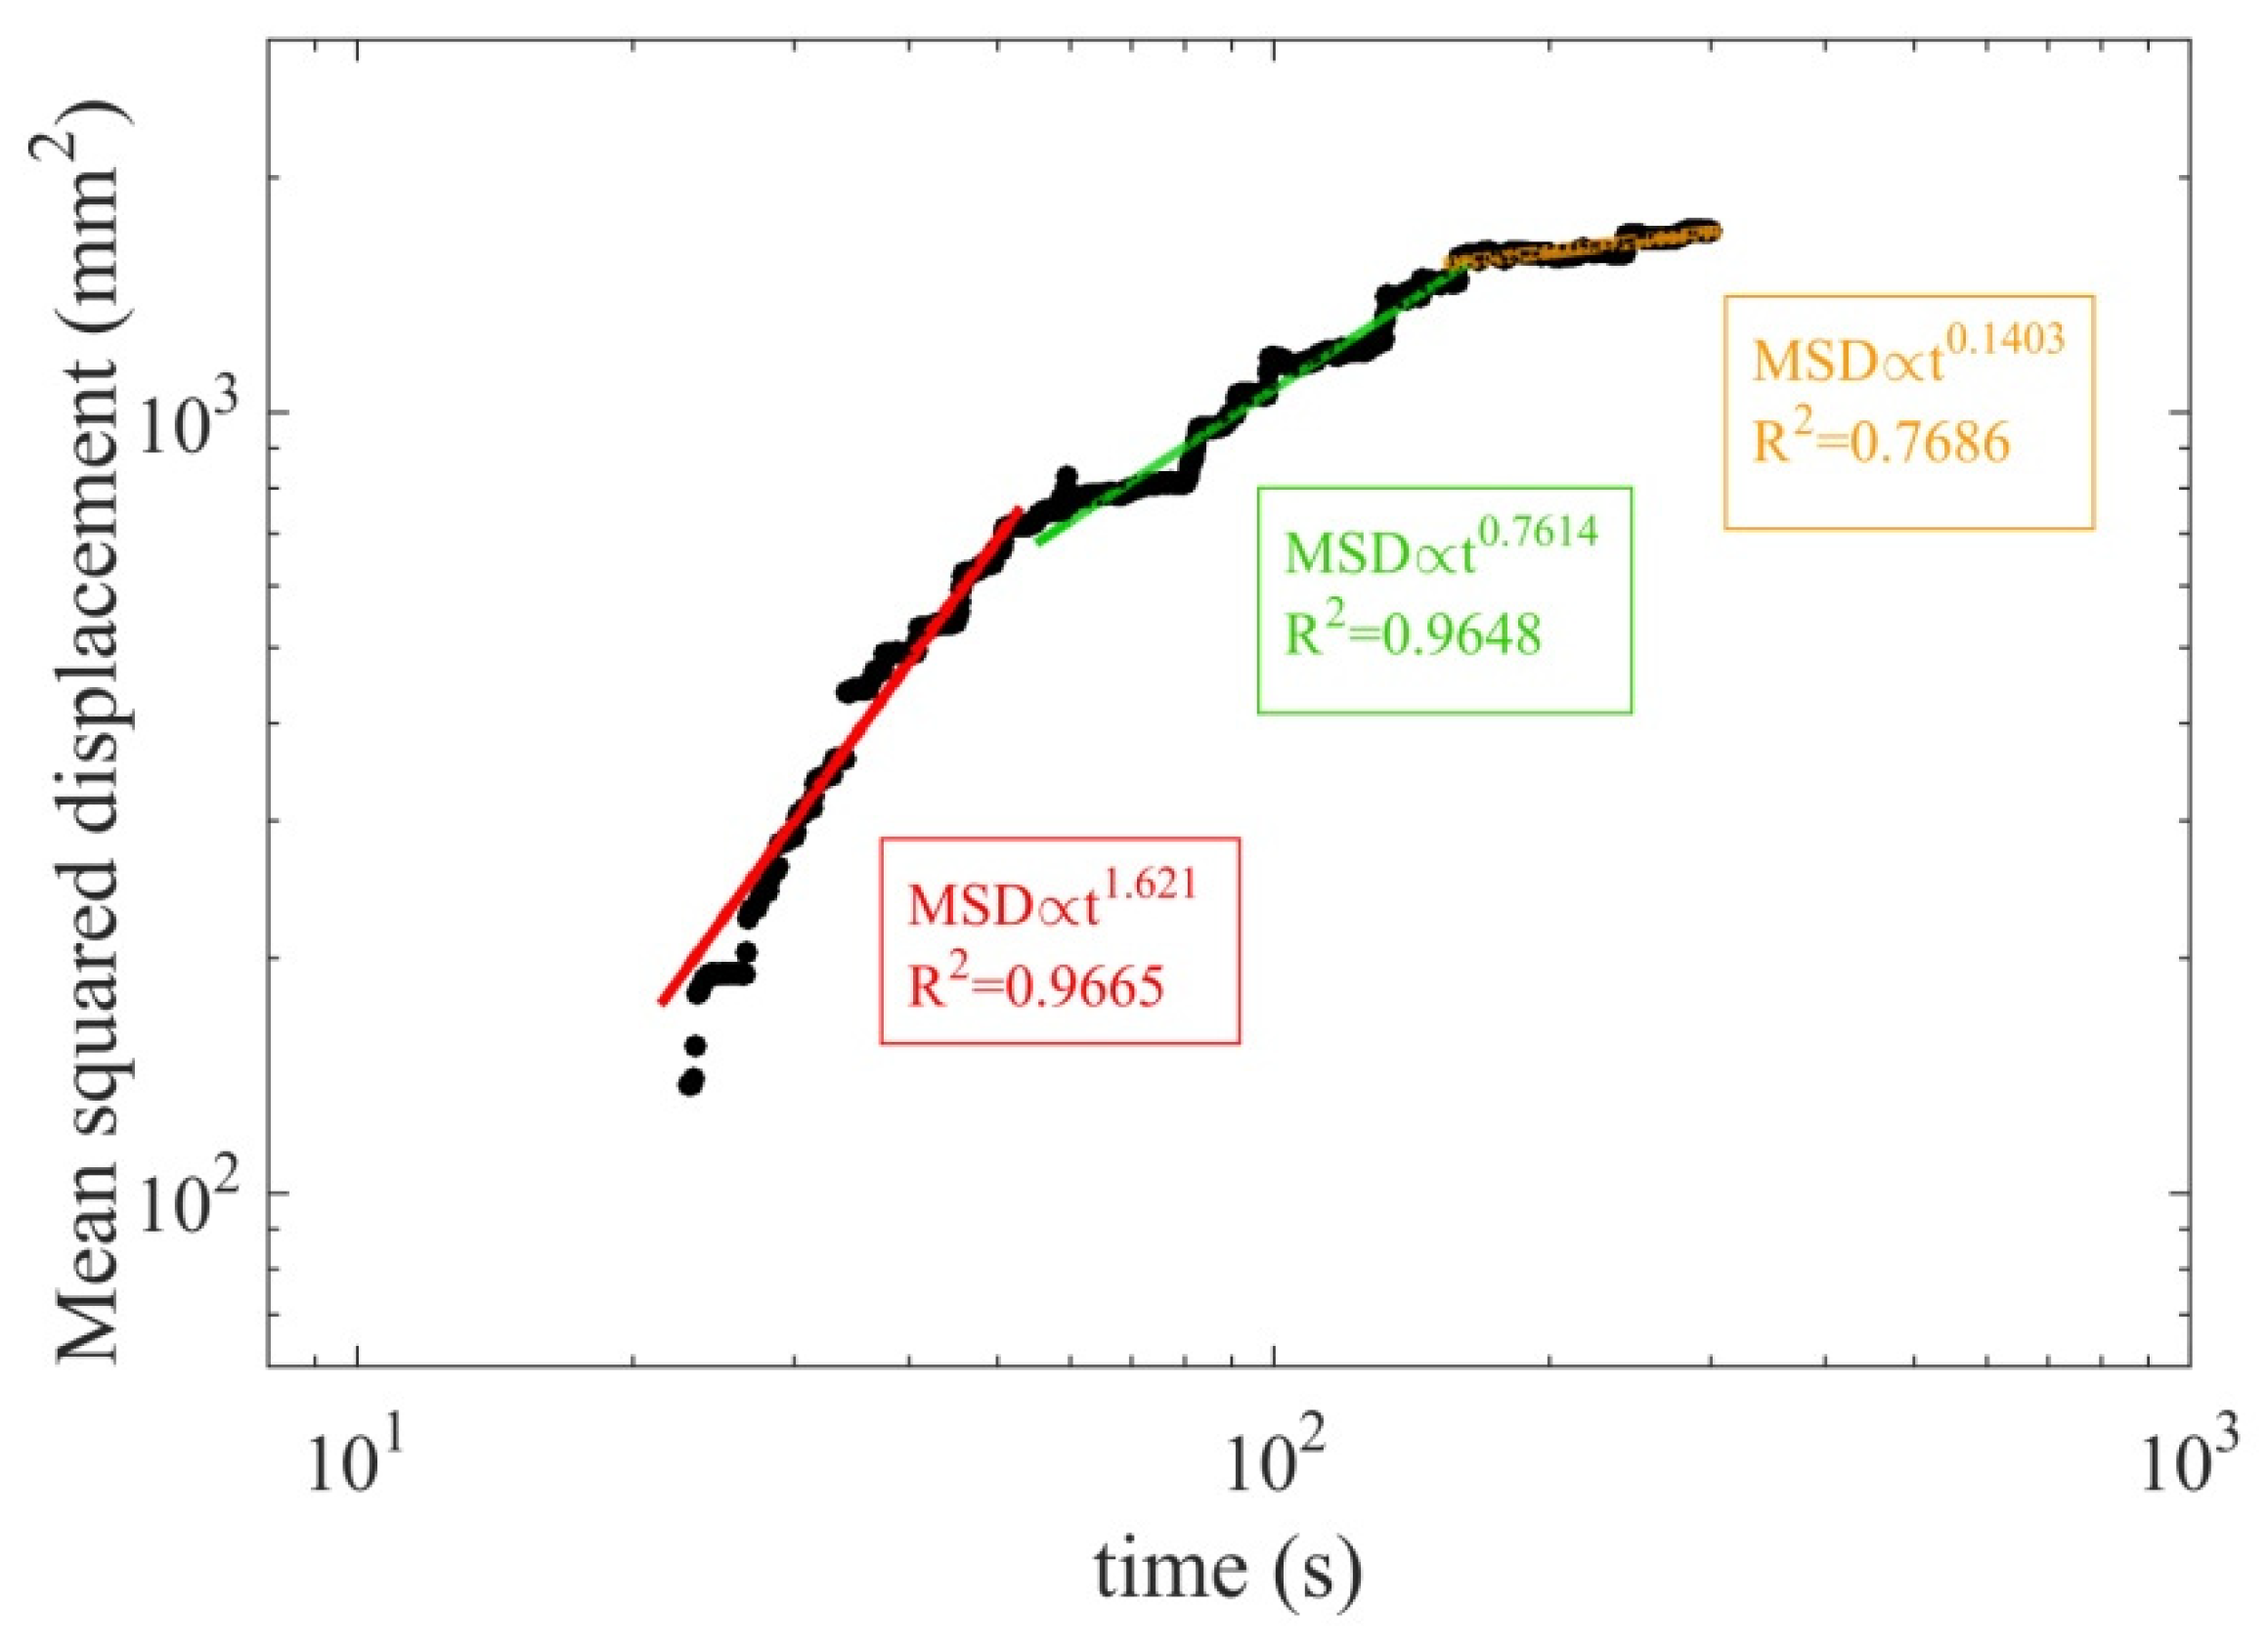
4.1. MSD Growth and Particle Diffusion Regimes

The variation in the MSD of the tracer particles with time was plotted in Figure 2. When fitted by the power-law function in the form of Equation (1), the relationship of the MSD versus time showed different power-law exponents at different time scales: the left part of the fitted curve has a power-law exponent α > 1, while the central and the right parts of curve have power-law exponents α < 1. This scale-dependent behavior is consistent with the conceptual model with time scales proposed by Nikora et al. [39], who proposed that bed load particle motions comprised of three ranges of temporal scales, namely the local range, the intermediate range, and the global range, which were associated with different particle diffusion regimes. In the present study, the particle diffusion regime was superdiffusive in the range of t < 50 s, and was subdiffusive at larger time scales. Fan et al. [15] suggested that the anomalous diffusion regime in bed load transport is resulted from the heavy-tailed distributions of the kinematic variables of particle motions. In addition, the time scales at which the transitions between particle diffusion regimes occur are apparently larger than that proposed by Nikora et al. [39] and Fan et al. [15], which might also be due to the thick tails in the probability distribution of the rest period. Therefore, the key kinematic parameters, including particle number activity, particle velocities, step length, and rest period were analyzed in the following sections.

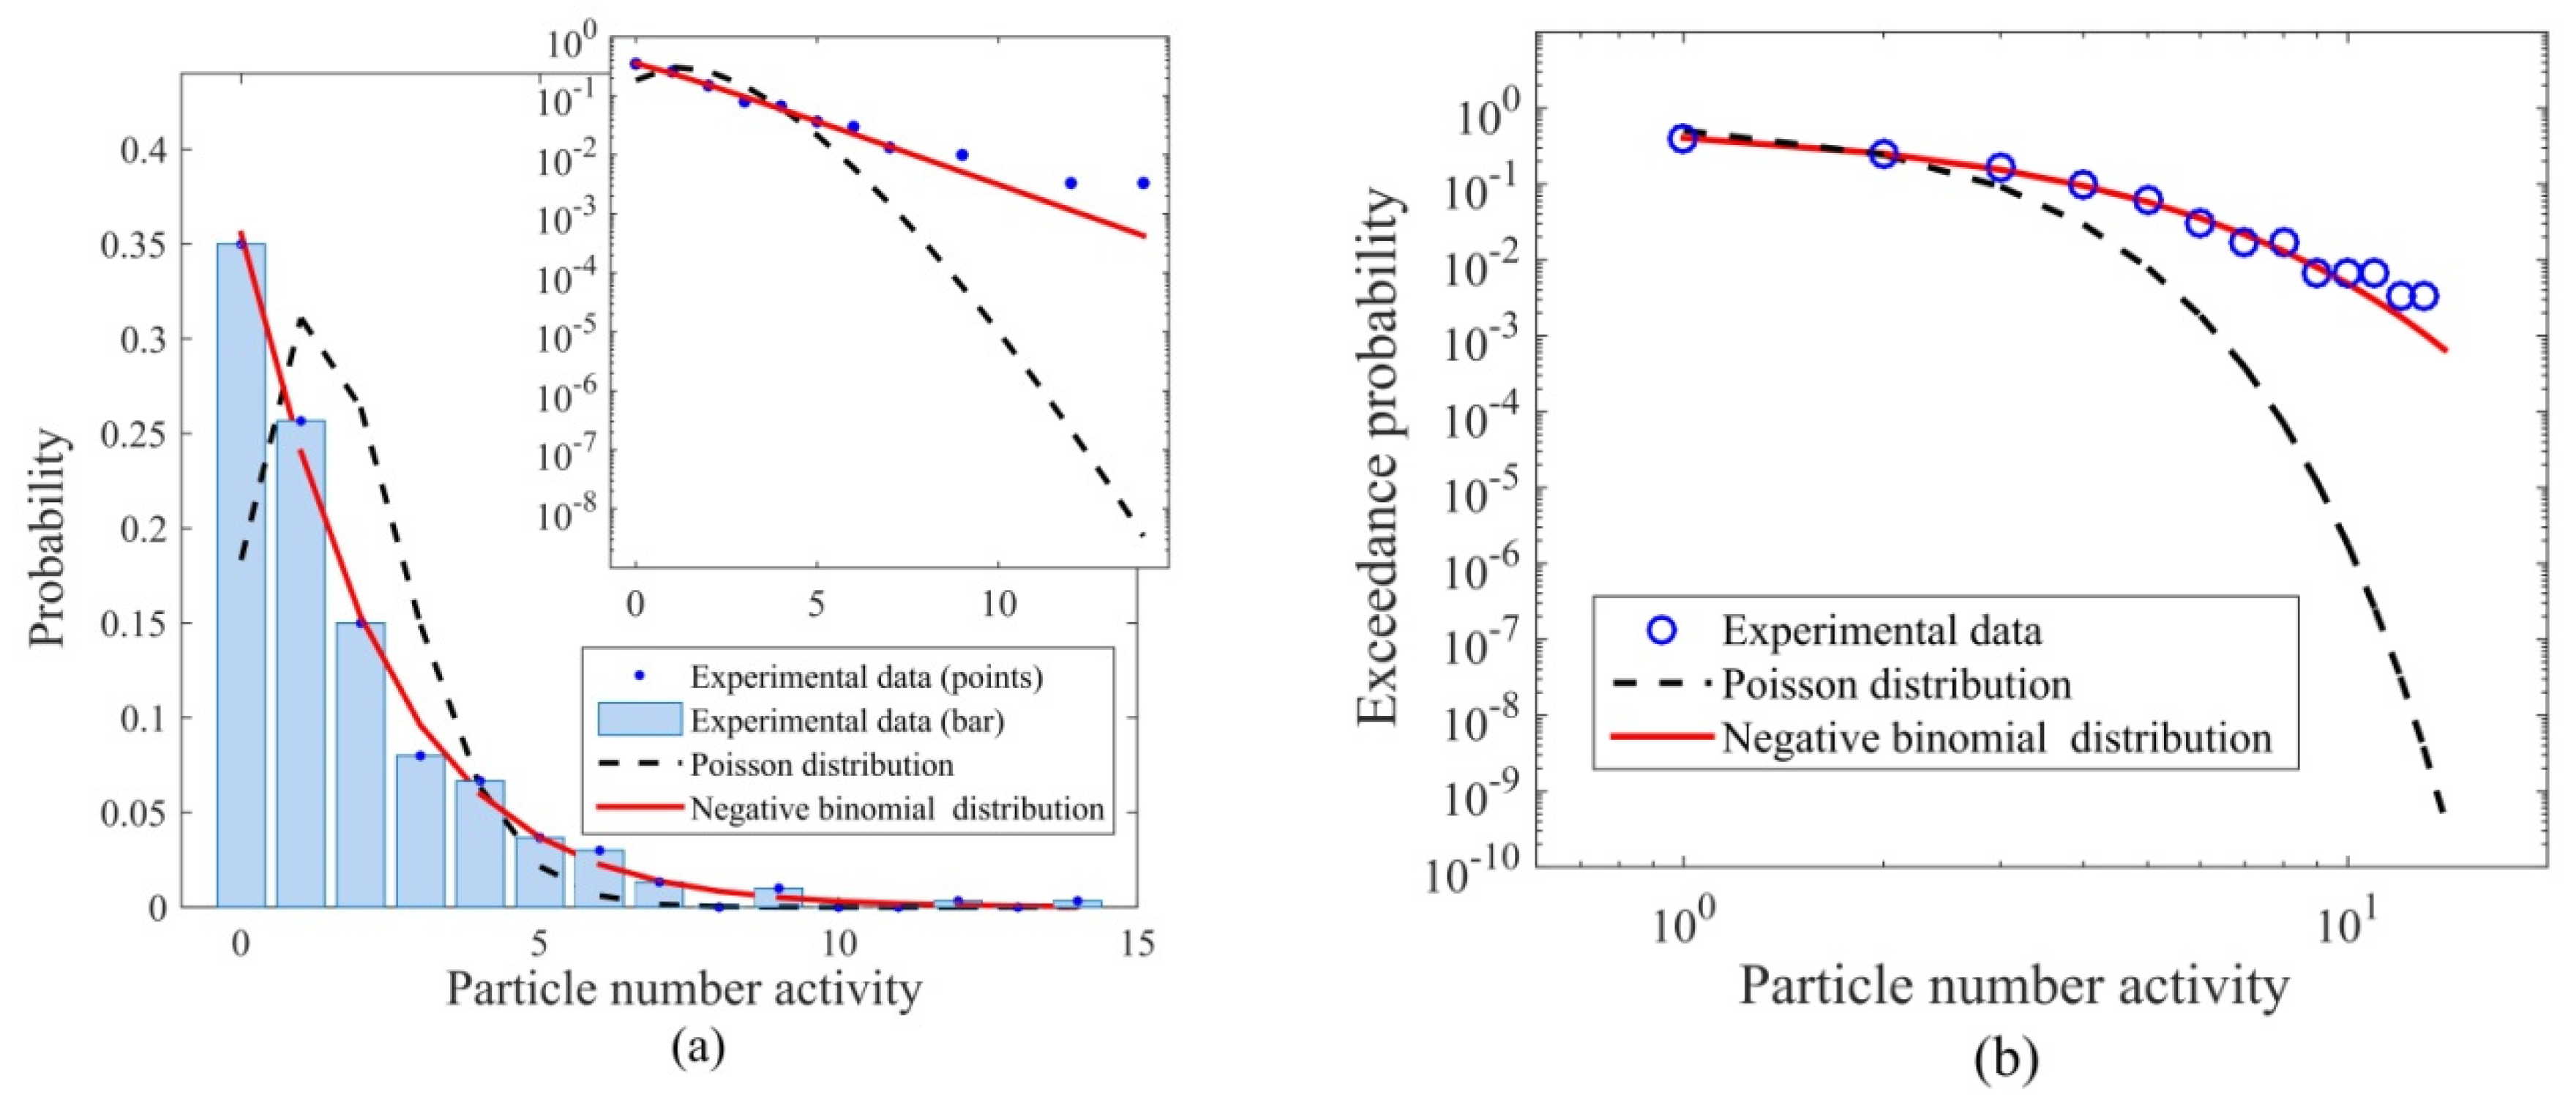
4.2. Particle Number Activity

The probability distribution of the particle number activity was plotted in Figure 3. Ancey et al. [22] considered bed load transport as a two-state Markov process and derived that the particle number activity followed the negative binomial distribution if collective entrainment (entrainment of stationary grains by active ones) is considered or the Poisson distribution otherwise. Therefore, the Poisson distribution and the negative binomial distribution were plotted in the figure for comparison. Figure 3 shows that the measured data significantly deviate from the Poisson distribution, but is reasonably well described by the negative binomial distribution, which indicates that the particle interaction could potentially affect the probability distribution of the particle number activity. However, particle collisions between bed load particles were not frequently seen in our experiment due to relatively low bed load transport rates. Roseberry et al. [13] suggested that the discrepancy between the distribution of the actual particle number activity and the Poisson distribution might also be attributed to the turbulence structure induced by bed configuration, leading to preferential selection or exclusion of particle entrainment and deposition. In our experiment, cluster formation and breakdown were occasionally observed in the armored bed layer; consequently, some tracer particles were trapped inside the particle clusters, whereas others were preferentially transported via the paths between the particle clusters. Therefore, the preferential particle transport and trapping by the particle clusters are likely to be responsible for the discrepancy between the two probability distributions.

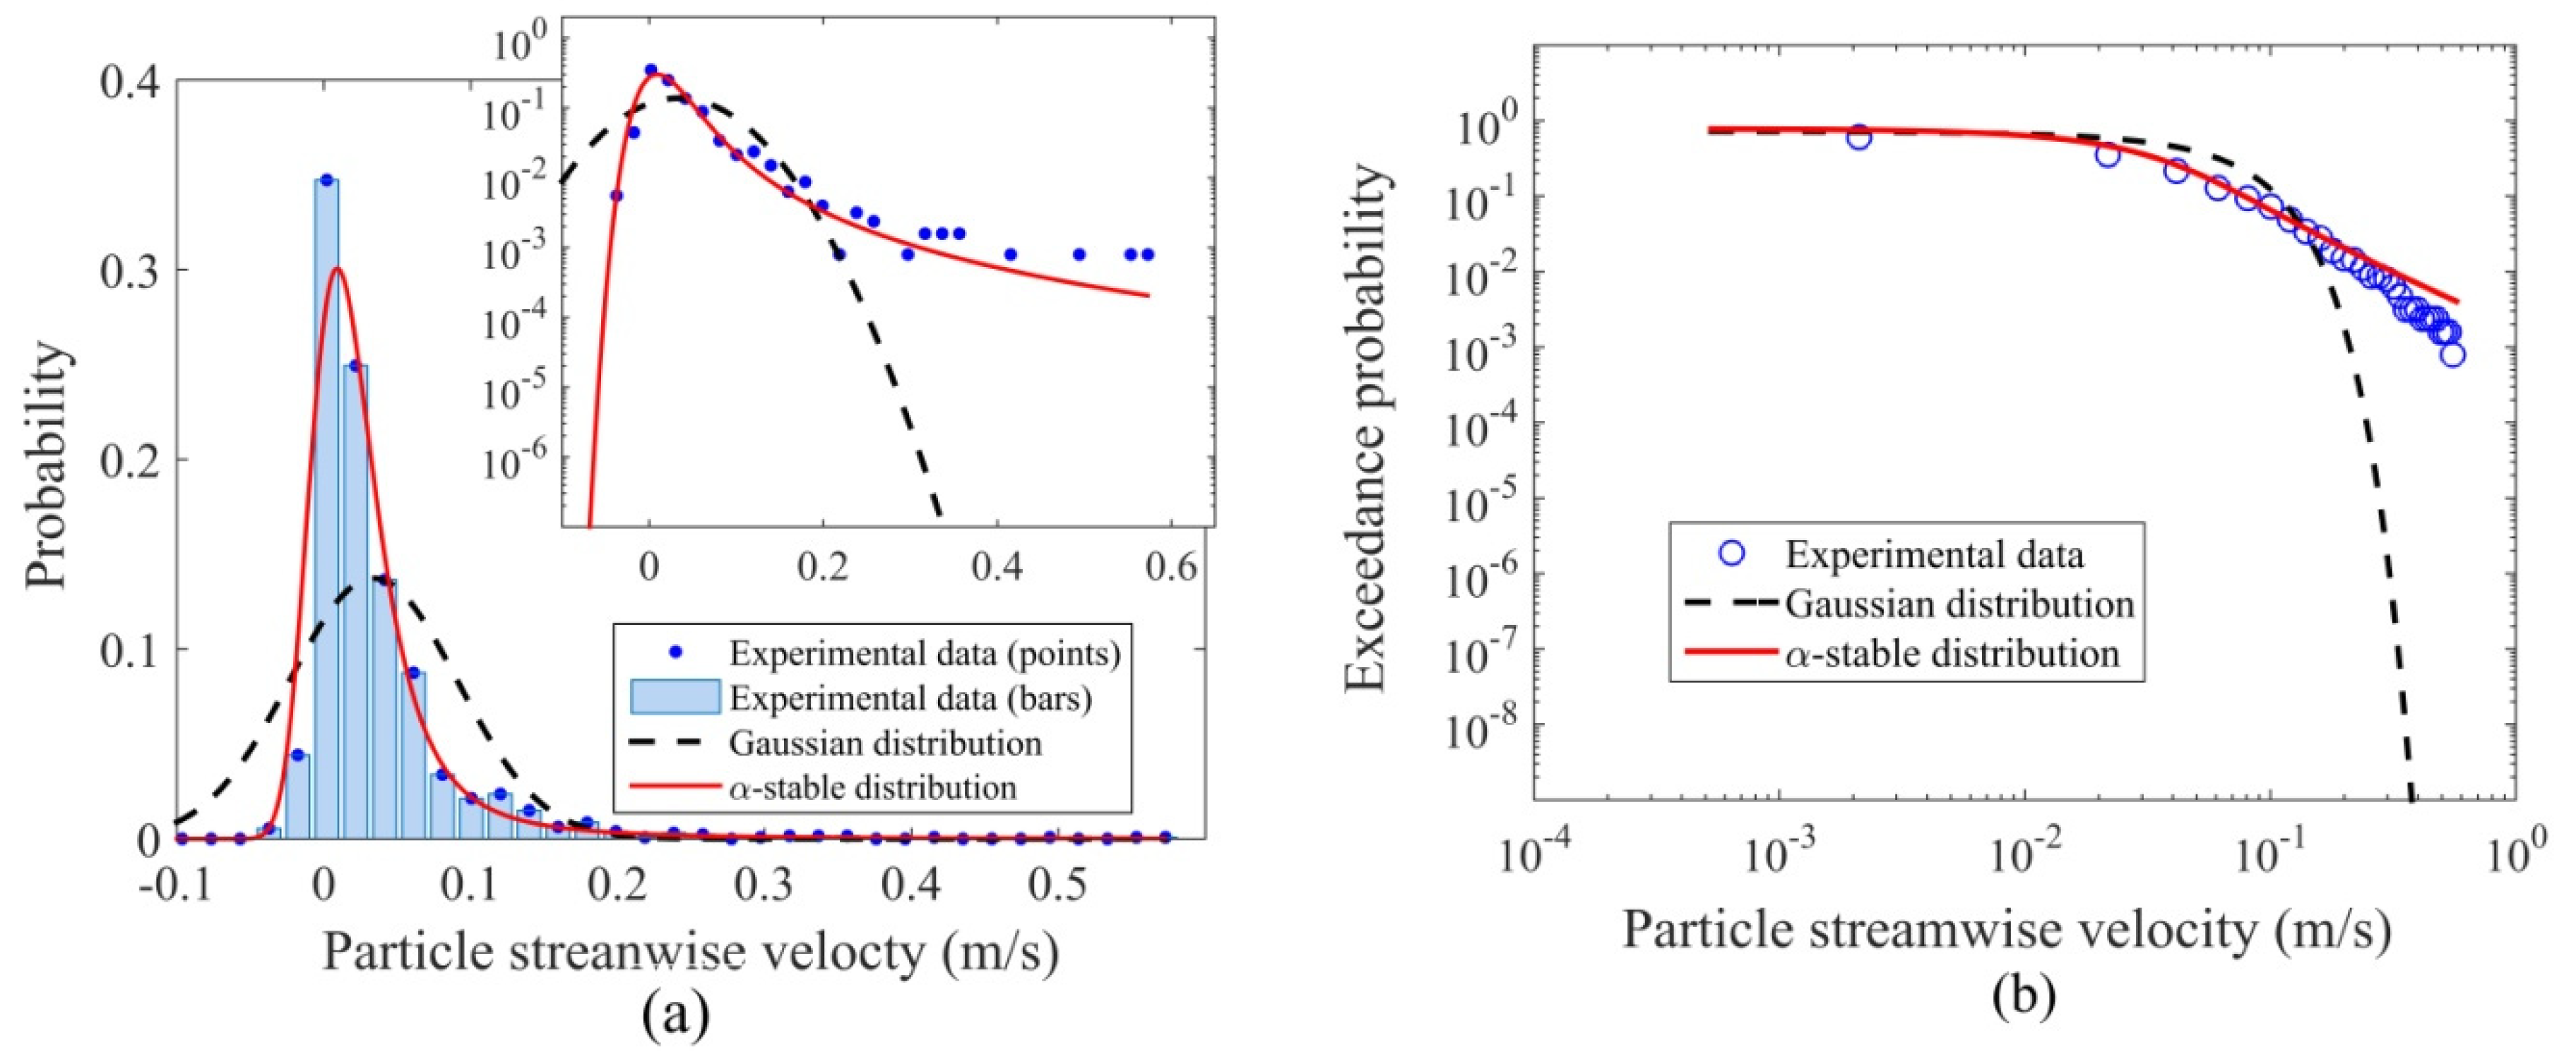
4.3. Particle Velocity

The probability distribution of the streamwise particle velocity, Vx, was plotted in Figure 4. The probability distributions of the particle velocity were investigated in several previous experiments. Lajeunesse et al. [10], Roseberry et al. [13] and Shim and Duan [17] neglected negative streamwise velocities in their experiment data and found that the rest of the data were well fitted by the exponential distribution, whereas Martin et al. [11], Ancey and Heyman [41] and Heyman et al. [12] suggested that the particle velocity followed the Gaussian distribution. Fan et al. [20] used a hybrid mechanistic-stochastic model to analyze the bed load transport under low transport rates and found that the positive and negative streamwise velocities decayed exponentially at different rates. In our experiment, negative velocities accounted for almost 10% of the total Vx measurements and therefore cannot be neglected. Therefore, we adopted the (thin-tailed) Gaussian distribution with exponential tails and the (heavy-tailed) α-stable distribution with power-law tails to describe the two-sided Vx distribution. Figure 4 shows that the probability distribution of the streamwise particle velocity significantly deviates from the Gaussian distribution as Vx→+∞ and is well described by the α-stable distribution. The thick tails in the α-stable distribution imply that there is a higher fraction of high-velocity bed load particles over the armored bed layer than predicted by the thin-tailed distributions. The left tail in the α-stable distribution on the left indicates a noticeable amount of grains moved in the upstream direction, which has not been reported in other experiments.
The probability distribution of the transverse particle velocity, Vy, was plotted in Figure 5. Similarly, Vy shows a symmetric bell-shaped distribution that has a narrow central peak and heavy tails on both sides that are much thicker than those of the Gaussian distribution. Thus, we proposed that the α-stable distribution also provides a better fit for Vy with proper parameters. Our experimental results contradict the widely accepted view that the transverse particle velocity follows the thin-tailed exponential or Gaussian distributions based on previous experiments [10,13,17]. After comparing with the previous experiments, we attribute this inconsistency to the armored gravel bed configuration with cluster microforms, which was not commonly seen in previous experiments. This will be further discussed in Section 5.1.

4.4. Particle Step Length and Rest Period

The particle step length, s, was fitted by the Gaussian distribution and the α-stable distribution, which were plotted in Figure 6. Because there are a few negative particle steps in our dataset, the two-sided Gaussian and α-stable distributions were adopted. As shown in Figure 6, the heavy-tailed α-stable distribution with power-law tails fits the experimental data better than does the thin-tailed Gaussian distribution. Nakagawa [46] reported that the distribution of the particle step length was thin-tail for uniform-sized particles. Ganti et al. [26] and Hill et al. [29] suggested that the distribution of the particle step length for mixed-sized sediment was heavy-tailed because of the size heterogeneity in moving grains. In our experiment, the tracer particles were approximately uniform in size; therefore, the heavy tails in the distribution of the particle step length is unlikely to be caused by size heterogeneity. It is noted that the probability distribution of the particle length is similar to that of the particle streamwise velocity, which is not surprising because both parameters were related to the preferential particle transport and trapping mechanisms of particle clusters. Therefore, the heavy-tailed distribution of the particle step length is also likely attributed to the bed configuration in our experiment.
The distribution of the rest period was fitted by the exponential distribution and the M-L distribution in Figure 7. The M-L distribution with β ∈ [0, 1] is a family of one-sided heavy-tailed probability distributions with power-law tails, which grow thicker as β decreases. Figure 7 shows that the M-L distribution fits the data better than the exponential distribution, which indicates that a portion of the bed load particles experienced unusually long rest periods than expected by the exponential distribution. This is consistent with the results in several laboratory experiments [11] and field surveys [28], which suggested that the heavy-tailed distribution of the particle rest period occurs because particles were buried beneath the surface or stored within the bars and flood plains of a river [47]. In our experiment, particle clusters may obstruct the transport of bed load particles and increase the chances of particle trapping, thereby resulting in usually long particle rests in bed load transport.

5. Discussion

5.1. Comparison with Previous Experiments

The present experiment has some important differences with previous bed load transport experiments. A distinct feature is the use of armored bed layer with cluster microforms, which was formed under constant flow with widely graded sediment particles. As we reviewed earlier, most of the previous experiments used either uniformly sized [13,17] or narrowly graded sediment [10,12,29] as bed material, in which the particle clusters were rarely encountered. Particle clusters may alter bed particle organization and local turbulence structure, and thus has a strong impact on the bed load particle motions. Consequently, the bed load particle motions exhibit some unique features that have not been reported in previous experiments. For example, the probability distributions of both the streamwise and the transverse particle velocities were heavy-tailed, indicating that a considerable amount of particles travelled significantly faster than those predicted by the Gaussian or the exponential distributions proposed in previous studies. The discrepancy is likely a result of the bed configuration in our experiment. Figure 8 shows a picture of the quasi-equilibrium armored bed surface with cluster microforms. The largest particles with a medium size of 17 mm (marked by red circles) were observed to congregate and form cluster structures of different shapes, including the line, heap, and ring clusters. When the tracer particles travelled through the paths between the clusters (marked by blue lines), they were accelerated due to locally enhanced water flow, thereby producing the heavy tails in the streamwise particle velocity distribution. Brayshaw et al. [48] measured the pressure field around the anchor stone on sediment beds and reported that the flow was enhanced on the flanks of the anchor stone to produce two symmetrical high shear stress regions in which fine particles are unlikely to rest. Note that some of the particle paths were highly tortuous due to the obstruction of cluster structures; therefore, the probability distribution of the transverse particle velocity also was also affected by these accelerating particles and became heavy-tailed.
Another notable feature of the bed load particle motions is the high fraction of negative streamwise particle velocity. In previous experiments, negative streamwise particle velocities were treated as “false” velocities due to water surface oscillation [10] or trembling motions of resting particles [17], and were excluded from the data sets, and the rest of the data were fitted by one-sided probability distributions. In our experiment, negative velocities accounted for almost 10% of the total Vx measurements, which is unlikely to be measurement error only. During the experiment, the tracer particles were occasionally observed to quiver inside the ring clusters, or bounce back when colliding with large resting particles in the armored bed layer. Therefore, we proposed that negative streamwise particle velocities should be considered in studying bed load sediment transport.
Based on our observations, we argue that the particle clusters over armored bed layers exert a dual impact on bed load sediment particles: some particles are accelerated in the preferential paths between particle clusters, while others were obstructed by the clusters to produce negative streamwise particle velocities. The particle clusters may also influence the probability distributions of other kinematic parameters. For example, particle acceleration in preferential transport paths between clusters and particle trapping in the ring-shaped clusters may increase the opportunity of usually large particle leaps and long particle rests and results in heavy tails in the probability distributions of both the particle step length and the rest period. Nonetheless, the heavy-tailed distributions for the particle step length and the rest period were also reported in several studies where the armored bed layer was absent. More experimental data are warranted to confirm the influence of the armored bed layer with cluster microforms on the heavy tails of these distributions.

5.2. Particle Diffusion Regime and Particle Motion Statistics

The scaling growth of the MSD with time indicates that the particle diffusion regime in our experiment is anomalous. In our experiment, the particle diffusion regime was superdiffusive at small time scales, but became subdiffusive at larger time scales. Previous studies suggested that the particle diffusion regime was constrained by the statistical characteristics of particle motions [13,22,38,39]; therefore, the anomalous diffusion regime in our experiment is likely associated with the heavy-tailed distributions of the kinematic parameters. Weeks et al. [36] and Fan et al. [15] investigated the quantitative relationship between the scaling exponent (α) of the MSD and the power-law exponents of the rest period distribution with random walk and Langevin-Fokker Planck Equation, respectively, and their results were rather consistent. To compare with their results, we used the power-law distribution to fit our experimental data, which produced a tail parameter of ν = 1.065 (corresponding to a total of 10 sample groups) for the rest period distribution. According to Weeks et al. [36] and Fan et al. [15], this corresponds to a diffusion exponent of α = 0.13 (strongly subdiffusive) at large time scales, which is very close with the scaling exponent of α = 0.14 computed from the relationship between the MSD and time at the time scales of t > 150 s (Figure 2). It is indicated that, despite a heavy-tailed distribution of the particle step length, the diffusion regime mainly depends on the rest regime rather than the motion regime of the bed load particles.
The particle transport regime may be scale-dependent, i.e., the transport process may exhibit different diffusion regimes on different timescales. The multiplicity of temporal scales in bed load transport has been noted in the literature [15,39,49,50]. Here we discussed the scale dependence of bed load motion parameters using the step length as an example. Figure 9 compares the best-fit Gaussian and α-stable distributions of the step length for observation intervals of Δt = 0.1, 0.3, 0.5 and 1 s. The shape parameters of the fitted α-stable distributions are 1.290, 1.326, 1.384, and 1.727 for Δt = 0.1, 0.3, 0.5 and 1 s, which indicates that the tails of the α-stable distributions decay faster and the gradually approaches the tails of the Gaussian distributions as Δt increases. Similarly, the probability distributions of the streamwise and transverse particle velocities and the particle rest period (not shown) all exhibit thinner tails as observation time scale increases. Voepel et al. [28] suggested that the particle rest period distribution changes from a heavy-tailed distribution to an exponential distribution as the time scale increases. Therefore, we proposed that the heavy-tailed distributions in kinematic parameters in bed load transport are associated with small time scales and may average out over longer observation periods. Nonetheless, we should notice the difference between the time scales associated with the transition of particle diffusion regimes and those with the changes in the statistical characteristics of bed load particle motions. Further investigation is needed in unraveling their connections.

5.3. Limitations of the Present Study

The present study may suffer from some limitations due to relatively low sampling frequency and a limited observation window. The sampling frequency determines the smallest possible time scale that can be detected in our image analysis and therefore has a significant influence on the analysis results. Currently, there is no consensus on the requirement of the minimum time scale. Theoretically speaking, the sampling frequency should be high enough to match the smallest step time or rest period of bed load particles; in other words, the time interval between two frames should be equal or smaller than the transition time between two particle states. Our experiments deal with low-intensity bed load transport in which the rest period accounts for 98% of the total observation time. Increasing the existing sampling frequency (10 frames per second) may potentially thicken the distribution tails of particle velocity and step length, but is unlikely to affect the heavy-tailed nature of these distributions.
The mass loss of tracer particles due to a limited observation window size may induce measurement errors that lead to misjudgments about particle diffusive regimes [14,51]. In our experiment, because of the low transport flux and strong resistance of the armored bed layer to entrainment, only about 1% of the tracer particles left the sampling pool during the study period. Hence, the measurement error due to the window size is not significant. Nonetheless, for experiments with large sediment flux, small observation windows may result in false conclusions due to sampling bias towards small step lengths. In the study of particle anomalous diffusion, attention should be paid to the “window” effect on the calculated variance of particle positions. To further explore the details in anomalous bed load transport, higher temporal resolution and larger observation area may be needed in future experiments.

6. Conclusions

This study aims to explore the stochastic nature of bed load transport over an armored bed with cluster microforms. Distinct from previous experiments in which uniform or narrowly graded particles were used, our experiment employed widely graded sediment particles to form the armored bed layer under constant flow. The statistical properties of a series of kinematic parameters, including the MSD, the particle number activity, the streamwise and transverse particle velocities, the step length, and the rest period, were analyzed, and the diffusion regime of the bed load transport was discussed. The major findings of this study are summarized as follows:
  • The scaling growth of the MSD with time showed that the particle diffusion regimes in this experiment varied at different time scales: the particle diffusion regime was superdiffusive at small time scales (T < 50 s), but became subdiffusive at larger time scales.
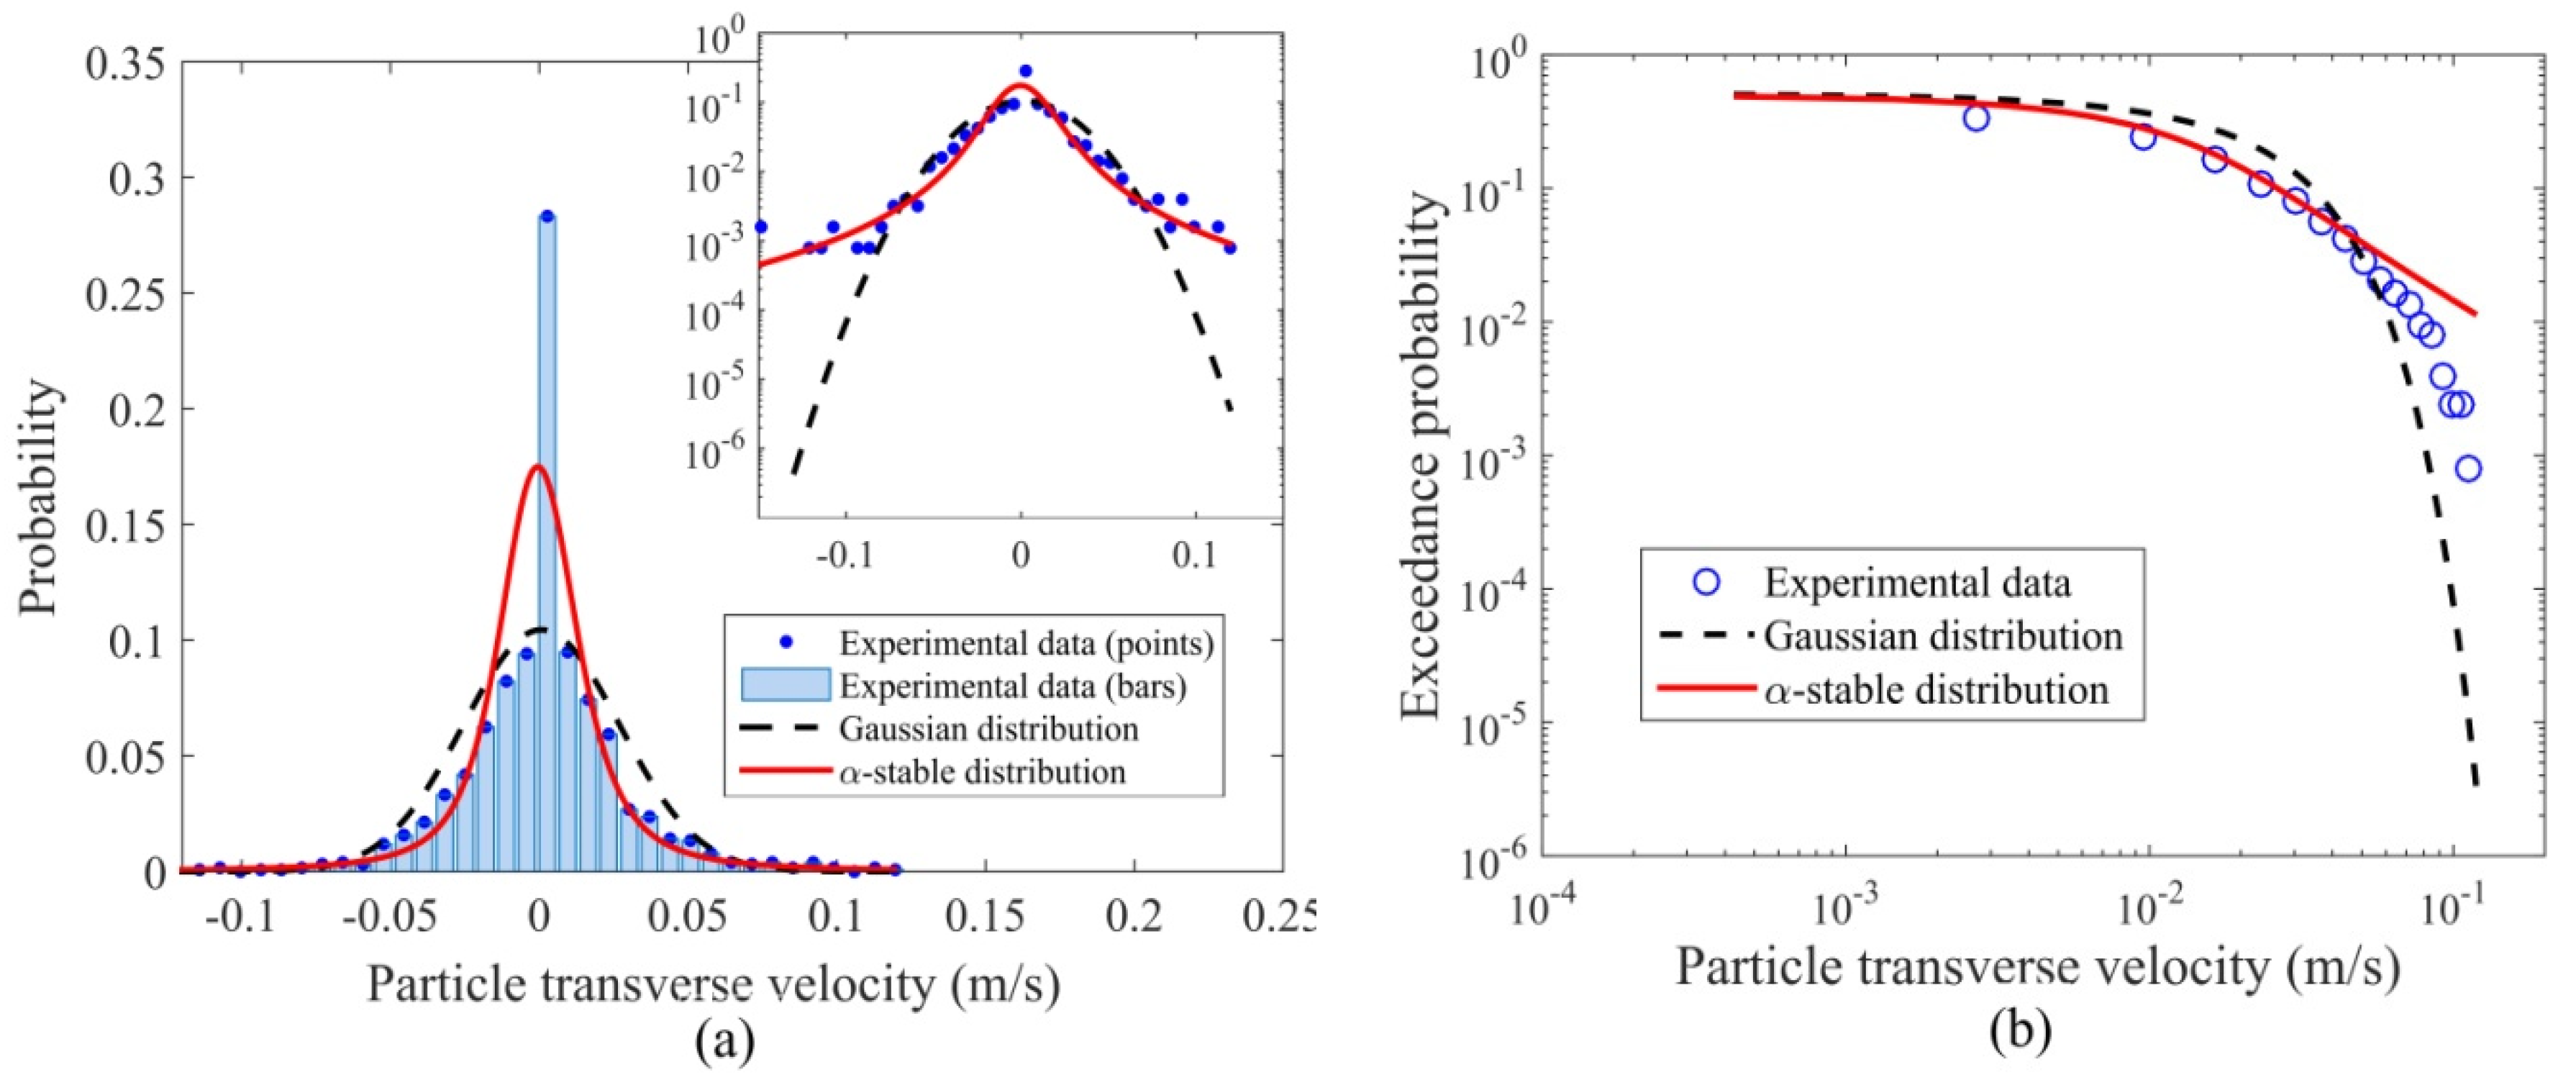
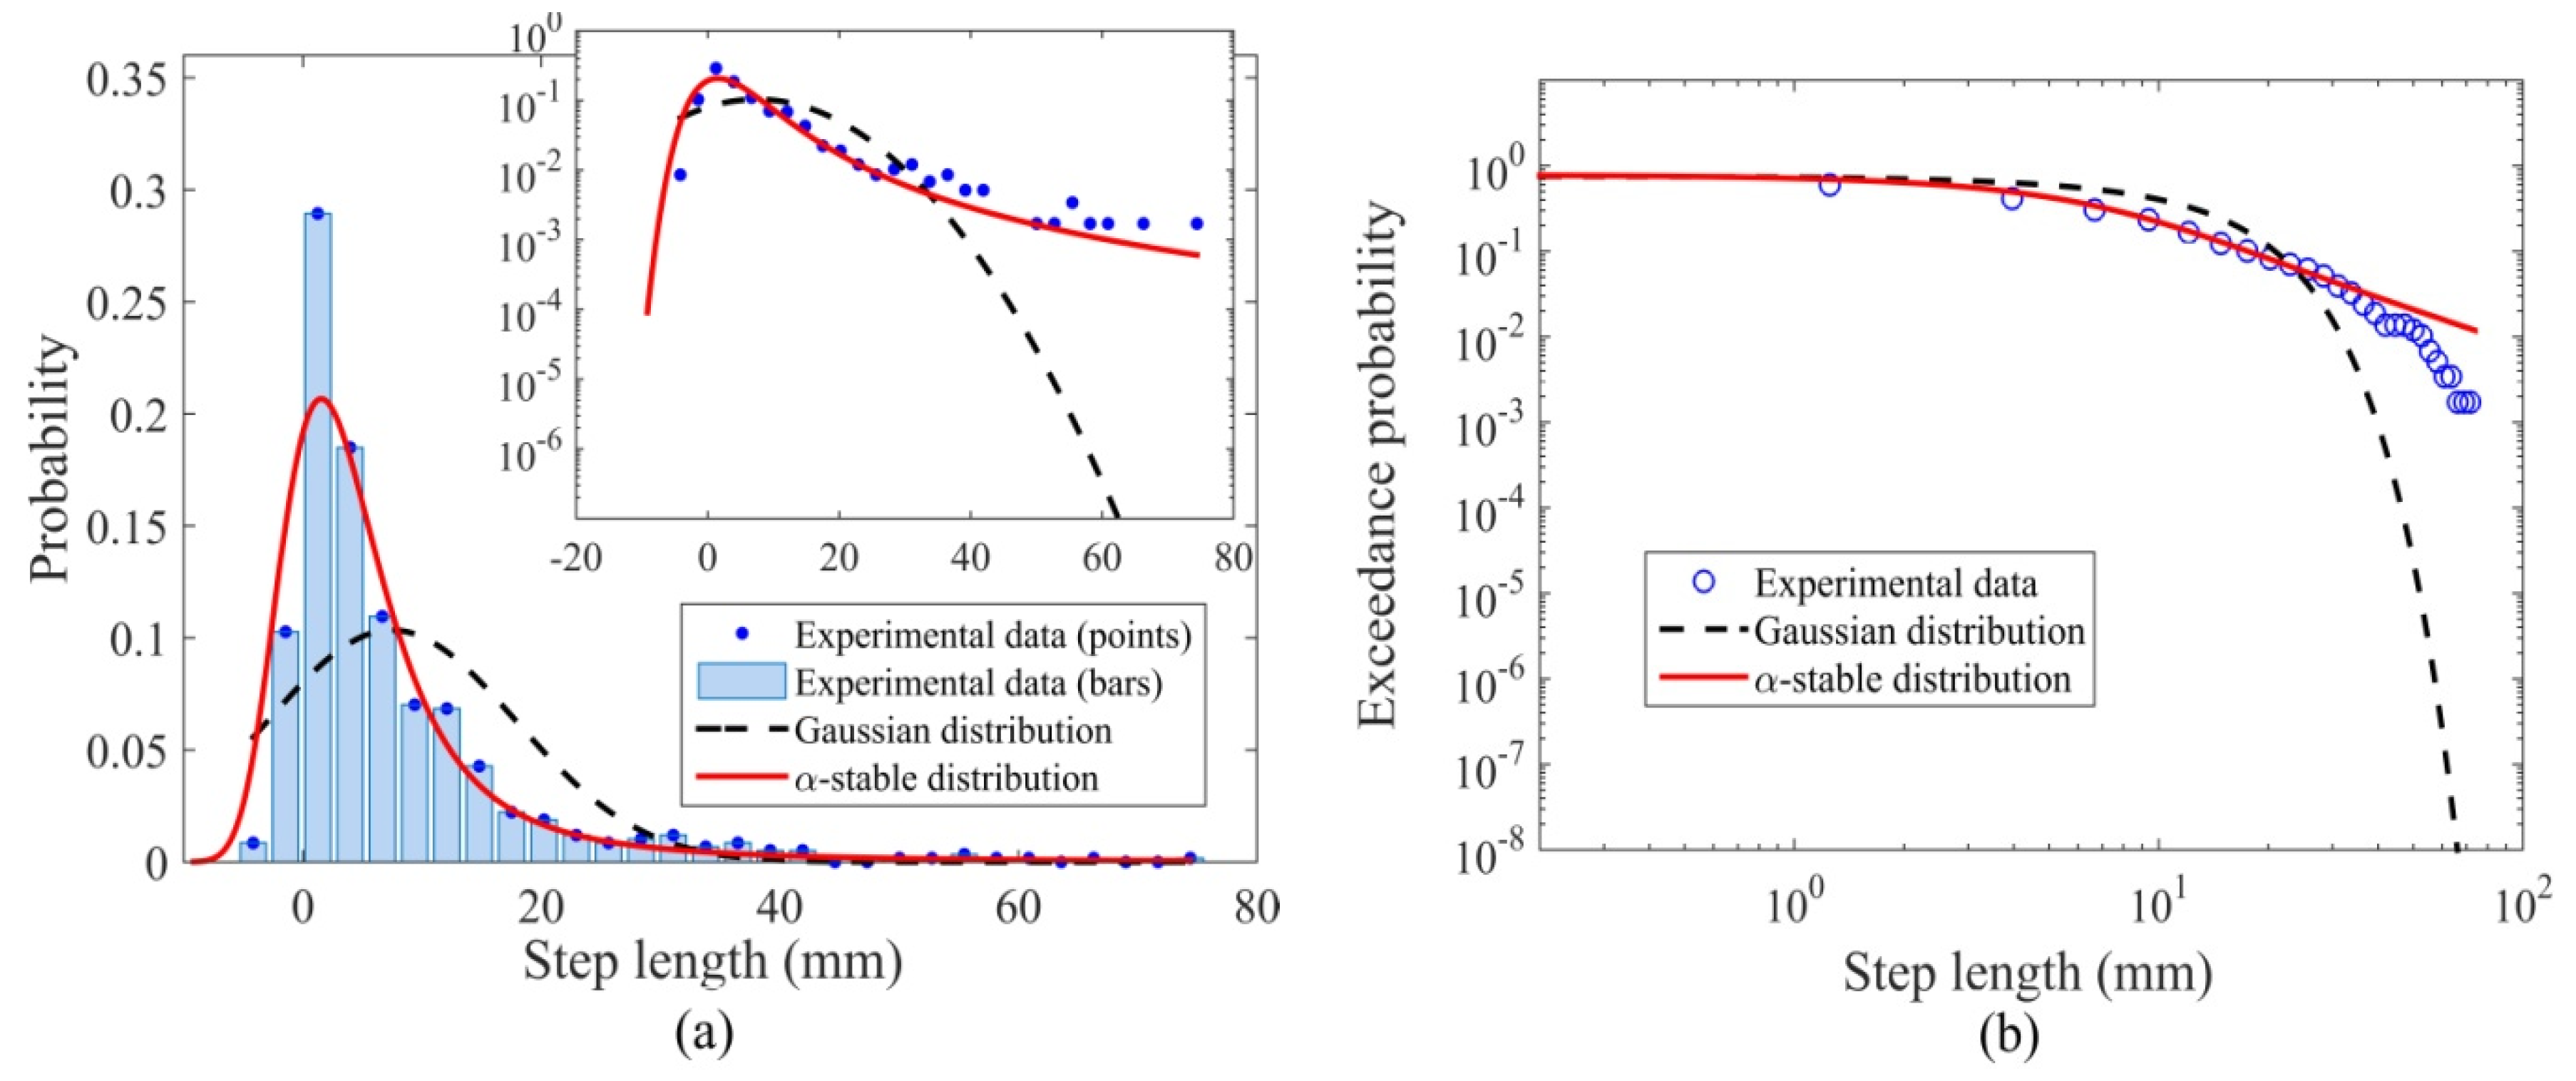
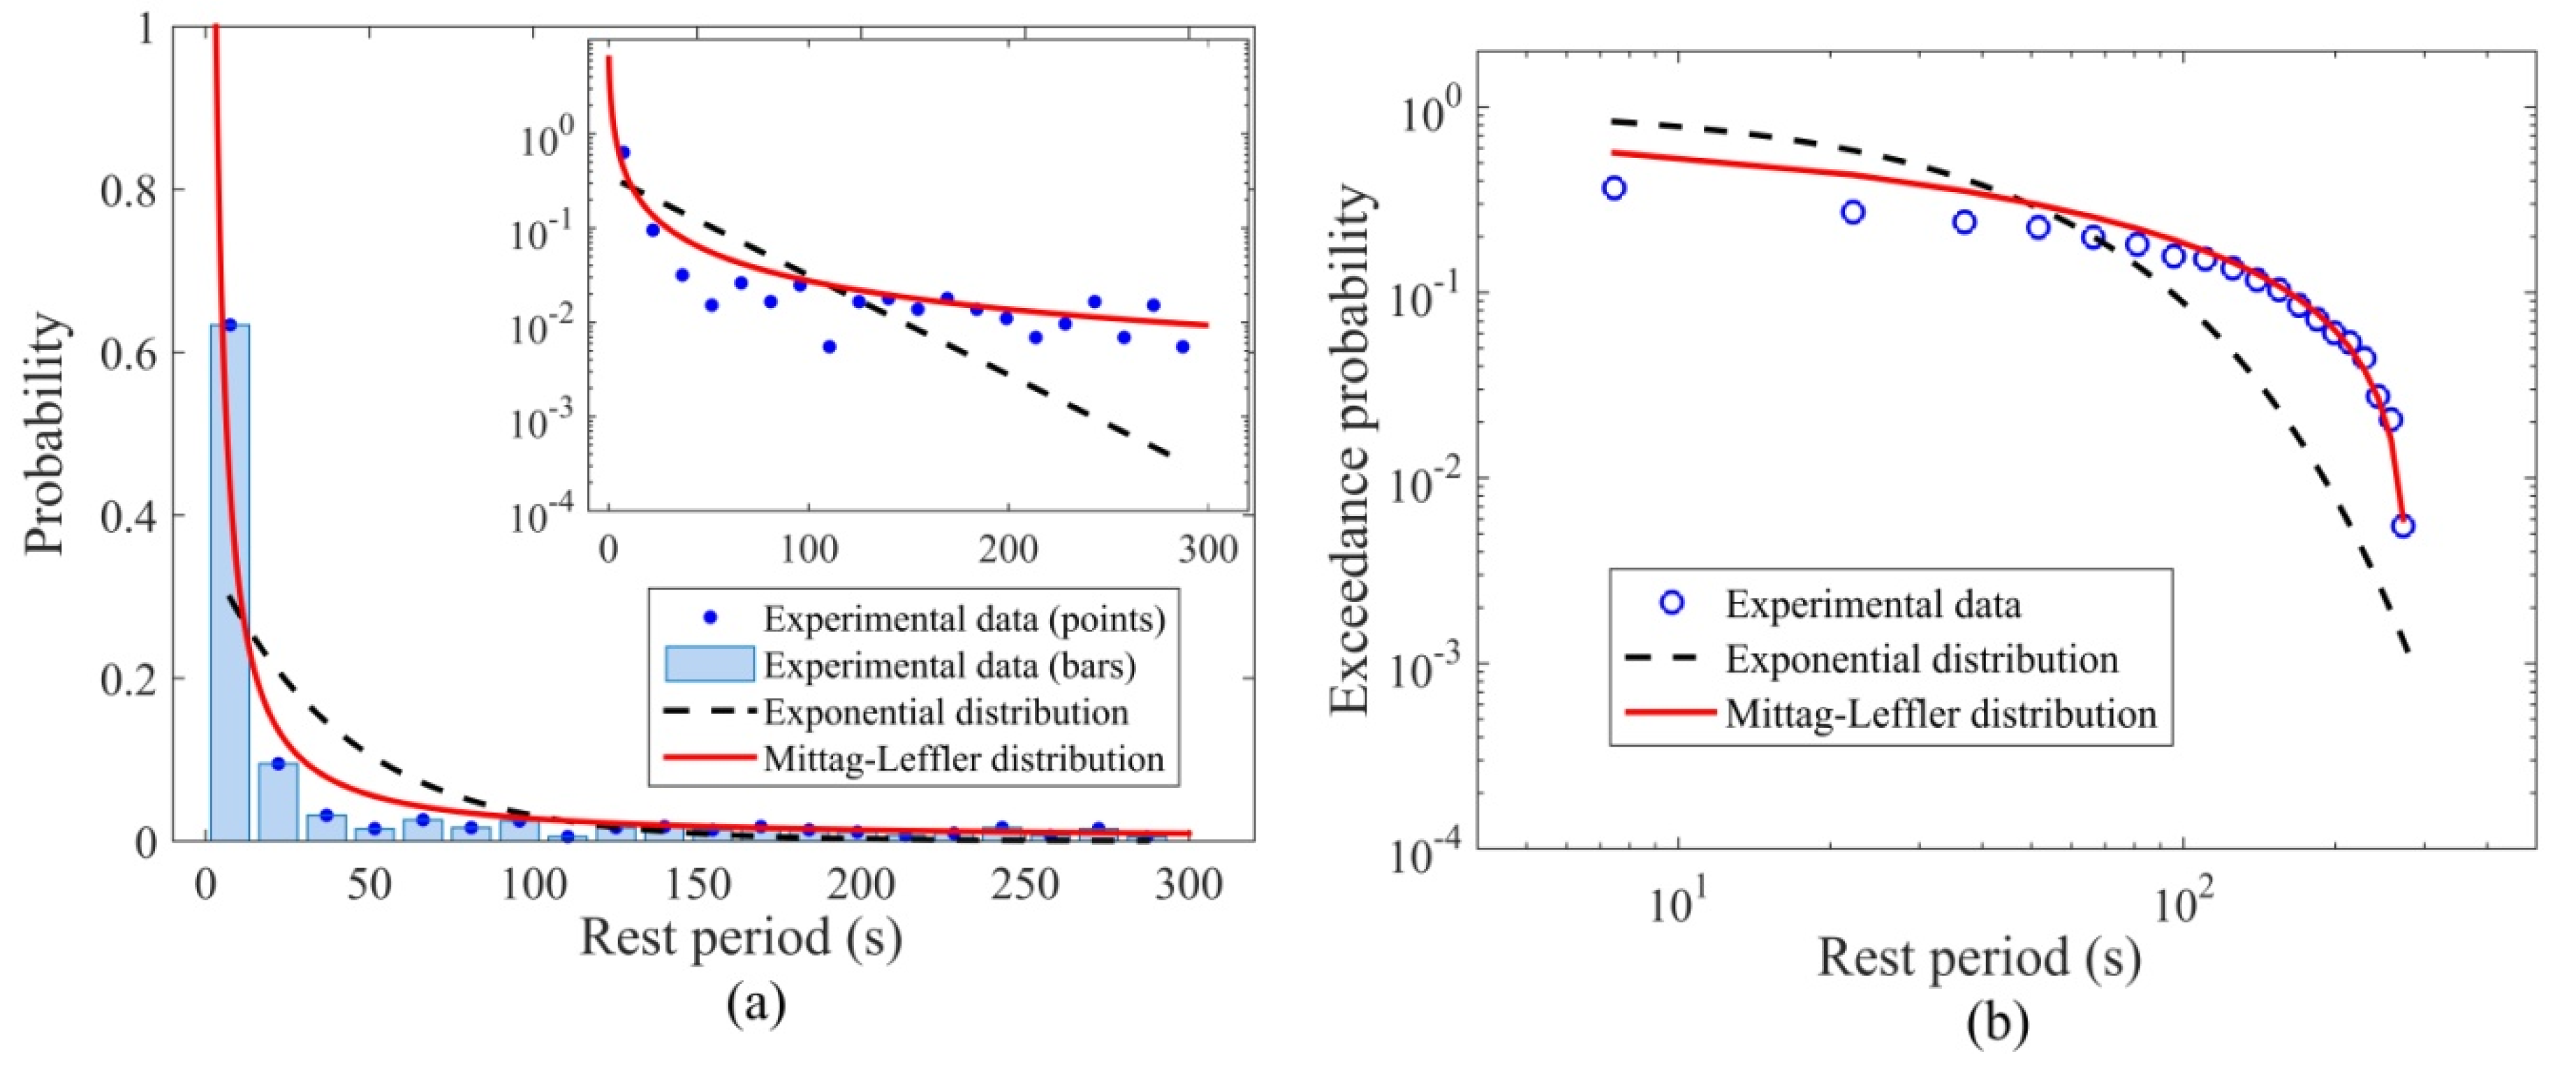
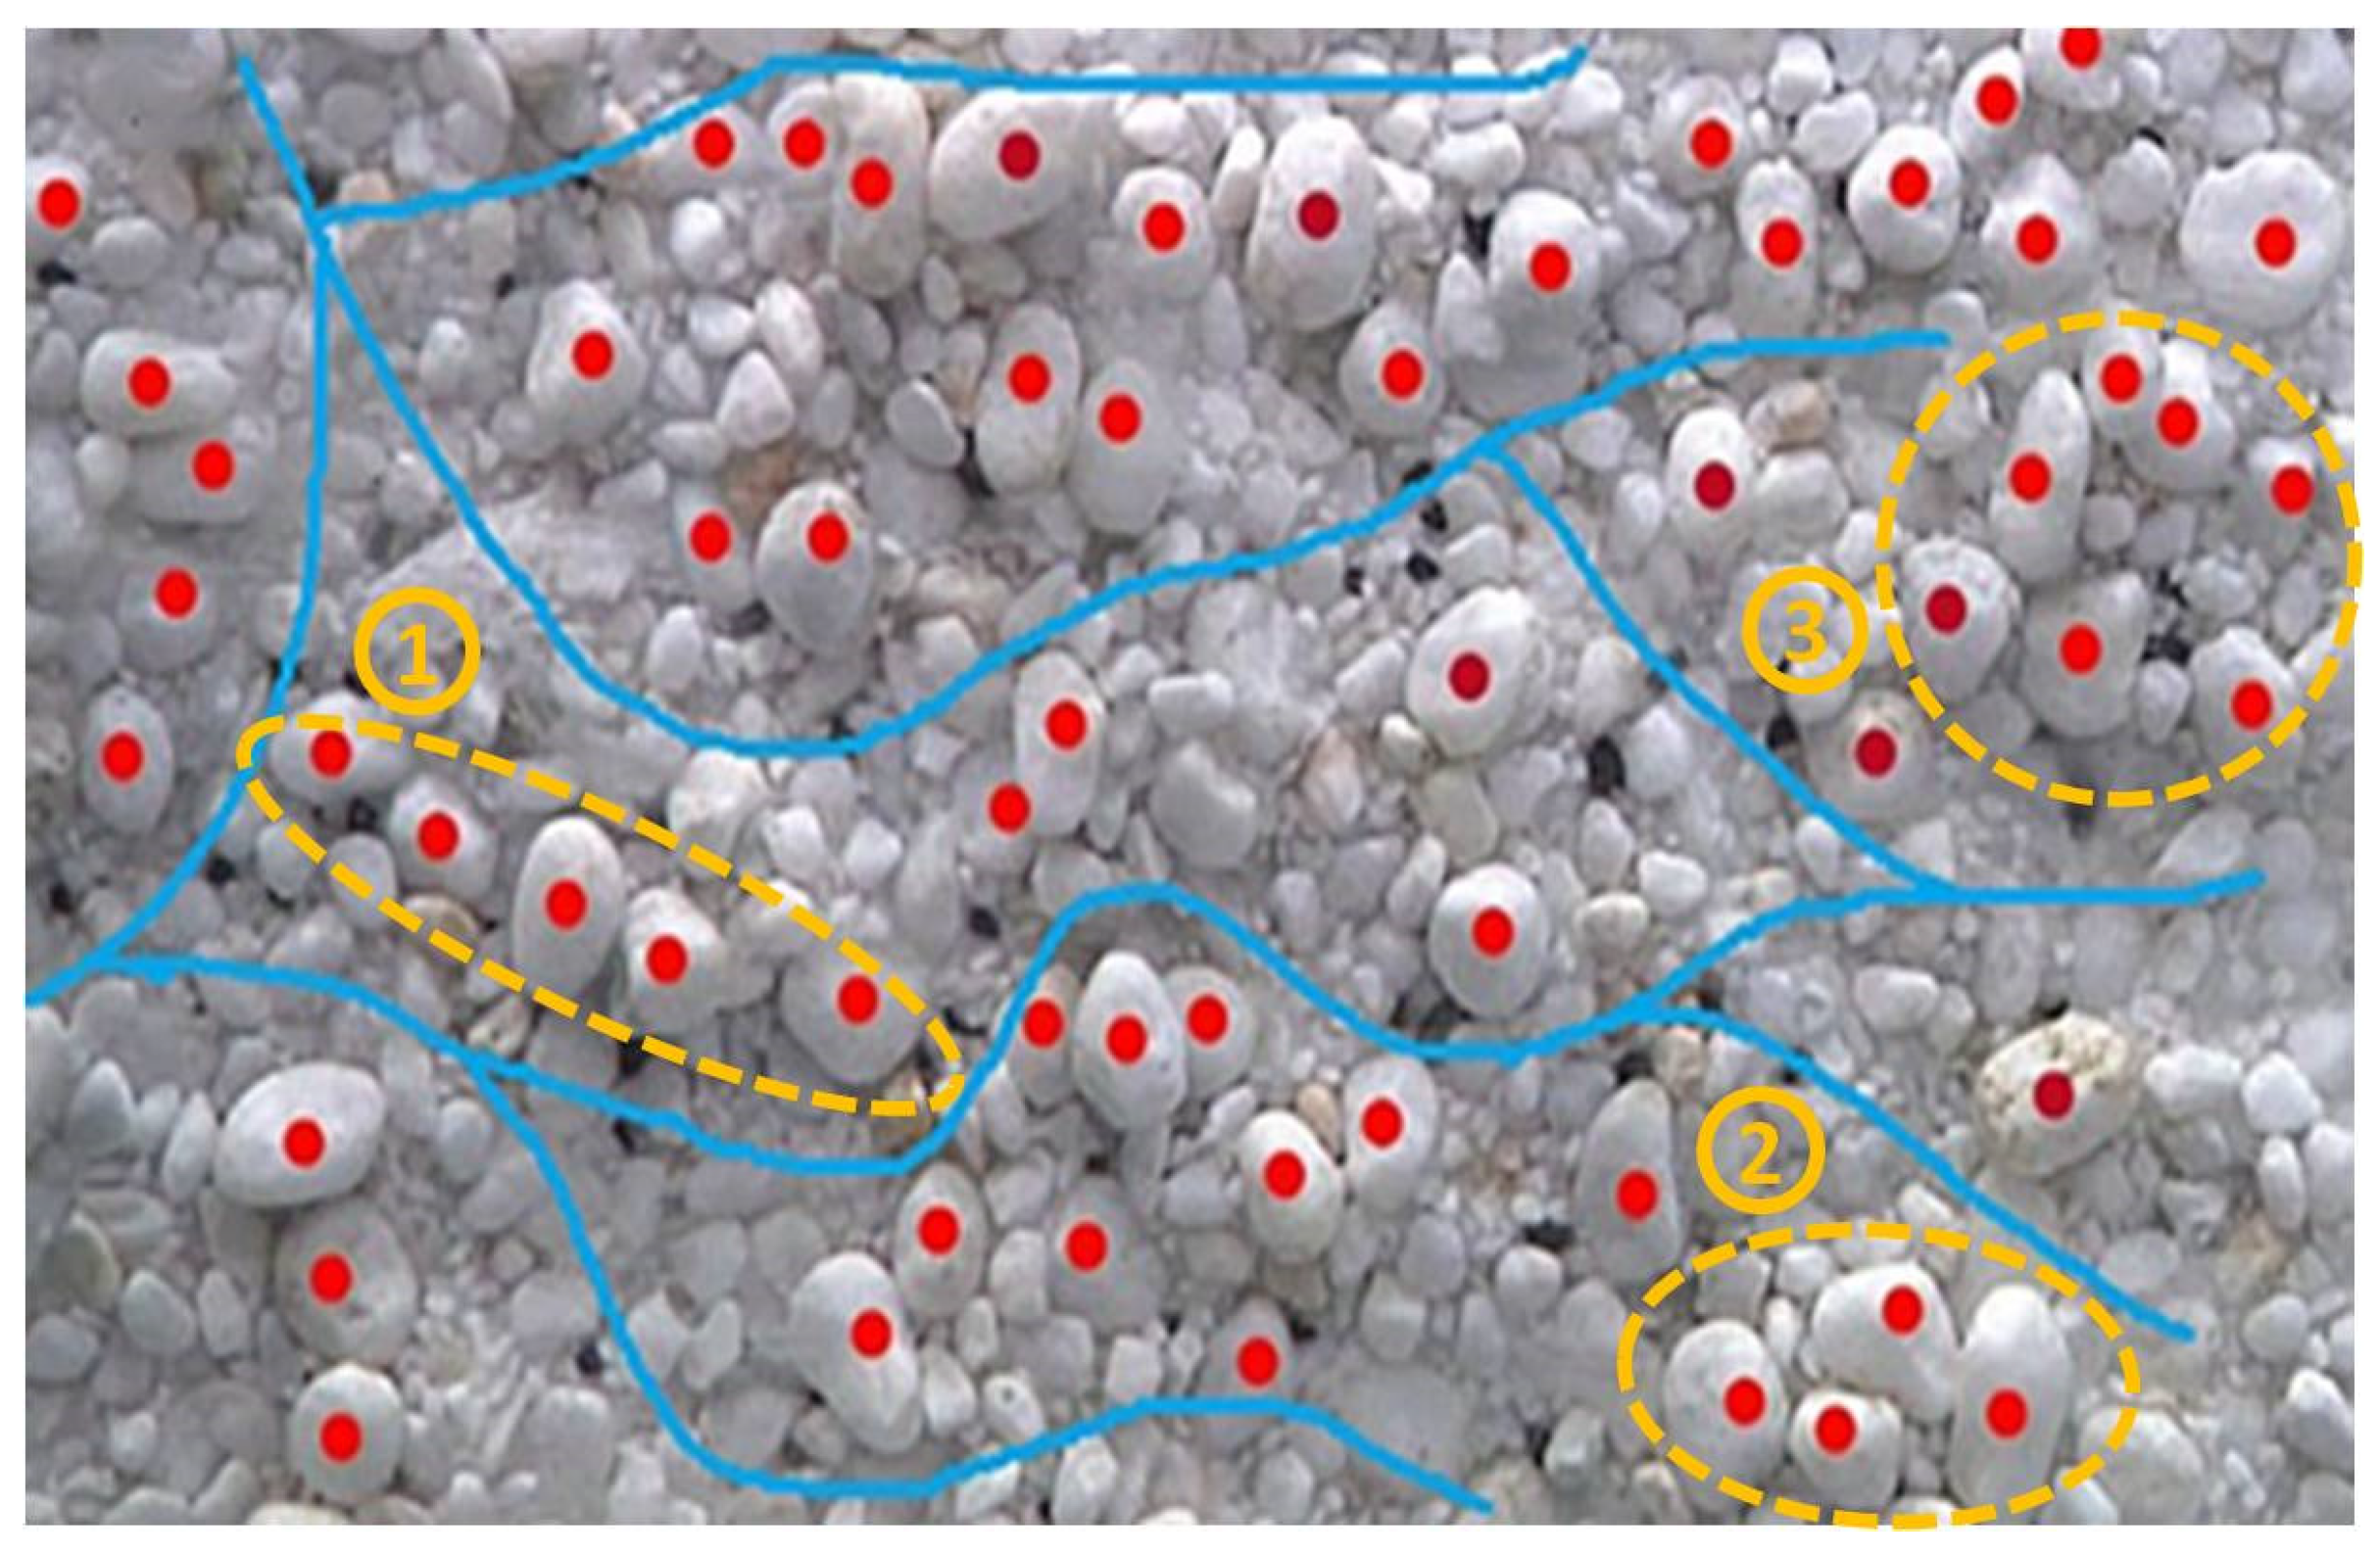
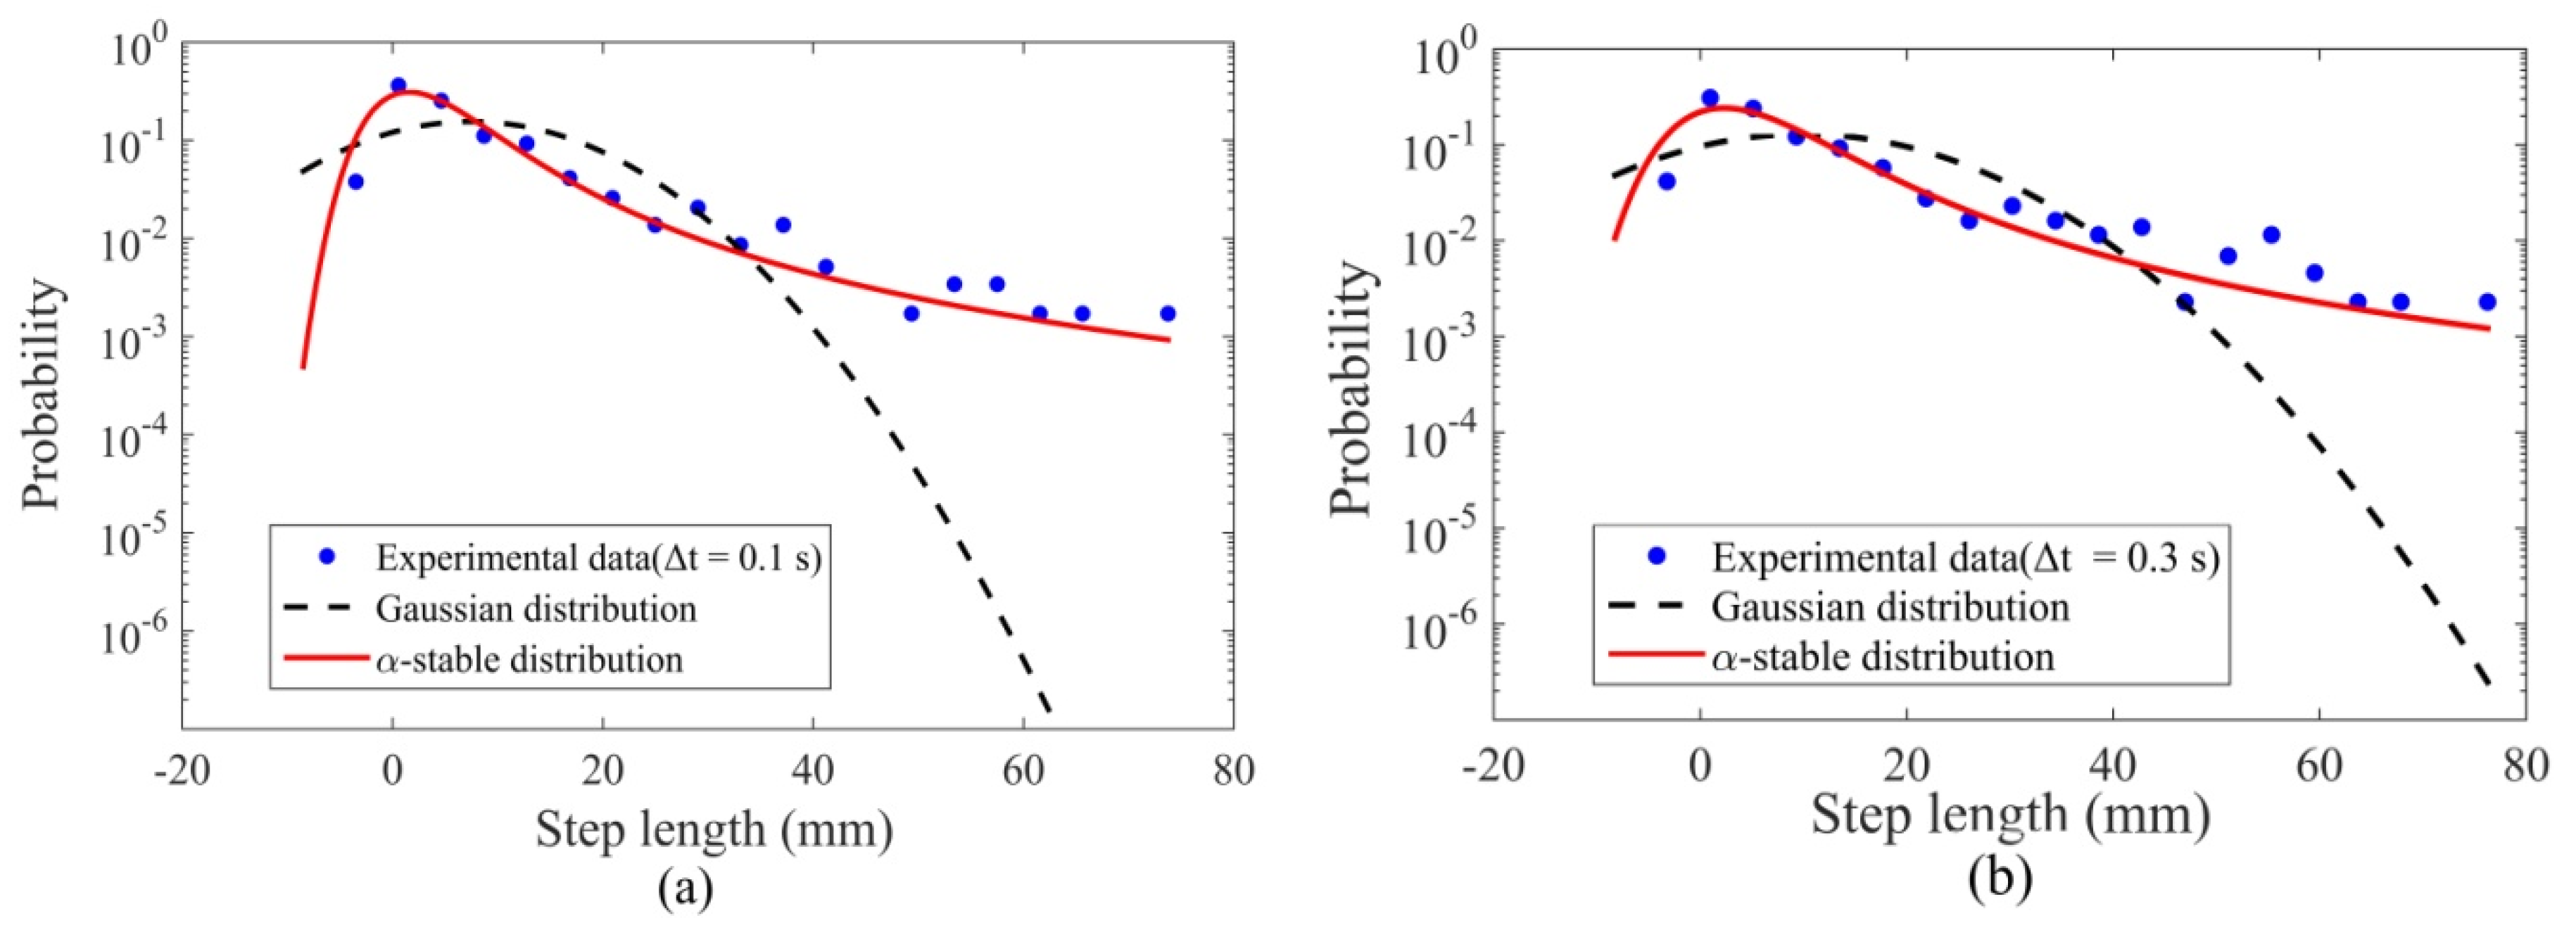
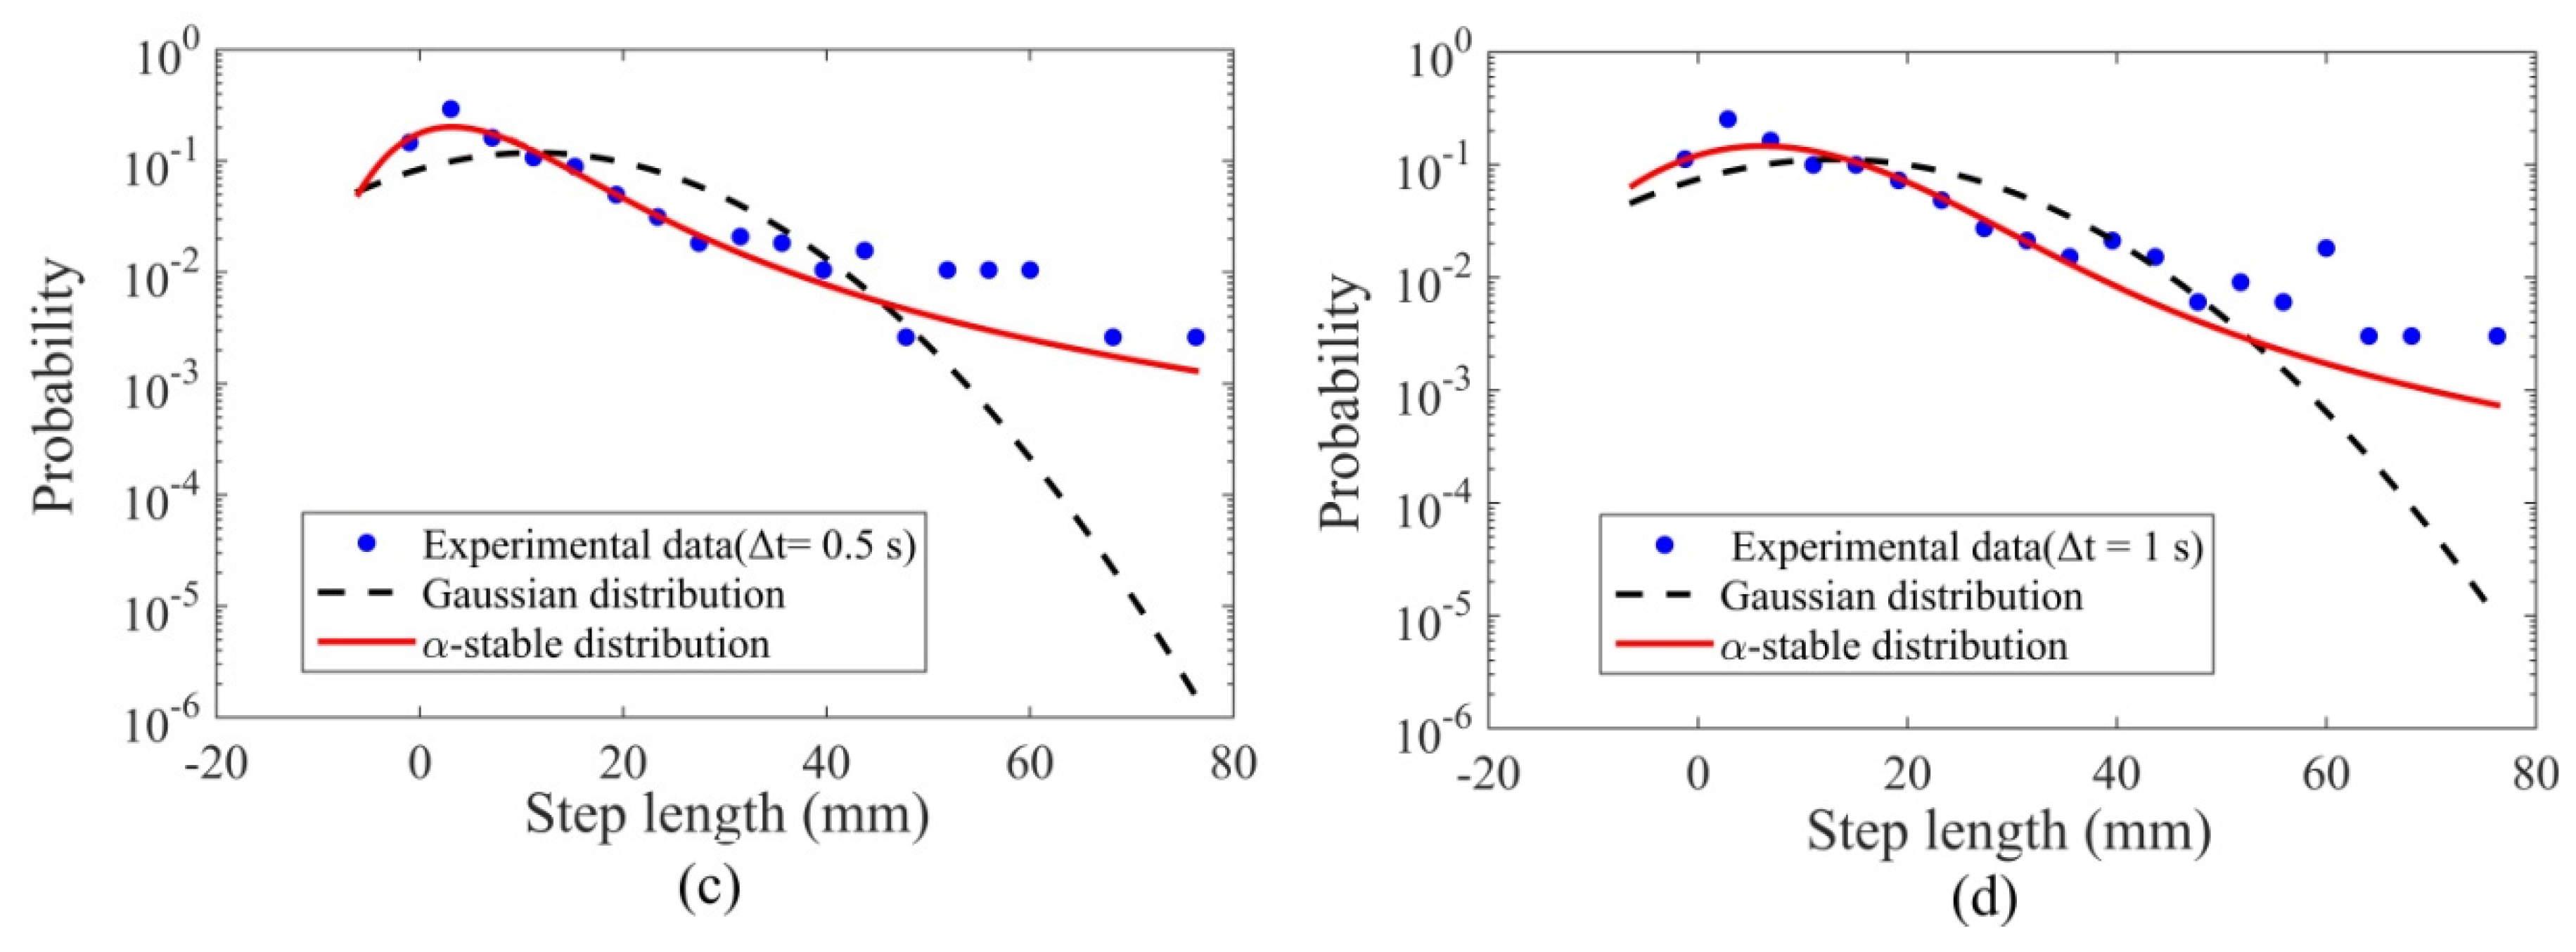
  • The particle number activity followed a negative binomial distribution, which is consistent with the theoretical solution derived in Ancey et al. [22] by accounting for the collective entrainment processes. The power-law tails in the probability distributions of both the streamwise and transverse particle velocities indicated a significant amount of fast-travelling particles, whereas the negative tail in the streamwise particle velocity distribution indicated a noticeable amount of grains occasionally moved in the upstream direction, which has rarely been considered in previous experiments. This may be explained by the particle clusters over dual impact on bed load transport exerted by the armored bed layers: some particles are accelerated in the preferential paths between particle clusters, while others were obstructed by the clusters to produce negative streamwise particle velocities. The distributions of the transverse particle velocity, the step length and the rest period all displayed heavy tails that were well described by the α-stable and M-L distributions. Nonetheless, the effect of the armored bed layer with cluster microforms on the distributions of these parameters needs to be confirmed with more experimental data.
  • The particle transport regime may be scale-dependent, i.e., the transport process may exhibit different diffusion regimes on different timescales. Meanwhile, the shapes of the distribution tails of the bed load motion parameters varied as observation time scale increases. We propose that the heavy tails in the distributions of the bed load motion parameters were associated with small time scales and may average out over longer observation periods. Nonetheless, the time scales associated with the transition of particle diffusion regimes and those with the changes in the statistical characteristics of bed load particle motions were different. Further investigation is needed in unraveling their connections.

Author Contributions

S.Z. and D.C. conceived the study; Z.Z. designed and performed the analysis and analyzed the data; Z.Z. and S.Z. wrote the paper, and D.C. contributed to the revision of the paper.

Funding

The research was funded by the National Key R&D Program of China (grant number 2017YFC0405203), the National Natural Science Foundation of China (grant number 51779242, 51579230), and Key Laboratory of Water Cycle and Related Land Surface Processes, Institute of Geographic Sciences and Natural Resources Research, Chinese Academy of Sciences (No. WL2018001). Dong Chen was also funded by the “Hundred Talents Program” of Chinese Academy of Sciences.

Conflicts of Interest

The authors declare no conflict of interest.

References

  1. Papanicolaou, A.N.; Strom, K.; Schuyler, A.; Talebbeydokhti, N. The role of sediment specific gravity and availability on cluster evolution. Earth Surf. Process. Landf. 2003, 28, 69–86. [Google Scholar] [CrossRef]
  2. Strom, K.; Papanicolaou, A.N.; Evangelopoulos, N.; Odeh, M. Microforms in Gravel Bed Rivers: Formation, Disintegration, and Effects on Bedload Transport. J. Hydraul. Eng. 2004, 130, 554–567. [Google Scholar] [CrossRef]
  3. Sun, H.; Chen, D.; Zhang, Y.; Chen, L. Understanding partial bed-load transport: Experiments and stochastic model analysis. J. Hydrol. 2015, 521, 196–204. [Google Scholar] [CrossRef]
  4. Strom, K.; Papanicolaou, A.N. Morphological characterization of cluster microforms. Sedimentology 2008, 55, 137–153. [Google Scholar] [CrossRef]
  5. Carrivick, J.L.; Jones, R.; Keevil, G. Experimental insights on geomorphological processes within dam break outburst floods. J. Hydrol. 2011, 408, 153–163. [Google Scholar] [CrossRef]
  6. Wu, W.; Wang, S.S.Y.; Jia, Y. Nonuniform sediment transport in alluvial rivers. J. Hydraul. Res. 2000, 38, 427–434. [Google Scholar] [CrossRef]
  7. Wilcock, P.R.; Crowe, J.C. Surface-based transport model for mixed-size sediment. J. Hydraul. Eng. 2003, 129, 120–128. [Google Scholar] [CrossRef]
  8. Barry, J.J. A general power equation for predicting bed load transport rates in gravel bed rivers. Water Resour. Res. 2004, 40, 2709–2710. [Google Scholar] [CrossRef]
  9. Ancey, C.; Böhm, T.; Jodeau, M.; Frey, P. Statistical description of sediment transport experiments. Phys. Rev. 2006, 74, 011302. [Google Scholar] [CrossRef]
  10. Lajeunesse, E.; Malverti, L.; Charru, F. Bed load transport in turbulent flow at the grain scale: Experiments and modeling. J. Geophys. Res. Earth Surf. 2010, 115, F04001. [Google Scholar] [CrossRef]
  11. Martin, R.L.; Jerolmack, D.J.; Schumer, R. The physical basis for anomalous diffusion in bed load transport. J. Geophys. Res. Earth Surf. 2012, 117, F01018. [Google Scholar] [CrossRef]
  12. Heyman, J.; Bohorquez, P.; Ancey, C. Entrainment, motion, and deposition of coarse particles transported by water over a sloping mobile bed. J. Geophys. Res. Earth Surf. 2016, 121, 1931–1952. [Google Scholar] [CrossRef] [Green Version]
  13. Roseberry, J.C.; Schmeeckle, M.W.; Furbish, D.J. A probabilistic description of the bed load sediment flux: 2. Particle activity and motions. J. Geophys. Res. Earth Surf. 2012, 117, F03032. [Google Scholar] [CrossRef]
  14. Fathel, S.L.; Furbish, D.J.; Schmeeckle, M.W. Experimental evidence of statistical ensemble behavior in bed load sediment transport. J. Geophys. Res. Earth Surf. 2015, 120, 2298–2317. [Google Scholar] [CrossRef] [Green Version]
  15. Fan, N.; Singh, A.; Guala, M.; Foufoula-Georgiou, E.; Wu, B. Exploring a semimechanistic episodic Langevin model for bed load transport: Emergence of normal and anomalous advection and diffusion regimes. Water Resour. Res. 2016, 52, 2789–2801. [Google Scholar] [CrossRef]
  16. Furbish, D.J.; Schmeeckle, M.W.; Schumer, R.; Fathel, S.L. Probability distributions of bed load particle velocities, accelerations, hop distances, and travel times informed by Jaynes’s principle of maximum entropy. J. Geophys. Res.Earth Surf. 2016, 121, 1373–1390. [Google Scholar] [CrossRef]
  17. Shim, J.; Duan, J.G. Experimental study of bed-load transport using particle motion tracking. Int. J. Sediment Res. 2017, 32, 73–81. [Google Scholar] [CrossRef]
  18. Lee, H.; Lin, Y.; You, J. On three-dimensional continuous saltating process of ediment particles near the channel bed. J. Hydraul. Res. 2006, 44, 374–389. [Google Scholar] [CrossRef]
  19. Furbish, D.J.; Schmeeckle, M.W. A probabilistic derivation of the exponential-like distribution of bed load particle velocities. Water Resour. Res. 2013, 49, 1537–1551. [Google Scholar] [CrossRef]
  20. Fan, N.N.; Zhong, D.Y.; Wu, B.S.; Foufoula-Georgiou, E.; Guala, M. A mechanistic-stochastic formulation of bed load particle motions: From individual particle forces to the Fokker-Planck equation under low transport rates. J. Geophys. Res. Earth Surf. 2014, 119, 464–482. [Google Scholar] [CrossRef] [Green Version]
  21. Houssais, M.; Lajeunesse, E. Bedload transport of a bimodal sediment bed. J. Geophys. Res. Earth Surf. 2012, 117, F04015. [Google Scholar] [CrossRef]
  22. Ancey, C.; Davison, A.C.; Bohm, T.; Jodeau, M.; Frey, P. Entrainment and motion of coarse particles in a shallow water stream down a steep slope. J. Fluid Mech. 2008, 595, 83–114. [Google Scholar] [CrossRef]
  23. Hubbell, D.W.; Sayre, W.W. Sand transport studies with radioactive tracers. J. Hydraul. Eng. Div. 1964, 90, 39–68. [Google Scholar]
  24. Schmidt, K.H.; Ergenzinger, P. Bedload Entrainment, Travel Lengths, Step Lengths, Rest Periods - Studied with Passive (Iron, Magnetic) and Active (Radio) Tracer Techniques. Earth Surf. Processes Landf. 1992, 17, 147–165. [Google Scholar] [CrossRef]
  25. Habersack, H.M. Radio-tracking gravel particles in a large braided river in New Zealand: A field test of the stochastic theory of bed load transport proposed by Einstein. Hydrol. Process. 2001, 15, 377–391. [Google Scholar] [CrossRef]
  26. Ganti, V.; Meerschaert, M.; Foufoula-Georgiou, E.; Viparelli, E.; Parker, G. Normal and anomalous dispersion of gravel tracers in rivers. J. Geophys. Res. Earth Surf. 2010, 115, 2156–2202. [Google Scholar] [CrossRef]
  27. McNamara, J.P.; Borden, C. Observations on the movement of coarse gravel using implanted motion-sensing radio transmitters. Hydrol. Process. 2004, 18, 1871–1884. [Google Scholar] [CrossRef]
  28. Voepel, H.; Schumer, R.; Hassan, M.A. Sediment residence time distributions: Theory and application from bed elevation measurements. J. Geophys. Res. Earth Surf. 2013, 118, 2557–2567. [Google Scholar] [CrossRef]
  29. Hill, K.M.; DellAngelo, L.; Meerschaert, M.M. Heavy-tailed travel distance in gravel bed transport: An exploratory enquiry. J. Geophys. Res. Earth Surf. 2010, 115, F00A14. [Google Scholar] [CrossRef]
  30. Wittenberg, L.; Newson, M.D. Particle clusters in gravel-bed rivers: An experimental morphological approach to bed material transport and stability concepts. Earth Surf. Process. Landf. 2005, 30, 1351–1368. [Google Scholar] [CrossRef]
  31. Billi, P. A note on cluster bedform behaviour in a gravel-bed river. Catena 1988, 15, 473–481. [Google Scholar] [CrossRef]
  32. Bouchaud, J.P.; Georges, A. Anomalous diffusion in disordered media: Statistical mechanisms, models and physical applications. Phys. Rep. 1990, 195, 127–293. [Google Scholar] [CrossRef]
  33. Blom, A.; Parker, G.; Ribberink, J.S.; De Vriend, H.J. Vertical sorting and the morphodynamics of bed-form-dominated rivers: An equilibrium sorting model. J. Geophys. Res. Earth Surf. 2006, 111, F01006. [Google Scholar] [CrossRef]
  34. Chien, N.; Wan, Z. Mechanics of Sediment Transport; ASCE Press: Reston, VA, USA, 1999. [Google Scholar]
  35. Schumer, R.; Meerschaert, M.M.; Baeumer, B. Fractional advection-dispersion equations for modeling transport at the Earth surface. J. Geophys. Res. Earth Surf. 2009, 114, F00A07. [Google Scholar] [CrossRef]
  36. Weeks, E.R.; Urbach, J.S.; Swinney, H.L. Anomalous diffusion in asymmetric random walks with a quasi-geostrophic flow example. Physica D 1996, 97, 291–310. [Google Scholar] [CrossRef]
  37. Pelosi, A.; Parker, G.; Schumer, R.; Ma, H.B. Exner-Based Master Equation for transport and dispersion of river pebble tracers: Derivation, asymptotic forms, and quantification of nonlocal vertical dispersion. J. Geophys. Res. Earth Surf. 2014, 119, 1818–1832. [Google Scholar] [CrossRef]
  38. Furbish, D.J.; Haff, P.K.; Roseberry, J.C.; Schmeeckle, M.W. A probabilistic description of the bed load sediment flux: 1. Theory. J. Geophys. Res. Earth Surf. 2012, 117, F03031. [Google Scholar] [CrossRef]
  39. Nikora, V.; Habersack, H.; Huber, T.; McEwan, I. On bed particle diffusion in gravel bed flows under weak bed load transport. Water Resour. Res. 2002, 38, 17-1–17-9. [Google Scholar] [CrossRef]
  40. Lin, F.; Bao, J. Environment-dependent continuous time random walk. Chin.Phys. B 2011, 20, 040502. [Google Scholar] [CrossRef]
  41. Ancey, C.; Heyman, J. A microstructural approach to bed load transport: mean behaviour and fluctuations of particle transport rates. J. Fluid Mech. 2014, 744, 129–168. [Google Scholar] [CrossRef] [Green Version]
  42. Bradley, D.N.; Tucker, G.E.; Benson, D.A. Fractional dispersion in a sand bed river. J. Geophys. Res. Earth Surf. 2010, 115, F00A09. [Google Scholar] [CrossRef]
  43. Huang, H.; Fiedler, H.; Wang, J. Limitation and improvement of PIV. Exp. Fluids 1993, 15, 168–174. [Google Scholar] [CrossRef]
  44. Gharahjeh, S.; Aydin, I. Application of video imagery techniques for low cost measurement of water surface velocity in open channels. Flow Meas. Instrum. 2016, 51, 79–94. [Google Scholar] [CrossRef]
  45. Fan, N.; Xie, Y.; Nie, R. Bed load transport for a mixture of particle sizes: Downstream sorting rather than anomalous diffusion. J. Hydrol. 2017, 553, 26–34. [Google Scholar] [CrossRef]
  46. Nakagawa, H. Sand bed instability due to bedload motion. J. Hydraul. Div. 1980, 106, 2029–2051. [Google Scholar]
  47. Malmon, D.V.; Dunne, T.; Reneau, S.L. Stochastic Theory of Particle Trajectories through Alluvial Valley Floors. J. Geol. 2003, 111, 525–542. [Google Scholar] [CrossRef] [Green Version]
  48. Brayshaw, A.C.; Frostick, L.E.; Reid, I. The hydrodynamics of particle clusters and sediment entrapment in coarse alluvial channels. Sedimentology 1983, 30, 137–143. [Google Scholar] [CrossRef]
  49. Singh, A.; Fienberg, K.; Jerolmack, D.J.; Marr, J.; Foufoula-Georgiou, E. Experimental evidence for statistical scaling and intermittency in sediment transport rates. J. Geophys. Res. Earth Surf. 2009, 114, F01025. [Google Scholar]
  50. Phillips, C.B.; Martin, R.L.; Jerolmack, D.J. Impulse framework for unsteady flows reveals superdiffusive bed load transport. Geophys. Res. Lett. 2013, 40, 1328–1333. [Google Scholar] [CrossRef] [Green Version]
  51. Bialik, R.J.; Karpiński, M. On the effect of the window size on the assessment of particle diffusion. J. Hydraul. Res. 2018, 56, 560–566. [Google Scholar] [CrossRef]
Figure 1. Schematic plot of the experimental flume (drawing not to scale). The flow was from right to left.
Water 11 02082 g001
Figure 2. Mean squared displacement (MSD) versus time for tracer bed load particles.
Water 11 02082 g002
Figure 3. (a) Discrete probability distribution of the particle number activity for the interval Δt = 1 s. The inset shows the same data with the fitted negative binomial and Poisson distributions on a semilog plot. (b) Exceeding probability of the particle number activity.
Water 11 02082 g003
Figure 4. (a) Discrete probability distribution of the streamwise particle velocity (Δt = 0.1 s) with theoretical lines that fit the data; the inset shows the same data on a semilog plot. (b) Exceedance probability of the particle streamwise velocity.
Water 11 02082 g004
Figure 5. (a) Discrete probability distribution of the transverse particle velocity (Δt = 0.1 s) with theoretical lines that fit the data; the inset shows the same data on a semilog plot. (b) Exceedance probability of the particle transverse velocity.
Water 11 02082 g005
Figure 6. (a) Discrete probability distribution of the particle step length (Δt = 0.1 s) with theoretical lines that fit the data; the inset shows the same data on a semilog plot. (b) Exceedance probability of the particle step length.
Water 11 02082 g006
Figure 7. (a) Discrete probability distribution of the particle rest period (Δt = 0.1 s) with theoretical lines that fit the data; the inset shows the same data on a semilog plot. (b) Exceedance probability of the particle rest period.
Water 11 02082 g007
Figure 8. Bed surface profile of armored bed with clusters and “flow-accelerating belts”. Red points represent the visible largest particles of dm = 17 mm (three typical shapes of clusters bounded by dotted yellow circles, and labeled by ①line, ②heap, ③ring, respectively), and the blue lines are drawn along flow belts (water flows from left to right).
Water 11 02082 g008
Figure 9. Changes in the probability density function (PDF) of the particle step length for observation intervals of Δt = 0.1 s (a), 0.3 s (b), 0.5 s (c) and 1 s (d) on semilog plots with theoretical lines representing Gaussian and α-stable distributions.
Water 11 02082 g009aWater 11 02082 g009b
Table 1. Particle size distribution of the experimental sand/gravel mixture.
Size GroupMedian Size
(mm)
Size Range
(mm)
Weight Fraction
(%)
10.450.25–0.810
21.00.6–1.2515
33.01.0–5.025
47.05.0–10.025
517.015.0–20.025
Table 2. The hydraulic parameters of the experiments.
Q (L/s)H (cm)FrReΘU* (m/s)
13016.10.649.8 × 1040.130.08
Q = discharge; H = mean flow depth; Fr = Froude number; Re = Reynolds number; Θ = Shields parameter; U* = shear velocity.

