Abstract
The conservation agriculture production system (CAPS) approach with drip irrigation has proven to have the potential to improve water management and food production in Ethiopia. A method of scaling-up crop yield under CAPS with drip irrigation is developed by integrating a biophysical model: APEX (agricultural policy environmental eXtender), and a Geographic Information System (GIS)-based multi-criteria evaluation (MCE) technique. Topography, land use, proximity to road networks, and population density were considered in identifying potentially irrigable land. Weather and soil texture data were used to delineate unique climate zones with similar soil properties for crop yield simulation using well-calibrated crop model parameters. Crops water demand for the cropping periods was used to determine groundwater potential for irrigation. The calibrated APEX crop model was then used to predict crop yield across the different climatic and soil zones. The MCE technique identified about 18.7 Mha of land (16.7% of the total landmass) as irrigable land in Ethiopia. Oromia has the highest irrigable land in the nation (35.4% of the irrigable land) when compared to other regional states. Groundwater could supply a significant amount of the irrigable land for dry season production under CAPS with drip irrigation for the various vegetables tested at the experimental sites with about 2.3 Mha, 3.5 Mha, 1.6 Mha, and 1.4 Mha of the irrigable land available to produce garlic, onion, cabbage, and tomato, respectively. When comparing regional states, Oromia had the highest groundwater potential (40.9% of total potential) followed by Amhara (20%) and Southern Nations, Nationalities, and Peoples (16%). CAPS with drip irrigation significantly increased groundwater potential for irrigation when compared to CTPS (conventional tillage production system) with traditional irrigation practice (i.e., 0.6 Mha under CTPS versus 2.2 Mha under CAPS on average). Similarly, CAPS with drip irrigation depicted significant improvement in crop productivity when compared to CTPS. APEX simulation of the average fresh vegetable yield on the irrigable land under CAPS with drip irrigation ranged from 1.8–2.8 t/ha, 1.4–2.2 t/ha, 5.5–15.7 t/ha, and 8.3–12.9 t/ha for garlic, onion, tomato, and cabbage, respectively. CAPS with drip irrigation technology could improve groundwater potential for irrigation up to five folds and intensify crop productivity by up to three to four folds across the nation.
1. Introduction
Crop production in Ethiopia is constrained with several challenges that cause low productivity and economic growth in the region. Soil degradation in the form of soil erosion and decline of soil fertility is the major constraint for crop production [1]. The alarming rise in population caused the exploitation of the rainforest and grasslands in the region to increase cultivated lands, which resulted in soil degradation and deterioration of the environment [2,3,4]. Crop production in the nation is mainly a rainfed system using traditional farming practices [2]. The expansion of cultivated land at the expense of forest, bushes, and grassland is not a feasible option to sustain crop production let alone increased productivity. Instead, with the current poor soil and water management practices, it contributes to lower production efficiency [3].
On the other hand, rainfall variability is a great concern for a rainfed agricultural system in Ethiopia [5]. Customized local strategies are needed to maximize food supply and enhance the ecosystem at the same time. One such strategy is to enable dry season production to address the adverse effects of rainfall variability. The conservation agriculture production system (CAPS), which promotes no-till, mulching, and diverse cropping, has been shown to provide higher water use efficiency in addition to improving soil fertility [6,7,8,9]. Similarly, adoption efficient water application technologies can increase water use efficiency [10]. In relation to irrigation technology, drip irrigation is considered the most efficient water application technology [11,12]. CAPS combined with drip irrigation constitutes efficient soil and water management technology, which helps to maximize the potential of water resources and consequently increase productivity in the region [8]. Another concern is the lack of knowledge of potential to expand irrigated agriculture and maximize production. Worqlul et al., [3] indicated that less than 5% of the potentially irrigable lands are currently under irrigation.
While the positive impacts of CAPS with drip irrigation have been identified, expanding the impact to a large-scale adaptation on a country level and linking it with water resources availability would provide substantial and very useful information to policymakers in a decision-making process to improve the agriculture systems in the nation. Assessments of potentially irrigable land, corresponding crop productivity, and availability of water resources are essential components for the scale-up of CAPS with drip irrigation technology. There are few quantitative studies [3], that provided country-level irrigation potential assessment under the conventional tillage production system (CTPS) with traditional irrigation practice. However, no literature was found for a large-scale adaptation of CAPS with drip irrigation. This study attempts to examine the country-level adaptation of CAPS with drip irrigation technology for its impact on groundwater potential and crop productivity based on experimental results presented in Assefa et al. [8]. The specific objectives were to (1) assess potentially irrigable land using the multi-criteria evaluation (MCE) technique, (2) scale-up crop yields by integrating the MCE technique and a biophysical model field-scale prediction, and (3) asses groundwater irrigation potential for dry season production. The analyses were made for garlic, onion, tomato, and cabbage which are commonly grown vegetables in Ethiopia [13].
2. Materials and Methods
2.1. Study Area
This study was conducted in Ethiopia, the second-largest populated country in the entire continent of Africa, next to Nigeria (Figure 1). The landmass of the country is approximately 110 million ha, and elevation ranges from 160 m to 4530 m above mean sea level [3]. Climate variability (as it pertains to variability in rainfall and temperature) was observed to be very high in Ethiopia (i.e., 15% to 50% coefficient of variation for rainfall and 1.6°C annual average rise) based on the long-term (1955–2015) evaluation of climate data. This poses major risks to rainfed crop production [14,15] which is the dominant agriculture practice in Ethiopia [16]. The southwestern portion of the country receives about 2400 mm of rainfall, whereas northeastern and southeastern lowland receives less than 500 mm per year [17]. There are three seasons in the year locally known as Kiremt (main rainfall season), Belg (small rainfall season), and Bega (dry season) [18].
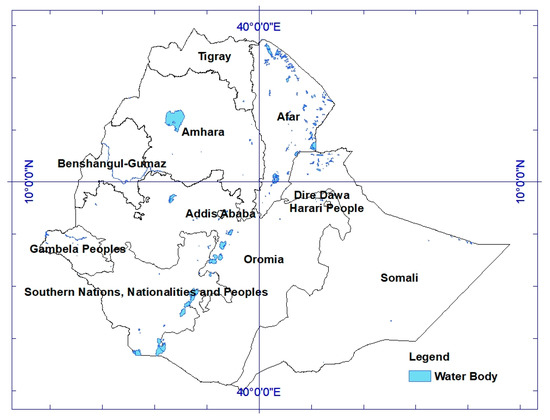
Figure 1.
Ethiopia and its administrative regions with water bodies.
2.2. Scale-Up of Field-Scale Parameters
The MCE technique and agricultural policy environmental eXtender (APEX) model was used to scale-up the field-scale CAPS with drip irrigation (Figure 2). MCE was used to identify potentially irrigable lands in the country based on various factors that affect irrigated agriculture. MCE is an emerging approach that involves combining multiple variables to produce a single evaluation index for an intended purpose [2,19,20,21,22,23,24,25,26]. The MCE technique has been used for various applications including crop agriculture, water resource management, and other environmental studies [2,3,26,27,28,29,30,31,32,33].
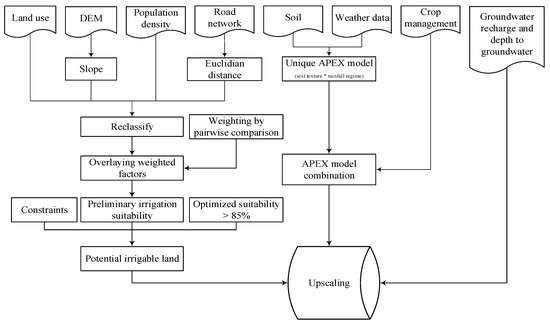
Figure 2.
Method of scaling-up crop production under conservation agriculture production system (CAPS) with drip irrigation technology.
A range of variables (Figure 2) were considered in this study to identify potentially irrigable land in the country. These factors include topography (slope), land use/cover, proximity to road networks, and population density. Topography affects the choice of irrigable land as it affects irrigation practices [3]. Digital elevation model (DEM) data with 30 m resolution, was used to derive the landscape slope for the entire nation. Land use/cover data also provide a vital figure in the selection of economically productive lands for irrigated agriculture. Similarly, population density and proximity to road networks were used to account market accessibility to support irrigated agriculture. Euclidean distance was calculated to establish the proximity criteria to road networks. Factors were reclassified into various suitability classes depending on the Food and Agricultural Organization [34] guidelines: Highly suitable (S1), moderately suitable (S2), marginally suitable (S3), currently unsuitable (S4), and permanently unsuitable or constraint (N1). The equal interval ranging technique was used to reclassify population density and proximity to road networks based on Worqlul et al., [3]. The pairwise method was used to compare each factor one-to-one and weights were scaled using works of Saaty [35] and Worqlul et al., [3]. The pairwise method is a relatively unbiased ranking technique [2,27] and applied to weigh each factor considered in this analysis. The pairwise technique, Saaty [35], makes use of a scale broken down from 1 to 9 indicating the equal and absolute importance of a factor when compared to a one-to-one basis, respectively. Consistency ratio was used to check the consistency of the pairwise matrix using Equation (1) described in Saaty [36]. The equal interval ranging technique was used to distribute the weight of each factor into the suitability classes. Factors were then combined using “weighted sum overlay” to produce a single evaluation index (0% to 100%) map, and constraints (permanently unsuitable lands) were excluded from the analysis. Combined weights of greater than 85% were considered to be potentially irrigable lands [2,3].
where CR = consistency ratio, CI = consistency index, and RI = consistency index of randomly generated matrix.
CR = CI/RI,
Soil and climate data were used to define unique areas for biophysical model development. Spatial variability of parameters and the effect of scaling needs to be carefully considered while upscaling modeling results [37,38,39]. Table 1 shows the type and source of data used to scale-up field-scale crop production to the national level. The mean annual rainfall point data from observed ground weather stations were used to compute spatial annual rainfall and classify the nation into different rainfall regimes. Similarly, soil texture data was used to classify the nation into various soil classes. Climate regimes and soil texture data were combined using the intersection of the ArcGIS overlay function to identify geographical equivalence zones of similar climate and soil (i.e., 39 zones) where each zone has the same soil texture and rainfall regimes. The APEX [40], a biophysical model, was set up on the unique climate and soil combinations to simulate crop yield. Weather data (rainfall, maximum and minimum temperature, wind speed, relative humidity, and solar radiation), soil characteristics, as well as vegetation and management practices are the main inputs to the APEX model [41]. The model is capable of evaluating the effects of soil and water conservation practices on hydrology, crop yield, and other environmental variables such as sediment, nutrient load, and soil organic carbon [42,43,44]. Proper calibration and validation of model parameters are essential steps for reliable predictions [45]. The APEX model was calibrated and validated for a few sites in Ethiopia using adequate field data from 13 experimental plots. The calibration results (i.e., model performances) are presented in Table 5 and Table 9 of Assefa et al., [9] for hydrology and crop yield, respectively. Based on efficiency measures suggested in Moriasi et al., [46] and Wang et al. [47], the model performance was found within the range of acceptable to very good. Satisfactory model performance during calibration and validation provides greater confidence in the modeling results when evaluating various plausible scenarios for modeling prediction. The present study was built on the same model for its application in up-scaling the impact. Input data were changed based on the unique climate-soil combinations across Ethiopia, but the same model parameters were used which was established during the calibration. Heat unit scheduling (OPV7 = 1) was used with shortening cropping period compared to the experimental plots to capture crop growth variability across the unique regions.

Table 1.
Data and sources for upscaling crop production to the county level.
Irrigation requirement of crops is mainly a function of reference evapotranspiration and rainfall, which are variable in space and time. Therefore, variable irrigation water volumes were applied in the model for each climate zone depending on the type of vegetables grown and weather conditions. The net irrigation requirement (NIR) for each of the vegetables was calculated depending on reference evapotranspiration (ETo), crop coefficients of each vegetable at mid-stage (Kc), irrigation application inefficiency, and effective rainfall amount (ER). Crop coefficients at the mid-stage of crop growth (Kc-mid) were obtained from Allen et al., [48] of the Food and Agricultural Organization (FAO) for various vegetables. The net irrigation requirement equation derived by Worqlul et al., [3] for the country using conventional irrigation inefficacy in Equation (2) was modified in this study (Equation (3)) to account for drip irrigation inefficiency. Howell [49] indicated that 95% efficiency can be attainable whereas 90% is the average efficiency for drip irrigation. Thus, 10% application inefficiency was considered for irrigation and some minor losses such as leaching [50]. Assefa et al. [8] showed that significant (p ≤ 0.05) reduction of irrigation volume was observed in the conservation of agriculture (CA) experimental sites when compared to conventional tillage (CT) practice. Therefore, Equation (3) was further modified using linear coefficient (Cf) to account for the reduction of irrigation volume in CA practice by comparing the irrigation data from the experimental sites for CA and CT managements (Equation (4)) (net irrigation requirement for conservation practice, NIRc). The contribution of rainfall to soil moisture, effective rainfall (ER), in the growing season of vegetables was estimated using the United States Department of Agriculture Soil Conservation Service (USDA-SCS) method [51], which is a function of precipitation (P), see Equation (5a) and Equation (5b).
where NIR, NIRc, Cf, Kc, ETo, P, and ER are the net irrigation requirement for the tilled system, net irrigation requirement for conservation agriculture, the coefficient of conservation agriculture, crop coefficient, reference evapotranspiration, precipitation, and effective rainfall, respectively.
Soil properties, weather data, net irrigation requirements, and cropping details were supplied to the well-calibrated APEX model in each unique zone. Then, crop yield simulation was integrated with the irrigable land to limit crop yield estimation only on the potentially irrigable land. Groundwater source of irrigation with a depth less than 30 m from the surface was considered in this study. The potential borehole yields and the potential numbers of wells that could be installed were used to estimate groundwater availability in the regions. Maintaining a one-kilometer clear distance between wells (i.e., the radius of influence) is suggested by Howsam and Carter [52] to estimate the potential numbers of wells that could be installed. Maintaining the radius of influence helps to avoid the groundwater drawdown effect of one well on another. The net irrigation requirement for CA practice, groundwater availability, and depth to groundwater were considered to determine the potential of groundwater wells in unique zones. Vegetable yields on the irrigable land were further constrained based on groundwater availability to identify the potential scale-up areas for CAPS with drip irrigation technology.
3. Results and Discussion
The results of scaling-up crop yield under CAPS with drip irrigation technology to country-level were presented into three categories: (1) Assessment of potentially irrigable land in the country using the MCE technique, (2) simulation of potential crop production under CAPS with drip irrigation using a well-calibrated APEX model, and (3) assessment of groundwater potential for dry season crop production.
3.1. Potentially Irrigable Land
Four basic factors (topography, land use, proximity to road networks, and population density) were considered in the MCE technique to identify potentially irrigable land in the nation. Topography in the nation ranges from 0% (flat land) to greater than 100% (steepest land which is about 0.07% of the landmass) (Figure 3a). The slope was reclassified into five categories based on Worqlul et al., [27]: Highly suitable (0%–2%), moderately suitable (2%–8%), marginally suitable (8%–12%), less suitable (12%–30%), and unsuitable (above 30%). The various land use classes in the nation (Figure 3b) were reclassified into four suitability classes based on Assefa et al. [2], Worqlul et al., [3], and FAO [53]: Highly suitable (agricultural land), moderately suitable (grassland), marginally suitable class (shrubs, bare land), and unsuitable class (forest, urban lands, wetlands, and water). Population density ranges from 0 to 69,350 persons per square kilometer (Figure 3c), whereas proximity to road network ranges from 0 to 118 km (Figure 3d).
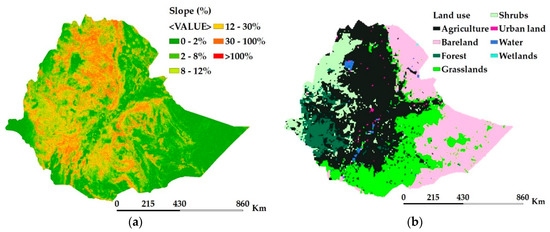
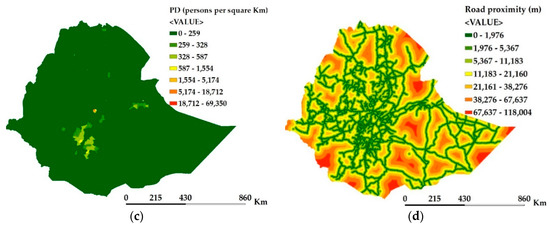
Figure 3.
Irrigation suitability factors map: (a) Topography in terms of landscape slope, (b) land use, (c) population density (PD), and (d) distance to road networks.
The Eigenvector was computed as the nth root of individual factors’ weight and then normalized with the cumulative Eigenvector to derive the final weights of factors (Table 2). Topography was found to be relatively the most influential factor in irrigated agriculture, which was consistent with Worqlul et al.,’s [3] result. Proximity to road networks and land use were found to be the second and third most influential factors in determining potentially irrigable land in the nation. The consistency ratio was found to be trustworthy (CR = 0.03 ≤ 0.2) based on Chen et al., [54] and Koczkodaj et al., [55]. The final weights of factors were distributed to the various suitability classes and factors were combined using a weighted sum overlay. An 85% threshold was used to obtain potentially irrigable land (Figure 4). About 18.7 Mha of land, 16.7% of the total landmass, was found to be potentially irrigable in the nation without considering soil and weather. The suitability ranges in Figure 4 cover different portions of the irrigable land: 85%–88% (76% of the irrigable land), 88%–91% (11% of the irrigable land), 91%–94% (1.5 of the irrigable land), 94%–97% (11.5% of the irrigable land), and 97%–100% (0.4% of the irrigable land).
Table 2.
Pairwise matrix for calculation of the weight of factors.
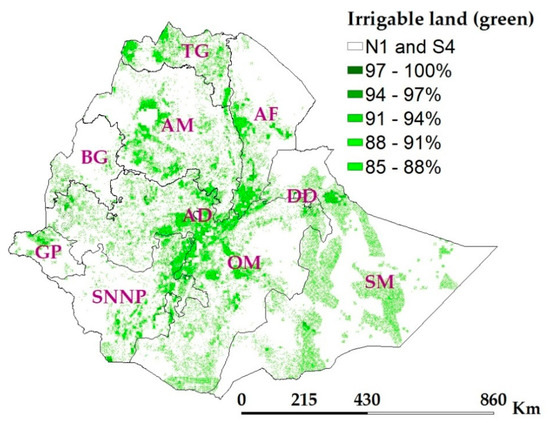
Figure 4.
Potentially irrigable land (all green, weight ≥ 85); S4 (currently unsuitable areas)- weight < 85%; N1—constraint (permanently unsuitable areas); abbreviations in the map are administrative regions (TG—Tigray, AM—Amhara, AF—Afar, BG—Benshangul Gumaz, AD—Addis Ababa, DD—Dire Dawa, GP—Gambela Peoples, SNNP—Southern Nations, Nationalities and Peoples, and SM—Somali).
Irrigation demand of each vegetable was computed by considering the conservation agriculture principles, drip irrigation technology, water use of different vegetables, and weather conditions. Oromia regional state has the highest irrigable land (35.4%) when compared with other states. Figure 5 illustrates the degree of irrigation suitability (i.e., marginal, satisfactory, medium, high, and very high) for potentially irrigable lands: 18.7 Mha, 4.5 Mha, 2.5 Mha, 2.2 Mha, and 0.082 Mha at 85%, 88%, 91%, 94%, and 97% suitability classes, respectively.
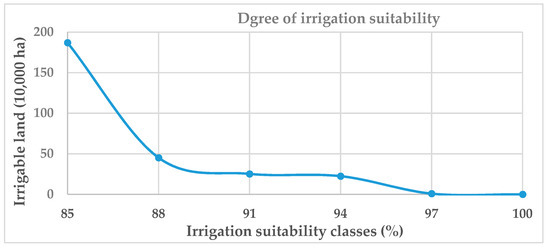
Figure 5.
Degree of irrigation suitability for the potentially irrigable land.
3.2. Potential Crop Production under Conservation Agriculture
Figure 6a shows the various soil texture classes in the nation. The mean annual rainfall was computed spatially using inverse distance weighting interpolation from weather stations point data (Figure 6b), and the spatial rainfall was reclassified using natural breaks into eight rainfall zones (Figure 6c). Soil textures and rainfall zones were combined, which resulted in 39 unique regions for further analyses of crop yields. The APEX model was developed for each of 39 unique zones, which was defined using the soil texture classes and climate zones. Results were then aggregated as per administrative boundaries of Ethiopia (11 regional states) to provide input for decisionmakers in developing policy and implementation strategies for water resource and agriculture-related projects.
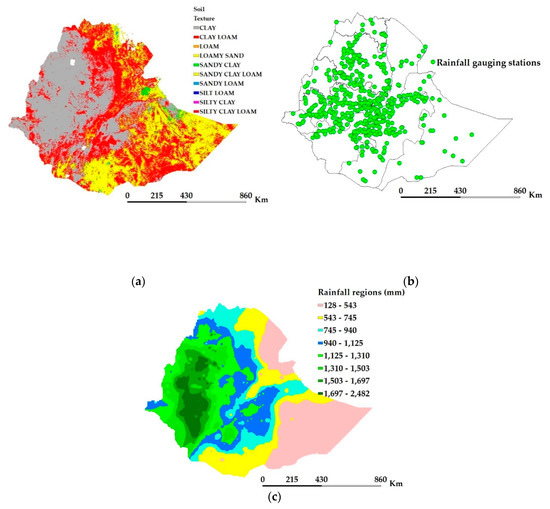
Figure 6.
Soil textures (a), locations of rainfall gauging stations (b), and rainfall regions regimes (c).
Crop coefficients at the mid-stage of crop growth (Kc-mid) were obtained from Allen et al., [48] of the Food and Agricultural Organization (FAO) for various vegetables. These data indicate that more irrigation is needed for tomato during the mid-stage of growth followed by cabbage when compared to garlic and onion. Moderate resolution image spectrum (MODIS) potential evapotranspiration data (2000–2010) was used to estimate the net irrigation demand in the region during the dry season. The growing period used for garlic, onion, and cabbage was December through February whereas December through March was the growing season for tomato.
This study used these water use data for the various vegetables under CA and CT practices from Assefa et al., [8] and developed a linear irrigation coefficient, Cf, for each vegetable to account for irrigation volume reduction under CA during the calculation for the irrigation requirement. The value of Cf obtained from CA and CT comparison was 0.58, 0.54, 0.80, and 0.81 for garlic, onion, tomato, and cabbage, respectively. These coefficients explain the advantage of conservation practices over conventional tillage systems for irrigation water savings mainly due to mulch cover and no-till practice in CAPS plots minimized water loss through evaporation and runoff. Additionally, the water-saving in garlic and onions was higher when compared with cabbage and tomato. This could be due to the less leaf area of garlic and onion, which made the impact of CAPS significant in reducing water loss when compared with tomato and cabbage.
Net irrigation demand was computed for each vegetable over the irrigable land considering drip irrigation efficiency, crop coefficient, effective rainfall during the growing period, and irrigation coefficient. These data along with other inputs such as soils, weather data, cropping details, irrigation application rate, and crop water demand were supplied to the calibrated APEX model to estimate crop yield. Crop yield results were averaged for the simulation period (2000–2010) and limited to potentially irrigable land in the nation. The average fresh vegetable yield under CAPS ranged from 1.8–2.8 t ha−1 for garlic (Figure 7a), 1.4–2.2 t ha−1 for onions (Figure 7b), 5.5–15.7 t ha−1 for tomato (Figure 7c), and 8.3–12.9 t ha−1 for cabbage (Figure 7d). Crop productivity was found to be higher in Oromia and Amhara regions due to the combined effects of the weather and soil condition. The variation of yields for tomato was found relatively high when compared to other vegetables, possibly due to weather variations and the fact that tomato is more sensitive to cold weather. The maximum and minimum allowable temperature for tomato is 27°C and 10°C, respectively, for optimal crop growth.
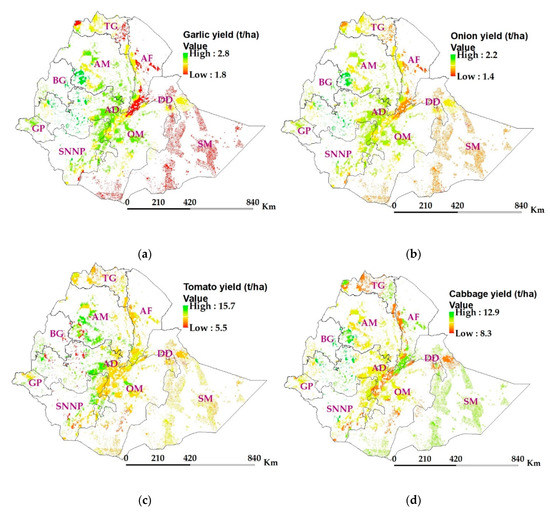
Figure 7.
Potential crop yields over the irrigable lands (a) garlic, (b) onion, (c) tomato, and (d) cabbage. Abbreviations in the map are administrative regions (TG—Tigray, AM—Amhara, AF—Afar, BG—Benshangul Gumaz, AD—Addis Ababa, DD—Dire Dawa, GP—Gambela Peoples, SNNP—Southern Nations, Nationalities and Peoples, and SM—Somali).
3.3. Groundwater Potential for Crop Production under CAPS with Drip Irrigation
Groundwater depth of less than 30 m is considered feasible for irrigation in the nation Gebregziabher [56]. Thus, depth to groundwater less than 30 m were considered in this study for the estimation of groundwater potential. Worqlul et al., [3] validated the British Geological Survey (BGS) groundwater borehole yield estimates in the central part of Ethiopia using actual groundwater recharge data from the Agricultural Transformation Agency (ATA). The net irrigation requirements for crops were deducted from groundwater potential to identify areas where groundwater fully supports to produce vegetables during the dry season. Figure 8 depicts areas where groundwater potential can support to produce garlic, onion, tomato, and cabbage, respectively.
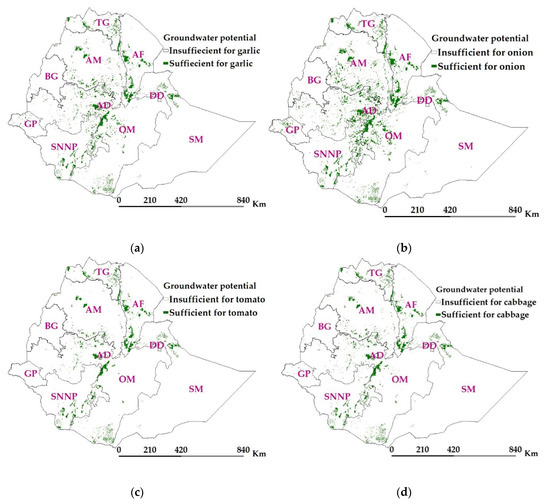
Figure 8.
Crop yields over the irrigable lands (a) garlic, (b) onion, (c) tomato, and (d) cabbage. Abbreviations in the map are administrative regions (TG—Tigray, AM—Amhara, AF—Afar, BG—Benshangul Gumaz, AD—Addis Ababa, DD—Dire Dawa, GP—Gambela Peoples, SNNP—Southern Nations, Nationalities and Peoples, and SM—Somali).
Table 3 presents the potential of groundwater for different vegetables as a percentage of potentially irrigable land over the administrative regions. For instance, considering the Oromia region, groundwater is enough to irrigate 0.95 Mha, 1.5 Mha, 0.6 Mha, or 0.5 Mha if planting garlic, onion, tomato, or cabbage, respectively, from the potentially irrigable land (6.6 Mha) if planting garlic or onion. That means, 8.9% to 14.3% of the potential land in Oromia could be irrigated depending on the type of crop using groundwater if CAPS with drip irrigation is used. Similarly, 8.8% to 30% of the potential land in Amhara and 11.6% to 29.8% of the potential land in Southern Nations, Nationalities and Peoples (SNNP) could be irrigated using groundwater. Oromia has the highest groundwater potential (40.9% of total potential) followed by Amhara (20% of total potential), and SNNP (16%). At country level (aggregated from administrative regions), groundwater potential was found to support about 2.3 Mha (Figure 8a), 3.5 Mha (Figure 8b), 1.6 Mha (Figure 8c), and 1.4 Mha (Figure 8d) of land to produce garlic, onion, cabbage, and tomato, respectively in the dry season. Onion has relatively the least irrigation demand and thus has the highest production area coverage using groundwater, followed by garlic, whereas tomato and cabbage have relatively high irrigation demands and thus less area coverage for production using groundwater source.
Table 3.
Irrigable land and potential of groundwater for various vegetables.
4. Conclusions
This study is the first of its kind in providing insight into the impacts of the large-scale adaptation of CAPS with drip irrigation on groundwater potential and crop productivity for common vegetables grown in Ethiopia. The results from the MCE technique indicated that there was substantial amount of land for irrigation using groundwater source (~17% of the total landmass). A comparison between suitable areas for irrigation and groundwater potential showed that a modest amount of land (up to 19% of the irrigable land) could be irrigated under CAPS and drip irrigation. The potential of groundwater, however, is a limiting factor to expand irrigated agriculture on suitable lands. Oromia and Amhara regional states provided about 61% of the nation’s groundwater potential for irrigation, hence it would be a wise choice for policymakers to consider these results in expanding irrigated agriculture for dry season crop productions.
A comparison between groundwater potential results under CAPS with drip irrigation (1.4 to 3.5 Mha) and CTPS [3], showed that CAPS with drip irrigation significantly increased groundwater potential for irrigation (i.e., 0.6 Mha under CTPS versus 2.2 Mha under CAPS on average). Groundwater potential could be further improved if irrigation scheduling was incorporated with the drip application system. Garlic and onion could be produced in relatively larger areas compared to tomatoes and cabbages due to relatively lower irrigation demand. In addition, CAPS with drip irrigation could significantly improve crop productivity in the nation when compared to CTPS with traditional irrigation. Production potential under CAPS with drip irrigation for cabbage (8.3 t ha−1 to 12.9 t ha−1) was substantially higher than CTPS, [57], which is 7.9 t ha−1 for the national average. Therefore, CAPS with drip irrigation is a feasible strategy to improve groundwater potential and crop productivity in the nation. Hence, policymakers should consider CAPS with drip irrigation in expanding small-scale irrigated agriculture.
Author Contributions
T.A. contributed to the conceptual design, data collection and acquisition, data analysis, and writing the manuscript. M.J. contributed to the conceptual design, data acquisition, data analysis, and revising the manuscript for scientific content. A.W.W. contributed to the conceptual design, data acquisition, data analysis, and revising the manuscript for scientific content. M.R. contributed to the conceptual design, data acquisition, and analysis. S.T. contributed to the conceptual design, data acquisition, data analysis, and revising the manuscript for scientific content.
Funding
This research and publication are made possible by the generous support of the American people through support by the United States Agency for International Development Feed the Future Innovation Labs for Collaborative Research on Small Scale Irrigation (Cooperative Agreement No. AID-OAA-A-13-0005, Texas A&M University) and Sustainable Intensification (Cooperative Agreement No. AID-OAA-L-14-00006, Kansas State University). The opinions expressed herein are those of the author(s) and do not necessarily reflect the views of the U.S. Agency for International Development.
Acknowledgments
We would like to acknowledge the International Water Management Institute (IWMI), and Ethiopian National Meteorological Agency (ENMA) for providing quality data for this research.
Conflicts of Interest
The authors declare no conflict of interest.
References
- Tesfa, A.; Mekuriaw, S. The effect of land degradation on farm size dynamics and crop-livestock farming system in Ethiopia: A Review. Open J. Soil Sci. 2014, 4, 1. [Google Scholar] [CrossRef]
- Assefa, T.; Jha, M.; Reyes, M.; Srinivasan, R.; Worqlul, A.W. Assessment of Suitable Areas for Home Gardens for Irrigation Potential, Water Availability, and Water-Lifting Technologies. Water 2018, 10, 495. [Google Scholar] [CrossRef]
- Worqlul, A.W.; Jeong, J.; Dile, Y.T.; Osorio, J.; Schmitter, P.; Gerik, T.; Srinivasan, R.; Clark, N. Assessing potential land suitable for surface irrigation using groundwater in Ethiopia. Appl. Geogr. 2017, 85, 1–13. [Google Scholar] [CrossRef]
- Getahun, K.; Van Rompaey, A.; Van Turnhout, P.; Poesen, J. Factors controlling patterns of deforestation in moist evergreen Afromontane forests of Southwest Ethiopia. For. Ecol. Manag. 2013, 304, 171–181. [Google Scholar] [CrossRef]
- Bekele, A.E. Five key constraints to small scale irrigation development in Ethiopia: Socio-Economic View. Glob. Adv. Res. J. 2014, 3, 441–444. [Google Scholar]
- Giller, K.E.; Witter, E.; Corbeels, M.; Tittonell, P. Conservation agriculture and smallholder farming in Africa: The heretics’ view. Field Crop. Res. 2009, 114, 23–34. [Google Scholar] [CrossRef]
- Assefa, T.T.; Jha, M.K.; Reyes, M.R.; Schimmel, K.; Tilahun, S.A. Commercial Home Gardens under Conservation Agriculture and Drip Irrigation for Small Holder Farming in sub-Saharan Africa. In Proceedings of the 2017 ASABE Annual International Meeting, Spokane, WC, USA, 16–19 July 2017; p. 1. [Google Scholar]
- Assefa, T.; Jha, M.; Reyes, M.; Tilahun, S.; Worqlul, A.W. Experimental Evaluation of Conservation Agriculture with Drip Irrigation for Water Productivity in Sub-Saharan Africa. Water 2019, 11, 530. [Google Scholar] [CrossRef]
- Assefa, T.; Jha, M.; Reyes, M.; Worqlul, A. Modeling the Impacts of Conservation Agriculture with a Drip Irrigation System on the Hydrology and Water Management in Sub-Saharan Africa. Sustainability 2018, 10, 4763. [Google Scholar] [CrossRef]
- Ward, F.A.; Pulido-Velazquez, M. Water conservation in irrigation can increase water use. Proc. Natl. Acad. Sci. 2008, 105, 18215–18220. [Google Scholar] [CrossRef]
- Megersa, G.; Abdulahi, J. Irrigation system in Israel: A review. Int. J. Water Resour. Environ. Eng. 2015, 7, 29–37. [Google Scholar]
- Assefa, T.T. Experimental and Modeling Evaluation of Conservation Agriculture with Drip Irrigation for Small-Scale Agriculture in Sub-Saharan Africa; North Carolina Agricultural and Technical State University: Greensboro, NC, USA, 2018. [Google Scholar]
- Emana, B.; Afari-Sefa, V.; Dinssa, F.F.; Ayana, A.; Balemi, T.; Temesgen, M. Characterization and assessment of vegetable production and marketing systems in the Humid Tropics of Ethiopia. Q. J. Int. Agric. 2015, 54, 163–187. [Google Scholar]
- Abebe, G. Long-term climate data description in Ethiopia. Data Brief 2017, 14, 371–392. [Google Scholar] [CrossRef] [PubMed]
- Kassie, B.; Rötter, R.; Hengsdijk, H.; Asseng, S.; Van Ittersum, M.; Kahiluoto, H.; Van Keulen, H. Climate variability and change in the Central Rift Valley of Ethiopia: Challenges for rainfed crop production. J. Agric. Sci. 2014, 152, 58–74. [Google Scholar] [CrossRef]
- Arndt, C.; Robinson, S.; Willenbockel, D. Ethiopia’s growth prospects in a changing climate: A stochastic general equilibrium approach. Glob. Environ. Chang. 2011, 21, 701–710. [Google Scholar] [CrossRef]
- Fekadu, K. Ethiopian seasonal rainfall variability and prediction using canonical correlation analysis (CCA). Earth Sci 2015, 4, 112–119. [Google Scholar] [CrossRef]
- Degefu, W. Some Aspects of Meteorological Drought in Ethiopia; Drought and Hunger in Africa; Cambridge University Press: Cambridge, UK, 1987. [Google Scholar]
- Ayalew, G. Land suitability evaluation for surface and sprinkler irrigation using Geographical Information System (GIS) in Guang Watershed, Highlands of Ethiopia. J. Environ. Earth Sci. 2014, 4, 140–149. [Google Scholar]
- Malczewski, J. GIS-based multicriteria decision analysis: A survey of the literature. Int. J. Geogr. Inf. Sci. 2006, 20, 703–726. [Google Scholar] [CrossRef]
- Laaribi, A.; Chevallier, J.; Martel, J.M. A spatial decision aid: A multicriterion evaluation approach. Comput. Environ. Urban Syst. 1996, 20, 351–366. [Google Scholar] [CrossRef]
- Malczewksi, J.; Ogryczak, W. The multiple criteria location problem: 2. Preference-based techniques and interactive decision support. Environ. Plan. A 1996, 28, 69–98. [Google Scholar] [CrossRef]
- Chakhar, S.; Martel, J.M. Enhancing geographical information systems capabilities with multi-criteria evaluation functions. J. Geogr. Inf. Decis. Anal. 2003, 7, 47–71. [Google Scholar]
- Carver, S.J. Integrating multi-criteria evaluation with geographical information systems. Int. J. Geogr. Inf. Syst. 1991, 5, 321–339. [Google Scholar] [CrossRef]
- Chuvieco, E. Integration of linear programming and GIS for land-use modelling. Int. J. Geogr. Inf. Sci. 1993, 7, 71–83. [Google Scholar] [CrossRef]
- Assefa, T.T.; Jha, M.K.; Tilahun, S.A.; Yetbarek, E.; Adem, A.A.; Wale, A. Identification of erosion hotspot area using GIS and MCE technique for koga watershed in the upper blue Nile Basin, Ethiopia. Am. J. Environ. Sci. 2015, 11, 245–255. [Google Scholar] [CrossRef]
- Worqlul, A.W.; Collick, A.S.; Rossiter, D.G.; Langan, S.; Steenhuis, T.S. Assessment of surface water irrigation potential in the Ethiopian highlands: The Lake Tana Basin. Catena 2015, 129, 76–85. [Google Scholar] [CrossRef]
- Teka, K.; Van Rompaey, A.; Poesen, J. Land suitability assessment for different irrigation methods in Korir Watershed, Northern Ethiopia. J. Drylands 2010, 3, 214–219. [Google Scholar]
- Maddahi, Z.; Jalalian, A.; Zarkesh, M.M.K.; Honarjo, N. Land suitability analysis for rice cultivation using multi criteria evaluation approach and GIS. Eur. J. Exp. Biol. 2014, 4, 639–648. [Google Scholar]
- Baniya, M.S.N. Land Suitability Evaluation Using GIS for Vegetable Crops in Kathmandu Valley/Nepal. Ph.D. Thesis, Institute of Horticulture Science, Humboldt-Universität zu Berlin, Berlin, Germany, 2008. [Google Scholar]
- Hossain, M.S.; Chowdhury, S.R.; Das, N.G.; Rahaman, M.M. Multi-criteria evaluation approach to GIS-based land-suitability classification for tilapia farming in Bangladesh. Aquac. Int. 2007, 15, 425–443. [Google Scholar] [CrossRef]
- Chen, Y.; Khan, S.; Padar, Z. Irrigation intensification or extensification assessment: A GIS-based spatial fuzzy multi-criteria evaluation. In Proceedings of the 8th International Symposium on Spatial Accuracy Assessment in Natural Resources and Environmental Sciences, Shanghai, China, 25–27 June 2018; pp. 309–318. [Google Scholar]
- Tu, Q.; Li, H.; Wang, X.; Chen, C.; Luo, Y.; Dwomoh, F.A. Multi-criteria evaluation of small-scale sprinkler irrigation systems using Grey relational analysis. Water Resour. Manag. 2014, 28, 4665–4684. [Google Scholar] [CrossRef]
- FAO. A Framework for Land Evaluation; Soils bulletin No. 32; FAO: Rome, Italy, 1976. [Google Scholar]
- Saaty, T.L. A scaling method for priorities in hierarchical structures. J. Math. Psychol. 1977, 15, 234–281. [Google Scholar] [CrossRef]
- Saaty, R.W. The analytic hierarchy process—What it is and how it is used. Math. Model. 1987, 9, 161–176. [Google Scholar] [CrossRef]
- Baffaut, C.; Dabney, S.M.; Smolen, M.D.; Youssef, M.A.; Bonta, J.V.; Chu, M.L.; Guzman, J.A.; Shedekar, V.S.; Jha, M.K.; Arnold, J.G. Hydrologic and water quality modeling: Spatial and temporal considerations. Trans. ASABE 2015, 58, 1661–1680. [Google Scholar]
- Guzman, J.A.; Shirmohammadi, A.; Sadeghi, A.M.; Wang, X.; Chu, M.L.; Jha, M.K.; Parajuli, P.B.; Harmel, R.D.; Khare, Y.P.; Hernandez, J.E. Uncertainty considerations in calibration and validation of hydrologic and water quality models. Trans. ASABE 2015, 58, 1745–1762. [Google Scholar]
- Jha, M.K.; Gassman, P.W.; Secchi, S.; Gu, R.; Arnold, J.G. Impact of Watershed Subdivision Level on Flows, Sediment Loads, and Nutrient Losses Predicted by SWAT. J. Am. Water Resour. Assoc. 2004, 40, 811–825. [Google Scholar] [CrossRef]
- Williams, J.R.; Arnold, J.G.; Srinivasan, R.; Ramanarayanan, T.S. APEX: A new tool for predicting the effects of climate and CO2 changes on erosion and water quality. In Modelling Soil Erosion by Water; Springer: Berlin/Heidelberg, Germany, 1998; pp. 441–449. [Google Scholar]
- Wang, X.; Yen, H.; Liu, Q.; Liu, J. An auto-calibration tool for the Agricultural Policy Environmental eXtender (APEX) model. Trans. ASABE 2014, 57, 1087–1098. [Google Scholar]
- Wang, X.; Gassman, P.; Williams, J.; Potter, S.; Kemanian, A. Modeling the impacts of soil management practices on runoff, sediment yield, maize productivity, and soil organic carbon using APEX. Soil Tillage Res. 2008, 101, 78–88. [Google Scholar] [CrossRef]
- Cavero, J.; Barros, R.; Sellam, F.; Topcu, S.; Isidoro, D.; Hartani, T.; Lounis, A.; Ibrikci, H.; Cetin, M.; Williams, J. APEX simulation of best irrigation and N management strategies for off-site N pollution control in three Mediterranean irrigated watersheds. Agric. Water Manag. 2012, 103, 88–99. [Google Scholar] [CrossRef]
- Zhang, B.; Feng, G.; Ahuja, L.R.; Kong, X.; Ouyang, Y.; Adeli, A.; Jenkins, J.N. Soybean crop-water production functions in a humid region across years and soils determined with APEX model. Agric. Water Manag. 2018, 204, 180–191. [Google Scholar] [CrossRef]
- Jha, M.K.; Gassman, P.W.; Arnold, J.G. Water quality modeling for the Raccoon River watershed using SWAT. Trans. ASABE 2007, 50, 479–493. [Google Scholar] [CrossRef]
- Moriasi, D.N.; King, K.W.; Bosch, D.D.; Bjorneberg, D.L.; Teet, S.; Guzman, J.A.; Williams, M.R. Framework to parameterize and validate APEX to support deployment of the nutrient tracking tool. Agric. Water Manag. 2016, 177, 146–164. [Google Scholar] [CrossRef]
- Wang, X.; Williams, J.; Gassman, P.; Baffaut, C.; Izaurralde, R.; Jeong, J.; Kiniry, J. EPIC and APEX: Model use, calibration, and validation. Trans. ASABE 2012, 55, 1447–1462. [Google Scholar] [CrossRef]
- Allen, R.; Pereira, L.; Raes, D.; Smith, M. Chapter 6-ETc-Single crop coefficient (KC). In Crop. Evapotranspiration—Guidelines for Computing Crop Water Requirements—FAO Irrigation and Drainage Paper 56; FAO—Food and Agriculture Organization of the United Nations: Rome, Italy, 1998. [Google Scholar]
- Howell, T.A. Irrigation efficiency. In Encyclopedia of Water Science; Marcel Dekker: New York, NY, USA, 2003; pp. 467–472. [Google Scholar]
- Altchenko, Y.; Villholth, K.G. Mapping irrigation potential from renewable groundwater in Africa—A quantitative hydrological approach. Hydrol. Earth Syst. Sci. Discuss. 2014, 11, 6065–6097. [Google Scholar] [CrossRef]
- Mohan, S.; Simhadrirao, B.; Arumugam, N. Comparative study of effective rainfall estimation methods for lowland rice. Water Resour. Manag. 1996, 10, 35–44. [Google Scholar] [CrossRef]
- Howsam, P.; Carter, R.C. Water Policy: Allocation and management in practice. In Proceedings of the International Conference on Water Policy, London, UK, 23–24 September 1996; p. 384. [Google Scholar]
- FAO. Guidelines for Land Use Planning; Development Series 1; Soil Resources, Management and Conservation Service; Food and Agricultural Organization—FAO: Rome, Italy, 1993. [Google Scholar]
- Chen, L.; Chan, C.M.; Lee, H.C.; Chung, Y.; Lai, F. Development of a decision support engine to assist patients with hospital selection. J. Med. Syst. 2014, 38, 59. [Google Scholar] [CrossRef] [PubMed]
- Koczkodaj, W.W.; Mikhailov, L.; Redlarski, G.; Soltys, M.; Szybowski, J.; Tamazian, G.; Wajch, E.; Yuen, K.K.F. Important Facts and Observations about Pairwise Comparisons (the special issue edition). Fundam. Inform. 2016, 144, 291–307. [Google Scholar] [CrossRef]
- Gebregziabher, G. Water Lifting Irrigation Technology Adoption in Ethiopia: Challenges and Opportunities. AgWater Case Study. Available online: http://awm-solutions.iwmi.org/Data/Sites/3/Documents/PDF/et-water-lifting-devices.pdf (accessed on 12 December 2012).
- CSA. [Ethiopia] Agricultural Sample Survey 2009/2010 (2002 E.C.) (September–December, 2009) Volume IV, Report on Area and Production of Crops Development; Central Statistical Agency-Ministry of Finance and Economic Development: Addis Ababa, Ethiopia, 2010; Volume 446.
© 2019 by the authors. Licensee MDPI, Basel, Switzerland. This article is an open access article distributed under the terms and conditions of the Creative Commons Attribution (CC BY) license (http://creativecommons.org/licenses/by/4.0/).