1. Introduction
Turbulent flow over dunal bedforms fascinates researchers. The topic is important not only from the viewpoint of intrinsic scientific reasons, but also owing to its far-reaching applications in engineering. In addition to its practical applications, it allows a significant theoretical understanding of wake flows. Despite impressive advances over the past years, an inclusive picture of the flow and turbulence characteristics over a dunal bedform remains far from complete [
1]. The dunes are created by an interaction between the flow and bed sediment particles. Dunes are kind of bedforms that are found when the flow variables, such as flow velocity and bed shear stress over a sediment bed surpass their threshold values.
Over the decades, a large corpus of experimental and numerical studies has been reported to grasp the flow features over dunal bedforms. Researchers studied the velocity field over dunes to acquire an insight into the physical features, including the reattachment point, wake region and internal boundary layer [
2,
3]. The experimental observations of flow over a series of two- and three-dimensional dunes revealed that the two-dimensional dunes induce stronger turbulence compared to their three-dimensional counterparts [
4,
5]. However, the flow characteristics over a natural dune were found to be quite different from those over an artificial dune [
6]. Best [
7] found that over the dune crests, the ejections dominate the instantaneous flow field.
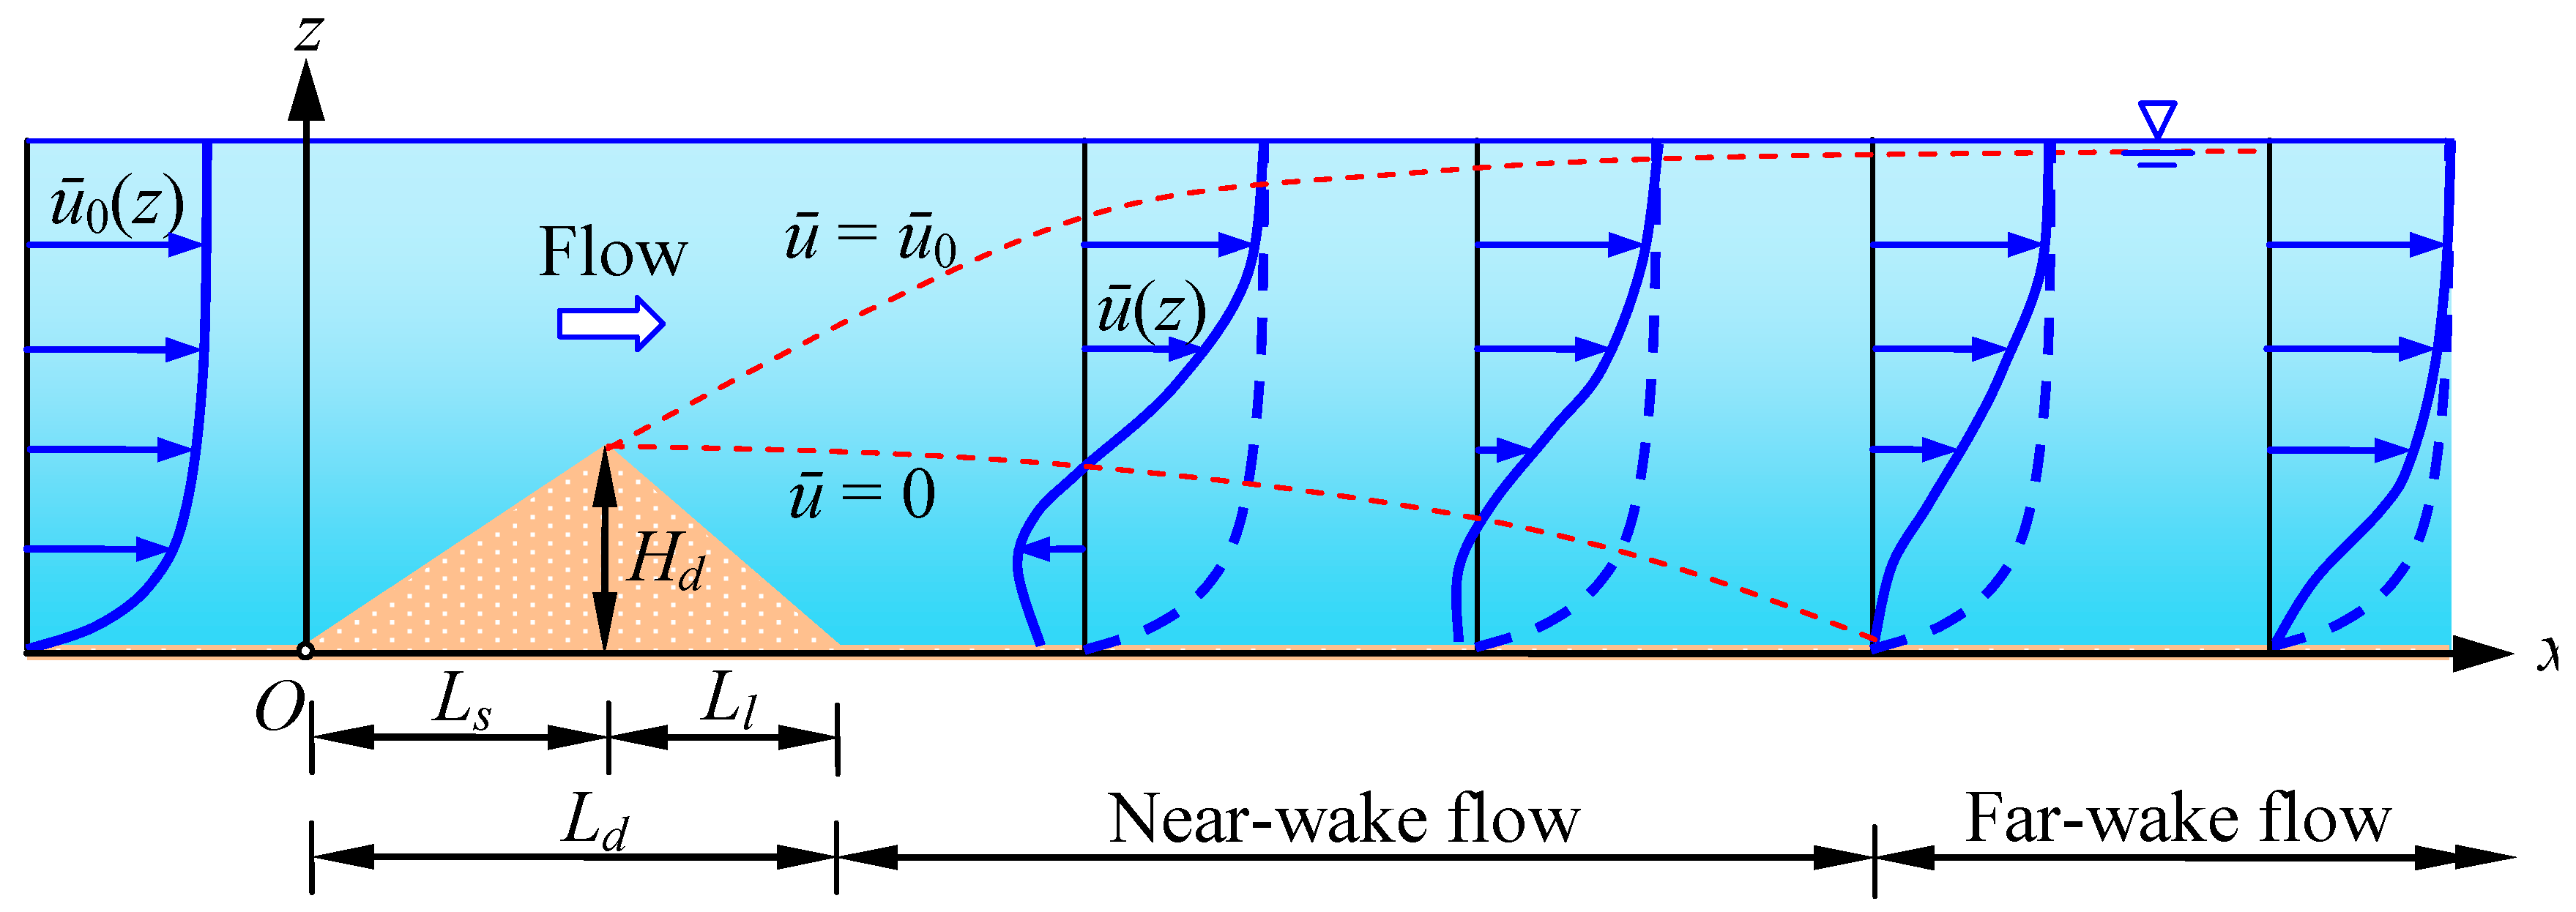
In a natural streamflow, an isolated dunal bedform acts as a bluff-body, producing wall-wake flow at its downstream. The wake flow downstream of an isolated dunal bedform persists up to a certain stretch until the local wake flow diffuses to and becomes the part of the undisturbed upstream flow.
Figure 1 presents a conceptual representation of flow past an isolated dunal bedform in
xz plane. Here,
x is the streamwise distance measured from a convenient point
O and
z is the vertical distance from the bed. The dune length
Ld comprises the stoss-side length
Ls and the leeside length
Ll (
Ld =
Ls +
Ll). The dune height
Hd is the vertical distance of the dune crest from the bed. Downstream of the dune, a flow reversal takes place, called the
near-wake flow. Afterward, the flow is called the
far-wake flow. In
Figure 1, the lower dashed line denotes the locus of
ū(
z) = 0, whereas the upper dashed line signifies the boundary layer (
ū =
ū0) in the wall-wake flow. Here,
ū(z) is the time-averaged streamwise flow velocity in the wake flow and
ū0(
z) is the time-averaged streamwise flow velocity in the undisturbed upstream flow. In the far downstream of the dunal bedform, the flow achieves the undisturbed upstream state, called the
fully recovered open-channel flow.
In this context, it is pertinent to mention that for a shear-free flow, Schlichting [
8] pioneered the similarity theory of the velocity defect profile in the free-wake flow downstream of a circular cylinder. The wall-wake flow downstream of an isolated dunal bedform in an approach wall-shear flow, being different from a free-wake flow, is rather intricate. The turbulence characteristics and the vortex shedding downstream of bed-mounted bluff-bodies in both near- and far-wake flows were studied by various researchers. Some of these bluff-bodies include plate [
9,
10], hemisphere [
11], sphere [
12,
13], circular cylinder [
14,
15,
16,
17,
18,
19,
20,
21] and pebble cluster [
22].
It is worth noting that most of the former studies were dedicated to understanding the flow features over a continuous train of dunes. In fact, little is known about the flow and turbulence characteristics over an isolated dunal bedform. This study specifically puts into focus the flow and turbulence characteristics downstream of an isolated two-dimensional dunal bedform over a rough bed in order to advance the present state-of-the-art. In addition to time-averaged streamwise flow velocity, the salient features of turbulence, including the Reynolds shear stress, turbulent bursting, turbulent kinetic energy budget and Reynolds stress anisotropy, are greatly discussed. It may be noted that the preliminary studies of flow and turbulence characteristics downstream of an isolated dunal bedform have been recently presented elsewhere [
23,
24].
2. Experimental Design
Experiments were performed in a re-circulatory flume, having a rectangular cross-section, at the Fluvial Mechanics Laboratory in the Indian Statistical Institute, Kolkata, India. The length, width and height of the flume were 20 m, 0.5 m and 0.5 m, respectively. The inflow discharge, supplied by a centrifugal pump, was measured by an electromagnetic gadget. The transparent sidewalls of the flume provided visual access to the flow. The flume bed, having a streamwise bed slope of 3 × 10
–4, was prepared by gluing uniform gravels of median size
d50 = 2.49 mm. In the experiments, two types of isolated two-dimensional dunal bedforms, classified as Runs 1 and 2, respectively (
Figure 2), were mounted on the flume bed at a distance of 7 m from the inlet. In Runs 1 and 2, the dune heights
Hd were 0.09 m and 0.03 m, whereas the dune lengths
Ld were 0.4 m (
LS = 0.24 m and
Ll = 0.16 m) and 0.3 m (
LS = 0.24 m and
Ll = 0.06 m), respectively. In both the runs, the same approach uniform flow condition was maintained. The approach flow depth
h and depth-averaged approach flow velocity
Ū0 were maintained as
h ≈ 0.3 m and
Ū0 ≈ 0.44 m s
−1. The flow depth and the free surface profile were measured by a Vernier point gauge, having a precision of ±0.1 mm. The approach shear velocity
u* [= (
τ0/
ρ)
0.5], obtained from the streamwise bed slope, was 0.03 m s
−1. Here,
τ0 is the bed shear stress and
ρ is the mass density of fluid. However, the values of
u* in both Runs 1 and 2, determined from the Reynolds shear stress profiles, were 0.027 m s
–1 and 0.025 m s
−1, respectively. It is worth noting that to find the
u* from the Reynolds shear stress profiles, the profiles were extrapolated up to the bed. In both the runs, the flow Reynolds number was 528,000, whereas the flow Froude number was 0.256 (subcritical). The shear Reynolds number
R* (=
d50u*/
ν, where
ν is the coefficient of kinematic viscosity of fluid) was preserved to be 74.7 (> 70), setting a hydraulically rough flow regime.
A 5 cm down-looking
Vecrtino probe (acoustic Doppler velocimetry), also called
Vectrino plus, was used to capture the instantaneous three-dimensional flow velocity components along the flume centreline at various relative streamwise distances
x/
Ld = −0.5, −0.25, 0, 0.1, 0.2, 0.3, 0.4, 0.5, 0.6, 0.7, 0.8, 0.9, 1, 1.1, 1.3, 1.7, 2.1, 2.5 and 3.3. The Vecrtino system, having a flexible sampling volume of 6 mm diameter and 1 to 4 mm height, was operated with 10 MHz acoustic frequency and 100 Hz sampling rate. The velocity components (
u,
v,
w) correspond to (
x,
y,
z), where
y is the spanwise direction. It may be noted that up to the dune crest, the lowest sampling height was set as 1 mm, whereas beyond the crest, it was 2.5 mm. The closest measuring location of the data points was 2 mm. A sampling duration of 300 s was found to be adequate to obtain the time-independent flow velocity and turbulence quantities. The minimum signal-to-noise ratio was maintained as 18, whereas the minimum threshold of signal correlation was maintained as 70%. The measured data were filtered whenever required applying the
acceleration thresholding method [
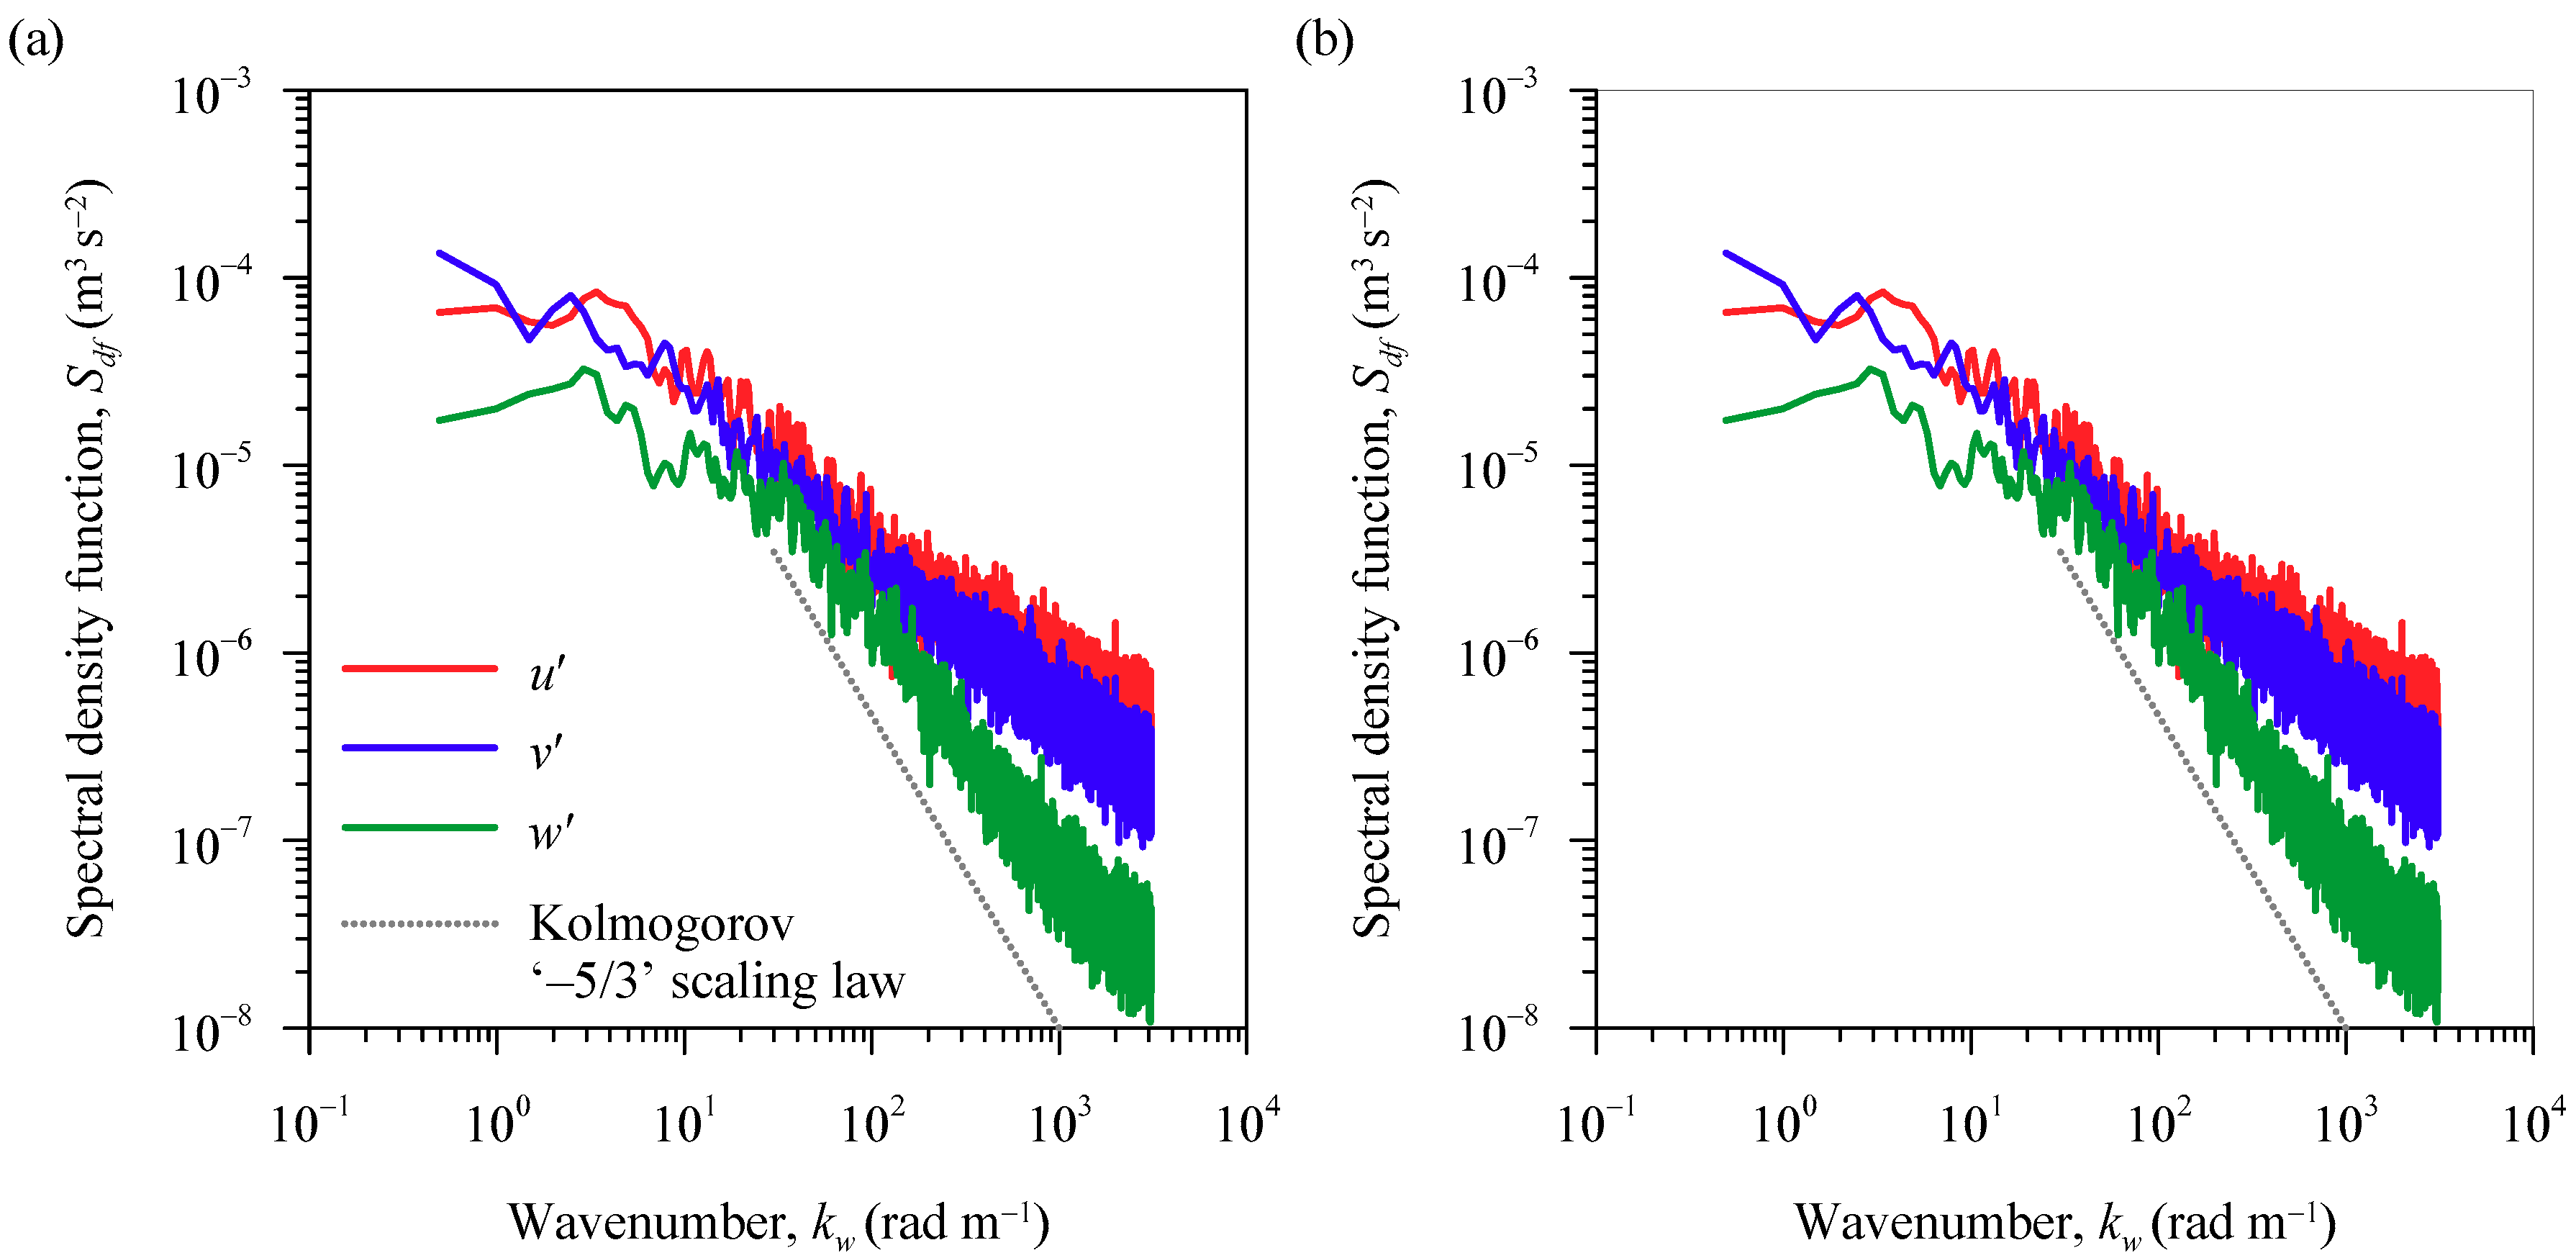
25]. This method could separate and substitute the unwanted data spikes in two phases. The threshold values of 1 to 1.5 for decontaminating the measured data were ascertained by satisfying Kolmogorov ‘–5/3’ scaling law in the inertial subrange for the spectral density function
Sdf(
kw) of streamwise velocity fluctuations
u′. Here,
kw is the wavenumber (= 2π
f/
ū) and
f is the frequency.
Figure 3a,b illustrates the data plots of
Sdf(
kw) for velocity fluctuations (
u′,
v′,
w′) in (
x,
y,
z) before and after decontaminating the data in Run 1, respectively, at a relative streamwise distance
x/
Ld = 0.7 and a relative vertical distance
z/
Ld = 0.13. The
Sdf(
kw) curves of decontaminated signals compare well with Kolmogorov ‘–5/3’ scaling law in the inertial subrange for
kw ≥ 30 rad s
−1. In addition, it appears that the discrete spectral peaks are prominent for
kw < 30 rad s
−1. This indicates that the signals corresponding to
kw < 30 rad s
−1 contained large-scale turbulent structures, while those for
kw ≥ 30 rad s
−1 confirmed a pure turbulence. Therefore, a high-pass filter with a cut-off wavenumber of 30 rad s
−1 was used to filter the data.
In order to find the uncertainty of Vectrino data, 15 samples were collected at a sampling rate of 100 Hz for a duration of 300 s at a vertical distance
z = 5 mm.
Table 1 summarizes the results of uncertainty estimations of the time-averaged velocity components (
ū,
,
) and the turbulence intensities [(
)
0.5, (
)
0.5, (
)
0.5] in (
x,
y,
z) and the Reynolds shear stress
τ per unit mass density of fluid (= −
). It is pertinent to mention that to avoid bias and random errors, the samplings were done every time after resuming the experiments. The errors for the time-averaged velocity components, turbulence intensities and Reynolds shear stress were within ±4%, ±7% and ±8%, respectively. This confirmed the appropriateness of the data sampling with 100 Hz sampling rate. Further, it was necessary to ascertain the fully-developed undisturbed approach velocity profiles for both the Runs.
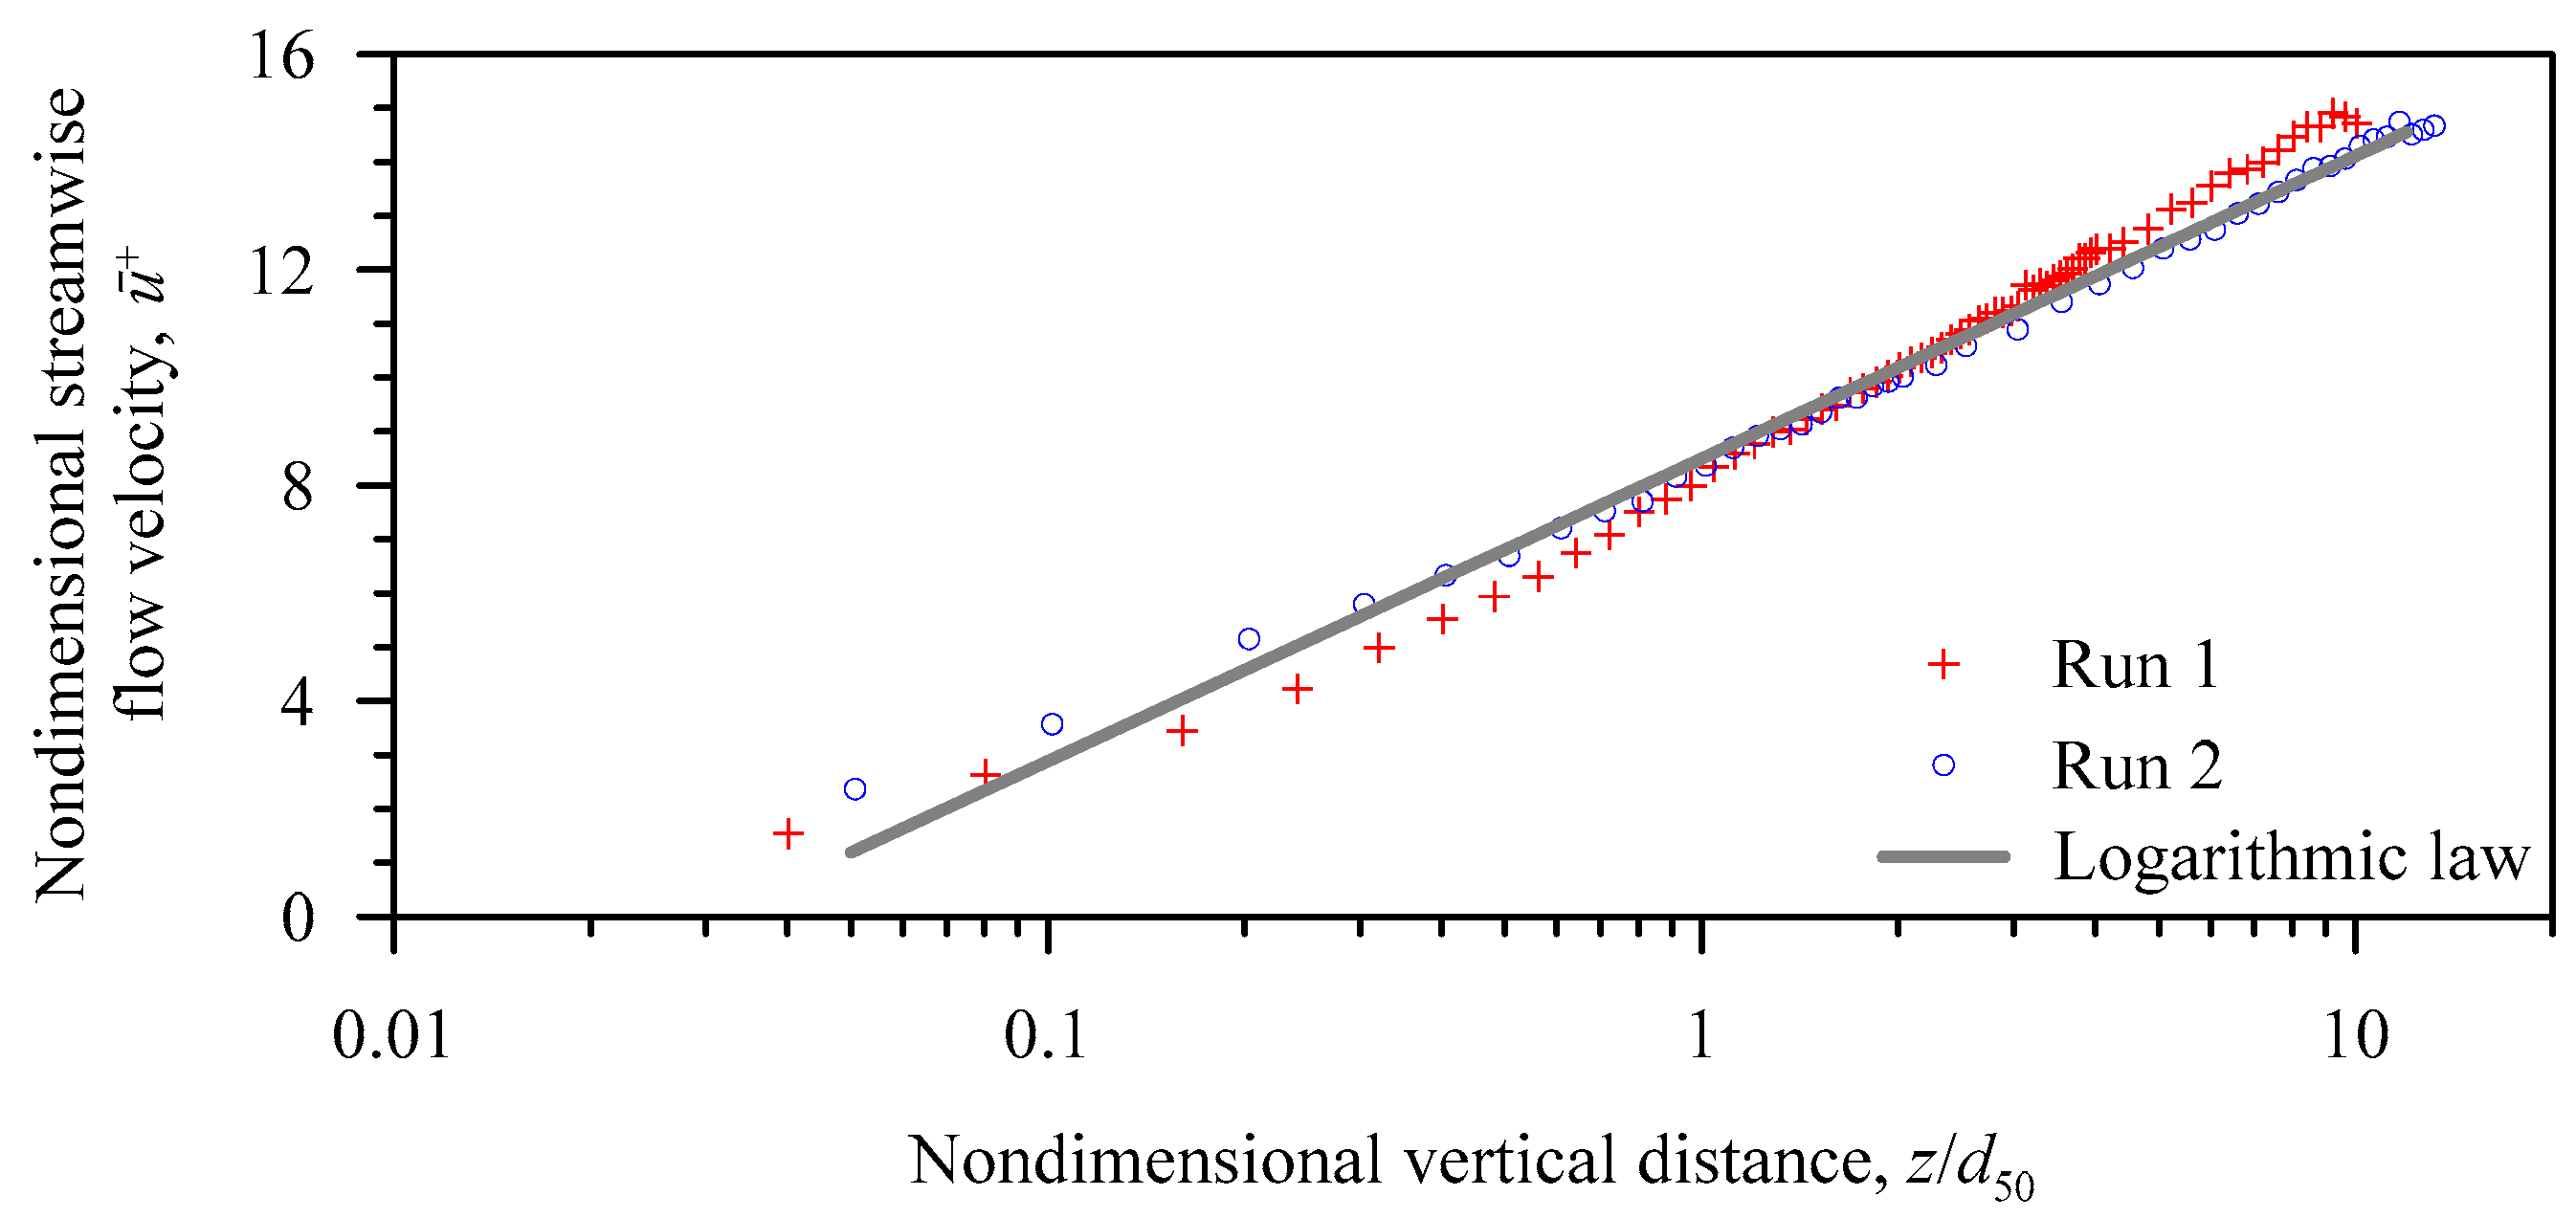
Figure 4 shows the vertical profiles of nondimensional streamwise flow velocity
ū+ (=
ū/
u*) at the upstream of isolated dunal bedforms for both Runs 1 and 2. The data plots compare well with the classical logarithmic law
ū/
u* =
κ−1ln(
z/
d50) + 8.5 for a hydraulically rough flow regime. Here,
κ is the von Kármán constant (= 0.41). This confirmed the acceptability of the fully-developed undisturbed approach flow velocity profiles for a hydraulically rough flow regime.
4. Third-Order Moments
The third-order moments of velocity fluctuations offer relevant probabilistic information about the flux and the advection of Reynolds normal stresses. In addition, they give an indication of the predominance of turbulent bursting events [
26]. The third-order moments, in the generalized form in
xz plane, is expressed as
mjk =
, where
=
u′/(
)
0.5,
=
w′/(
)
0.5 and
j +
k = 3. Therefore, depending on the values of
j and
k, the third-order moments are given as,
m30 =
/(
)
1.5,
m03 =
/(
)
1.5,
m21 =
/[(
)×(
)
0.5] and
m12 =
/[(
)
0.5×(
)]. Here, the
m30 signifies the skewness of
u′, indicating the streamwise flux of the streamwise Reynolds normal stress
. The
m03 defines the skewness of
w′, suggesting the vertical flux of the vertical Reynolds normal stress
. In addition, the
m21 represents the advection of
in the vertical direction, whereas the
m12 demonstrates the advection of
in the streamwise direction.
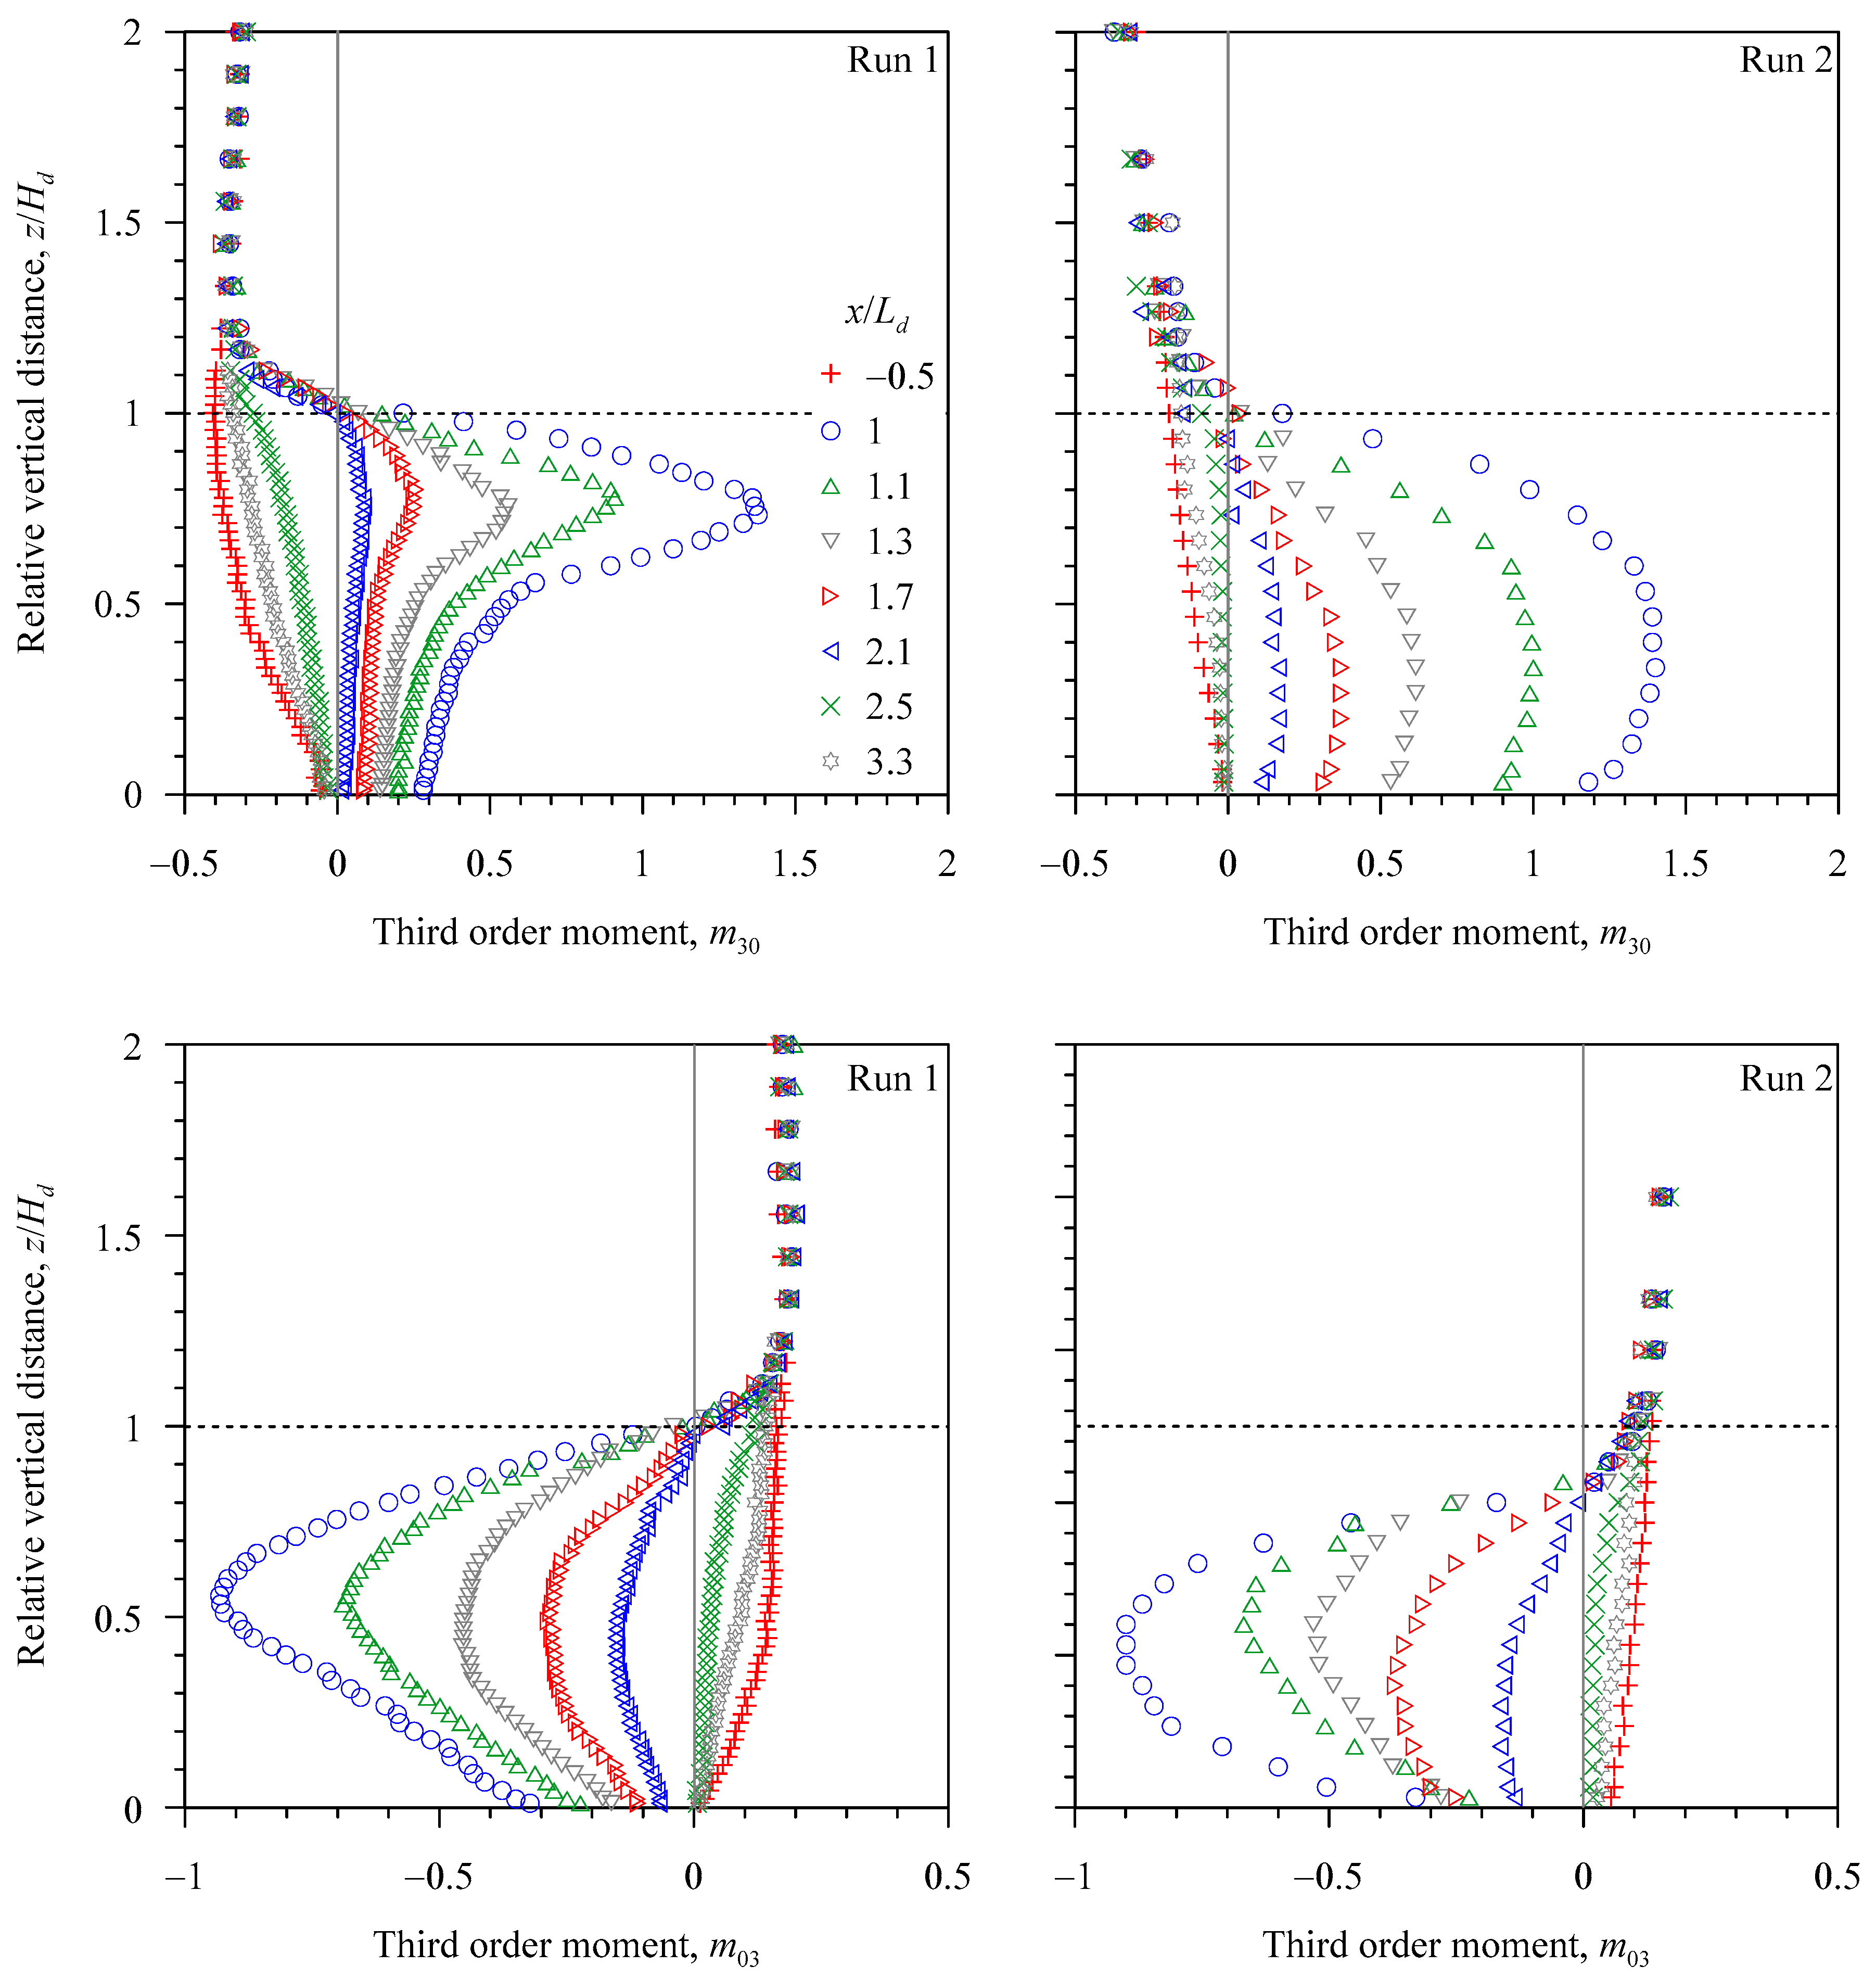
Figure 7 shows the vertical profiles of
m30 and
m03 at the upstream and various downstream relative streamwise distances
x/
Ld in Runs 1 and 2. Upstream of the dune (
x/
Ld = −0.5), the
m30 and
m03, in the near-bed flow zone, are negative and positive, respectively. Then, they increase with an increase in relative vertical distance
z/
Hd without changing their signs. Downstream of the dune (
x/
Ld = 1 to 2.1), for a given
x/
Ld, the
m30 and
m03, in the near-bed flow zone, start with positive and negative values, respectively. Thereafter, they increase slowly with an increase in
z/
Hd until they attain their respective positive and negative peaks at
z/
Hd ≈ 0.75 and 0.5. As the
z/
Hd increases further, the
m30 and
m03 reduce quickly, changing their signs at
z/
Hd = 1, and for
z/
Hd > 1, they become independent of
z/
Hd. However, these features disappear gradually with an increase in
x/
Ld. It may be noted that the
m30 and
m03 profiles at
x/
Ld = 3.3 remain almost similar to those in the upstream.
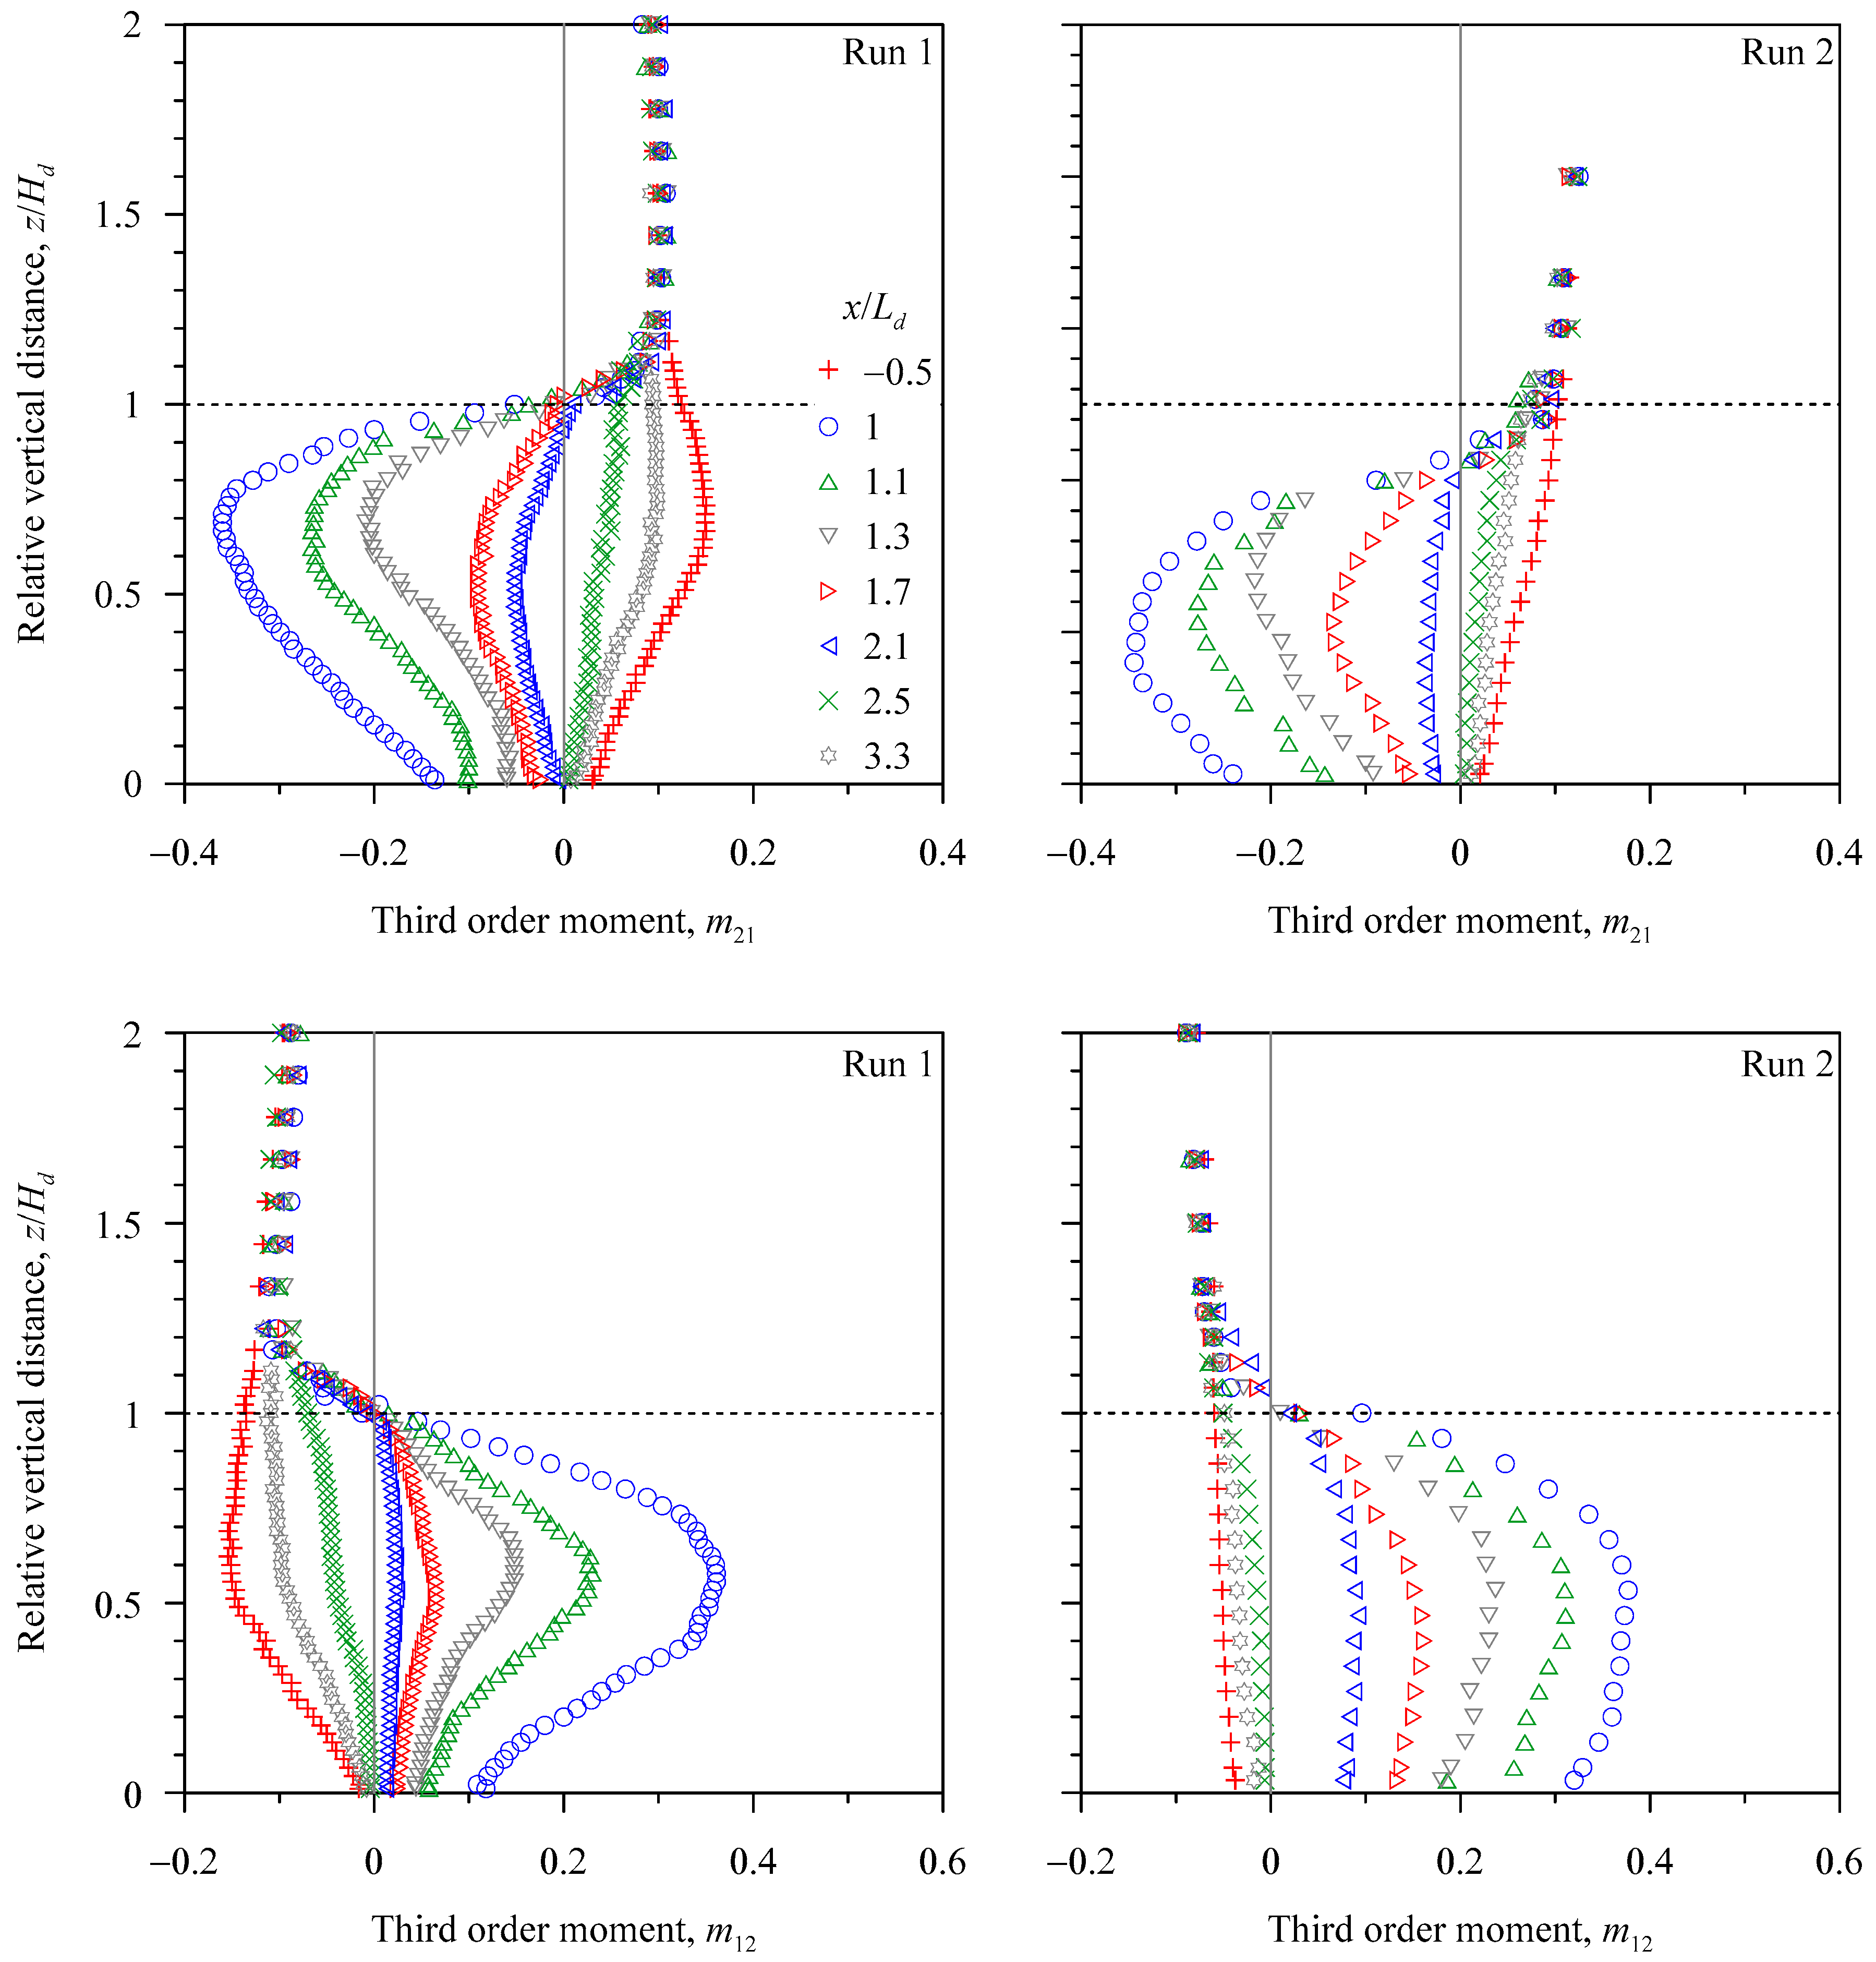
Figure 8 depicts the vertical profiles of
m21 and
m12 at the upstream and various downstream relative streamwise distances
x/
Ld in Runs 1 and 2. It appears that upstream of the dune (
x/
Ld = −0.5), the
m21 and
m12, in the near-bed flow zone, attain positive and negative values, respectively. Then, they increase with an increase in relative vertical distance
z/
Hd up to a certain height. Subsequently, they reduce with an increase in
z/
Hd, becoming independent of
z/
Hd for
z/
Hd > 1.1. Downstream of the dune (
x/
Ld = 1 to 2.1), for a given
x/
Ld, the
m21 and
m12, in the near-bed flow zone, are negative and positive, respectively. Then, they increase with an increase in
z/
Hd attaining their respective peaks. Afterward, they reduce quickly, changing their signs at the dune crest (
z/
Hd = 1). Thereafter, the
m21 and
m12 profiles recover their upstream profiles. Downstream of the dune, an advection of
in the upward direction and that of
in the upstream direction prevail below the crest. In fact, below the crest, there appears a streamwise acceleration, which is linked with the downward flux causing sweeps with an advection of
in the downward direction. By contrast, above the crest, the streamwise deceleration is associated with an upward flux producing ejections with an advection of
in the upward direction.
5. Quadrant Analysis
Lu and Willmarth [
27] suggested that the bursting events can be quantified by performing the quadrant analysis of velocity fluctuations
u′ and
w′ on a
u′
w′ plane. The turbulent bursting includes four events in four distinct quadrants
i = 1 to 4, such as (i)
Q1 events or
outward interactions (
i = 1 and
u′,
w′ > 0), (ii)
Q2 events or
ejections (
i = 2 and
u′ < 0,
w′ > 0), (iii)
Q3 events or
inward interactions (
i = 3 and
u′,
w′ < 0) and (iv)
Q4 events or
sweeps (
i = 4 and
u′ > 0,
w′ < 0). Outside the
hole size H, the contribution of
from the quadrant
i to
is ascertained by averaging the quantity
u′(
t)
w′(
t)
Fi,H over the sampling duration. Here,
Fi,H is the
detection function, defined as
Fi,H = 1 if the pair (
u′,
w′) in the quadrant
i satisfies the condition |
u′
w′|≥
H(
)
0.5(
)
0.5 and
Fi,H = 0 otherwise. The
relative fractional contributions Si,H toward the Reynolds shear stress production is expressed as
Si,H =
/
. It turns out that for
H = 0, the sum of
S1,0,
S2,0,
S3,0 and
S4,0 becomes unity.
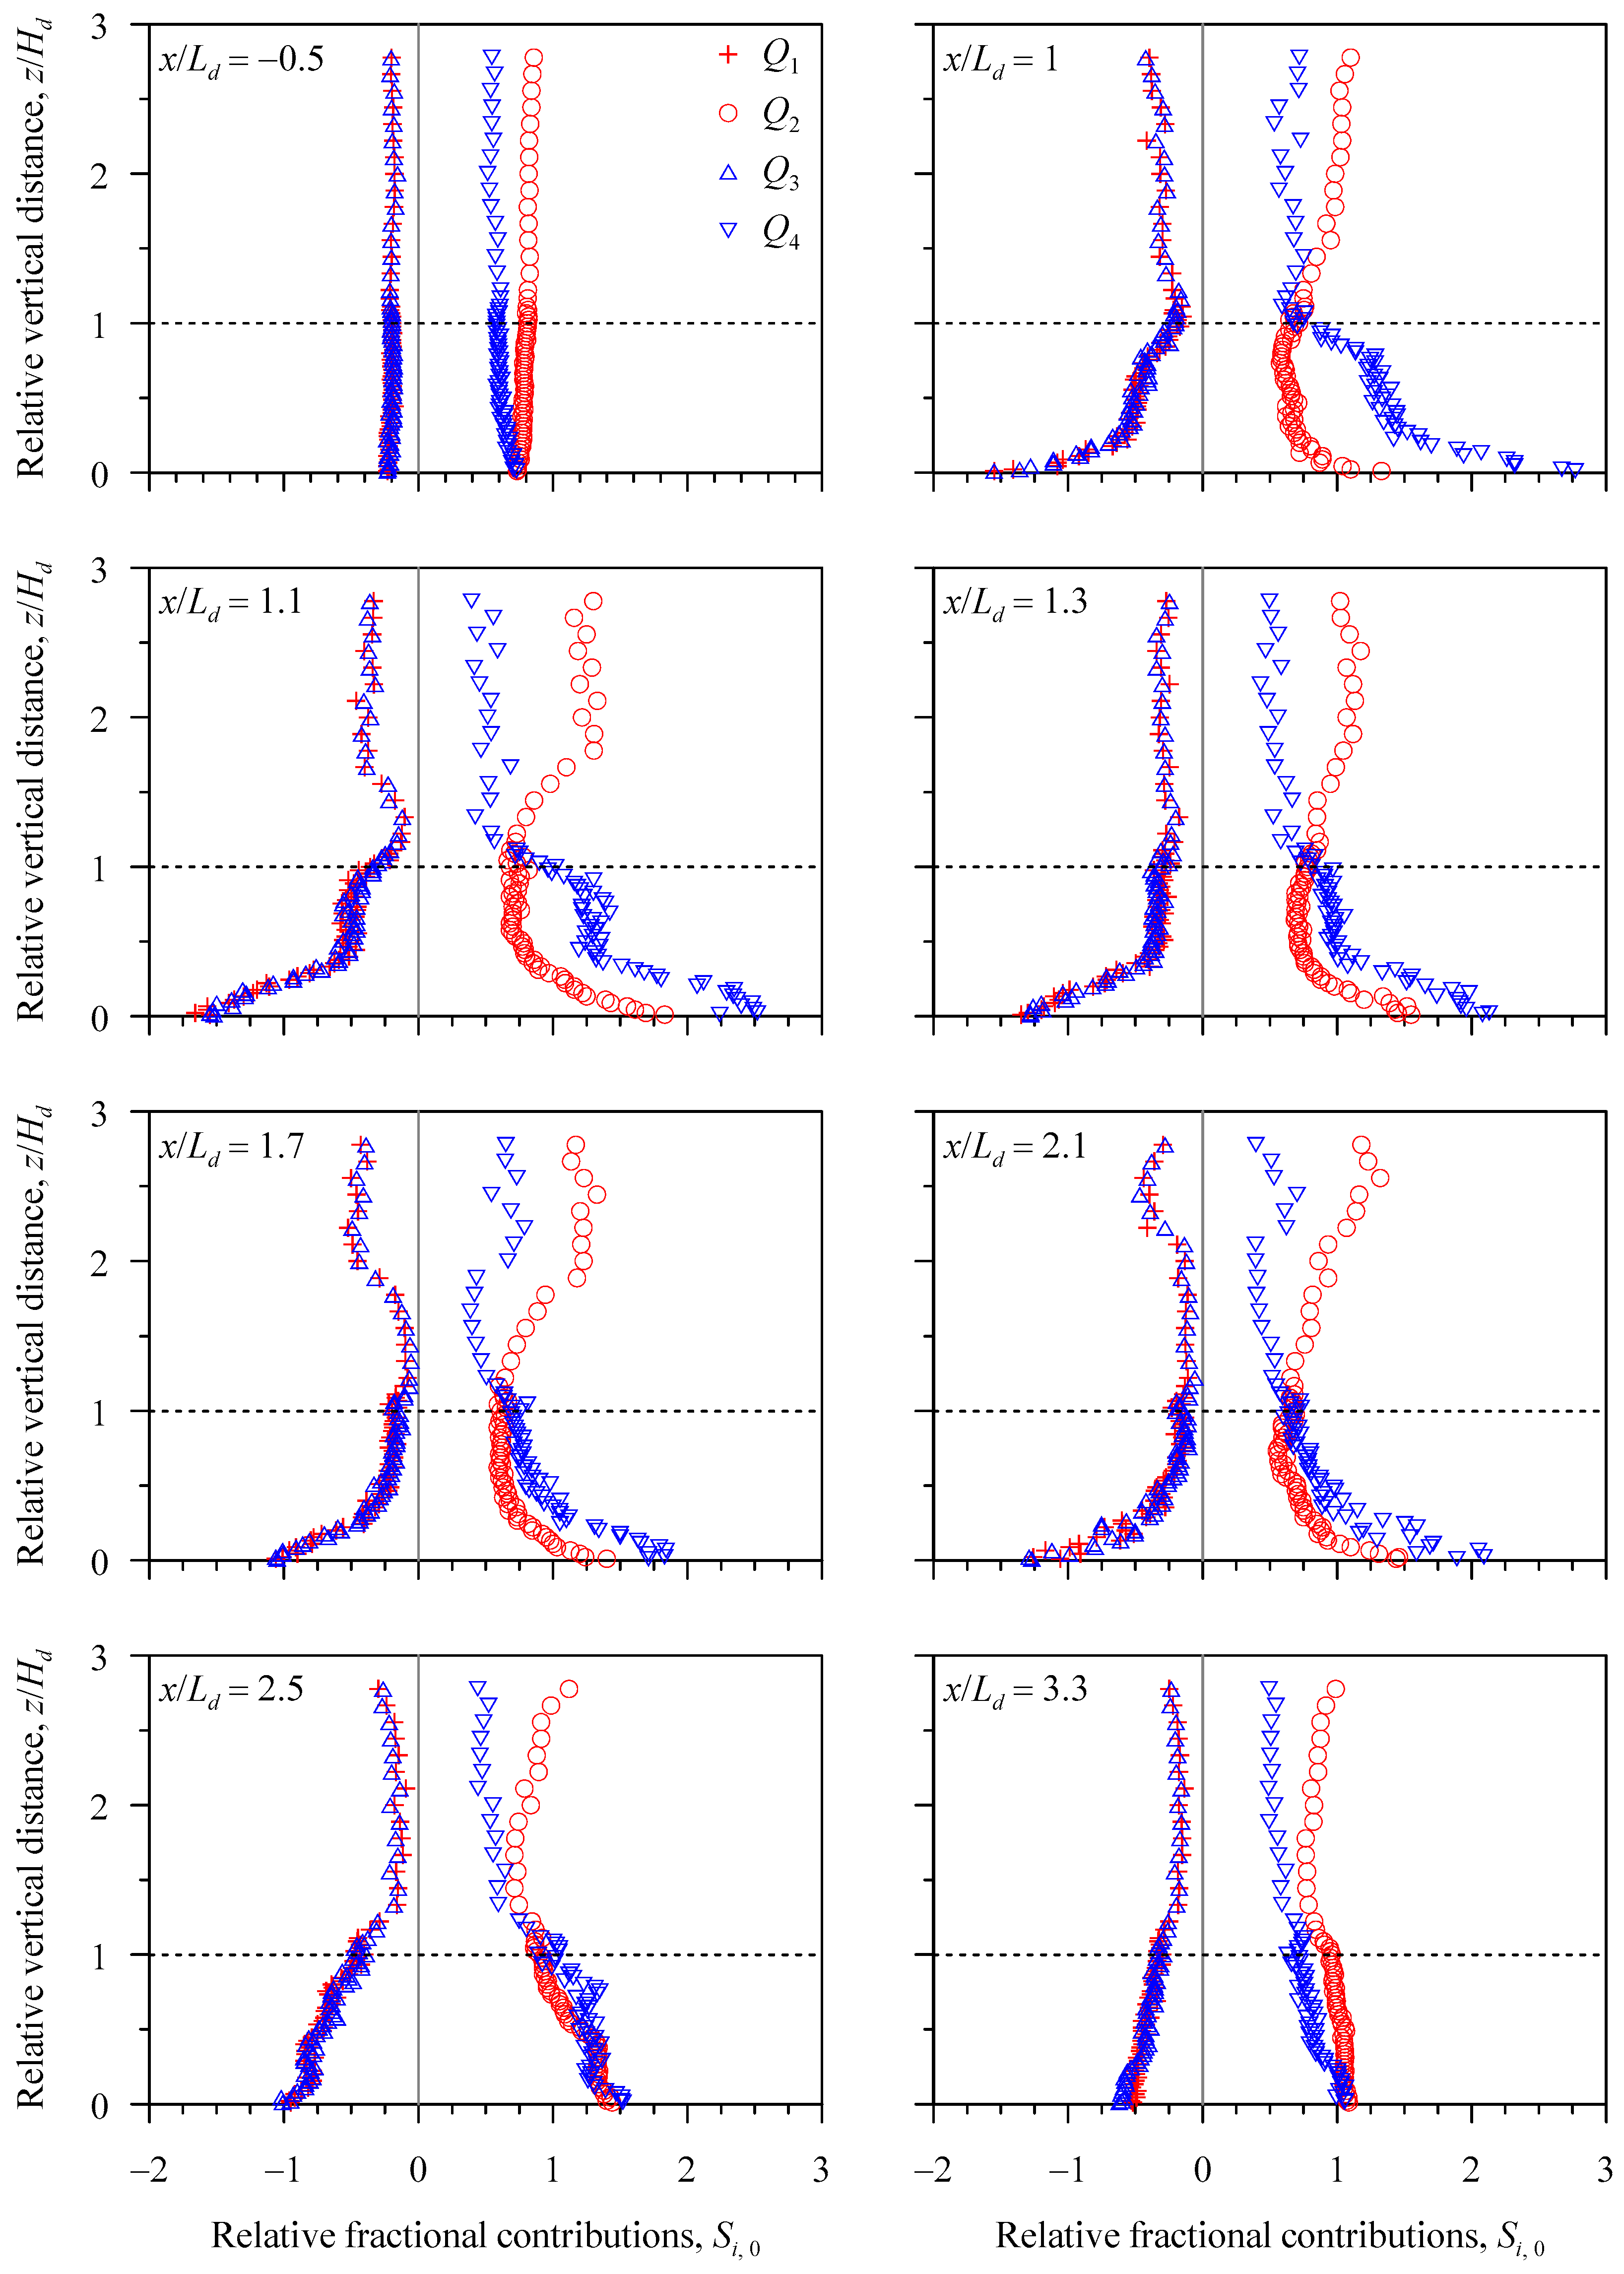
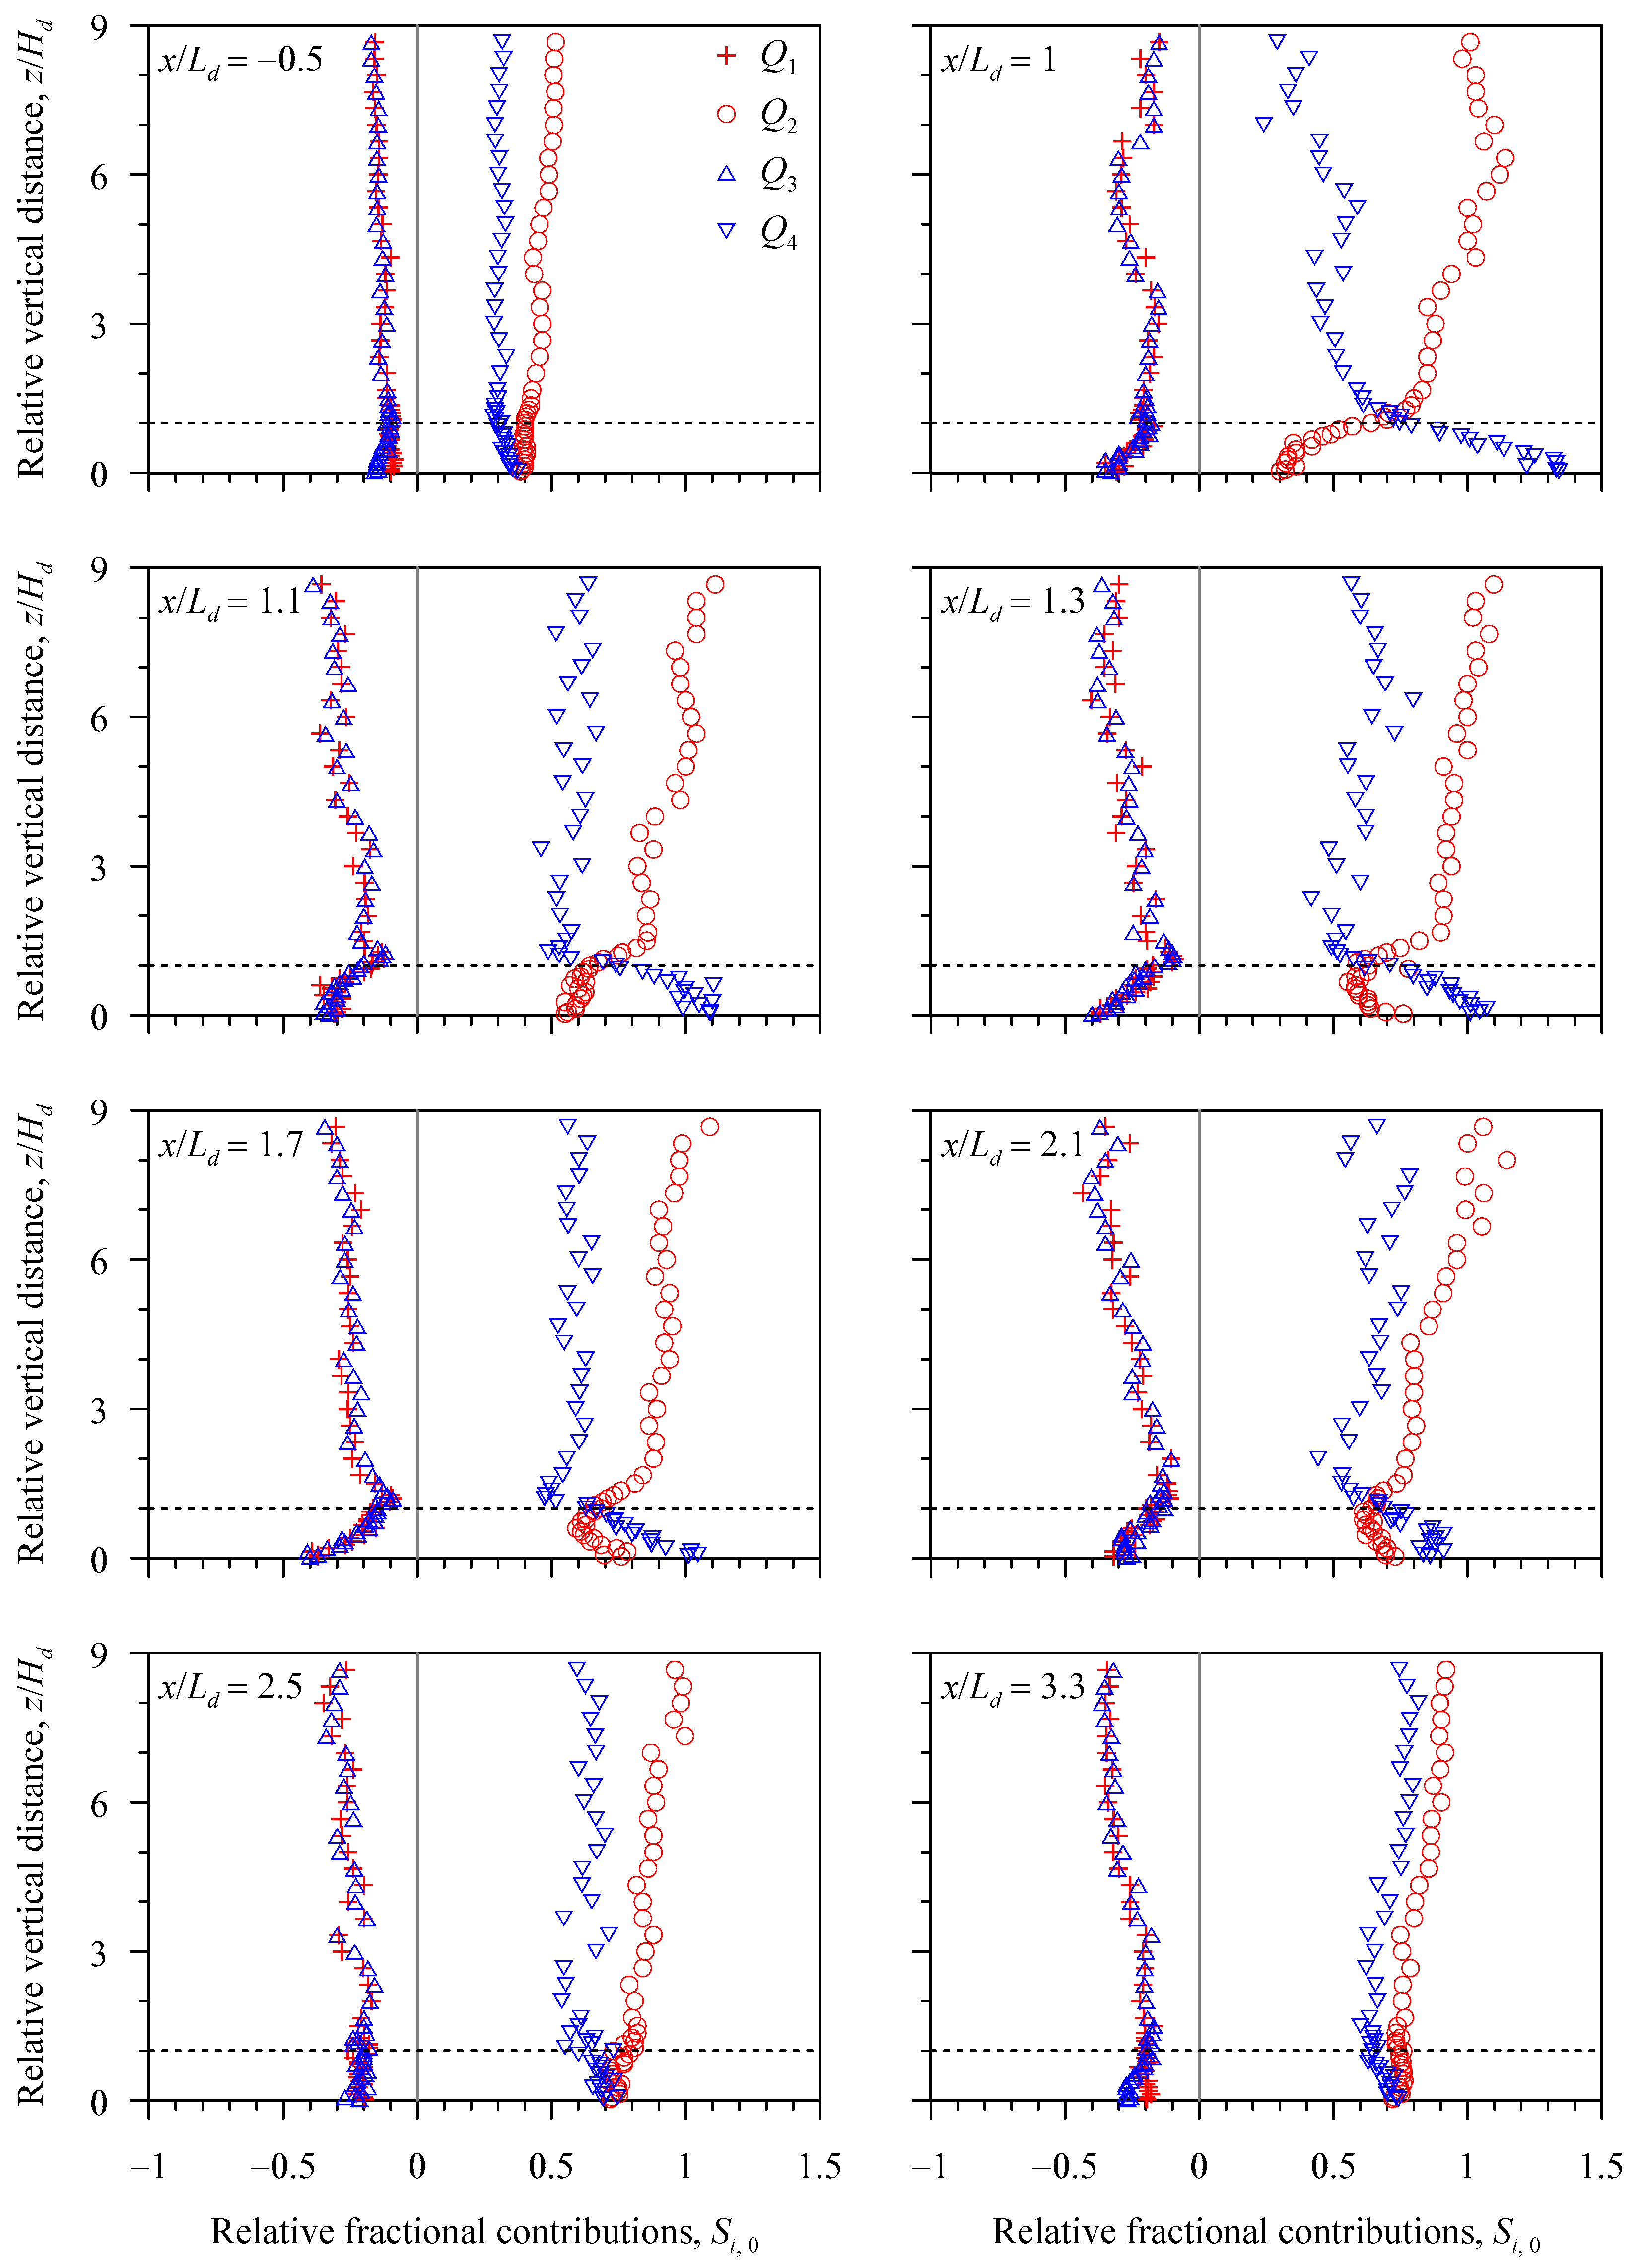
Figure 9 and
Figure 10 show the vertical profiles of
Si,0 at the upstream and various downstream relative streamwise distances
x/
Ld in Runs 1 and 2, respectively. Upstream of the dune (
x/
Ld = –0.5), the
Q2 and
Q4 events remain the most and the second-most contributing events, respectively, to the production of Reynolds shear stress. However, the
Q1 and
Q3 events are trivial across the flow depth. Downstream of the dune (
x/
Ld = 1 to 2.1), all the four events contribute largely below the dune crest with prevailing
Q4 events in the form of arrival of high-speed fluid streaks. At
x/
Ld = 2.5, contributions from the
Q2 and
Q4 events appear to be nearly equal below the crest. Further downstream (
x/
Ld = 3.3), the
Q2 events dominate over
Q4 events in the form of arrival of low-speed fluid streaks. It may be noted that above the crest (
z/
Hd > 1), the
Q2 events are the most contributing events regardless of
x/
Ld.
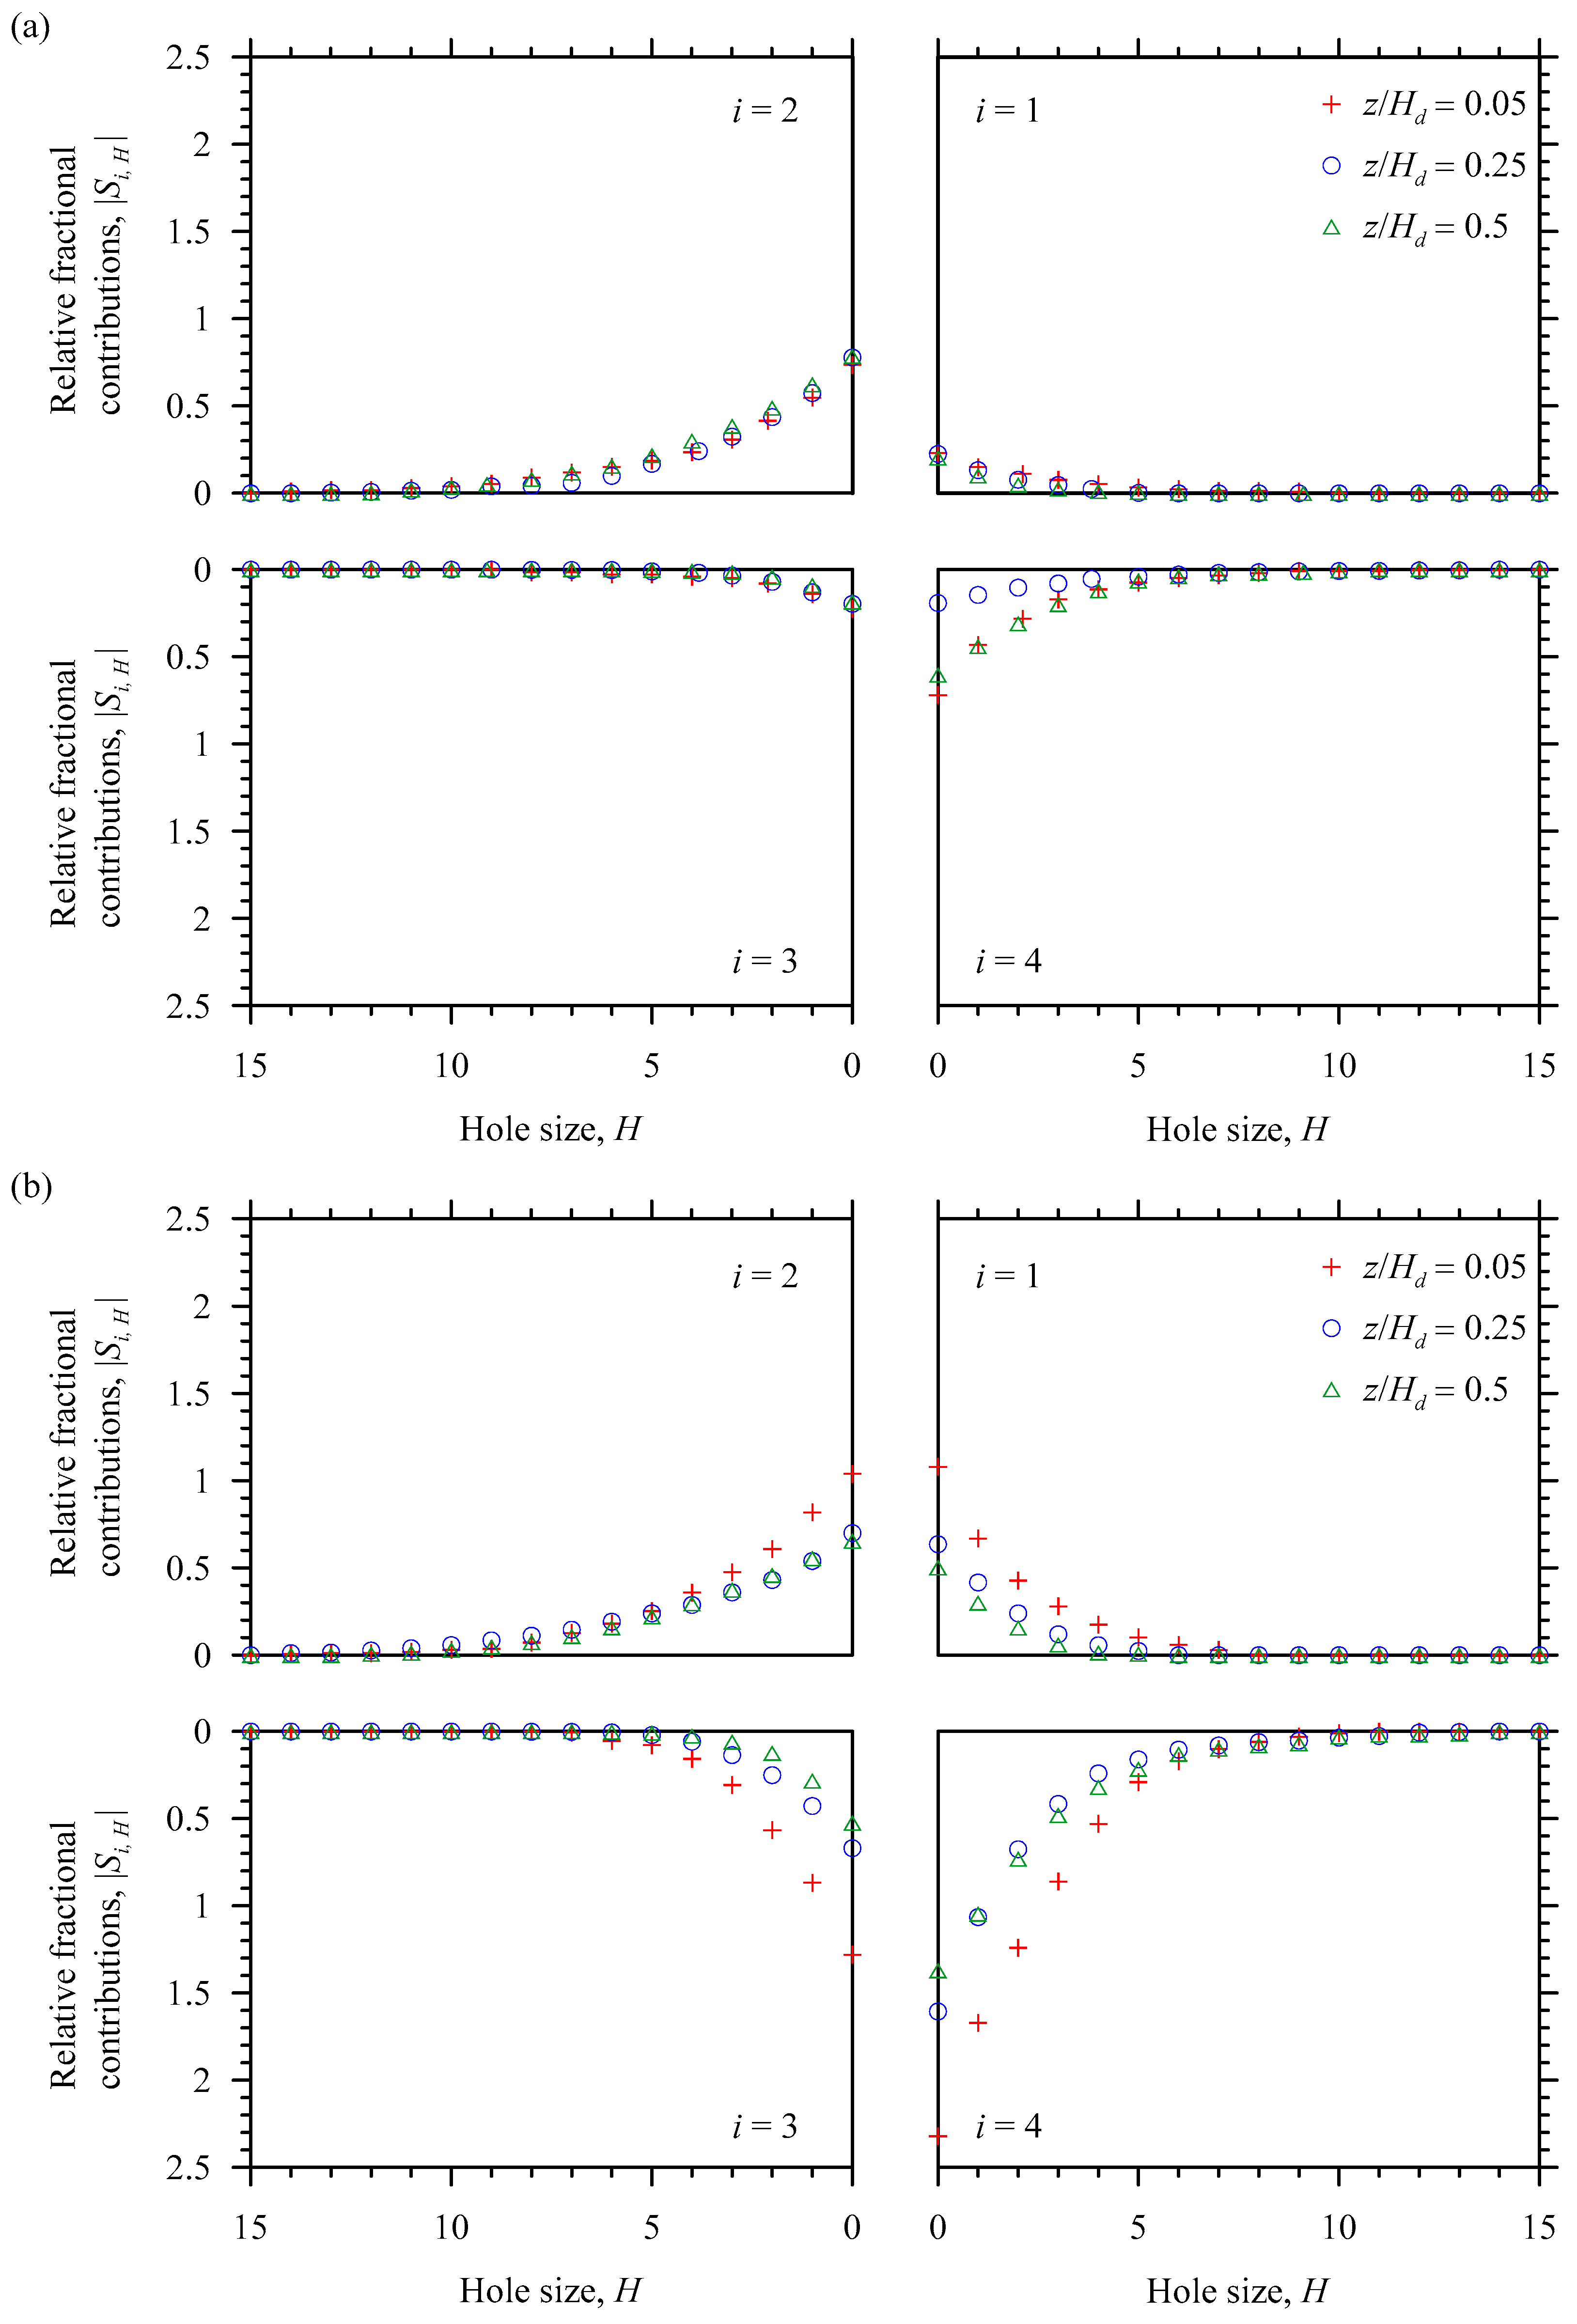
Figure 11a,b shows the variations of relative fractional contributions |
Si,H| with hole size
H in Run 1 for different relative vertical distances
z/
Hd (=0.05, 0.25 and 0.5) at relative streamwise distances
x/
Ld = –0.5 (uninterrupted upstream flow) and 1 (near-wake flow), whereas
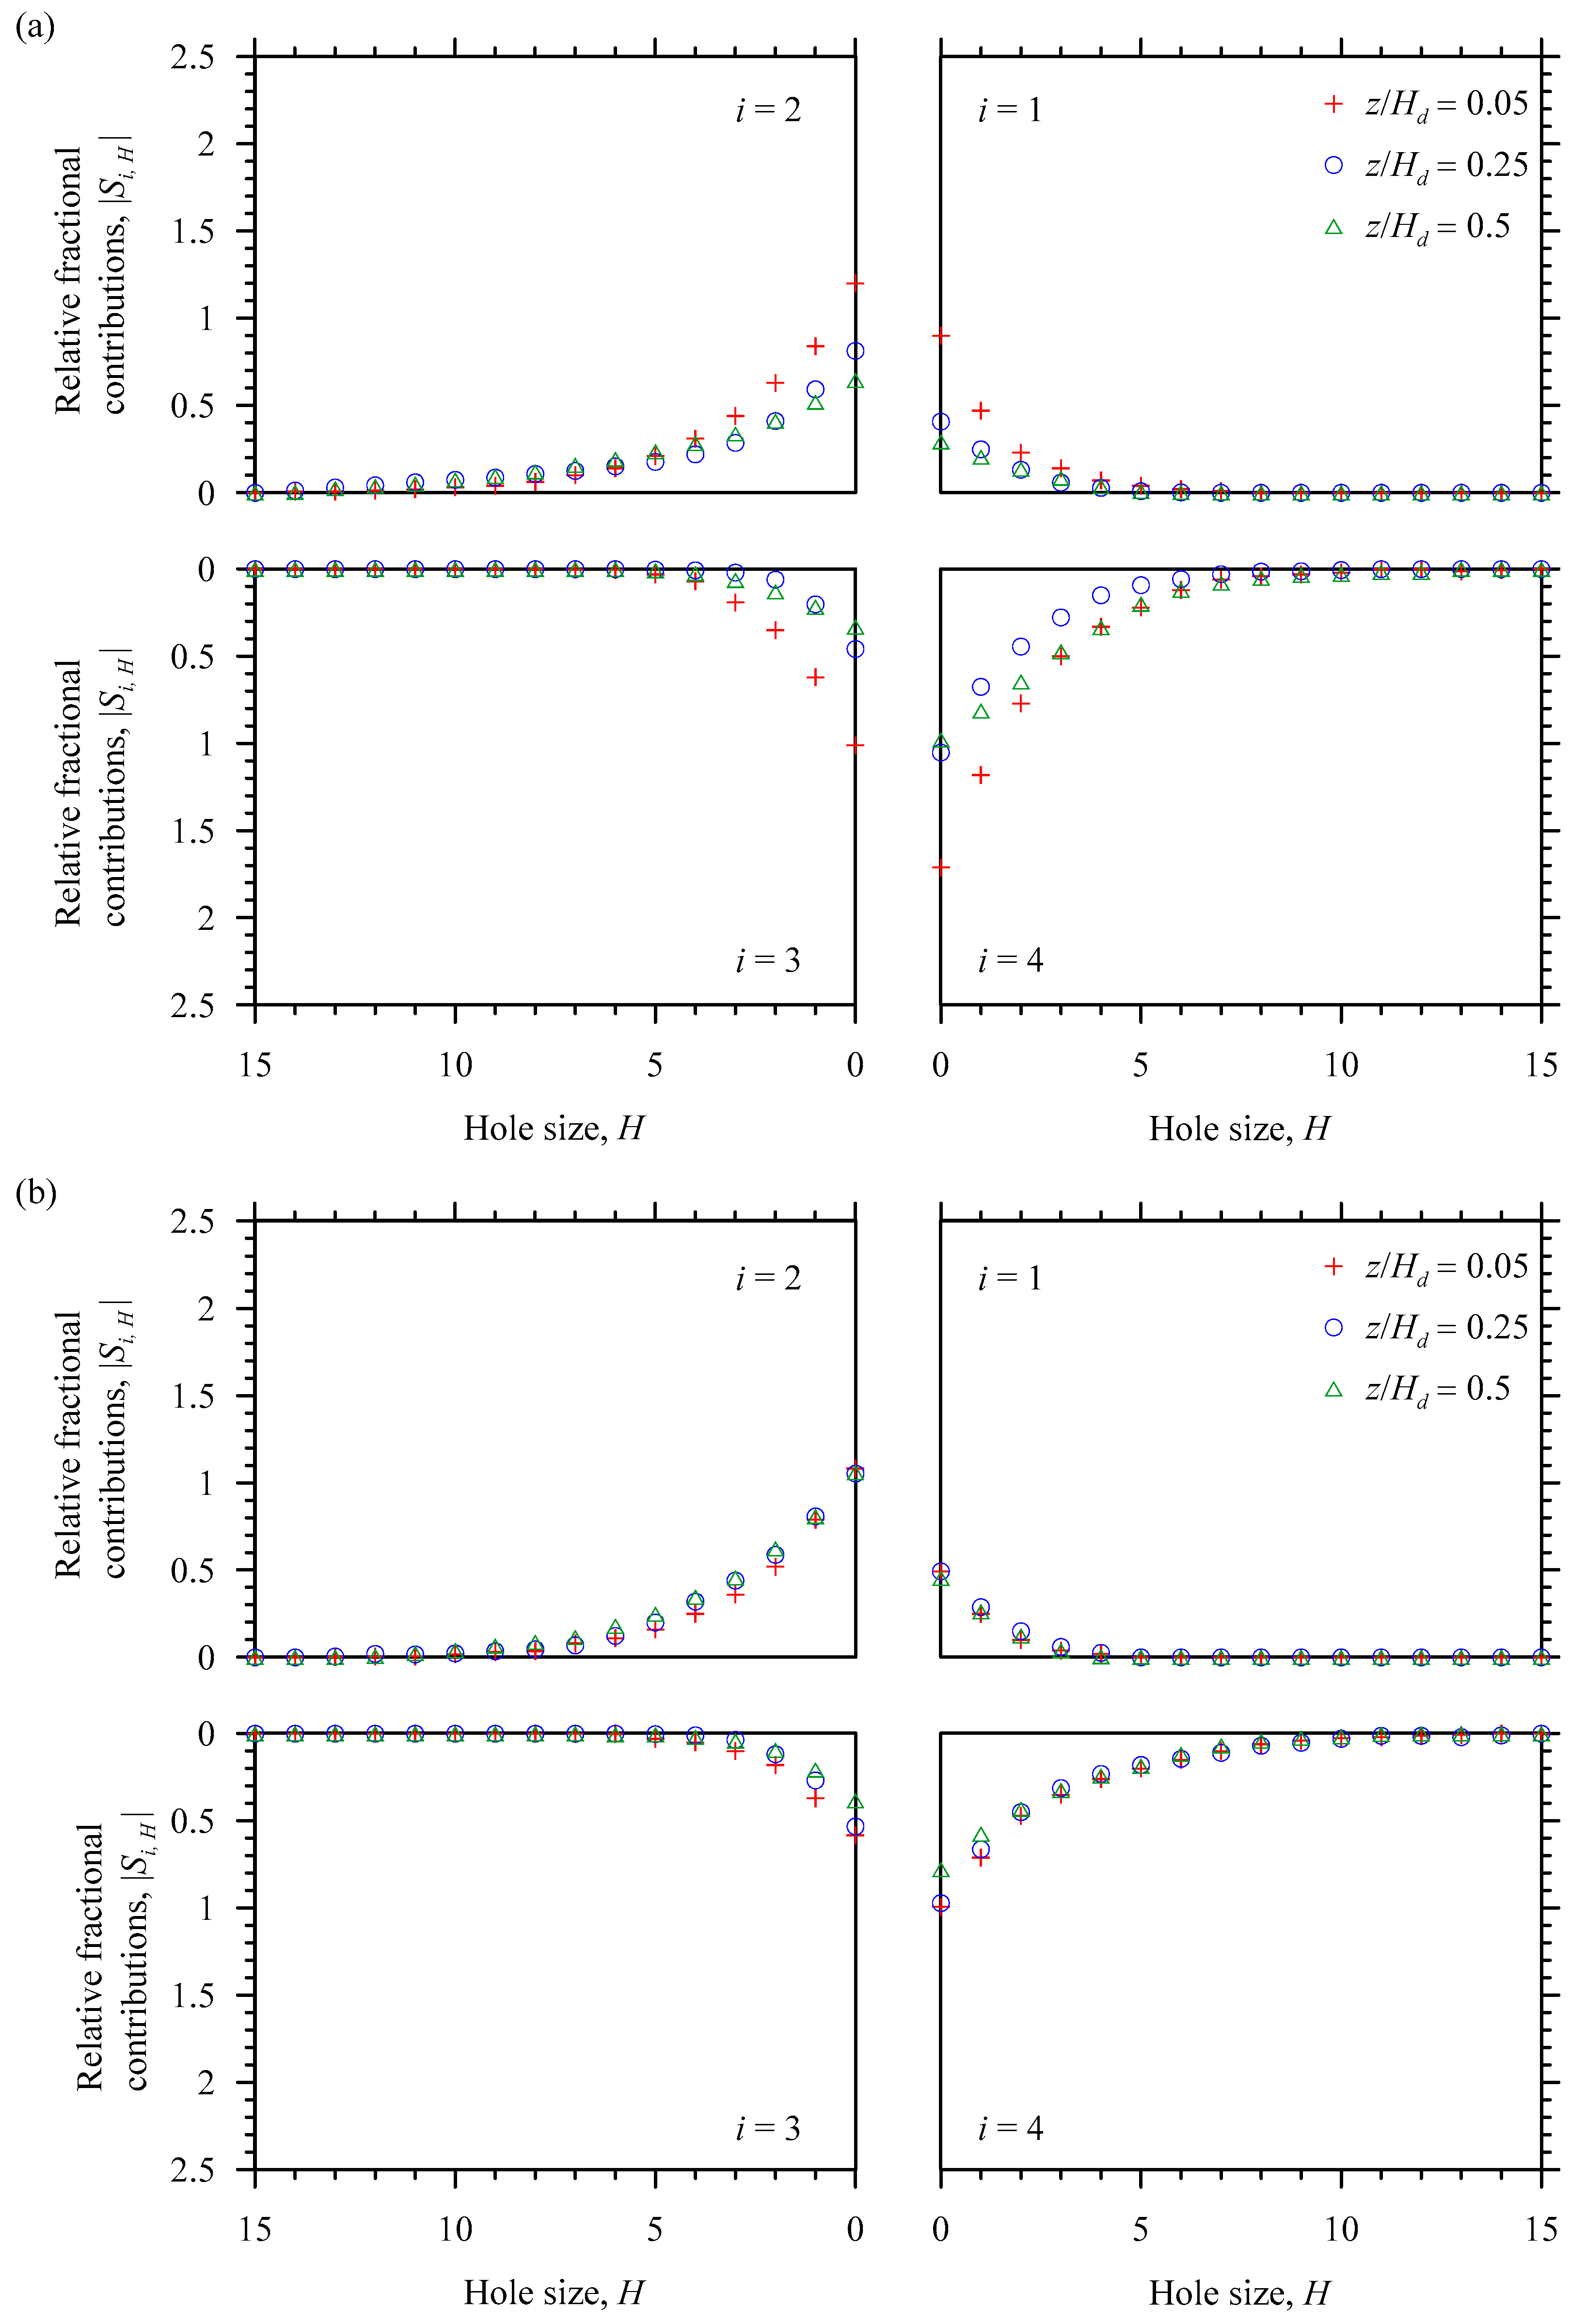
Figure 12a,b shows those at
x/
Ld = 1.7 (far-wake flow) and 3.3 (near to fully recovered flow). It appears that upstream of the dune (
x/
Ld = –0.5), the
Q1 and
Q3 events for
z/
Hd = 0.05 contribute minimally to the Reynolds shear stress production as compared to the
Q2 and
Q4 events. However, for
z/
Hd = 0.05, the pairs (
Q1,
Q3) and (
Q2,
Q4) are equal, indicating that they mutually cancel the dominance of each other. At
x/
Ld = –0.5, the
Q2 events remain dominant for
z/
D = 0.25 and 0.5. Immediate downstream of the dune (
x/
Ld = 1), the
Q1 and
Q3 events, for a given
z/
Hd, are smaller than
Q2 and
Q4 events. However, at the downstream, the
Q4 remain the most dominant events for
z/
Hd = 0.05, 0.25 and 0.5. At
x/
Ld = 1.7, these features remain similar to those at
x/
Ld = 1, but with relatively smaller
Q4 events. Far downstream of the dune (
x/
Ld = 3.3), the events, for a given
z/
Hd, follow the upstream trend. The contributions from the events are considerable for lower values of
H. In essence, for
H ≥ 12, all the events are trivial at different streamwise and vertical distances.
6. Turbulent Kinetic Energy Budget
The turbulent kinetic energy budget reads
tP =
ε +
tD +
pD −
vD, where
tP is the turbulent kinetic energy production rate (= –
∂
ū/∂
z),
ε is the turbulent kinetic energy dissipation rate,
tD is the turbulent kinetic energy diffusion rate (= ∂
fkw/∂
z),
fkw is the vertical flux of turbulent kinetic energy,
pD is the pressure energy diffusion rate [=
ρ−1∂(
)/∂
z],
p′ is the pressure fluctuations,
vD is the viscous diffusion rate (=
ν∂
2k/∂
z2) and
k is the turbulent kinetic energy. In an open channel flow, the
vD is insignificant compared to other components of the turbulent kinetic energy budget. In this study, Kolmogorov second hypothesis was applied to determine the
ε from the velocity power spectra [
28]. The
tP and
tD were determined from the experimental data, whereas the
pD was obtained from the relationship
pD =
tP −
ε −
tD. In nondimensional form, the set of variables (
tP, ε, tD, pD) is expressed as (
TP,
ED,
TD,
PD) = (
tP,
ε, tD,
pD) × (
Hd/
).
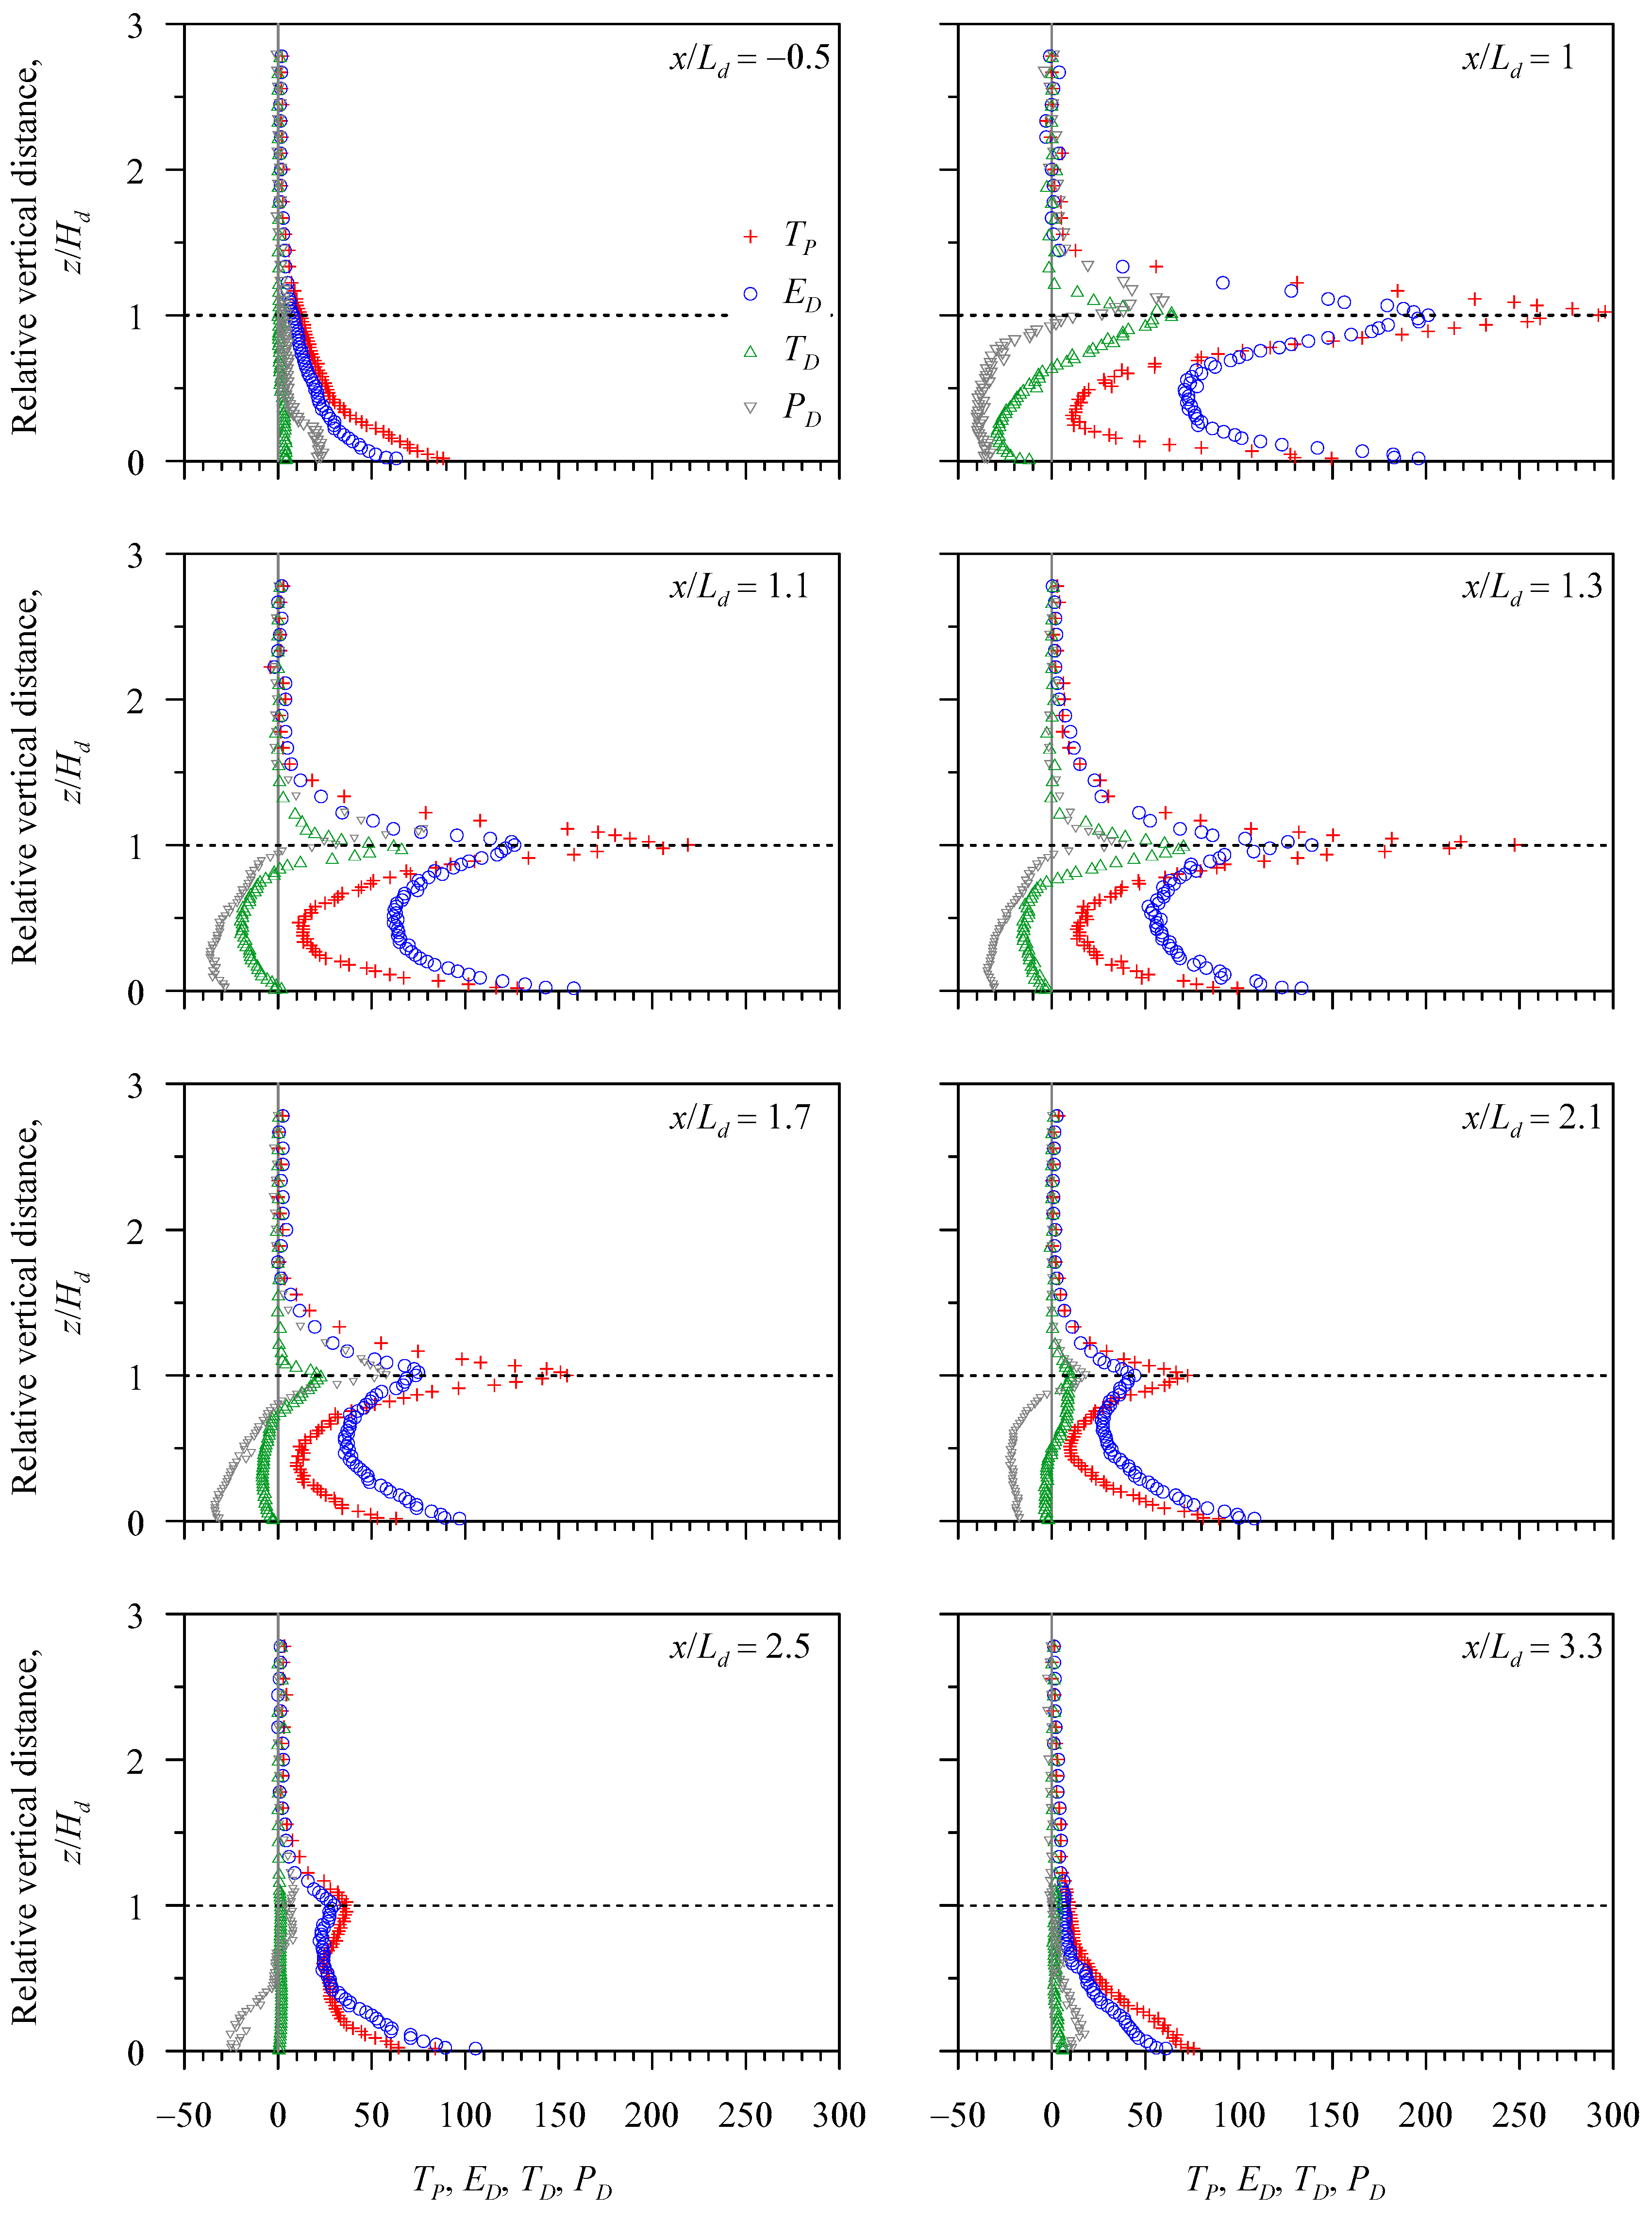
Figure 13 illustrates the vertical profiles of nondimensional components of the turbulent kinetic energy budget at various relative streamwise distances
x/
Ld in Run 1. Upstream of the dune (
x/
Ld = –0.5), all the components of the turbulent kinetic energy budget, in the near-bed flow zone, are positive with a sequence of magnitude
TP >
ED >
PD >
TD and then, they reduce with an increase in relative vertical distance
z/
Hd. Above the dune crest (
z/
Hd > 1), they are quite small. Downstream of the dune (
x/
Ld = 1 to 2.1), the peaks of
TP,
ED,
PD and
TD are found to appear at the crest. In the near-bed flow zone, the
TP and
ED are positive, whereas the
PD and
TD are negative for
x/
Ld = 1 to 2.1. Downstream of the dune, the absolute values of
TP,
ED,
PD and
TD decrease with an increase in
x/
Ld. In particular, at
x/
Ld = 3.3, the
TP,
ED,
PD and
TD profiles are almost similar to those of the undisturbed upstream flow at
x/
Ld = −0.5.
7. Reynolds Stress Anisotropy
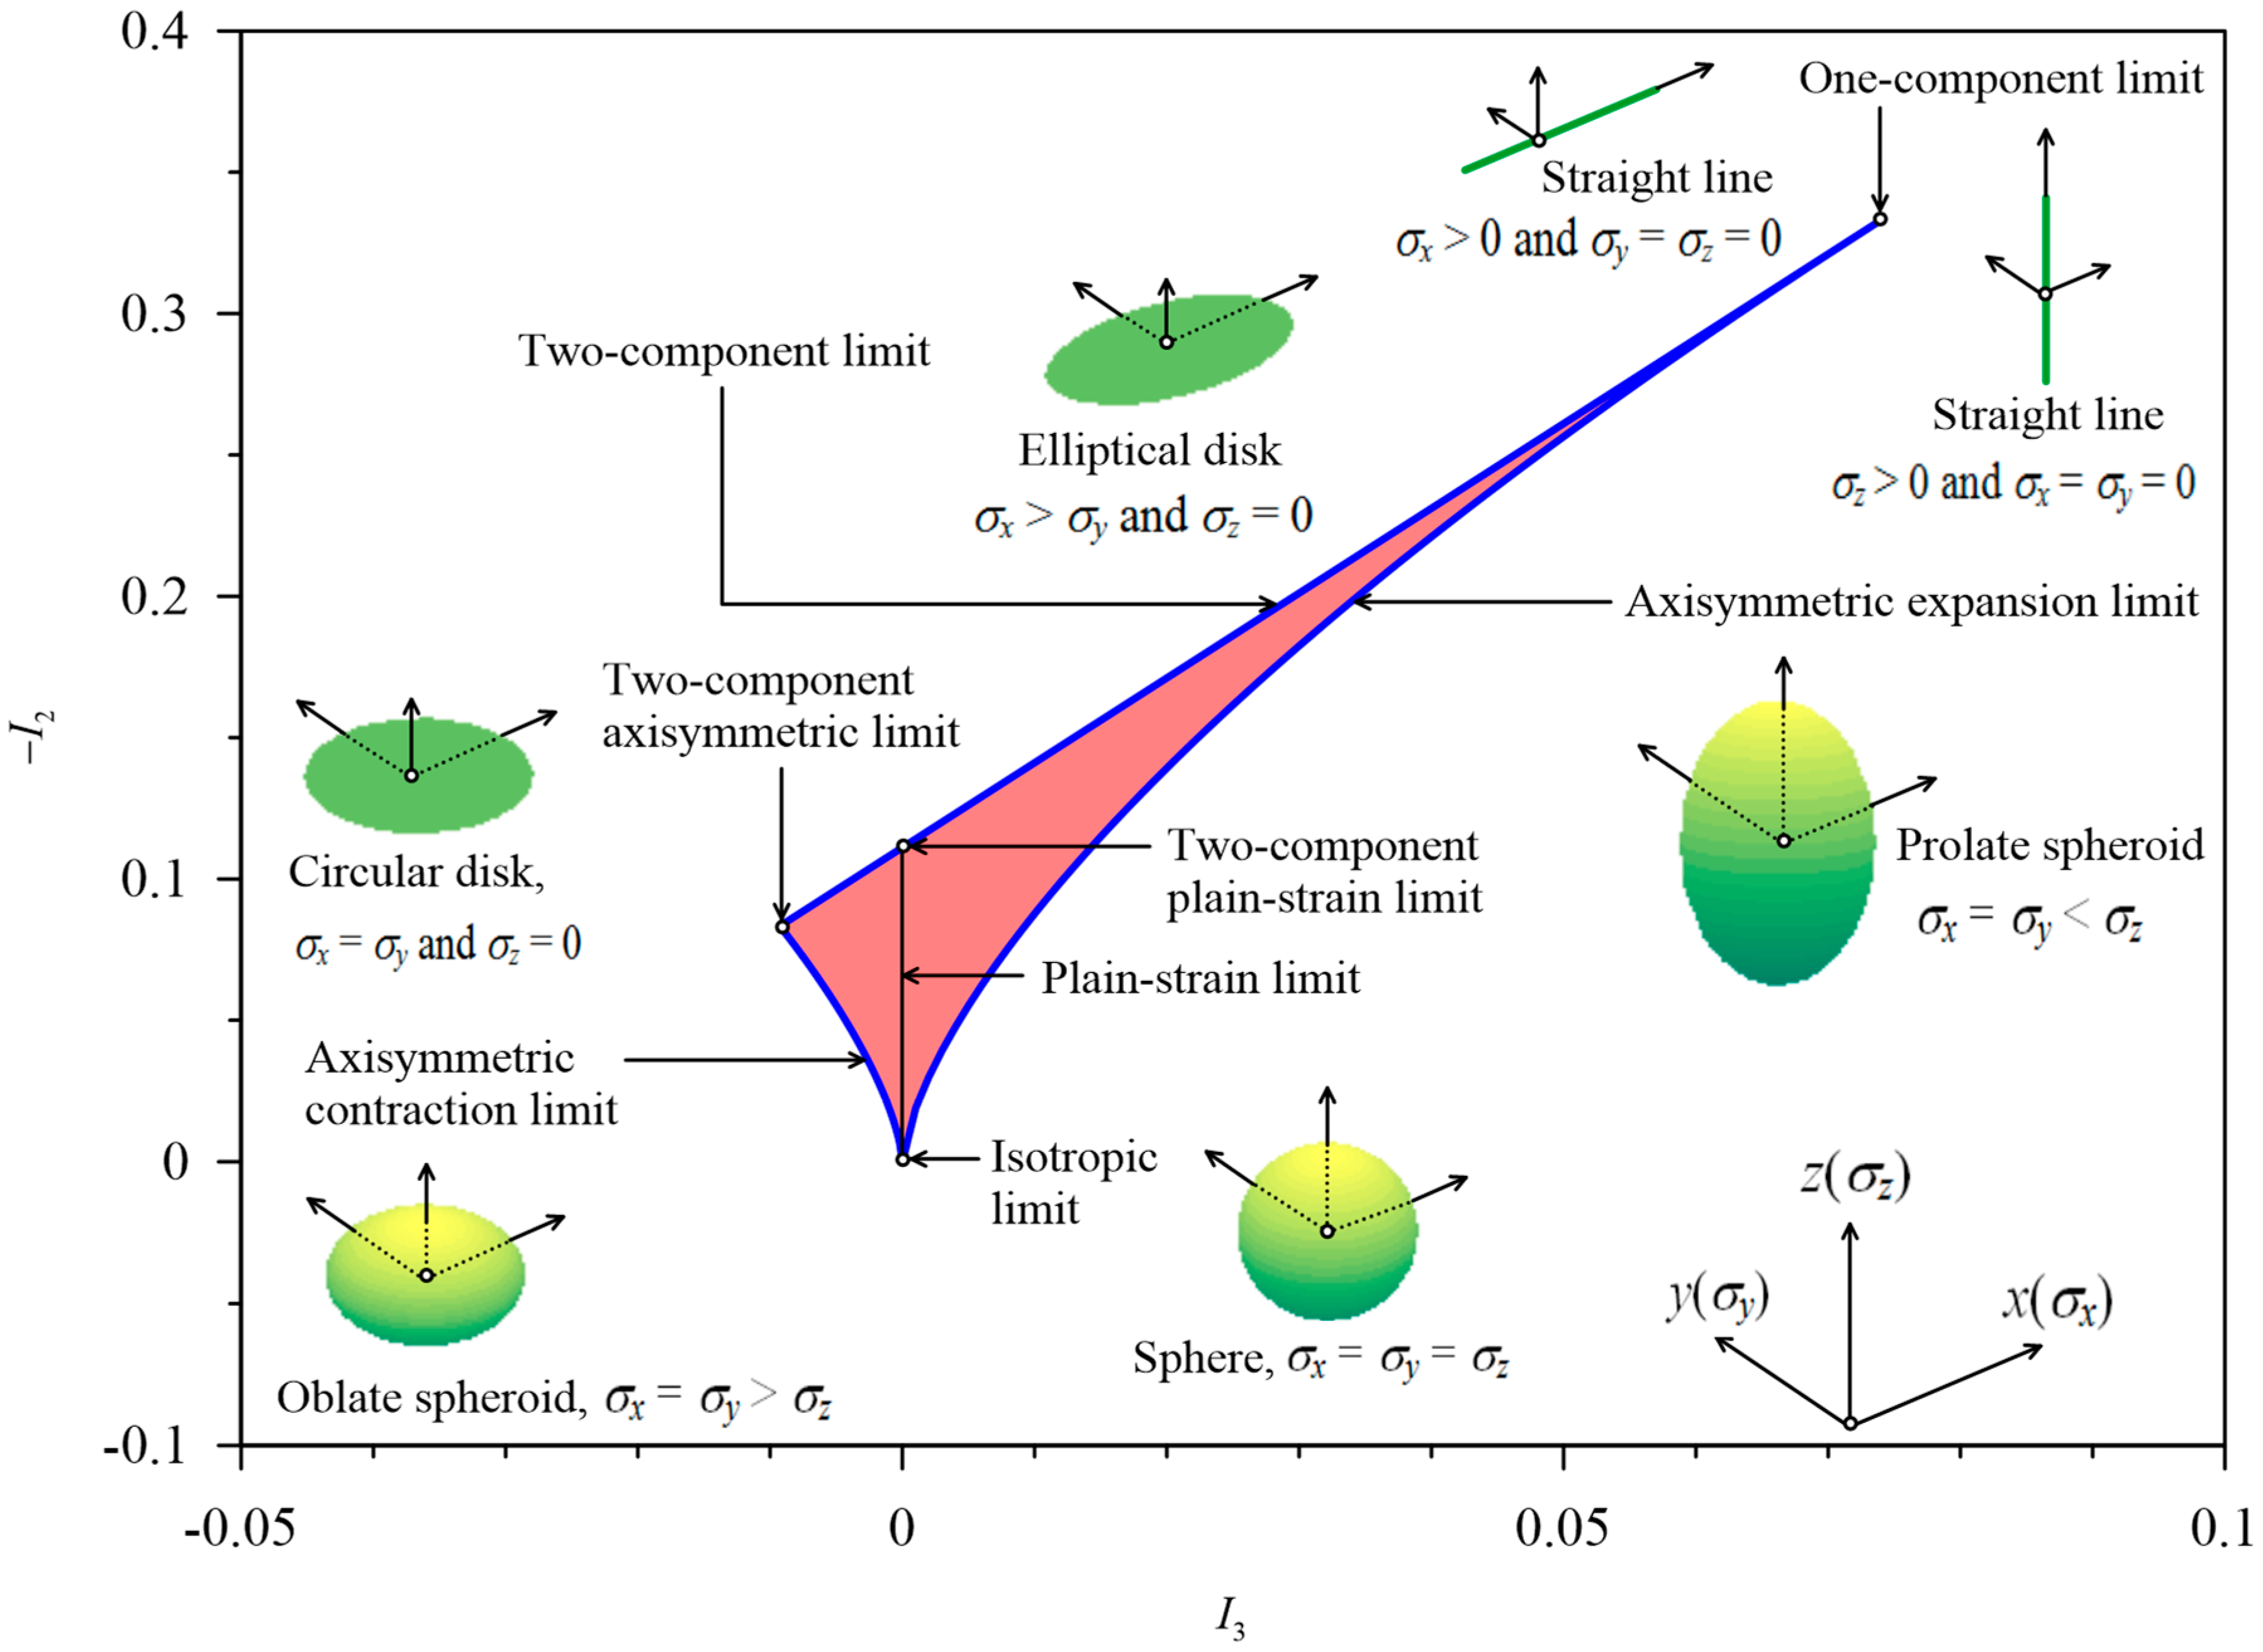
An isotropic turbulence refers to an idealized condition, where the velocity fluctuations at a specific point remain invariant to the rotation of axes. In a lucid way, this condition indicates that the Reynolds normal stresses are identical (σx = σy = σz), where (σx, σy, σz) = (, , ). By contrast, in an anisotropic turbulence, the Reynolds normal stresses are dissimilar, because the velocity fluctuations [= (u′, v′, w′) for i = (1, 2, 3)] are directionally preferred.
The
Reynolds stress anisotropy tensor bij is expressed as
bij =
/(2
k) −
δij/3, where
δij is the Kronecker delta function [
δij(
i =
j) = 1 and
δij(
i ≠
j) = 0]. To ascertain the degree and the nature of anisotropy, the second and third principal invariants,
I2 (= –
bijbij/2) and
I3 (=
bijbjkbki/3), respectively, are introduced. The Reynolds stress anisotropy is determined by plotting –
I2 as a function of
I3, called the
anisotropy invariant map (AIM). In an AIM, the possible turbulence states are confined to a triangle, called the
Lumley triangle (
Figure 14). The left-curved and the right-curved boundaries of the Lumley triangle, given by
I3 = ±2(−
I2/3)
3/2, are symmetric about the
plane-strain limit (
I3 = 0). In addition, the top-linear boundary of the Lumley triangle obeys
I3 = −(9
I2 + 1)/27. Dey et al. [
29] envisioned the Reynolds stress anisotropy from the perspective of the shape of ellipsoid formed by the Reynolds normal stresses (
σx,
σy,
σz) in (
x,
y,
z). In an isotropic turbulence (
σx =
σy =
σz), the stress ellipsoid becomes a
sphere (
Figure 14). On the left-curved boundary, called the
axisymmetric contraction limit, one component of Reynolds normal stress is smaller than the other two equal components (
σx =
σy >
σz), forming the stress ellipsoid an
oblate spheroid. On the left vertex, called the
two-component axisymmetric limit, one component of Reynolds normal stress disappears (
σx =
σy and
σz = 0) to make the stress ellipsoid a
circular disc (
Figure 14). On the right-curved boundary, called the
axisymmetric expansion limit, one component of Reynolds normal stress is larger than the other two equal components (
σx =
σy <
σz), making the stress ellipsoid a
prolate spheroid (
Figure 14). Further, on the top-linear boundary, called the
two-component limit, one component of Reynolds normal stress is larger than the other component together with a third vanishing component (
σx >
σy and
σz = 0), producing the stress ellipsoid an
elliptical disk. The point of intersecting of the plain-strain limit and the two-component limit is called the
two-component plain-strain limit. Moreover, on the right vertex of the Lumley triangle, called the
one-component limit [(
σx > 0,
σy =
σz = 0) or (
σx =
σy = 0,
σz > 0)], only one component of Reynolds normal stress sustains to make the stress ellipsoid a
straight line (
Figure 14).
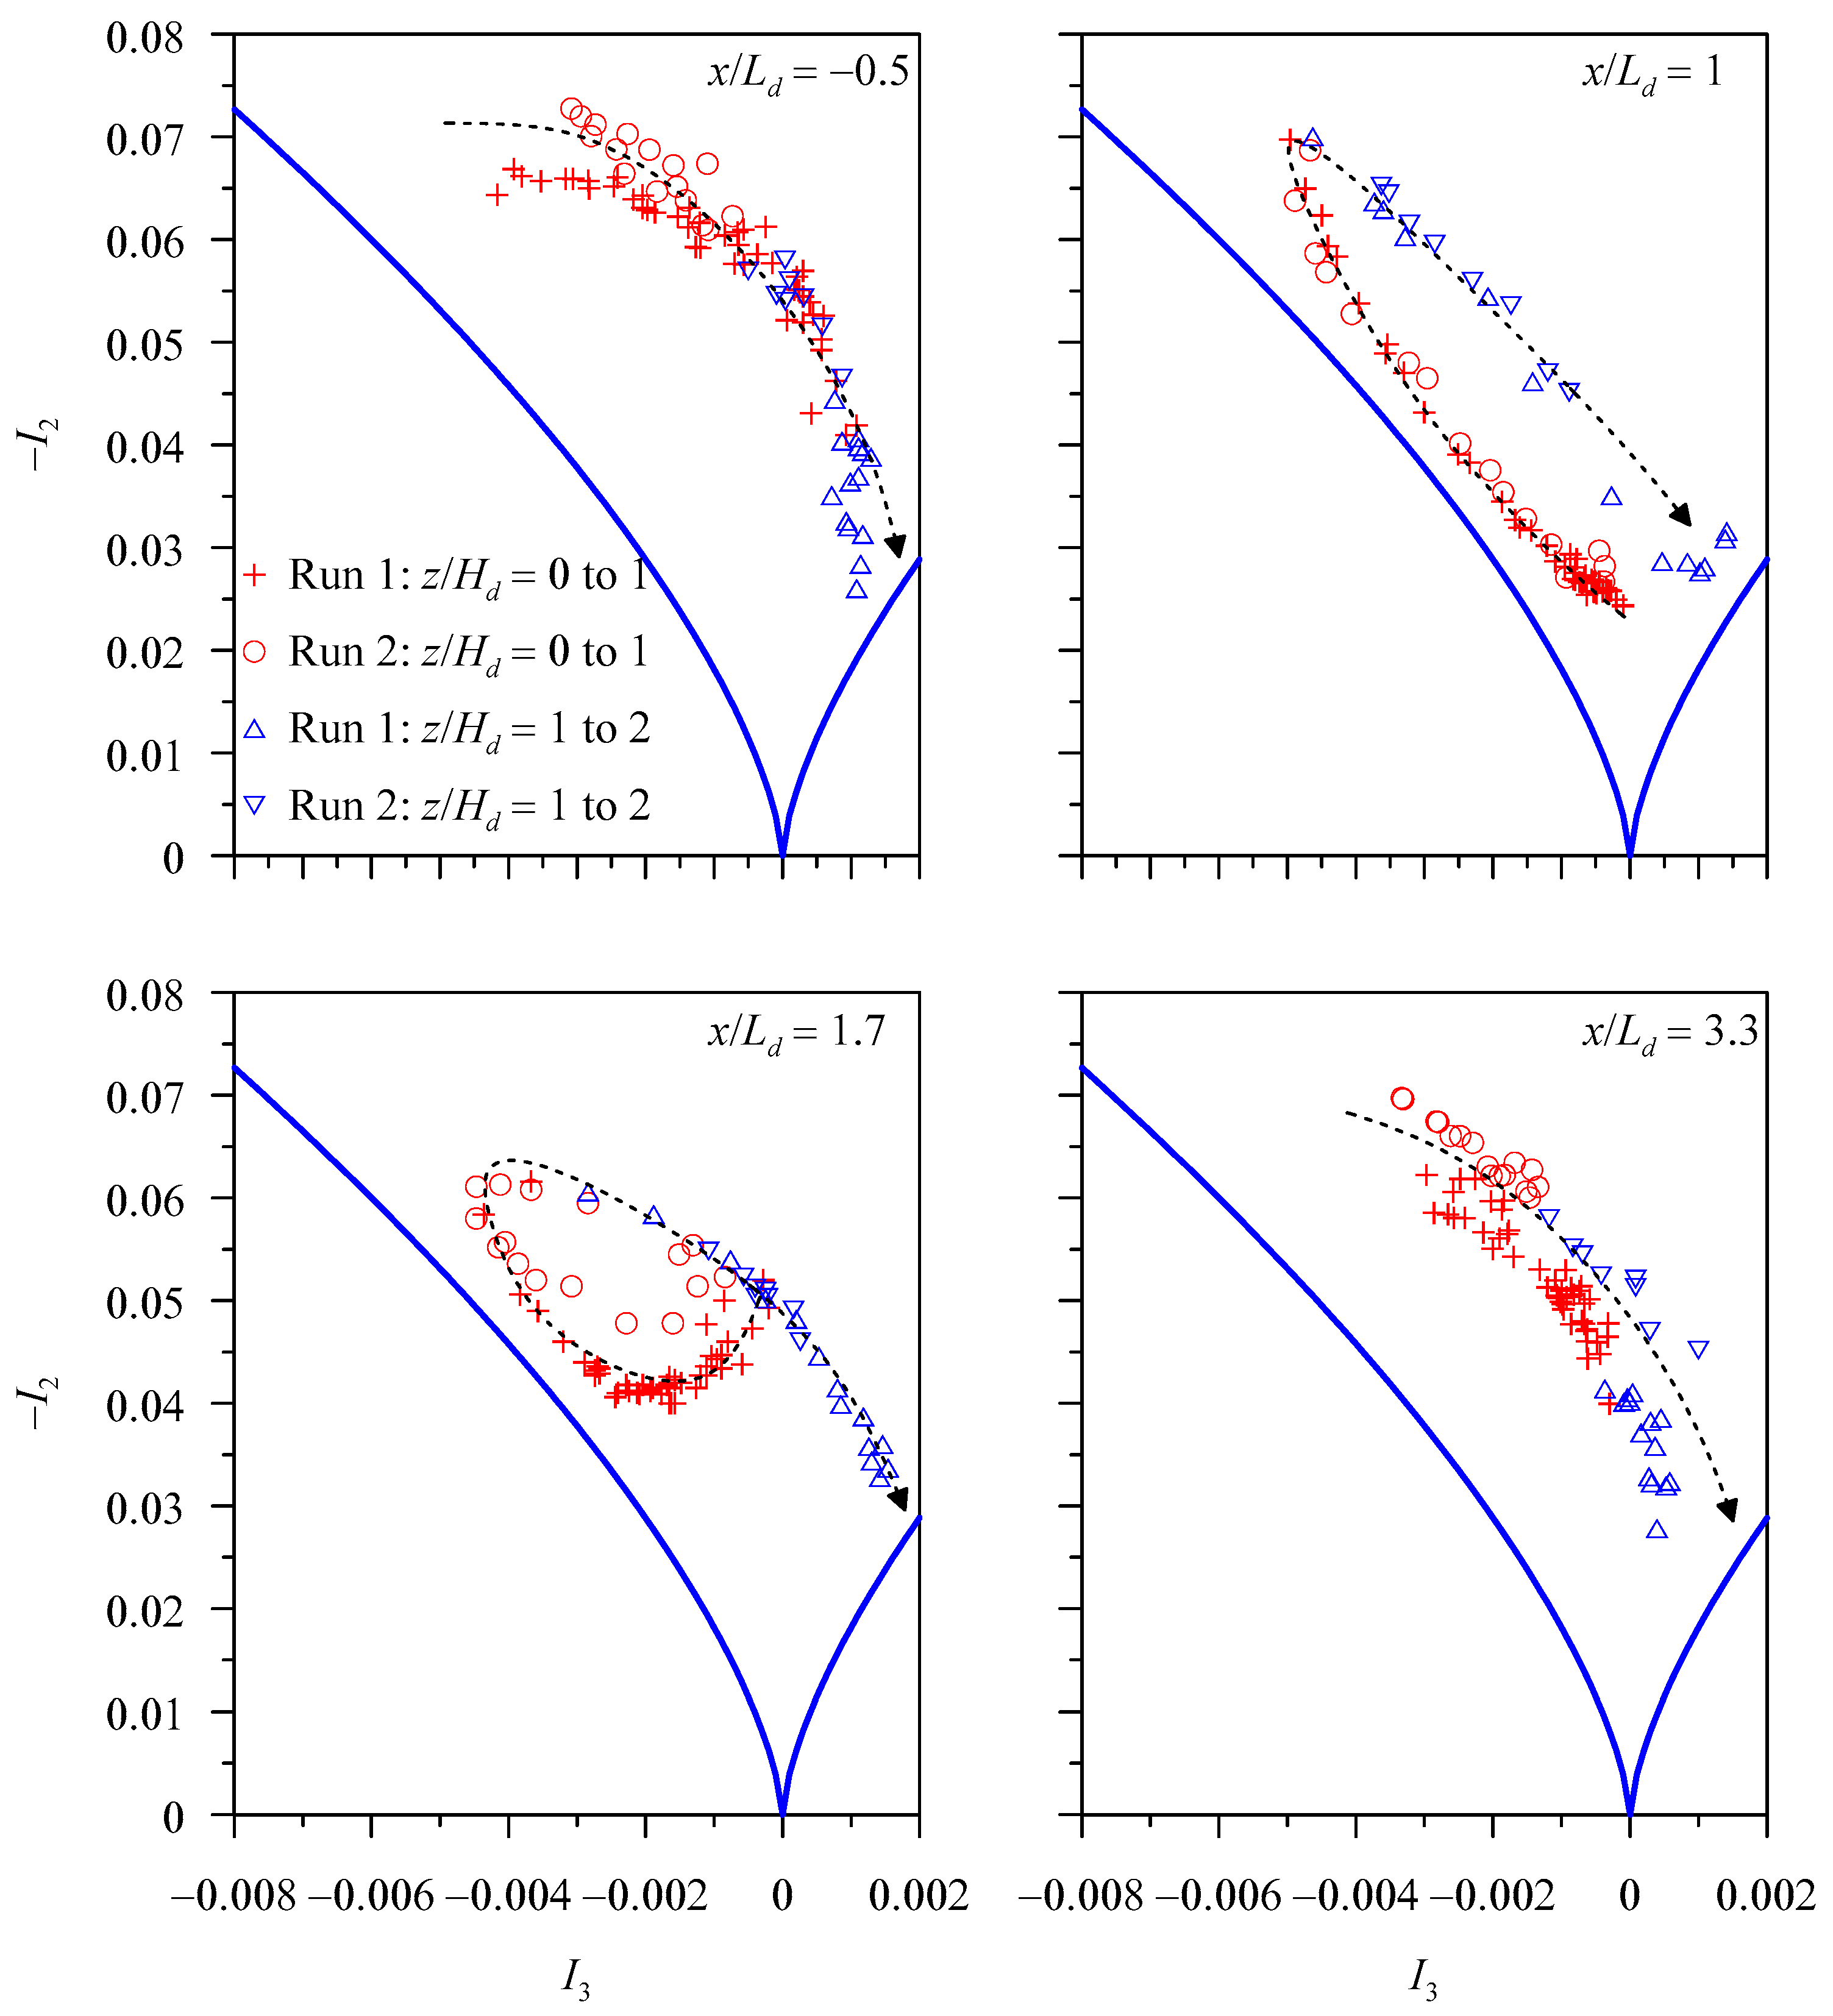
Figure 15 shows the data plots of −
I2 versus
I3, confined to the AIM boundaries, at various relative streamwise distances
x/
Ld in Runs 1 and 2. Upstream of the dune (
x/
Ld = −0.5), the data plots initiate from the near left vertex, moving toward the bottom cusp, and then, with an increase in vertical distance, they cross the plain-strain limit to shift toward the right-curved boundary. The trends of the data plots for both Runs 1 and 2 are almost monotonic. The AIM of the upstream indicates that as the vertical distance increases, the turbulence anisotropy tends to reduce to a quasi-three-dimensional isotropy. Immediate downstream of the dune, the data plots tend to create a stretched loop inclined to the left-curved boundary. However, below the dune crest (
z/
Hd < 1), the data plots in the near-bed flow zone initiate from the plain-strain limit and with an increase in vertical distance up to the crest, they shift toward the left vertex following the left-curved boundary. This suggests that the turbulence anisotropy has an affinity to a two-dimensional isotropy. Above the crest, the data plots turn toward the right and as the vertical distance increases further, they move toward the bottom cusp following the left-curved boundary. This demonstrates that the turbulence anisotropy tends to reduce to a quasi-three-dimensional isotropy. Further downstream (
x/
Ld = 1.7), the size of the loop created by the data plots reduces forming a tail, and the loop disappears at
x/
Ld = 3.3, signifying a recovery of the undisturbed upstream trend. It therefore appears that that below the crest, the turbulence has an affinity to a two-dimensional isotropy, whereas above the crest, a quasi-three-dimensional isotropy prevails.
From the perspective of the shape of stress ellipsoid,
Figure 15 shows that below the dune crest, an oblate spheroid axisymmetric turbulence is predominant in the wall-wake flow. The line of plain-strain limit (
I3 = 0) is touched by the curve through the data plots in the near-bed flow zone. This reveals that the axisymmetric contraction to the oblate spheroid enhances as the vertical distance increases up to the crest. However, the axisymmetric contraction to oblate spheroid lessens with a further increase in vertical distance above the crest.
8. Conclusions
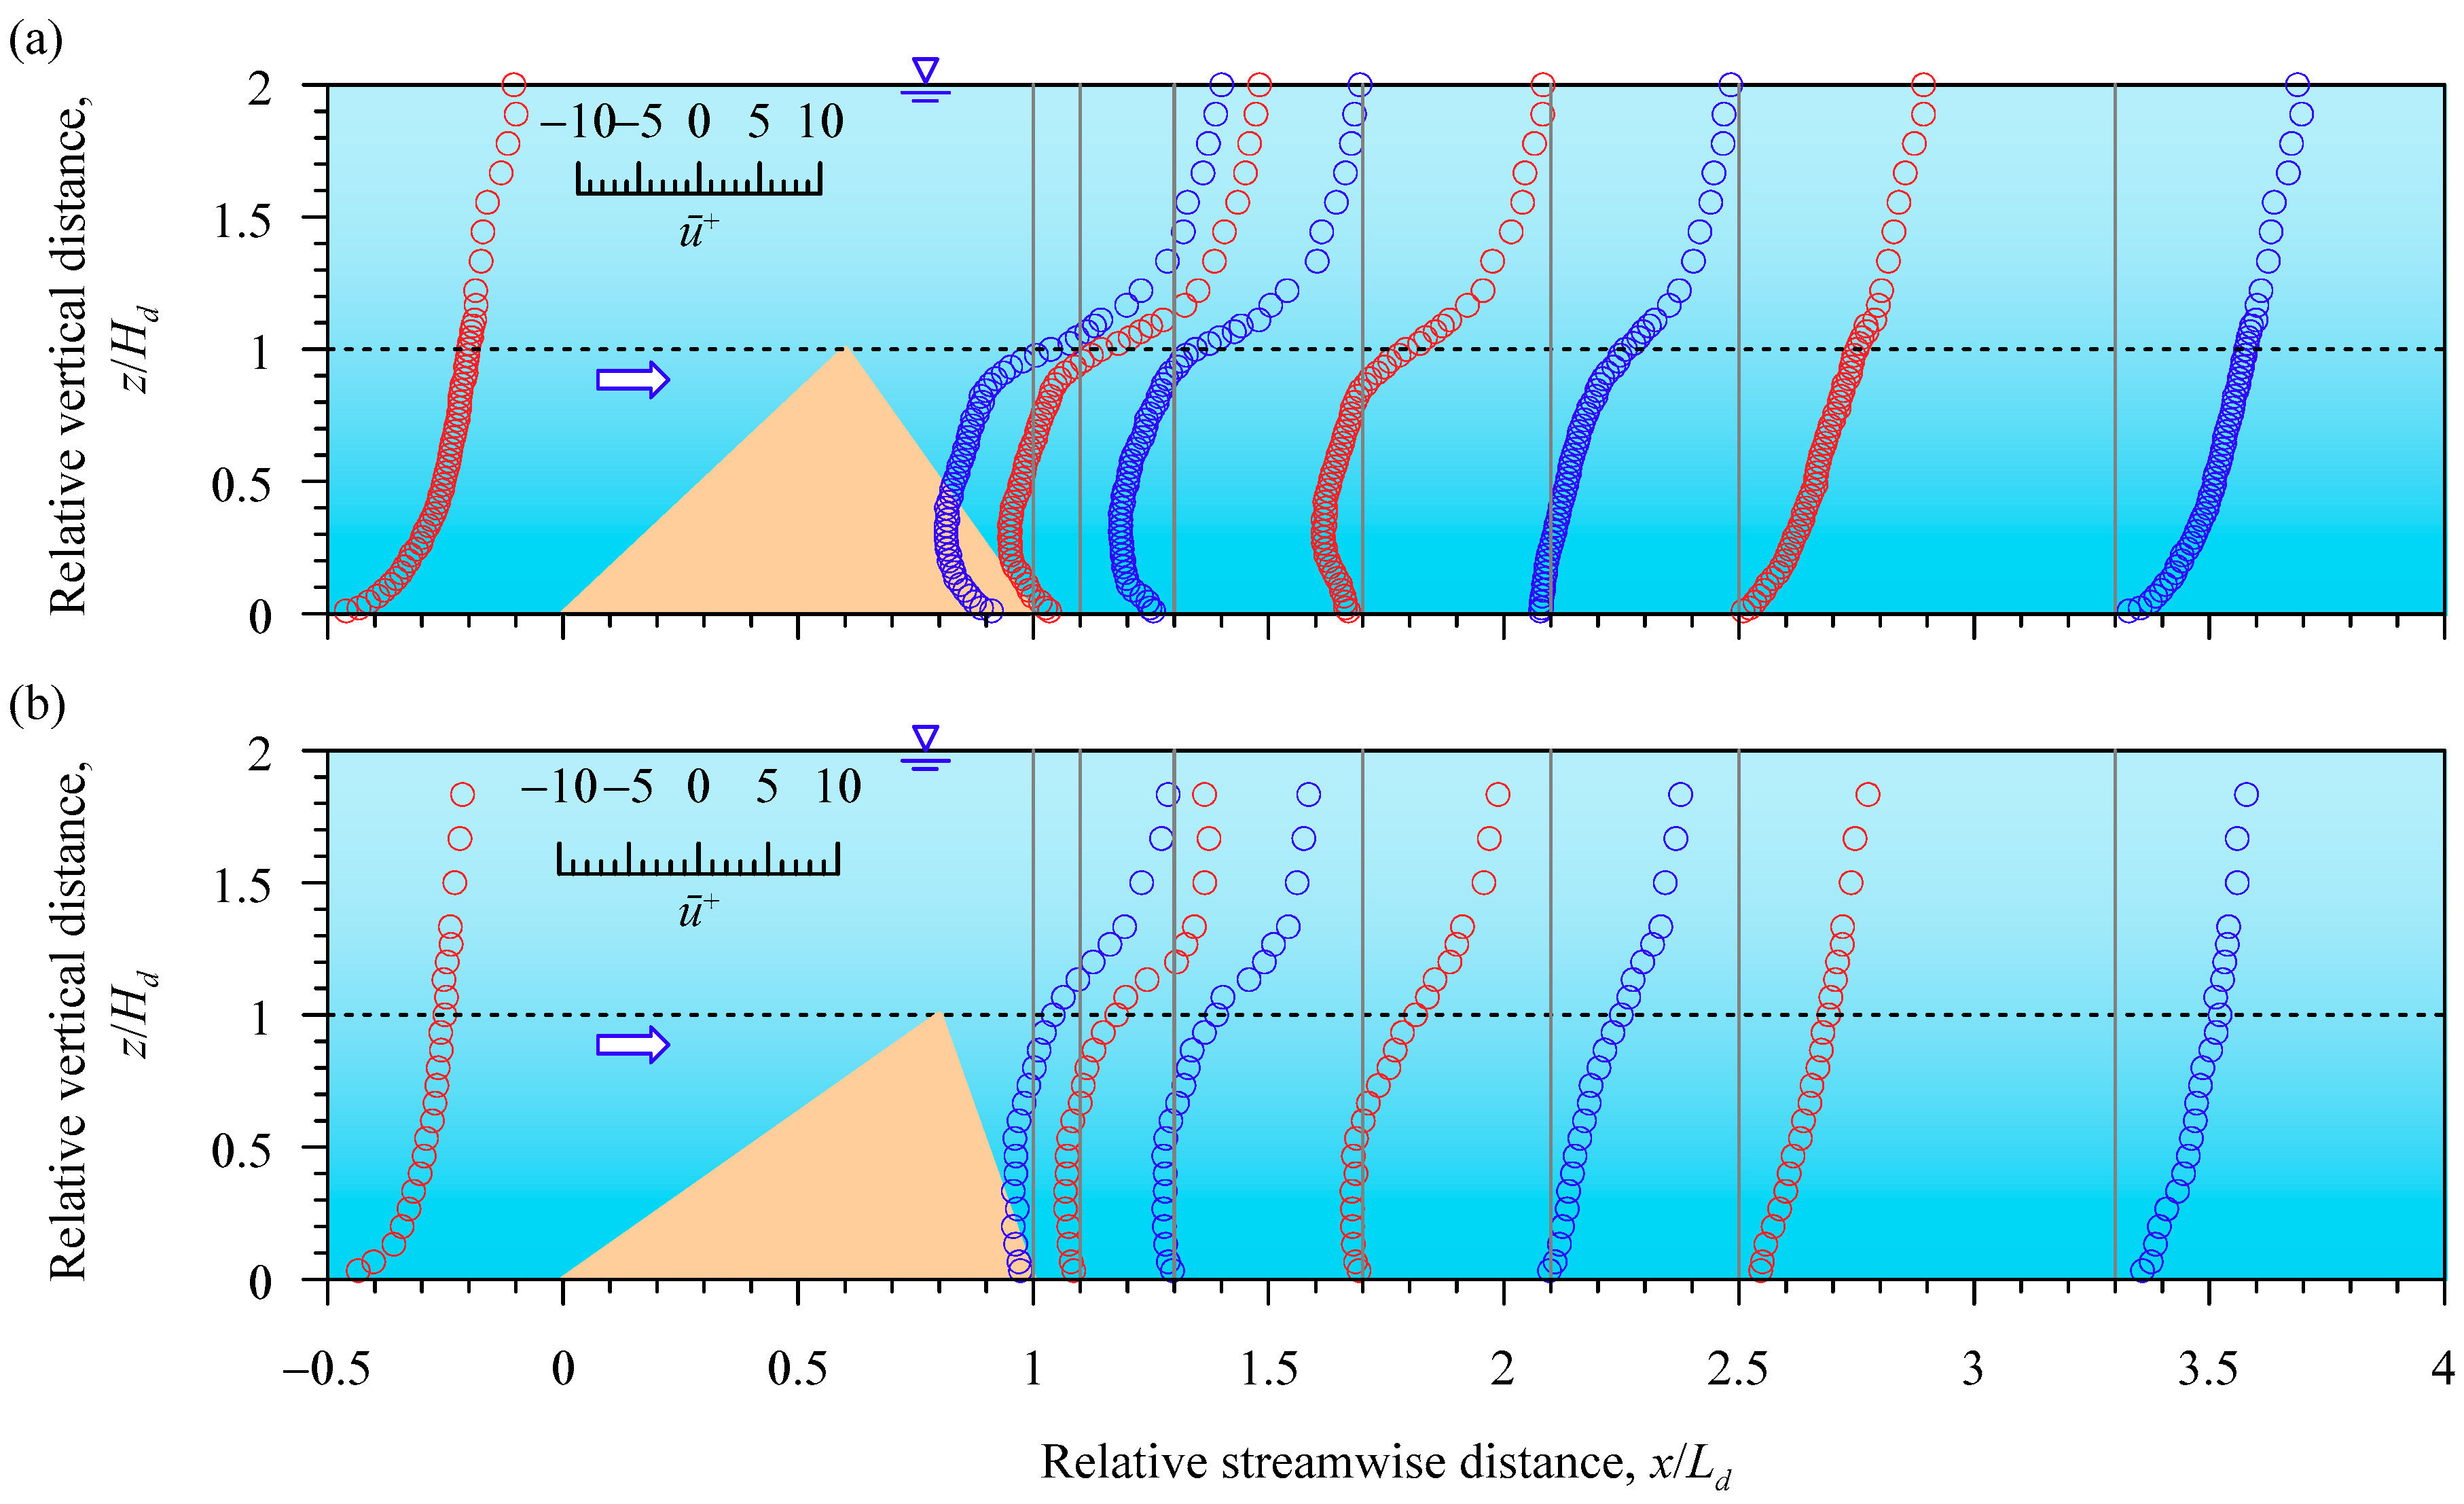
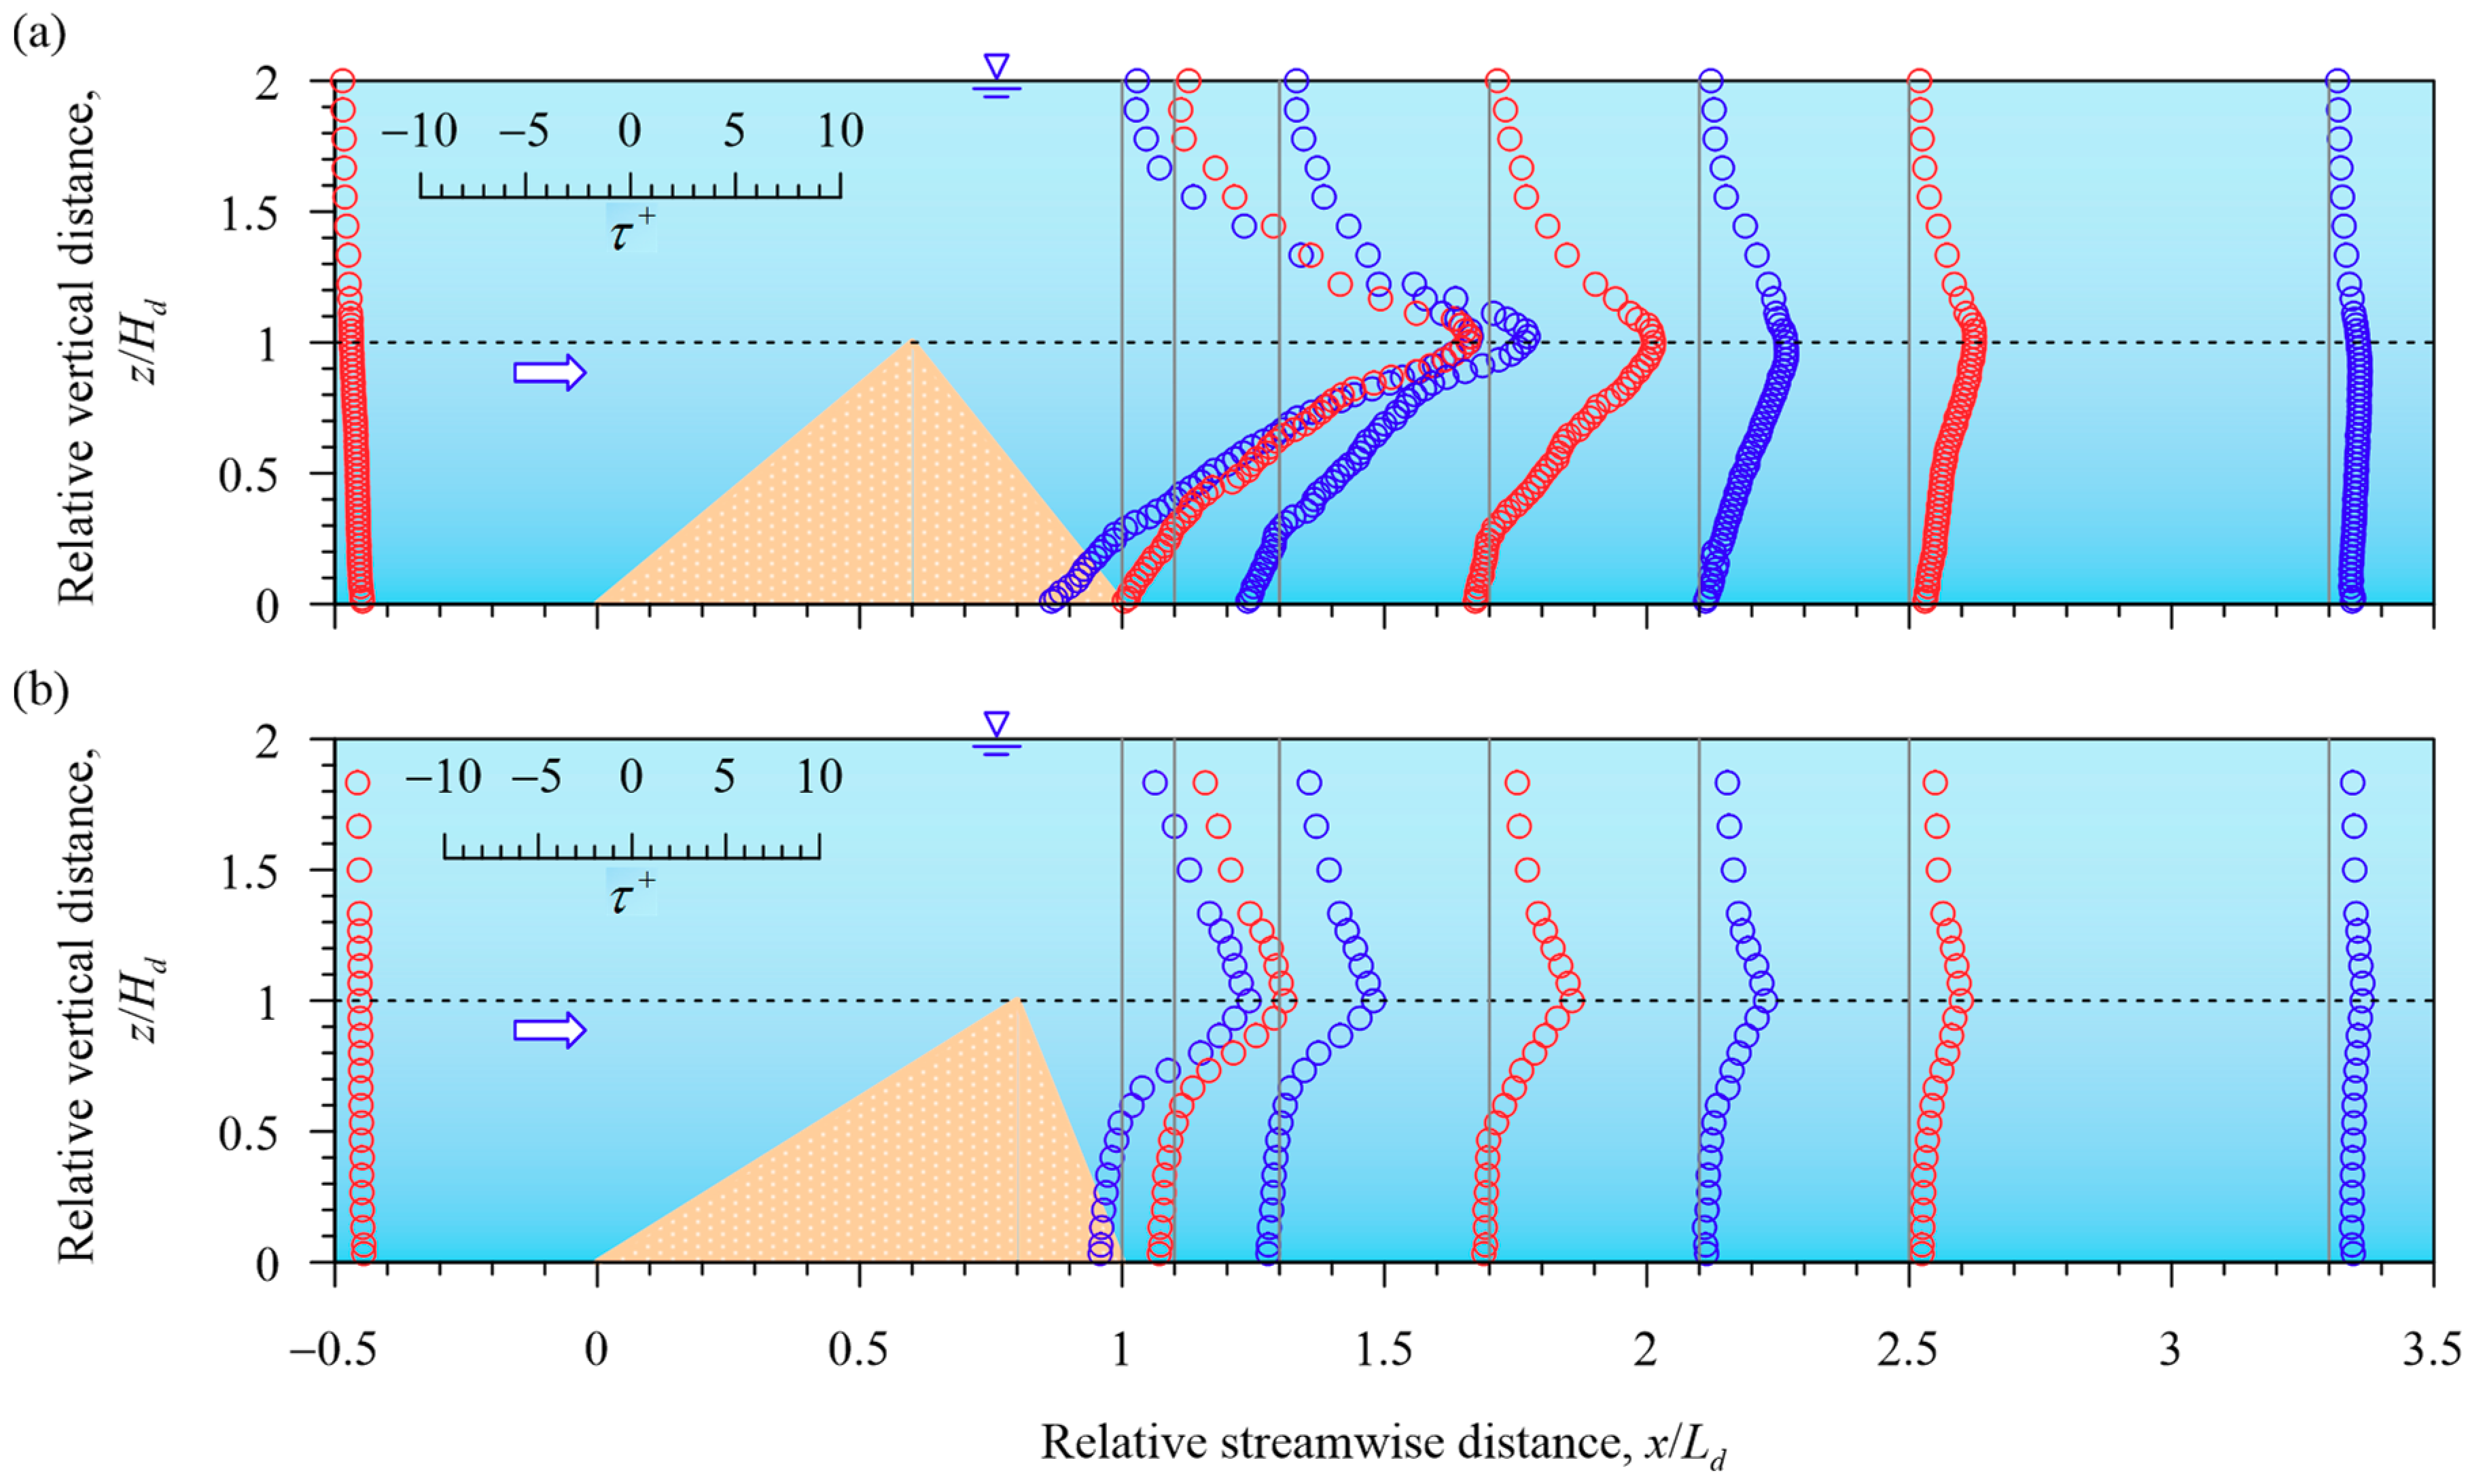
This study puts into focus the turbulence in wall-wake flow downstream of an isolated dunal bedform. The vertical profiles of streamwise flow velocity reveal that the near-wake flow zone extends up to 1.7 times the dune length, whereas the streamwise flow velocity profile follows the undisturbed upstream velocity profile beyond 3.3 times the dune length. The Reynolds shear stress in the wall-wake flow is affected by the dune up to a vertical distance of 1.75 times the dune height and a streamwise distance of 2.5 times the dune length. The third-order moment of velocity fluctuations reveal that downstream of the dune, a streamwise acceleration having a downward flux prevails below the dune crest, whereas a streamwise deceleration having an upward flux persists above the crest. Below the crest, the sweeps are found to be the predominant events, whereas above the crest, the ejections are the major events. The components of the turbulent kinetic energy budget reveal an amplification of the magnitudes of the turbulent parameters, which attain their maximum peaks at the crest. The anisotropy invariant maps show that the data plots in the wall-wake flow start from the plain-strain limit in the near-bed flow zone, shifting toward the left vertex of the Lumley triangle up to the crest to show an affinity to a two-dimensional isotropy. Above the crest, the data plots show an affinity to a quasi-three-dimensional isotropy.
In essence, this study advances the current understanding of flow and turbulence characteristics in wall-wake flow downstream of an isolated dunal bedform. The experimental results provide guidance to numerical simulations of wall-wake flow. In addition, this study may be helpful, at least qualitatively, to simulate the mobile-bed flow downstream of a dunal bedform.
