Article

Influence of Three Gorges Dam on Downstream Low Flow

1
Joint Innovation Center for Modern Forestry Studies, Nanjing Forestry University, Nanjing 210037, China
2
State Key Laboratory of Hydrology-Water Resources and Hydraulics Engineering, Hohai University, Nanjing 210098, China
3
Collaborative Innovation Center on Forecast and Evaluation of Meteorological Disaster, School of Geographical Sciences, Nanjing University of Information Science &Technology, Nanjing 210044, China
4
National Climate Center, China Meteorological Administration, Beijing 100081, China
*
Author to whom correspondence should be addressed.
Water 2019, 11(1), 65; https://doi.org/10.3390/w11010065
Submission received: 30 November 2018 / Revised: 26 December 2018 / Accepted: 26 December 2018 / Published: 2 January 2019
(This article belongs to the Special Issue Hydrological Processes under Environmental Change)

Abstract

:
Low flow is a seasonal phenomenon which is a critical requirement for utilization of water resources under rapidly changing environmental conditions. The operation of the Three Gorges Dam (TGD) has had a great influence on downstream low flow in the Yangtze River. In this paper, the characteristics of low flow in the main Yangtze River were analyzed during the dry season before and after the TGD operation during the period of 1956–2016. The results show that: (1) the operation of the TGD has changed the spatial and temporal distribution of streamflow in the middle and lower Yangtze River and the annual mean low flow has increased significantly since the TGD operation. (2) The operation of the TGD could advance the date of the start of dry season in the lower Yangtze River basin. The start dates of the dry season in the Yichang, Hankou and Datong stations were advanced by 14 days, 10 days and 9 days, respectively. (3) The minimum streamflow in the lower Yangtze River has increased notably since the TGD operation. The minimum streamflow was raised by 42.91%, 13.76% and 6.06% at the Yichang, Hankou and Datong stations, respectively. The increasing number of dams in the world might have the potential effects on downstream low flow. More attention should be paid to investigating the influence of dam construction on low flow in rivers all over the world.

1. Introduction

Low flow is critical to water resources development and management [1]. In fact, low flow is a major component of a flow state of rivers and a seasonal phenomenon that usually occurs at the same time every year [2,3]. A lot of effort has been made to assess the impacts on low flow. Sun et al. [4] pointed out that low flow could aggravate the shortage of water resources in the dry season, which restricted the development of the social economy to a certain extent. Low flow can cause drinking water difficulties, too [5]. Lu [6] discovered that low flow might affect the security of the industrial, agricultural and daily water intake along a river and lake. Zhang [7] reported that low flow could affect the safety and efficiency of waterway transportation because many marine accidents such as collisions and groundings happened during the dry season. Some researchers found that low flow could change water quality as well [8]. Luke et al. [9] discovered that the water quality guidelines on five sites of the Lower Murray River and Lower Lakes in South Australia during an extreme low flow period were significantly exceeded. Luke et al. [9] also found that low flow could result in longer water residence times and lead to lower water volumes, which often increased water temperatures. Low flow affects the amount of wetted habitat area and resource availability as well [10,11]. Extreme low flow may even change the connectivity of the habitat and turn streams to a sequence of isolated pools [12]. In addition, low flow provides better opportunities for algal growth [13,14,15,16]. Low flow also has potential influences on nutrient availability, instream primary production [17,18], and reduces the total biomass of aquatic insects sharply [19], along with decreases in aquatic biodiversity [13,20,21]. Overall, low flow could negatively affect socio-economic outcomes [22].
Classically, low flow is derived from ground or overland discharge from marshes, lakes, or melting glaciers [3]. Therefore, ice and snow melting have an influence on low flow [23,24,25,26]. For example, changes in snowmelt timing due to changes in temperatures could directly control the late summer low flow [27,28,29,30,31]. In addition, White [32] revealed that limestone, karst and dolomite rocks have the potential to decrease low flow. Infiltration characteristics of soils, vegetation types and topography will likely influence low flow, too [33]. Other than natural effects, low flow is affected by various anthropogenic impacts as well. For instance, groundwater abstractions, afforestation and deforestation were discovered to have a major impacts on low flow in many catchment experiments [3,34,35,36,37,38,39,40]. Apart from indirect anthropogenic impacts, removing water straight from or adding water to the creeks can change the low flow too [3]. Moreover, dams could increase the frequent occurrence of low flow [41]. Non-aquatic vegetation can invade the low flow channel due to the decrease of low water discharges caused by the construction of dams [42,43].
A global database showed that most of the large river systems in the world has been and divided by huge dams [44]. Botter et al. [45] reported that the operation of dam in the Piave River of Italy has resulted in notable reductions of streamflow. Mix et al. [46] assessed the influence of dam building on discharge during a severe drought in the upper Colorado River basin, Texasi, and the conclusions indicated that building the dam reduced the streamflow visibly and intensified the hydrological drought in the downstream. Fitzhugh and Vogel [47] also listed the decrease in flood flows caused by the dams throughout the United States. Burke et al. [48] focused on the hydrological alterations Libby Dam of the Kootenai River caused, in western North America, and found that the operation of Libby Dam could change the duration of flow and increase the minimum streamflow during the dry season. Cowell and Stoudt [49] pointed out that the hydrologic responses to Kinzua Dam in northwestern Pennsylvania include increased low flow levels and decreased magnitude of flood peaks. Neal et al. [50] estimated the influence of farm dams on stream flow in upland regions of Victoria in southeast Australia, low flow spells have been discovered to commence earlier and occur in more months of the year. Bonacci and Oskoruš [51] revealed that the construction and operation of Croatian dams could decrease the suspended sediment yield in a downstream water regime as well.
As the largest hydropower project in the world and the main project of the three Gorges Hydropower Station, the Three Gorges Dam (TGD) is located in the upper reaches of the Yangtze River, just near Yichang. In dry season, the TGD is used to retain water and hold the water level above threshold values. The total length of the TGD is about 2309 m and its height is 185 m. After different stages of water impoundment, the reservoir has been operating at full capacity since 2010 [6]. The building of the TGD has caused a lot of controversy with regard to its benefits and impacts [52]. Although the TGD has brought benefits to the Yangtze River as for hydropower generation, flood management and navigation capacity, serious questions have been raised regarding its effect on downstream ecosystems. Many researchers found that the operation of the TGD has complicated significantly the streamflow of the Yangtze River [6]. Dai et al. [53] pointed out that the TGD was associated with the reduction of Yangtze River streamflow during wet season and the rise of the river discharge in the dry season by using the data of 2006. In other words, the TGD could affect the seasonal change of streamflow of the Yangtze River by impounding and releasing water [54,55]. Guo et al. [56] revealed that the building of the TGD caused the variation in the Yangtze River discharge was lower than 10% in most seasons. Yang et al. [57] reported that the sediment transport rate in the Yangtze River was cut down by 31% after completion of the TGD. The sediment transport rate is strongly correlated with river discharge [58]. Zhang et al. [59] proposed that the TGD could make the discharge increase in May and decrease in September. Some researchers also found that low flow in the dry season of the lower Yangtze River have been advanced and persisted longer due to the TGD [60,61].
Despite much research on the impacts of the TGD impounding on the Yangtze River [53], seldom people pay attention to the difference in downstream low flow in the Yangtze River before and after the TGD operation. Questions like, ‘How does the impounding of the TGD influences the downstream low flow in the Yangtze River?’, have not been fully considered, which is of remarkable importance to comprehending the relationship between the TGD and downstream low flow in the Yangtze River. Few studies reconstruct the streamflow without the TGD after 2003 and give the definition of the start date of the dry season as well. The issues to be revealed in this paper cover: (1) the impacts caused by the TGD on the main Yangtze River; (2) the impacts of the TGD on downstream low flow in the Yangtze River; (3) the impacts of the TGD on minimum streamflow of the main Yangtze River. In this paper, we try to solve these problems based on a complete analysis of long-term streamflow datasets across the main Yangtze River basin. This study is meaningful for the further understanding of the effects of the impounding of the TGD on downstream low flow in the Yangtze River.

2. Data and Methodology

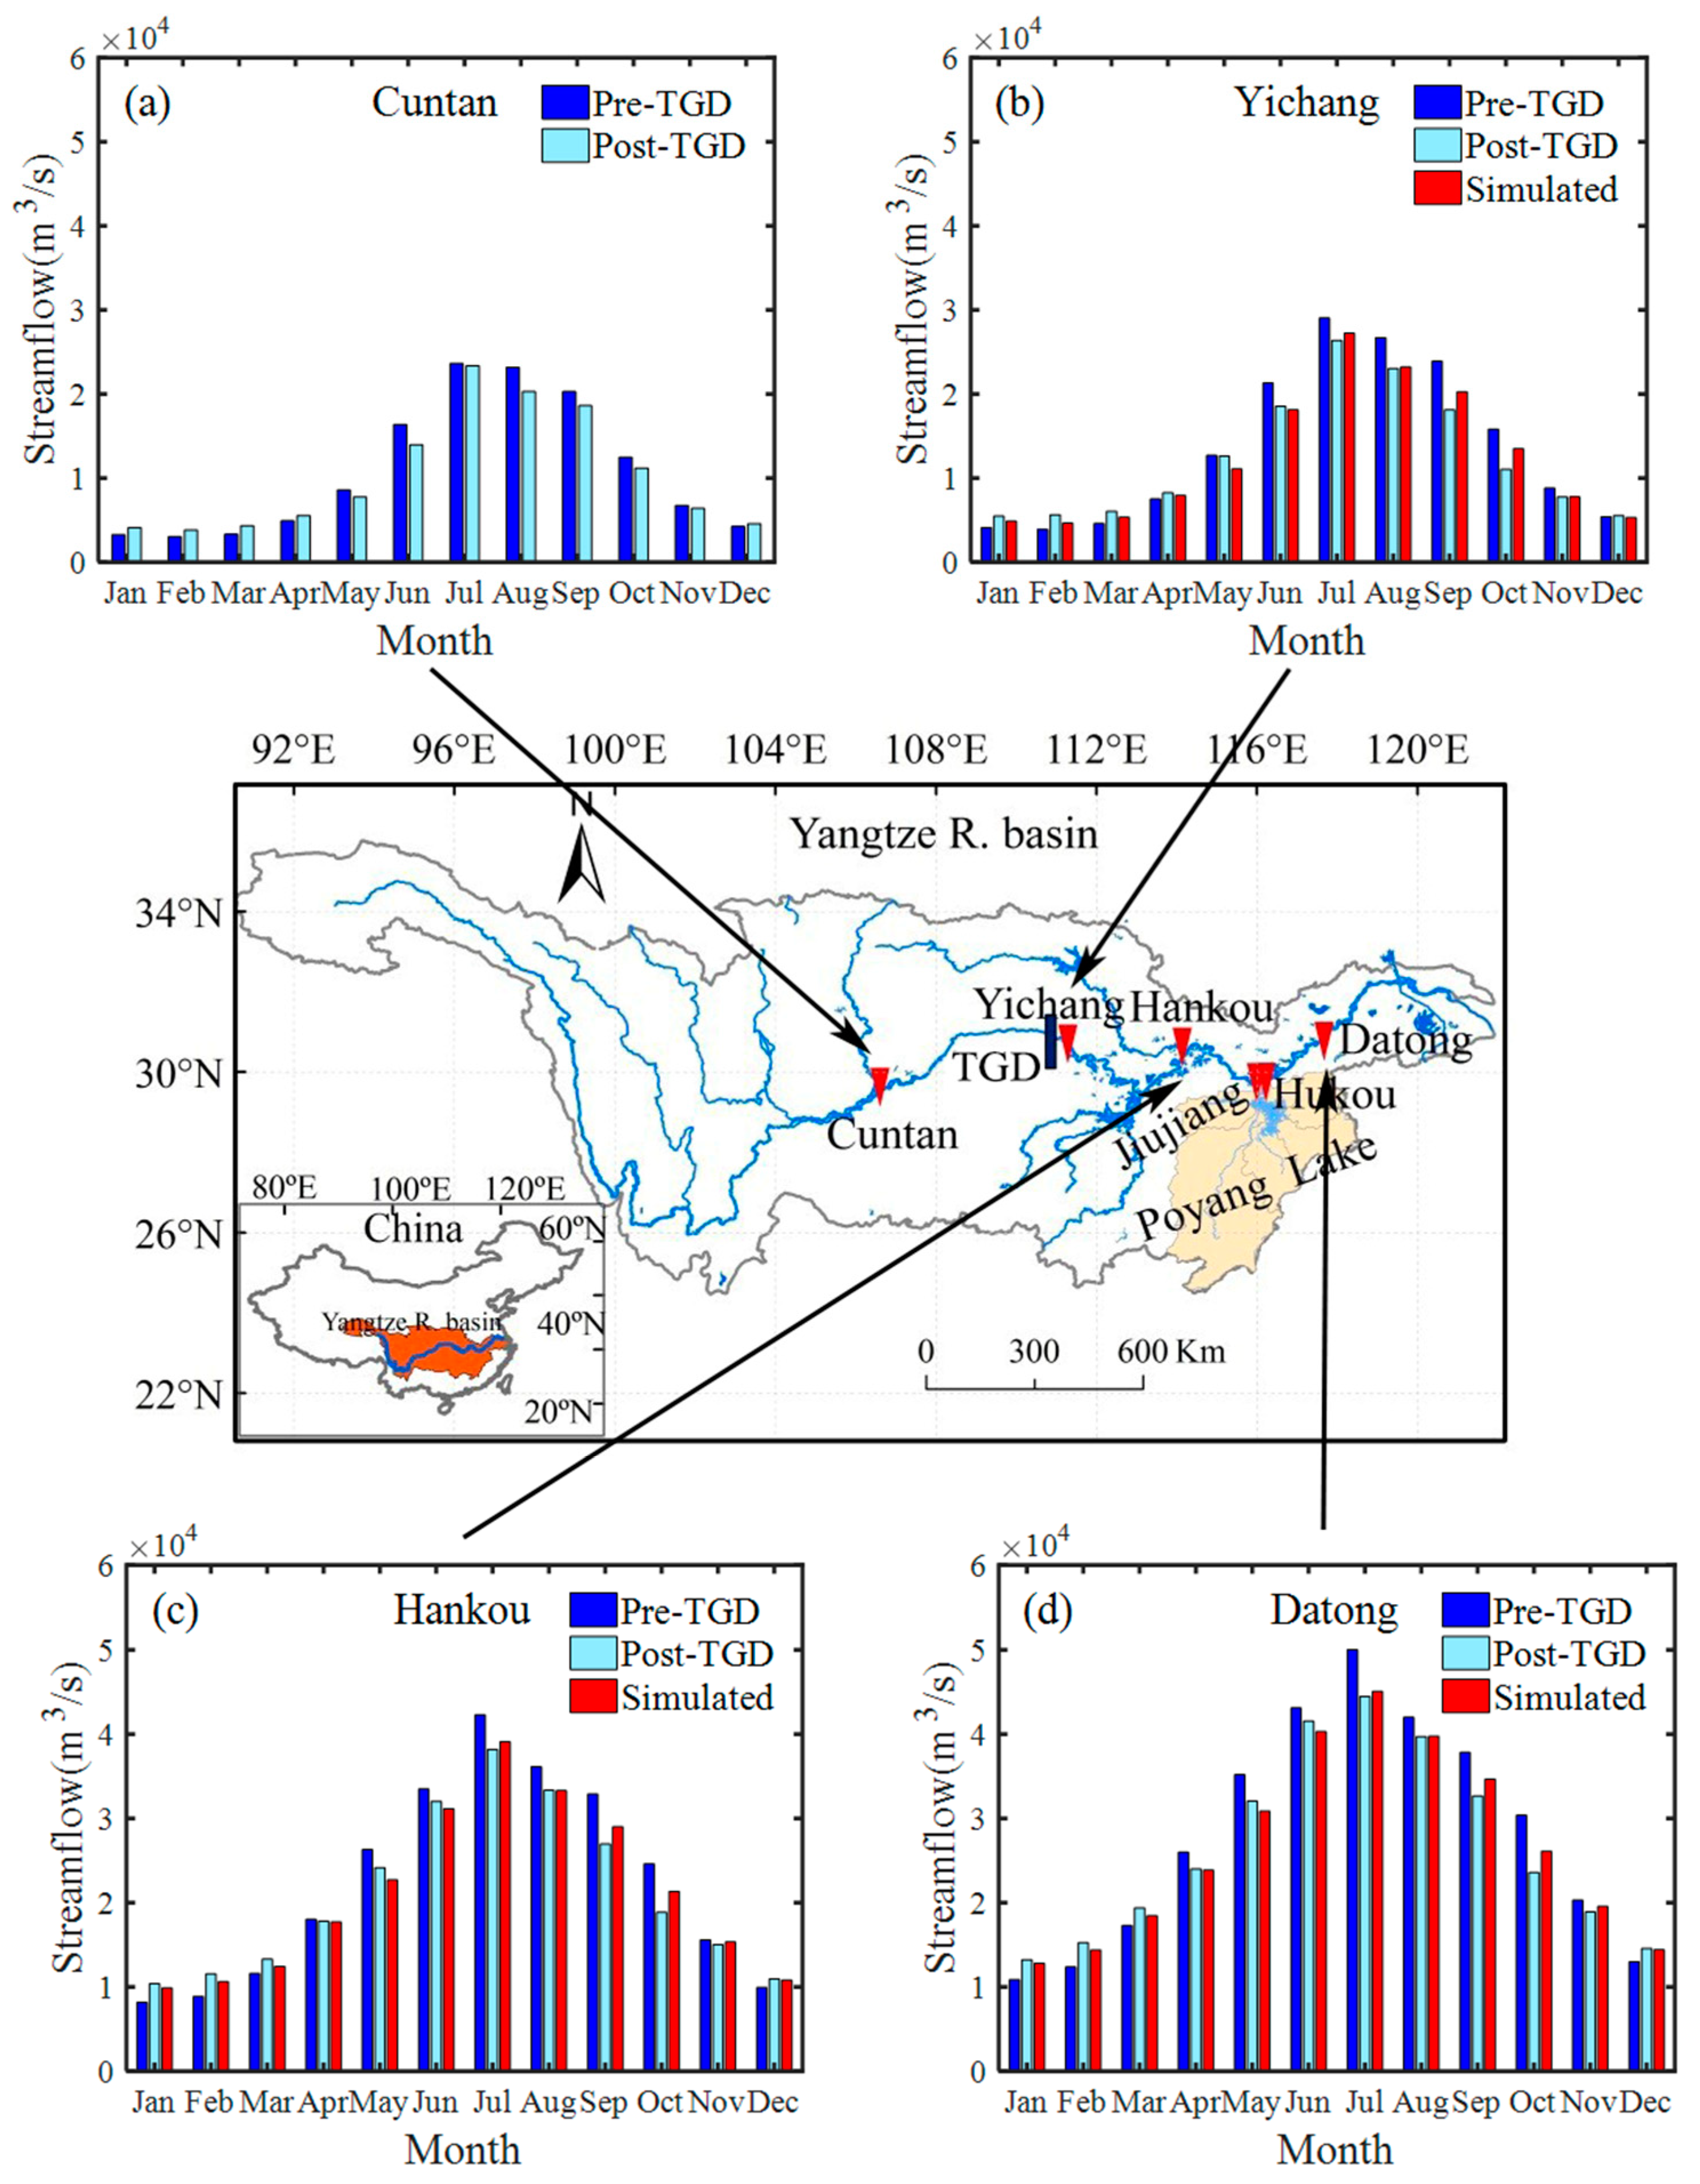
2.1. Study Area and Data

The Yangtze River is the largest river in China and the third largest river in the world, which accounts for 35.1% of the total streamflow of China [62]. This river originates from the Tibetan Plateau, flowing from west to east. The main Yangtze River has an area of 1,800,000 km2, occupying about one fifth of the total land area of China. Generally, the Yangtze River can be divided into three parts: the upstream (upstream of the Yichang station), midstream (between the Yichang and Hukou station) and downstream (downstream of the Hukou station).
Most of the Yangtze River basin is affected by the subtropical monsoon climate, where the mean annual precipitation ranges from 270–500 mm in the western region to 1600–1900 mm in the southeastern region [63]. Today, the Yangtze River is undergoing severe hydrological changes, especially in the middle-lower Yangtze River [64,65,66,67]. The most remarkable hydrological variety of the Yangtze River is the occurrence of seasonal hydrological droughts since the year 2000 [55]. The dry season in the Yangtze River basin is from November to the following March due to the sustained low flow caused by long-term low rainfall in this basin. In fact, most of the mean annual precipitation in the Yangtze River (70–90% of the total) comes from the wet season [1,8]. In the dry season, the streamflow in the Yangtze River always decreases sharply and causes severe water supply, environmental and economic problems.
Daily streamflow from the Cuntan, Yichang, Hankou and Datong hydrological stations during the period of 1956–2016 in the main Yangtze River were used in this study (Referring to Figure 1). Missing streamflow data was interpolated by the average value of its adjacent stations. The reservoir inflow and outflow of the TGD data was from China Three Gorges Corporation (http://www.ctg.com.cn/).

2.2. Methodology

The streamflow at the Yichang, Hankou and Datong stations without the impounding of the TGD were reconstructed by the method of Zhang et al. [68]. The length between the Yichang station and the TGD is about 39 km and this distance was negligible due to it being too short. The distance between the Hankou station and the TGD is about 667 km, and it takes the water around 7 days to flow from TGD to the Hankou station. The distance between the Datong station and the TGD is about 1129 km, and the water spends 12 days flowing from the TGD to the Datong station. Thus, the reconstructed discharge at the Yichang station was roughly equivalent to the sum of the impounding of the TGD (TGD inflow minus TGD outflow) and the discharge of Yichang at the same day. The reconstructed streamflow at the Hankou station was simulated as the total of the impounding of the TGD (inflow minus outflow) and the streamflow of Hankou with a lag of 7 days. The reconstructed streamflow at the Datong station was computed as the impounding of the TGD (inflow minus outflow) plus the streamflow of Datong with a lag of 12 days.
In this paper, the dry season was defined as the period from November to March. It was hard to calculate the start date of the dry season because the dry season spans two years. Therefore, the hydrological year was used in our research and the hydrological year was defined as May to April. Then, the streamflow of five consecutive days less than the mean low flow can be regarded as the start date of the low flow period. The end date of low flow period can be calculated in the same way.

3. Results

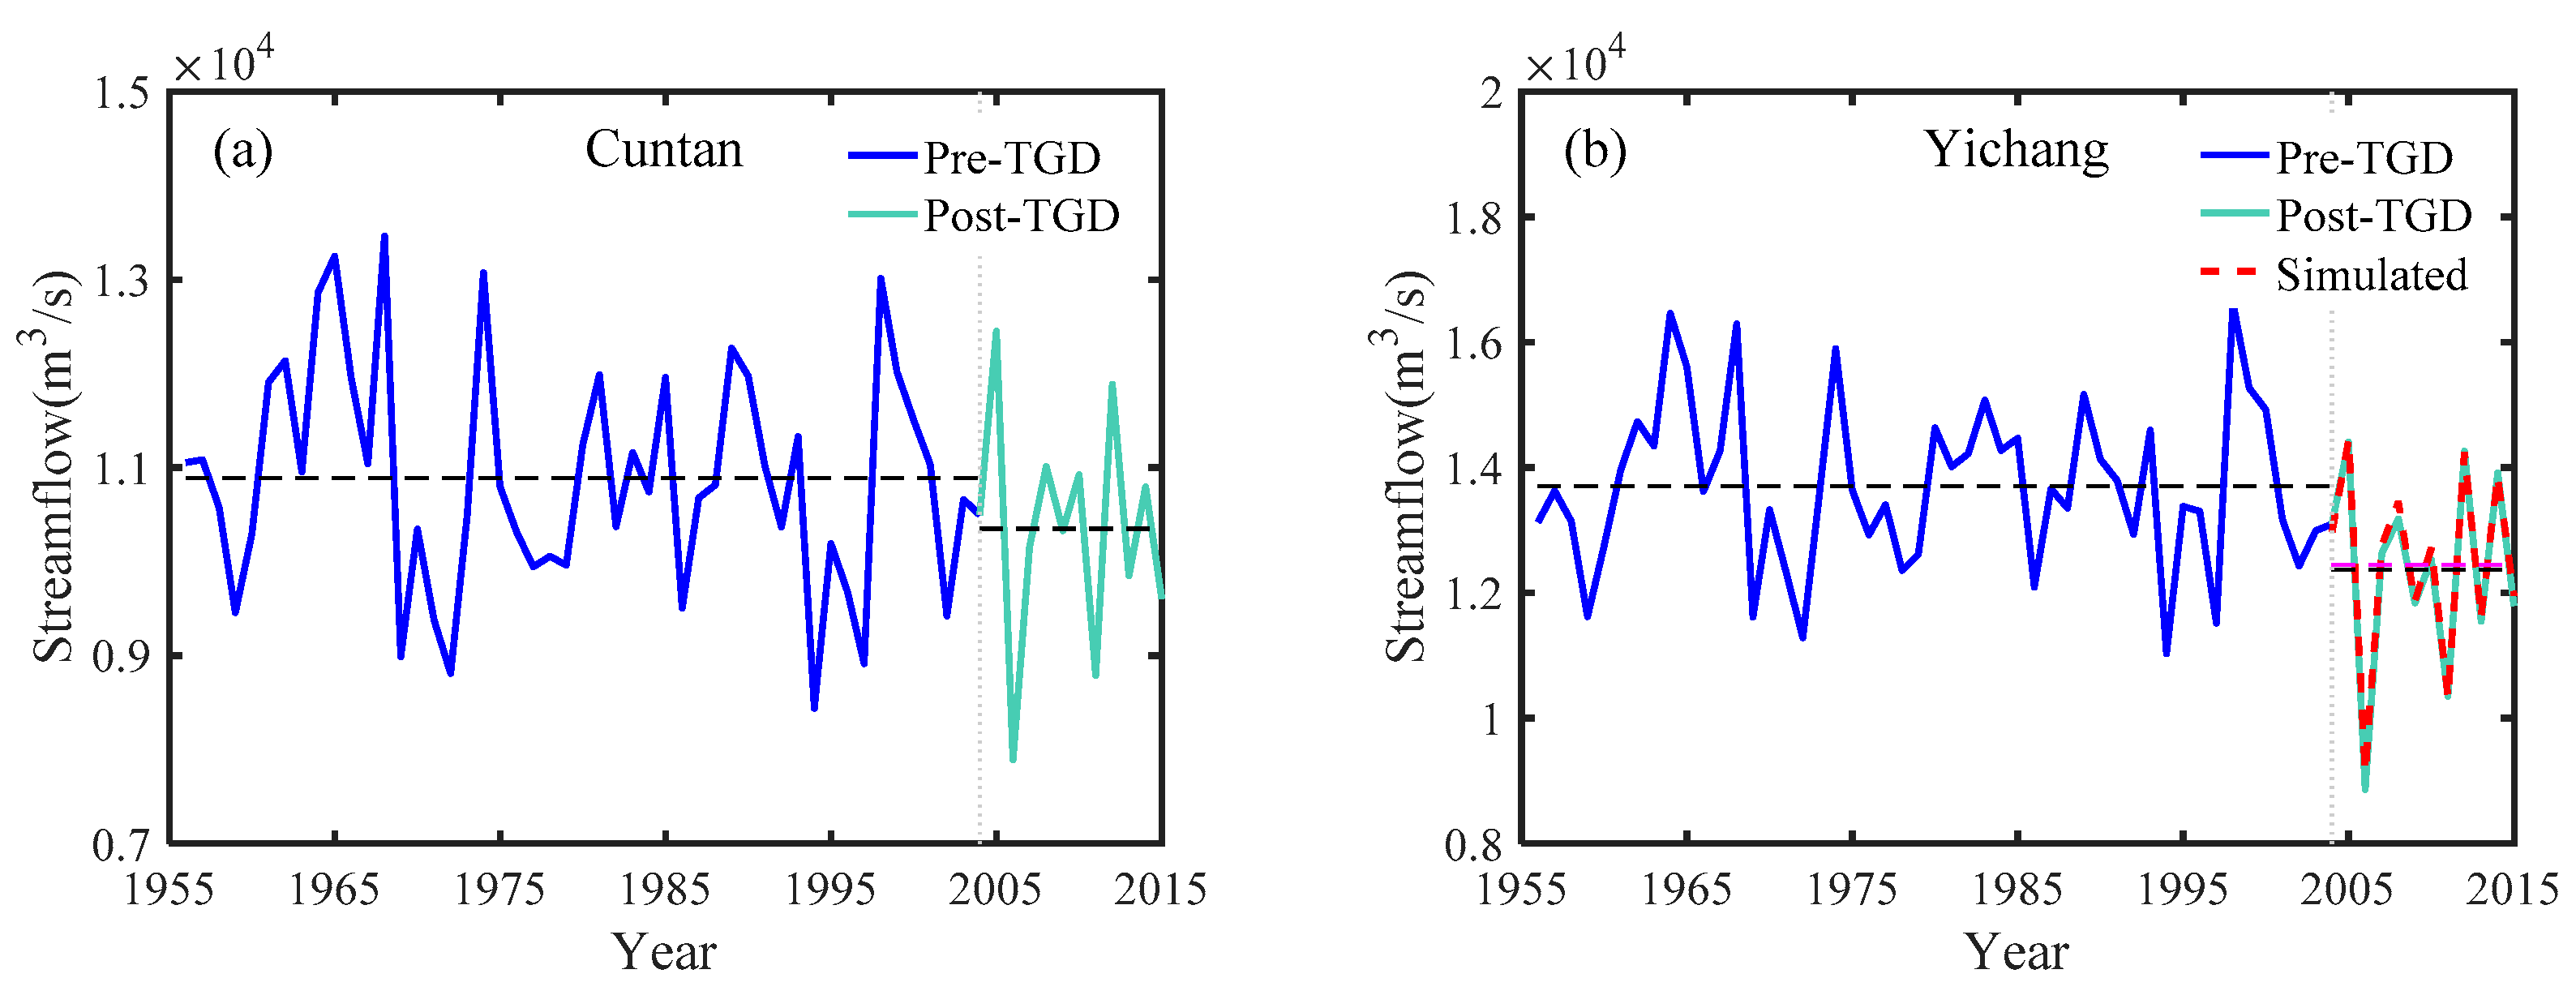
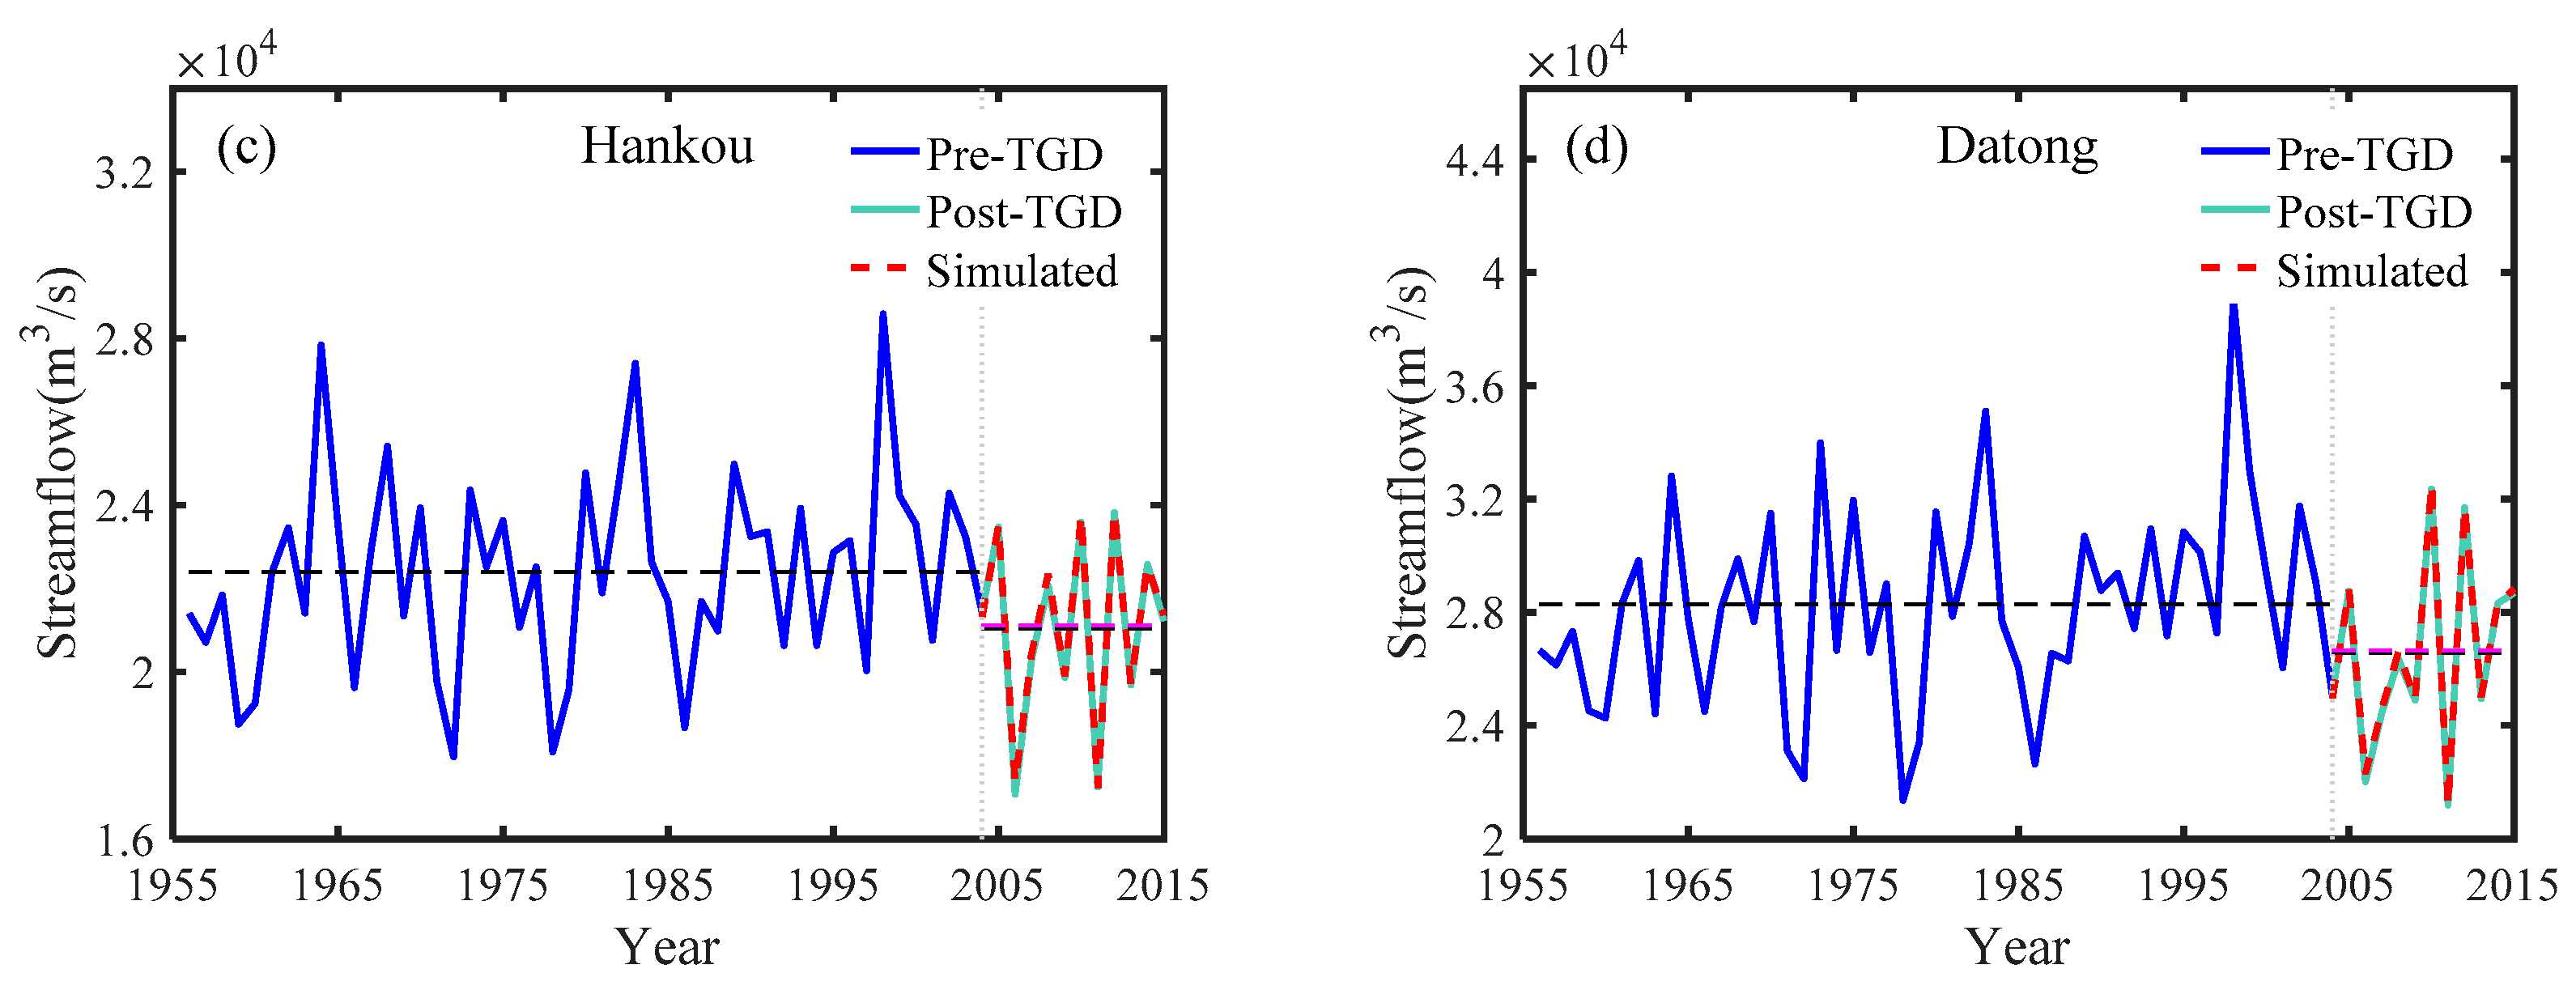
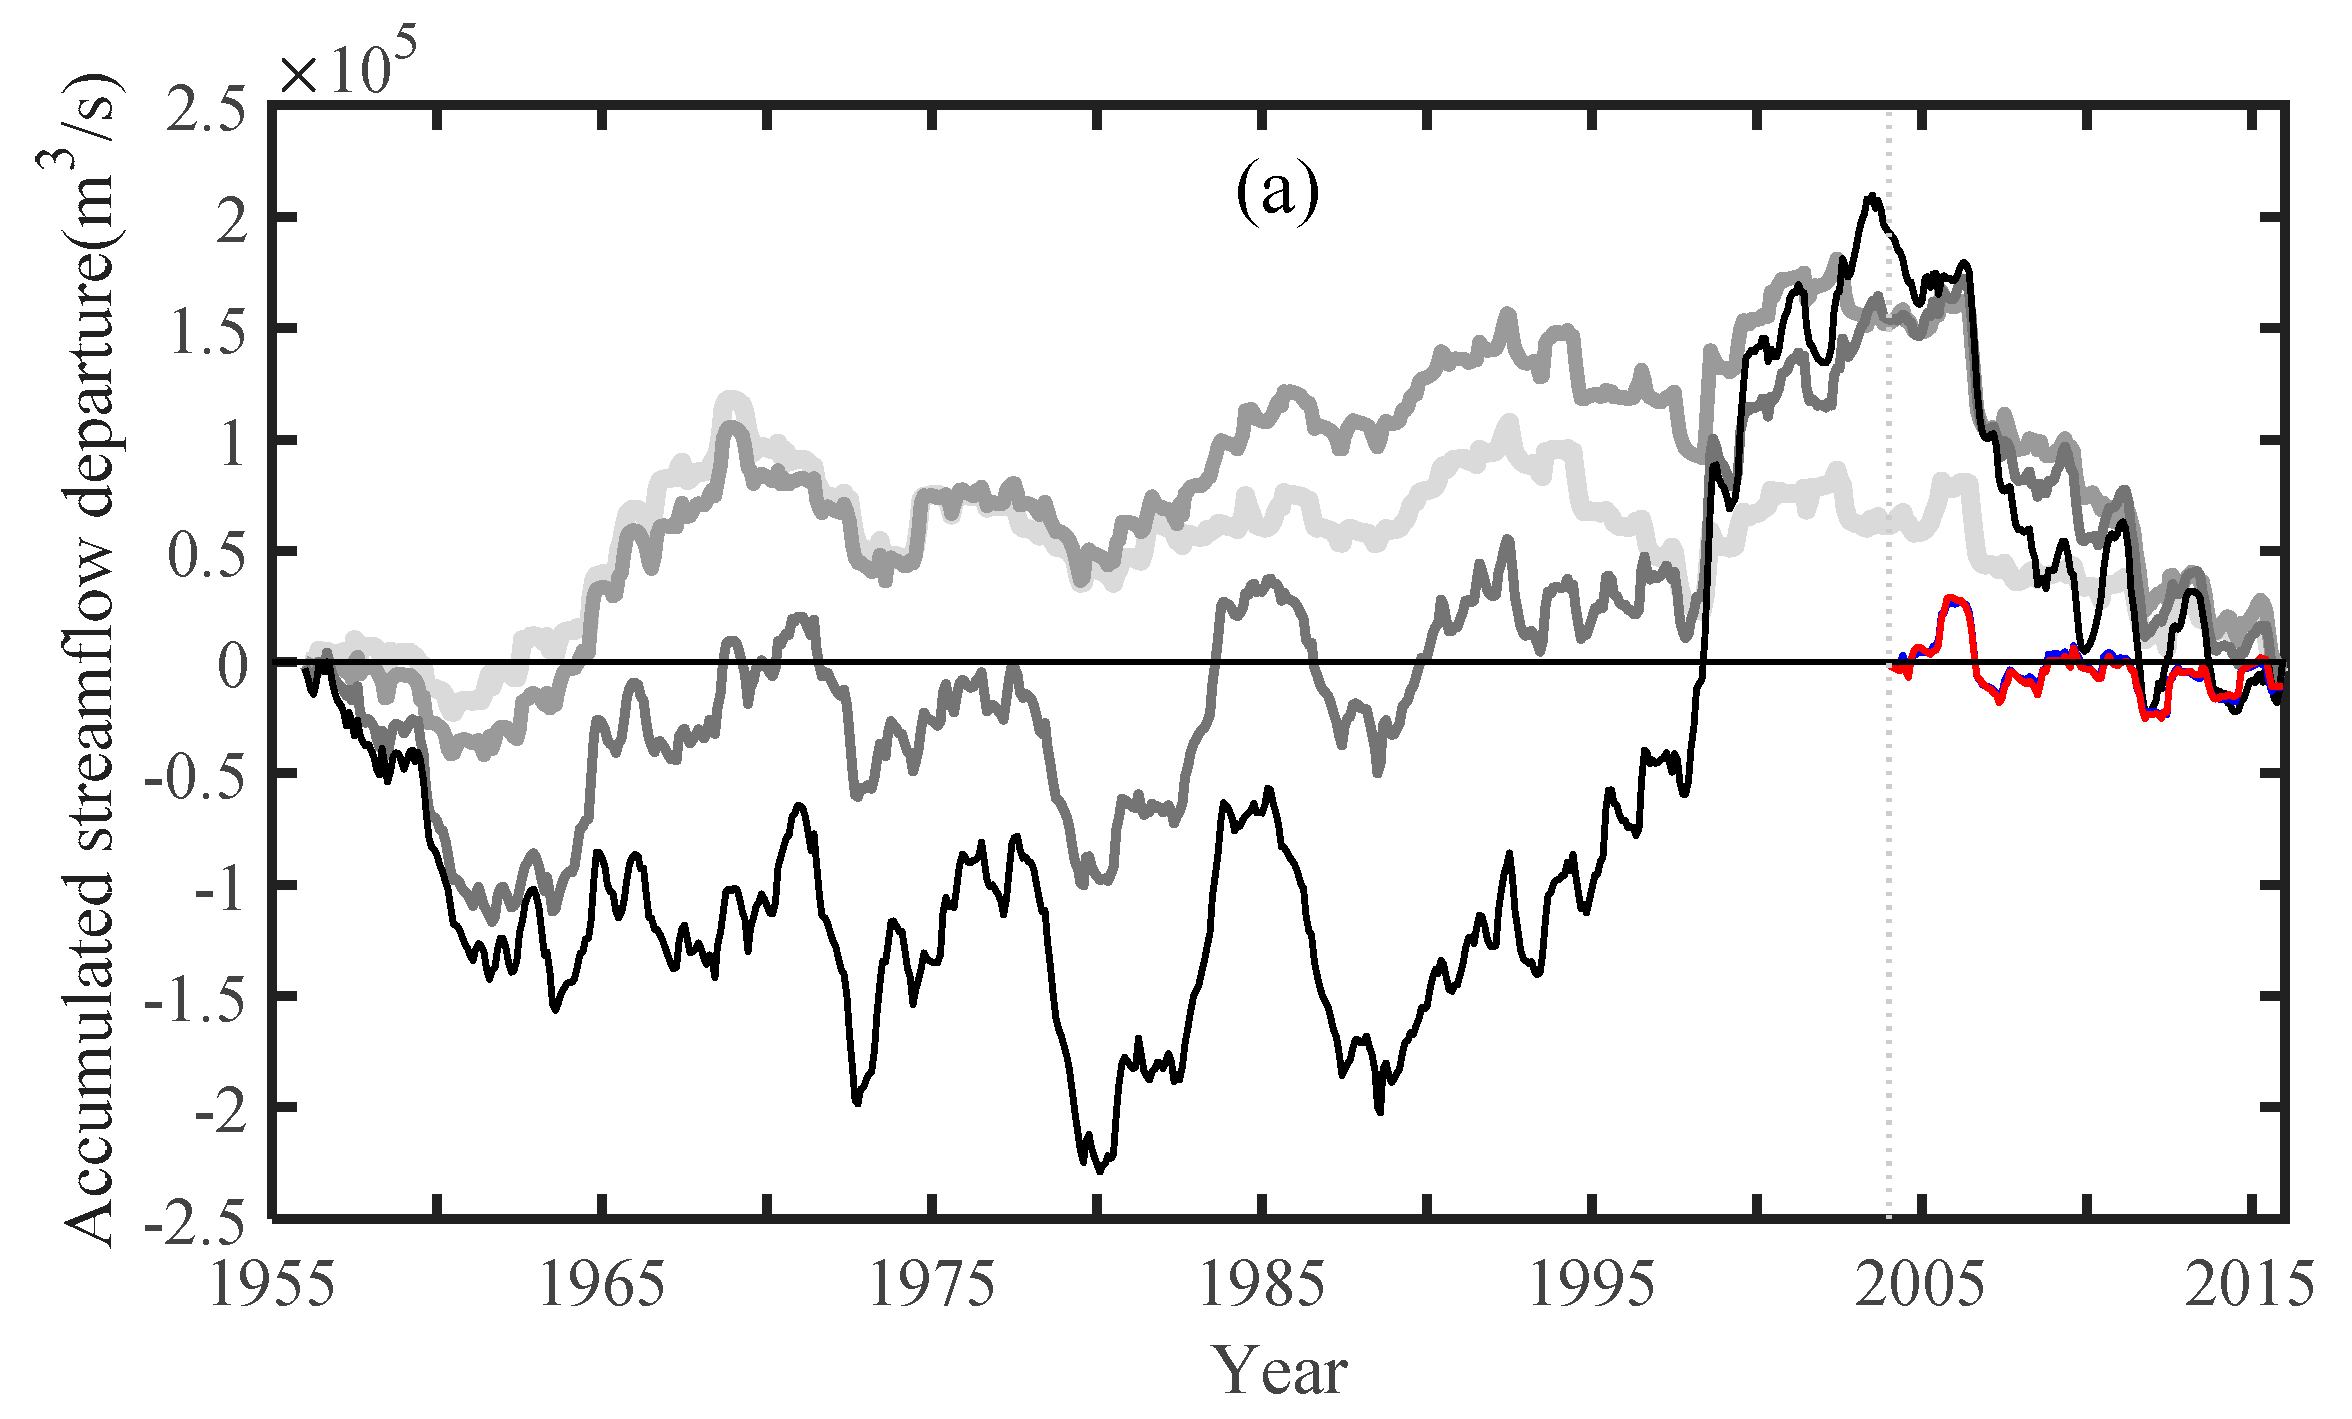
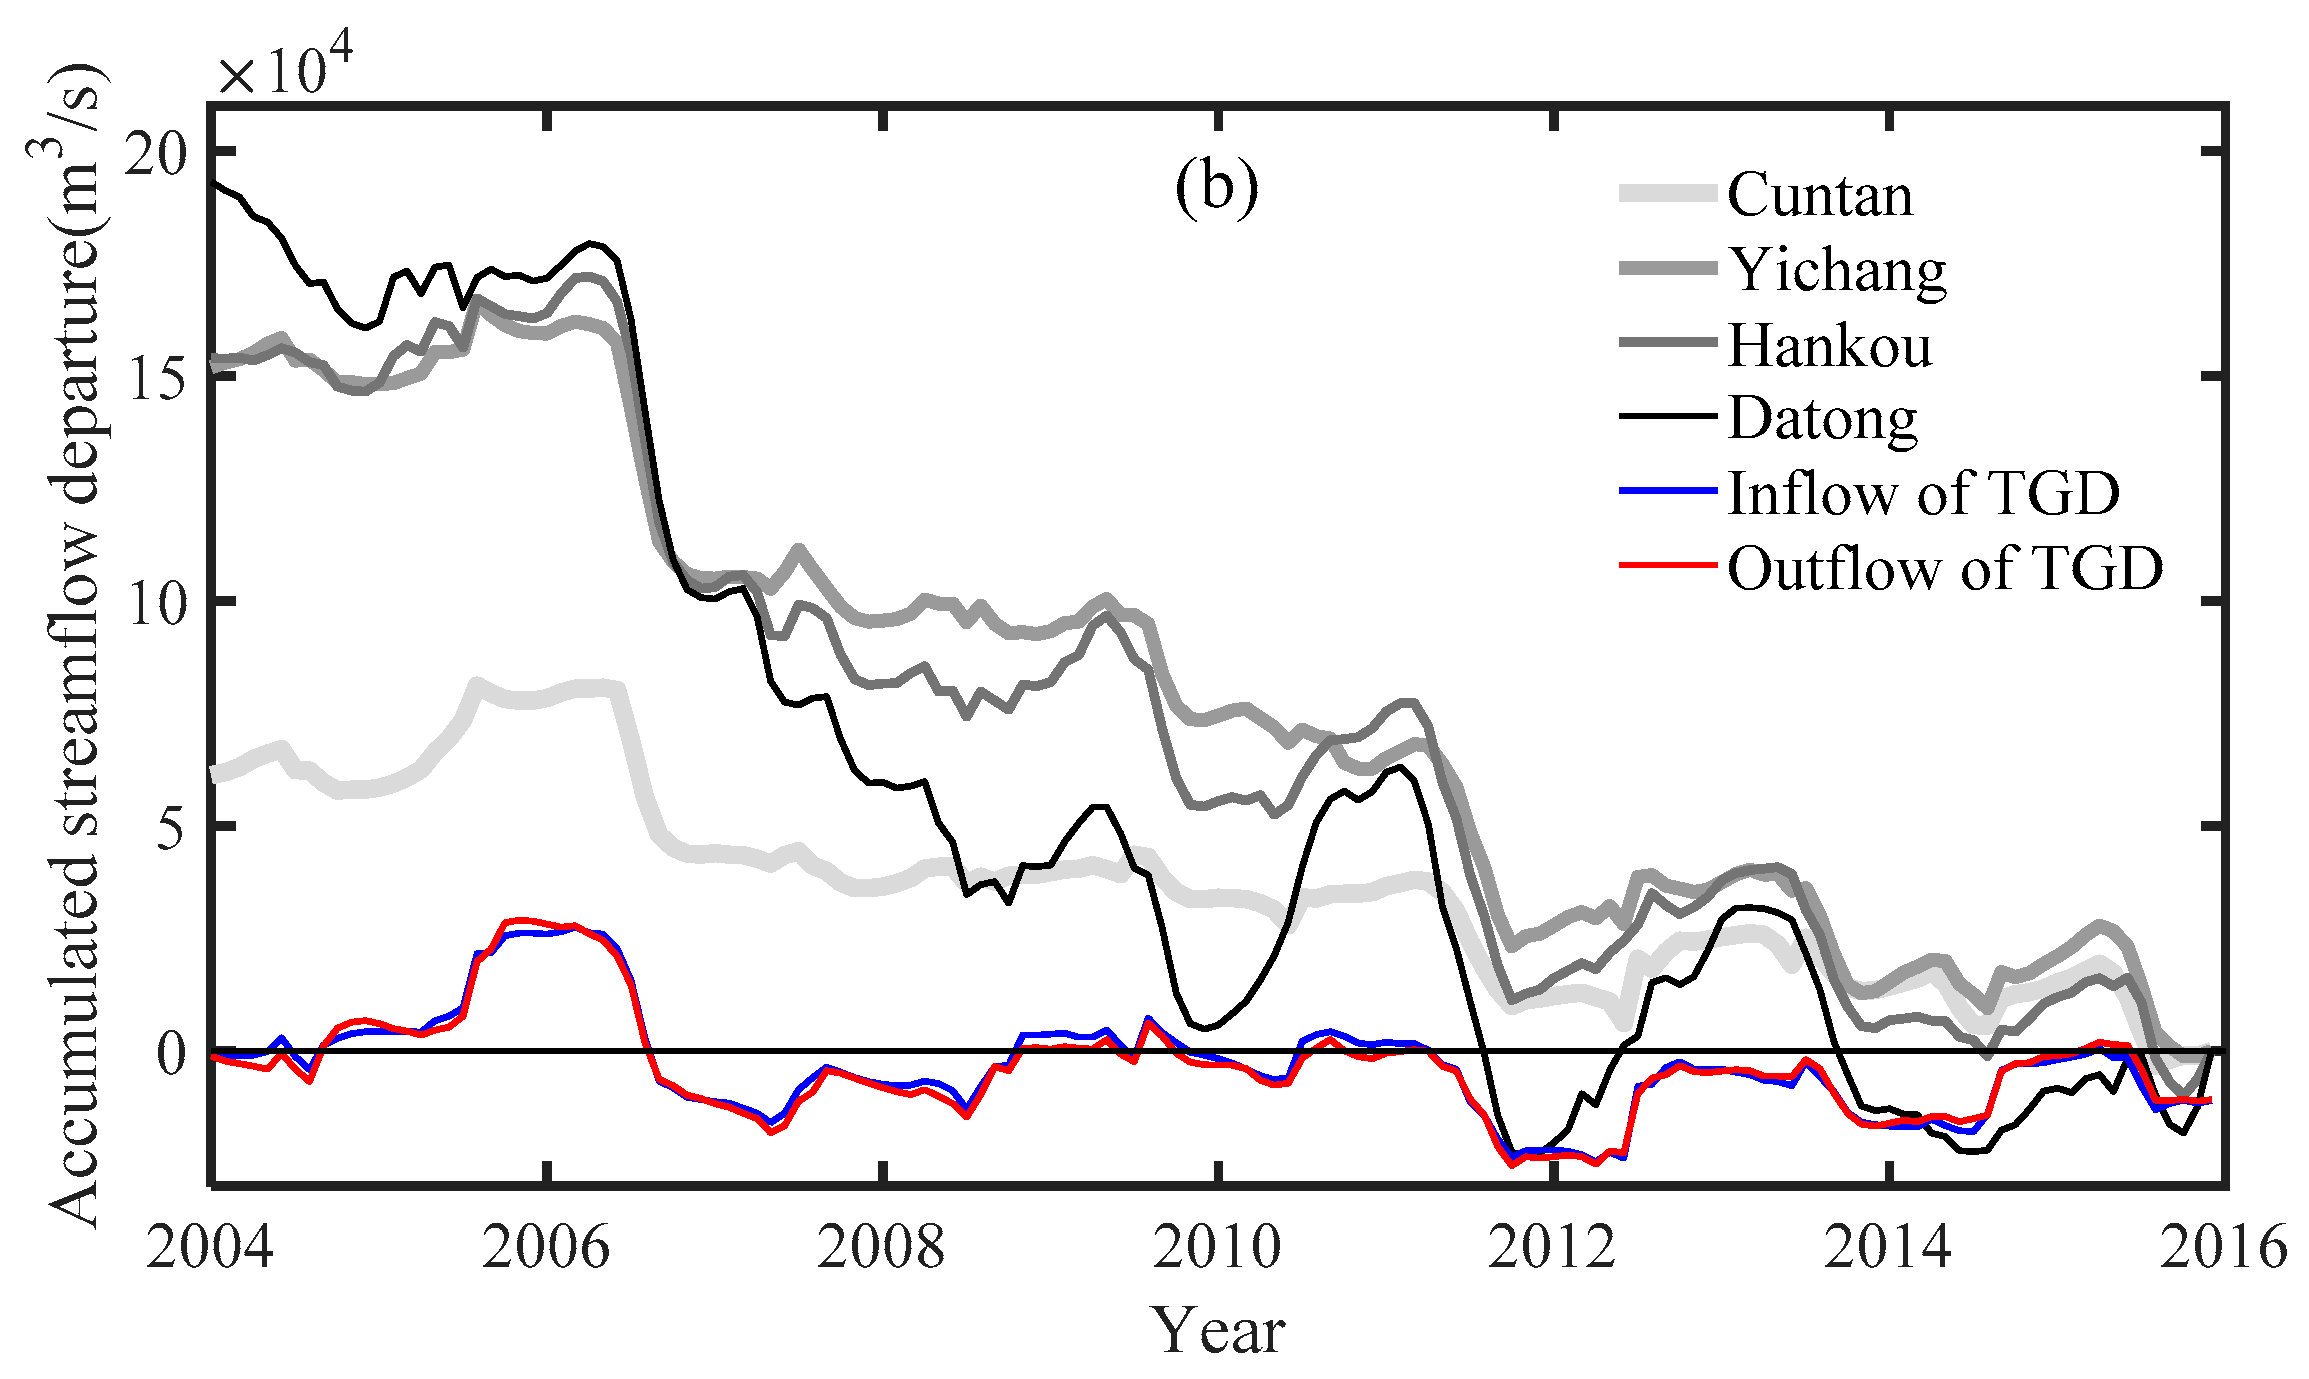
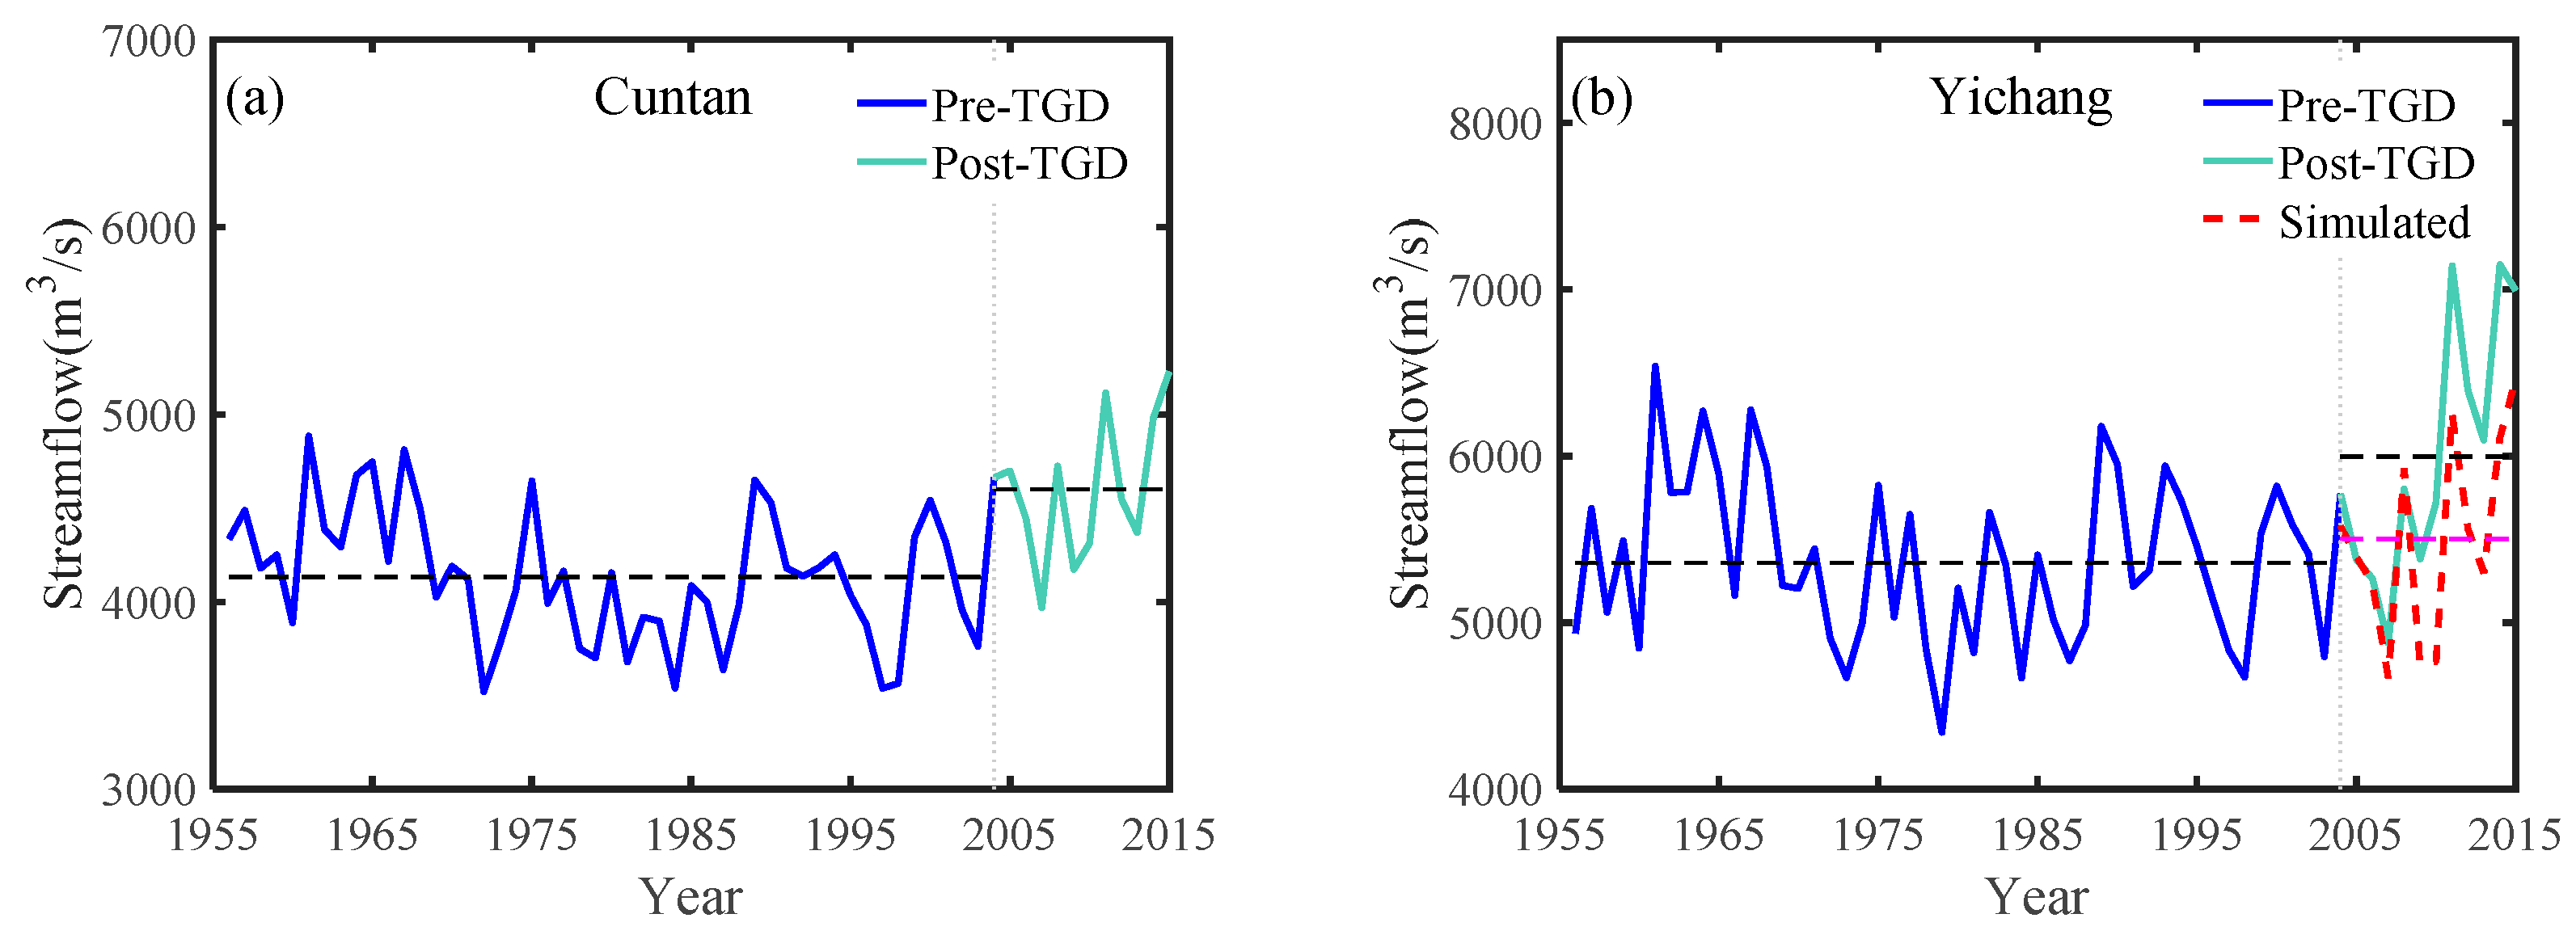
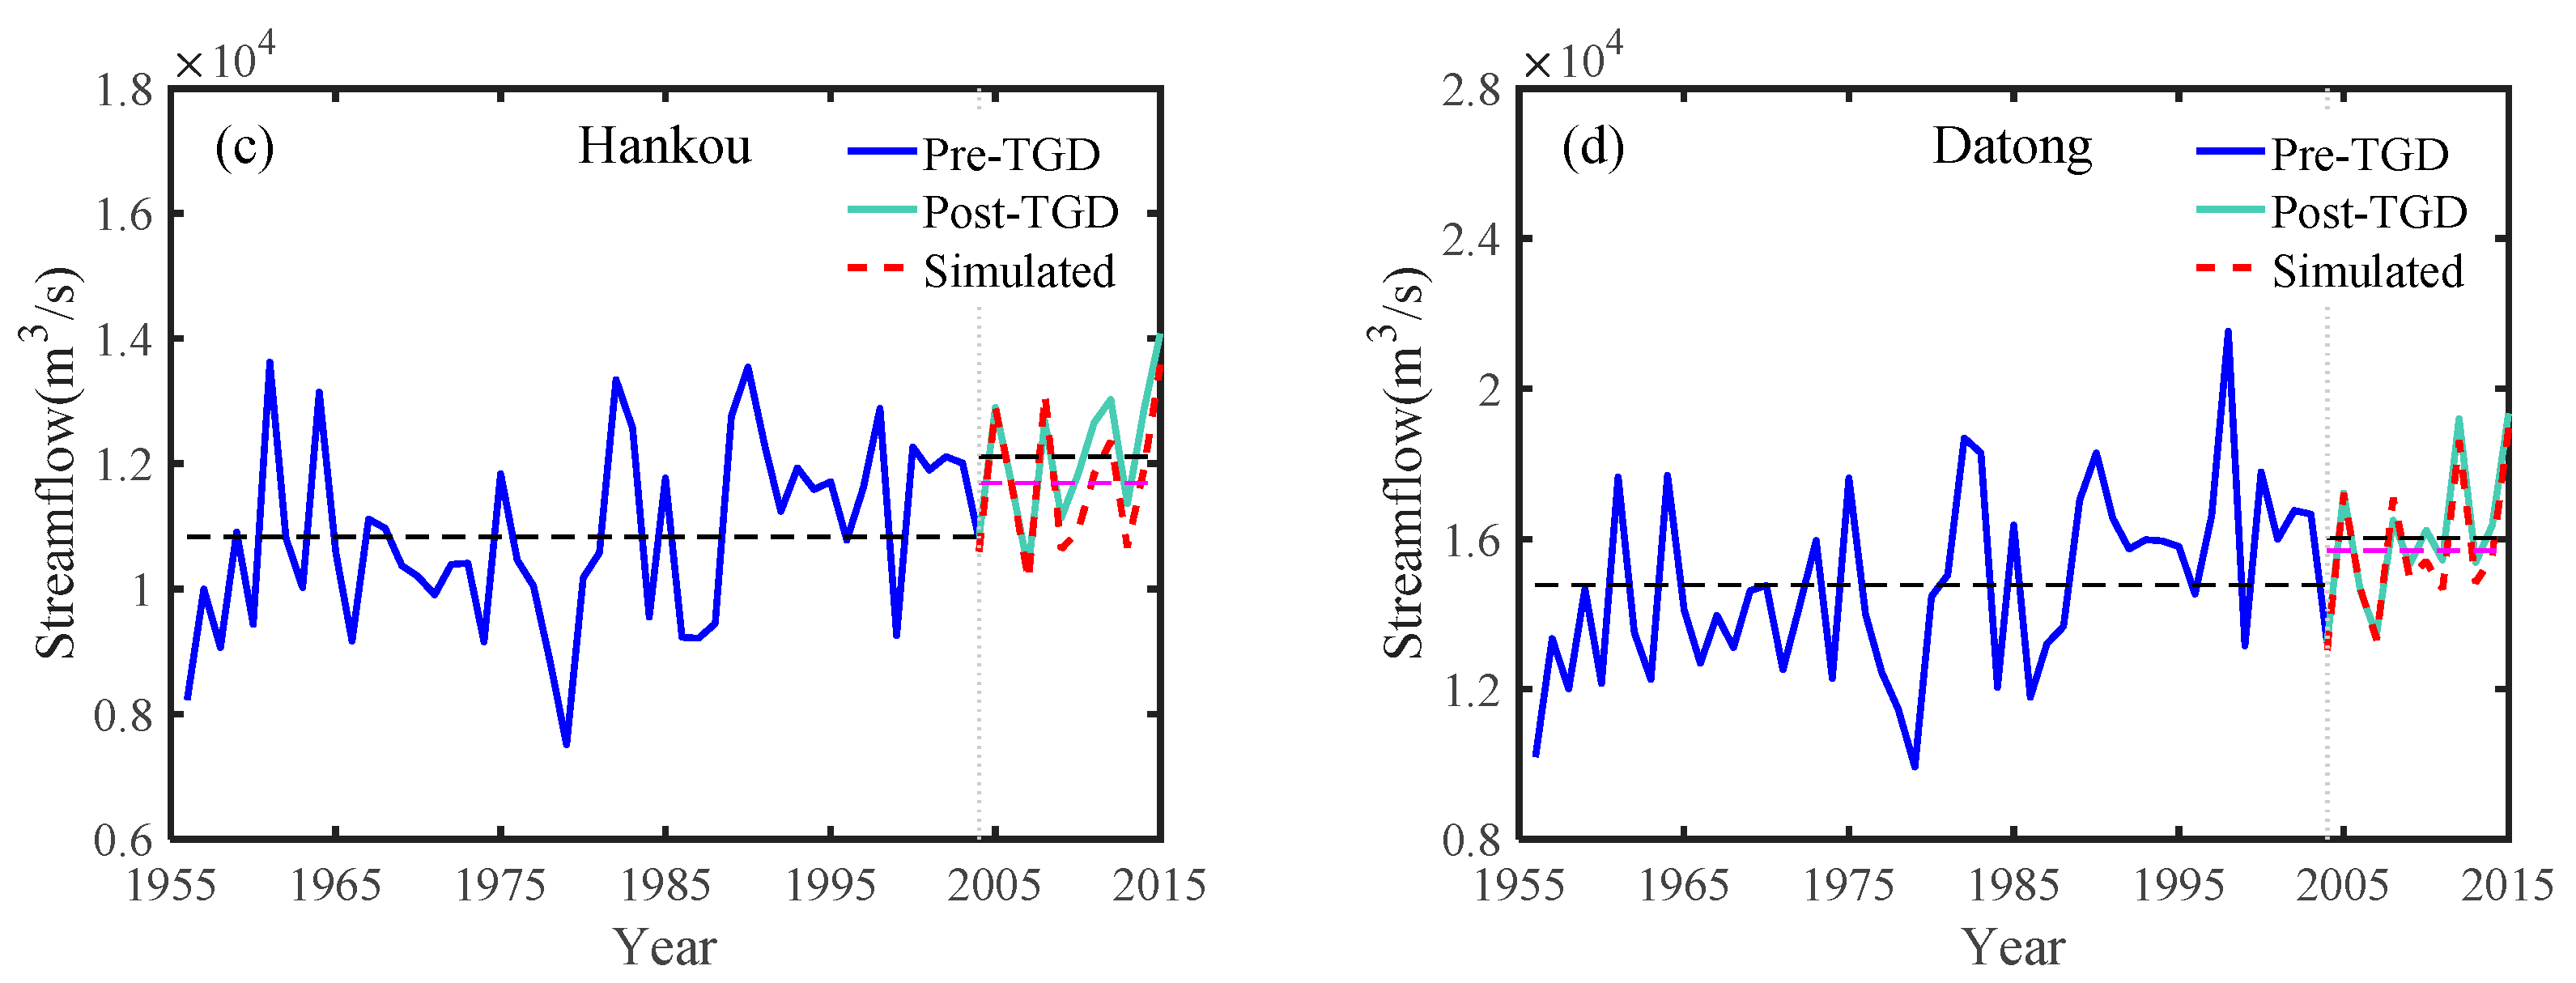
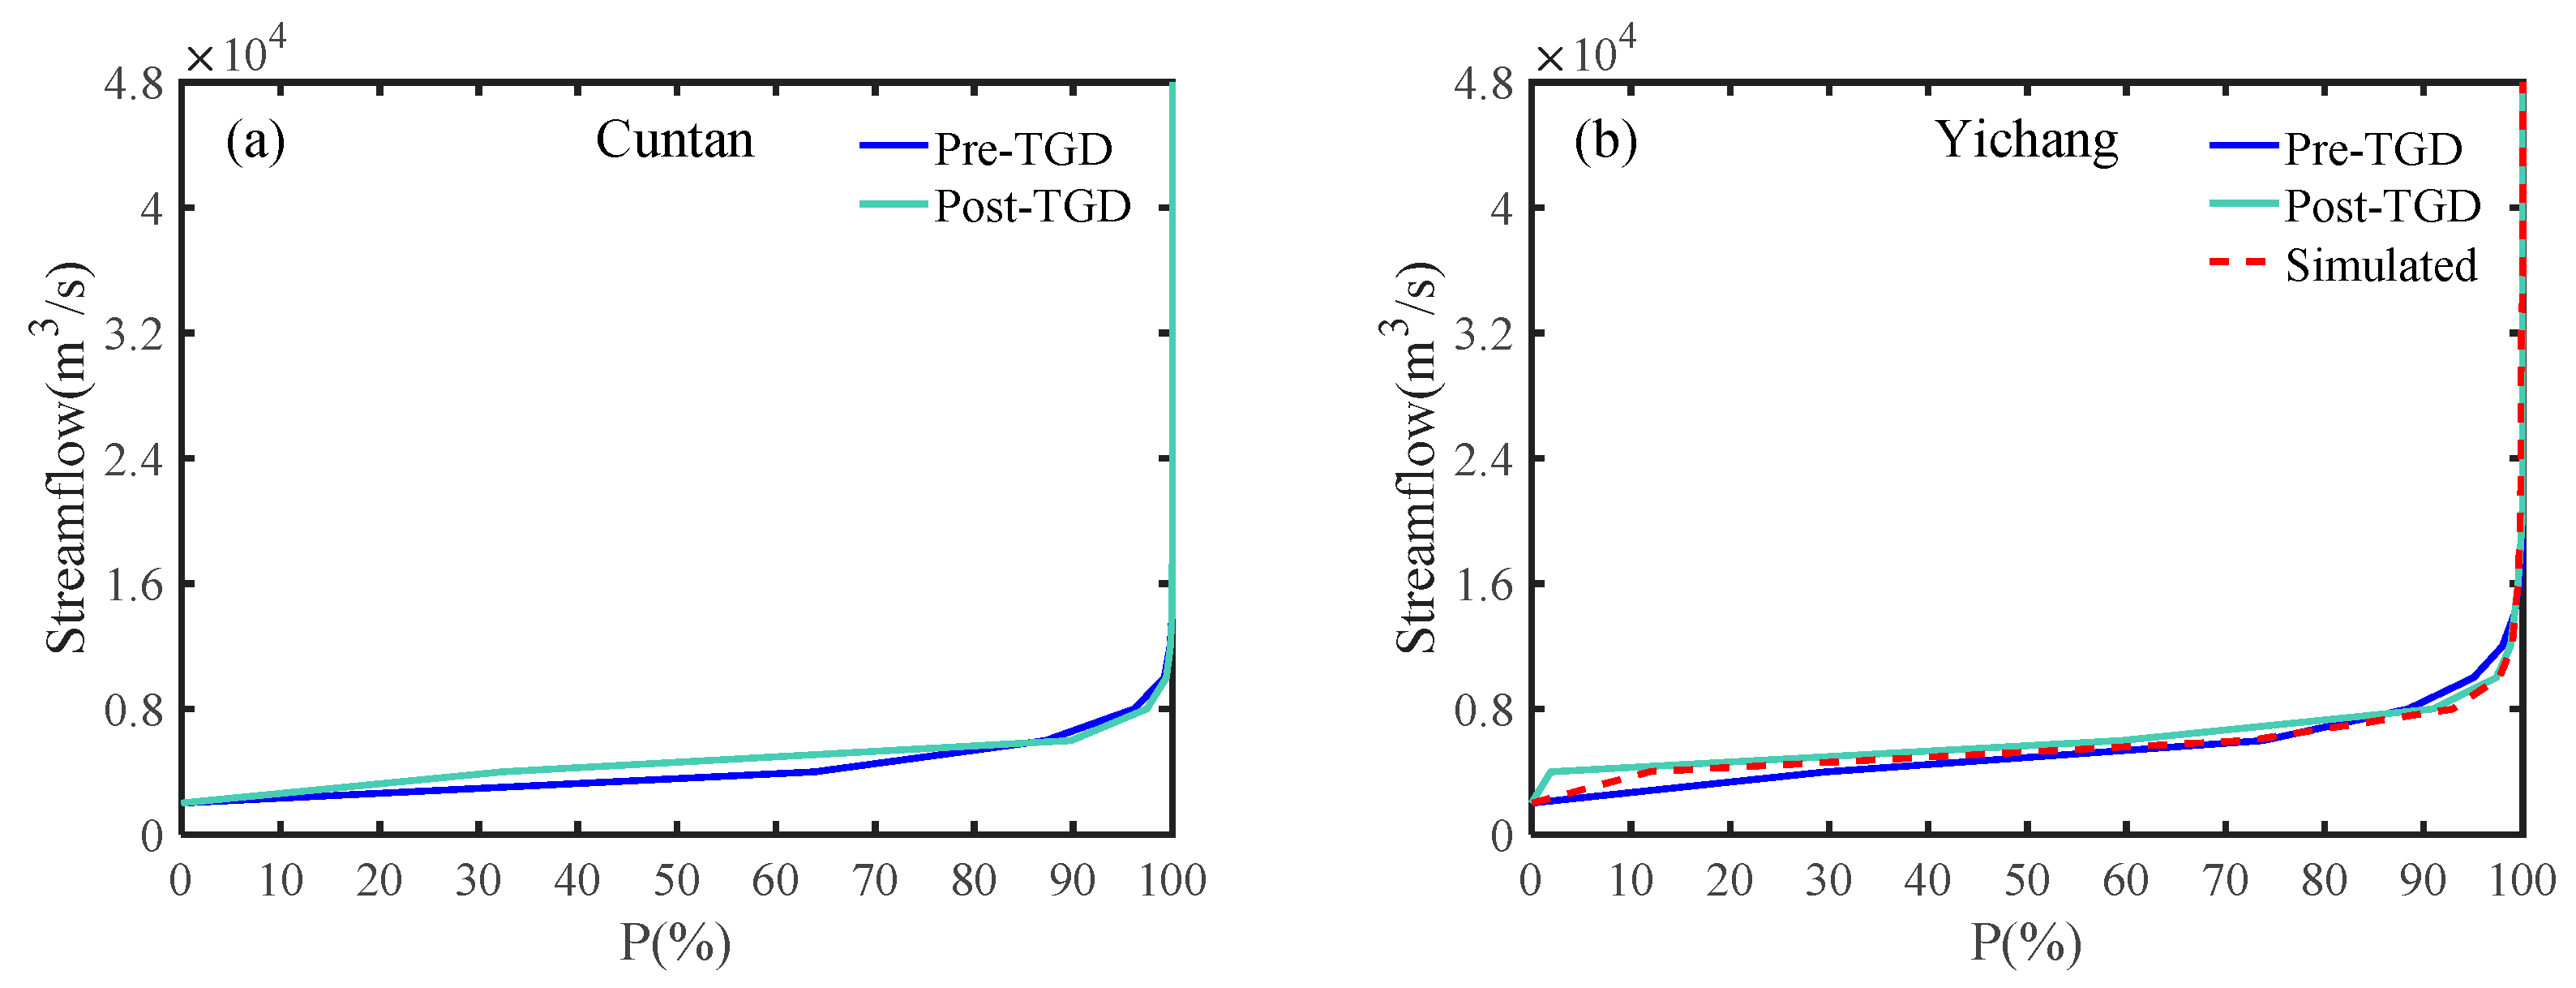
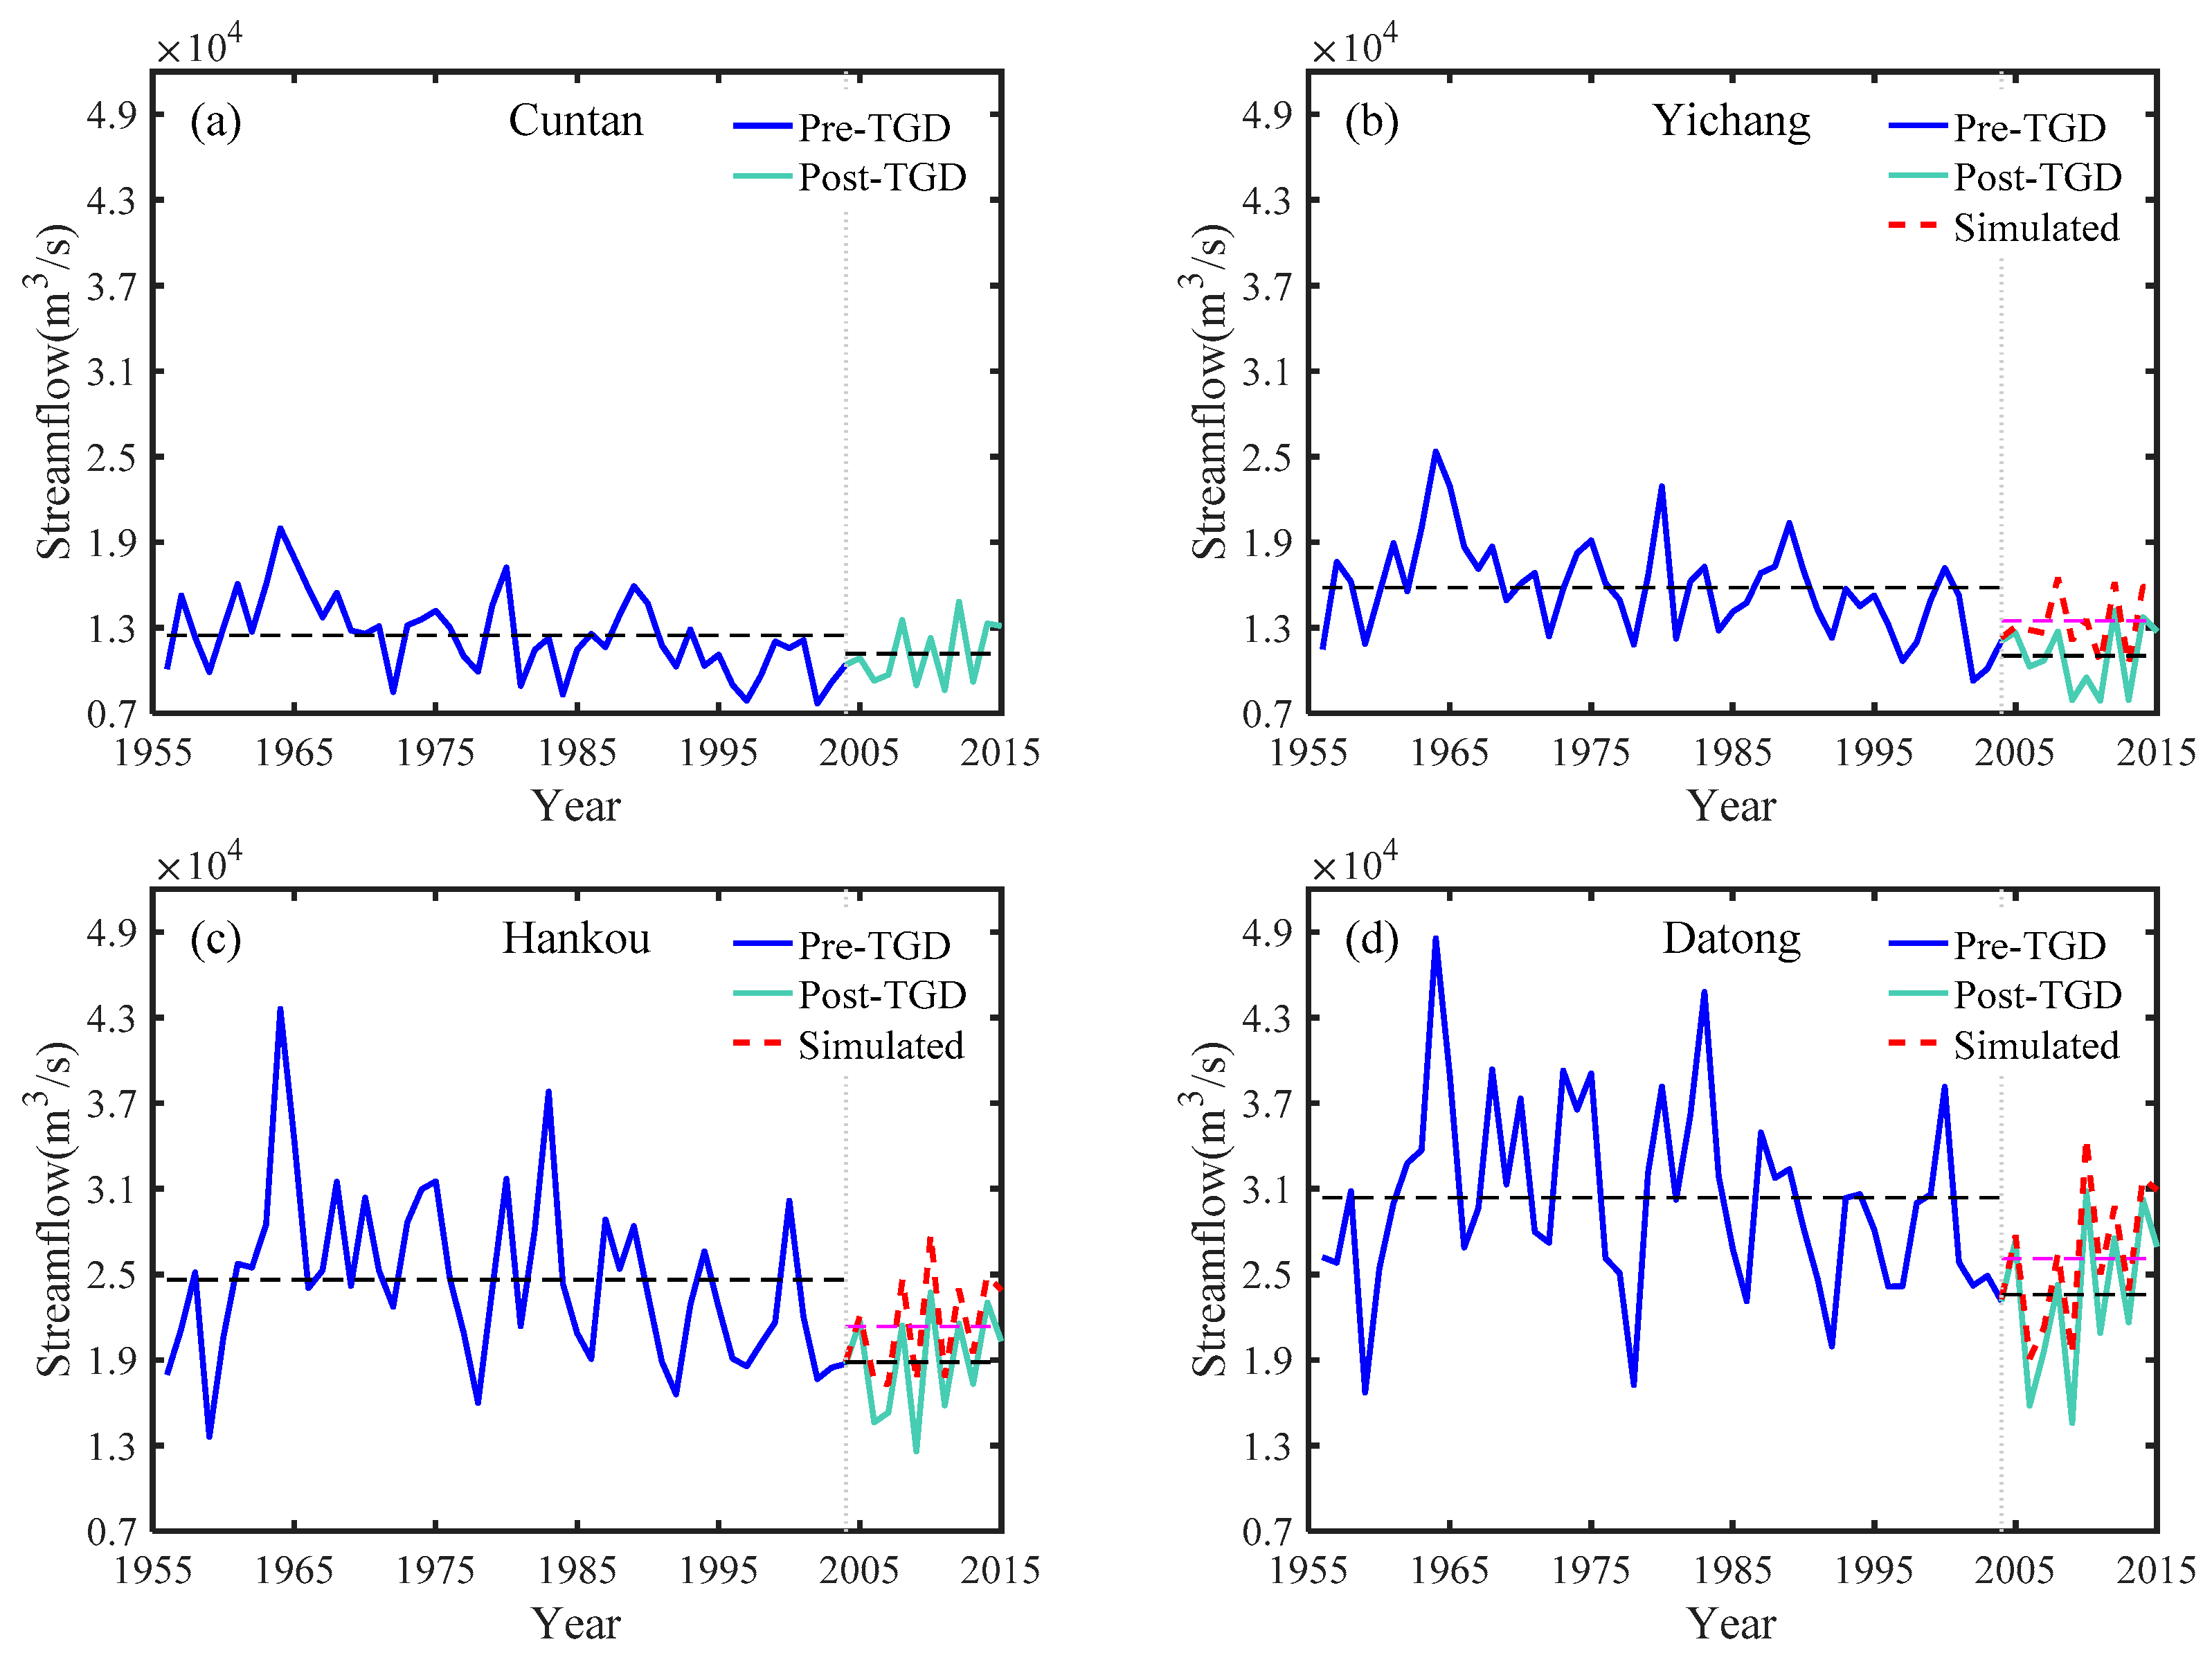
3.1. The Impact of the Three Gorges Dam (TGD) on the Main Yangtze Rive

The operation of the TGD has altered the streamflow of the trunk stream of Yangtze River. The monthly mean streamflow for the Cuntan, Yichang, Hankou and Datong stations during the pre-TGD (1956–2003) and the post-TGD (2004–2016) periods are shown in Figure 1. It can be found that the streamflow of January, February, March and December in the pre-TGD period were lower than that of the post-TGD period, while the streamflow in July, August, September and October in the pre-TGD period were higher than that of post-TGD period (Figure 1). Figure 2 shows the annual mean streamflow in the Cuntan, Yichang, Hankou and Datong stations during the pre-TGD and the post-TGD periods. It can be found that the streamflow for the post-TGD period was much lower than that of pre-TGD period. This was also the case in analyzing the reconstructed streamflow which aimed to eliminate the influence of the operation of TGD (Figure 2b–d). By using the t-test, we found that the p values at the Cuntan, Yichang, Hankou and Datong stations were 0.023, 0.000034, 0.006 and 0.021, respectively. This result revealed that the difference of streamflow between pre-TGD and post-TGD periods was significant for the four stations at the 0.05 significance level. Table 1 displays the average value of annual mean streamflow at the Cuntan, Yichang, Hankou and Datong stations during the pre-TGD and the post-TGD periods. In Table 1, Qpre was the observed streamflow during the pre-TGD periods, Qpost was the observed streamflow during the post-TGD periods, Qsim was the reconstructed streamflow during the post-TGD periods. ∆Q1 denoted the observed streamflow during the post-TGD periods minus the observed streamflow during the pre-TGD periods (Qpost − Qpre), ∆Q2 means the observed streamflow minus the reconstructed streamflow during the post-TGD periods (Qpost − Qsim). It could be found that the streamflow at the Cuntan station dropped 4.93% during the post-TGD period compared to the pre-TGD period. The decrease of streamflow for the other three stations was even more severe than that of the Cuntan station. The streamflow at the Yichang, Hankou and Datong stations dropped more than 6% during the post-TGD period compared to the pre-TGD period (Table 1). However, compared with the reconstructed streamflow, the streamflow of the Yichang, Hankou and Datong stations dropped slightly by 0.63%, 0.37% and 0.30%, respectively (Table 1). This indicated that the operation of TGD has also changed the streamflow in the lower Yangtze River. However, it was not the main cause of the streamflow decrease in the lower Yangtze River basin.
In order to figure out how the TGD influenced the lower Yangtze River, the accumulated streamflow anomalies in the upper and lower Yangtze River basin at the Cuntan, Yichang, Hankou and Datong stations were analyzed, respectively (Figure 3a). It can be found that the trends of the streamflow anomalies at the Cuntan, Yichang, Hankou and Datong stations have similar patterns. The streamflow anomalies increased in the early 1980s, and decreased in the 1950s, 1970s and the latter half of the 2000s. However, the trends of the Cuntan and Yichang stations were opposite to that of the Datong station in the middle 1990s. At that time, the trends of the Cuntan and Yichang stations decreased slowly; however, there were marked increasing trends at the Datong station. The accumulated streamflow anomalies at the four stations and the inflow and outflow of the TGD were shown in Figure 3b. The trends of inflow and outflow of the TGD were similar to that of the Cuntan, Yichang and Hankou stations. However, the trends of inflow and outflow of the TGD were different from that of the Datong station. The trends of inflow and outflow of the TGD had changed slightly in 2004 and 2005 while the Datong station decreased sharply at the same time.

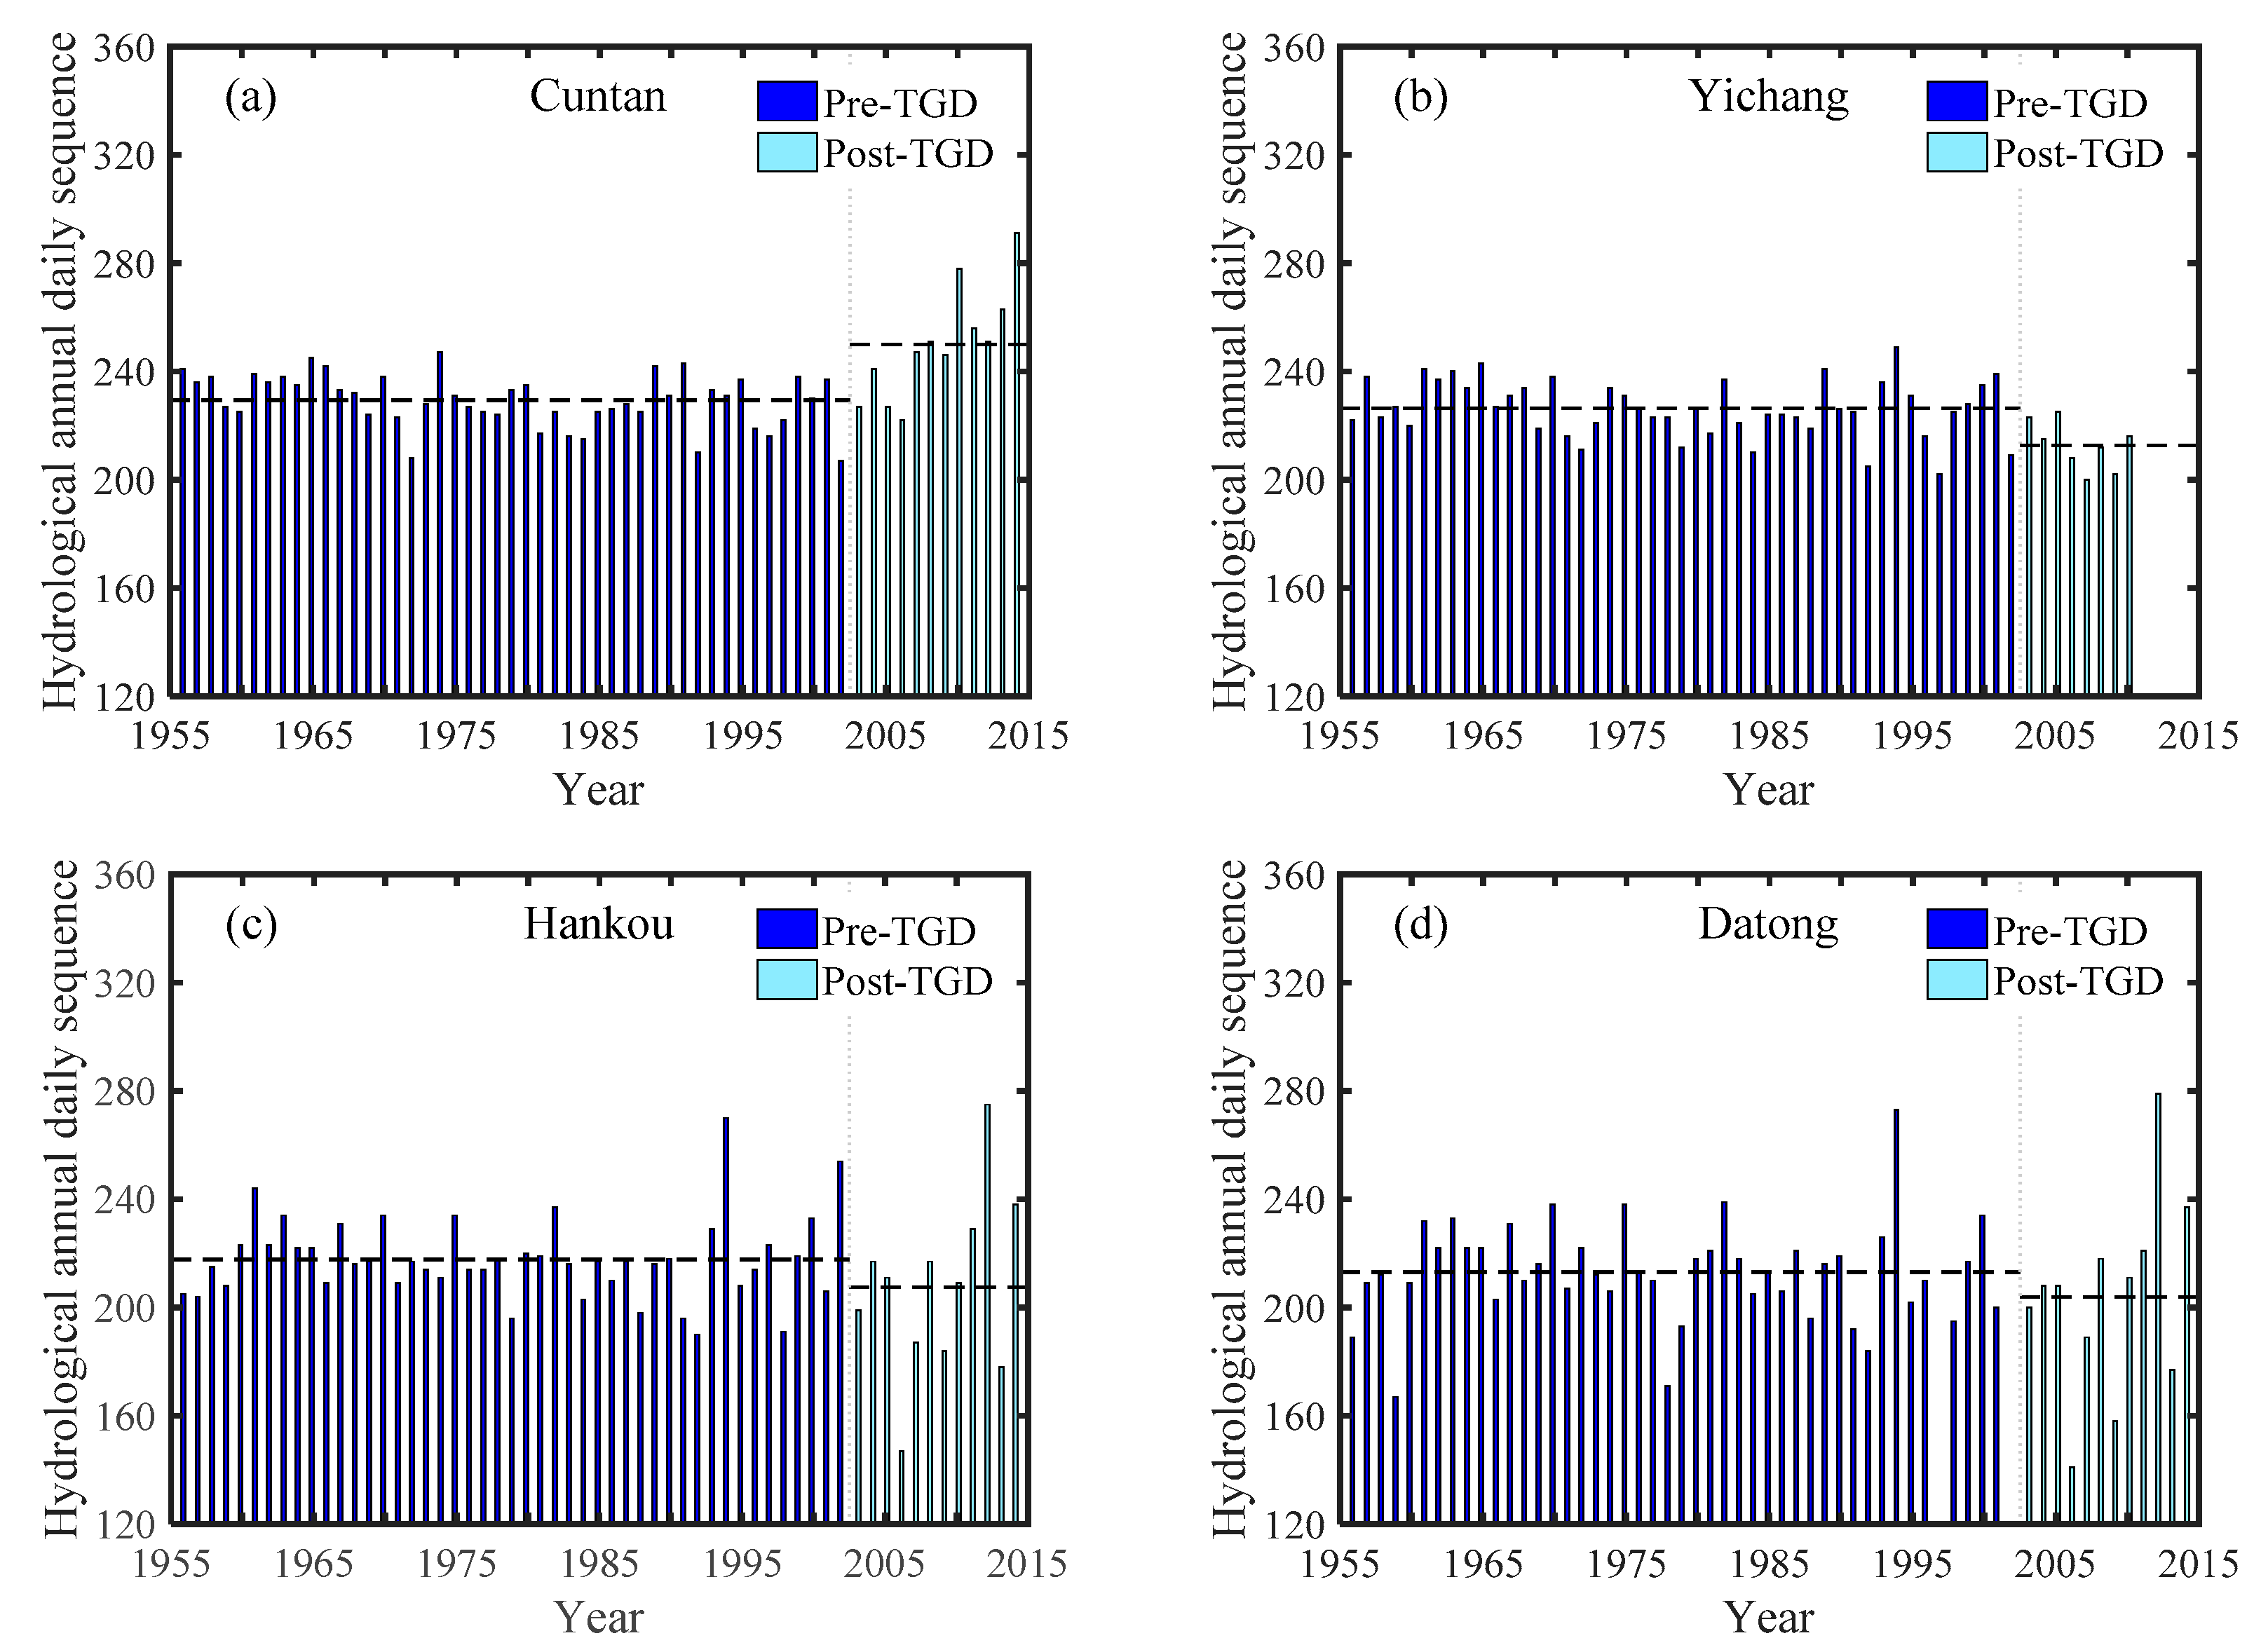
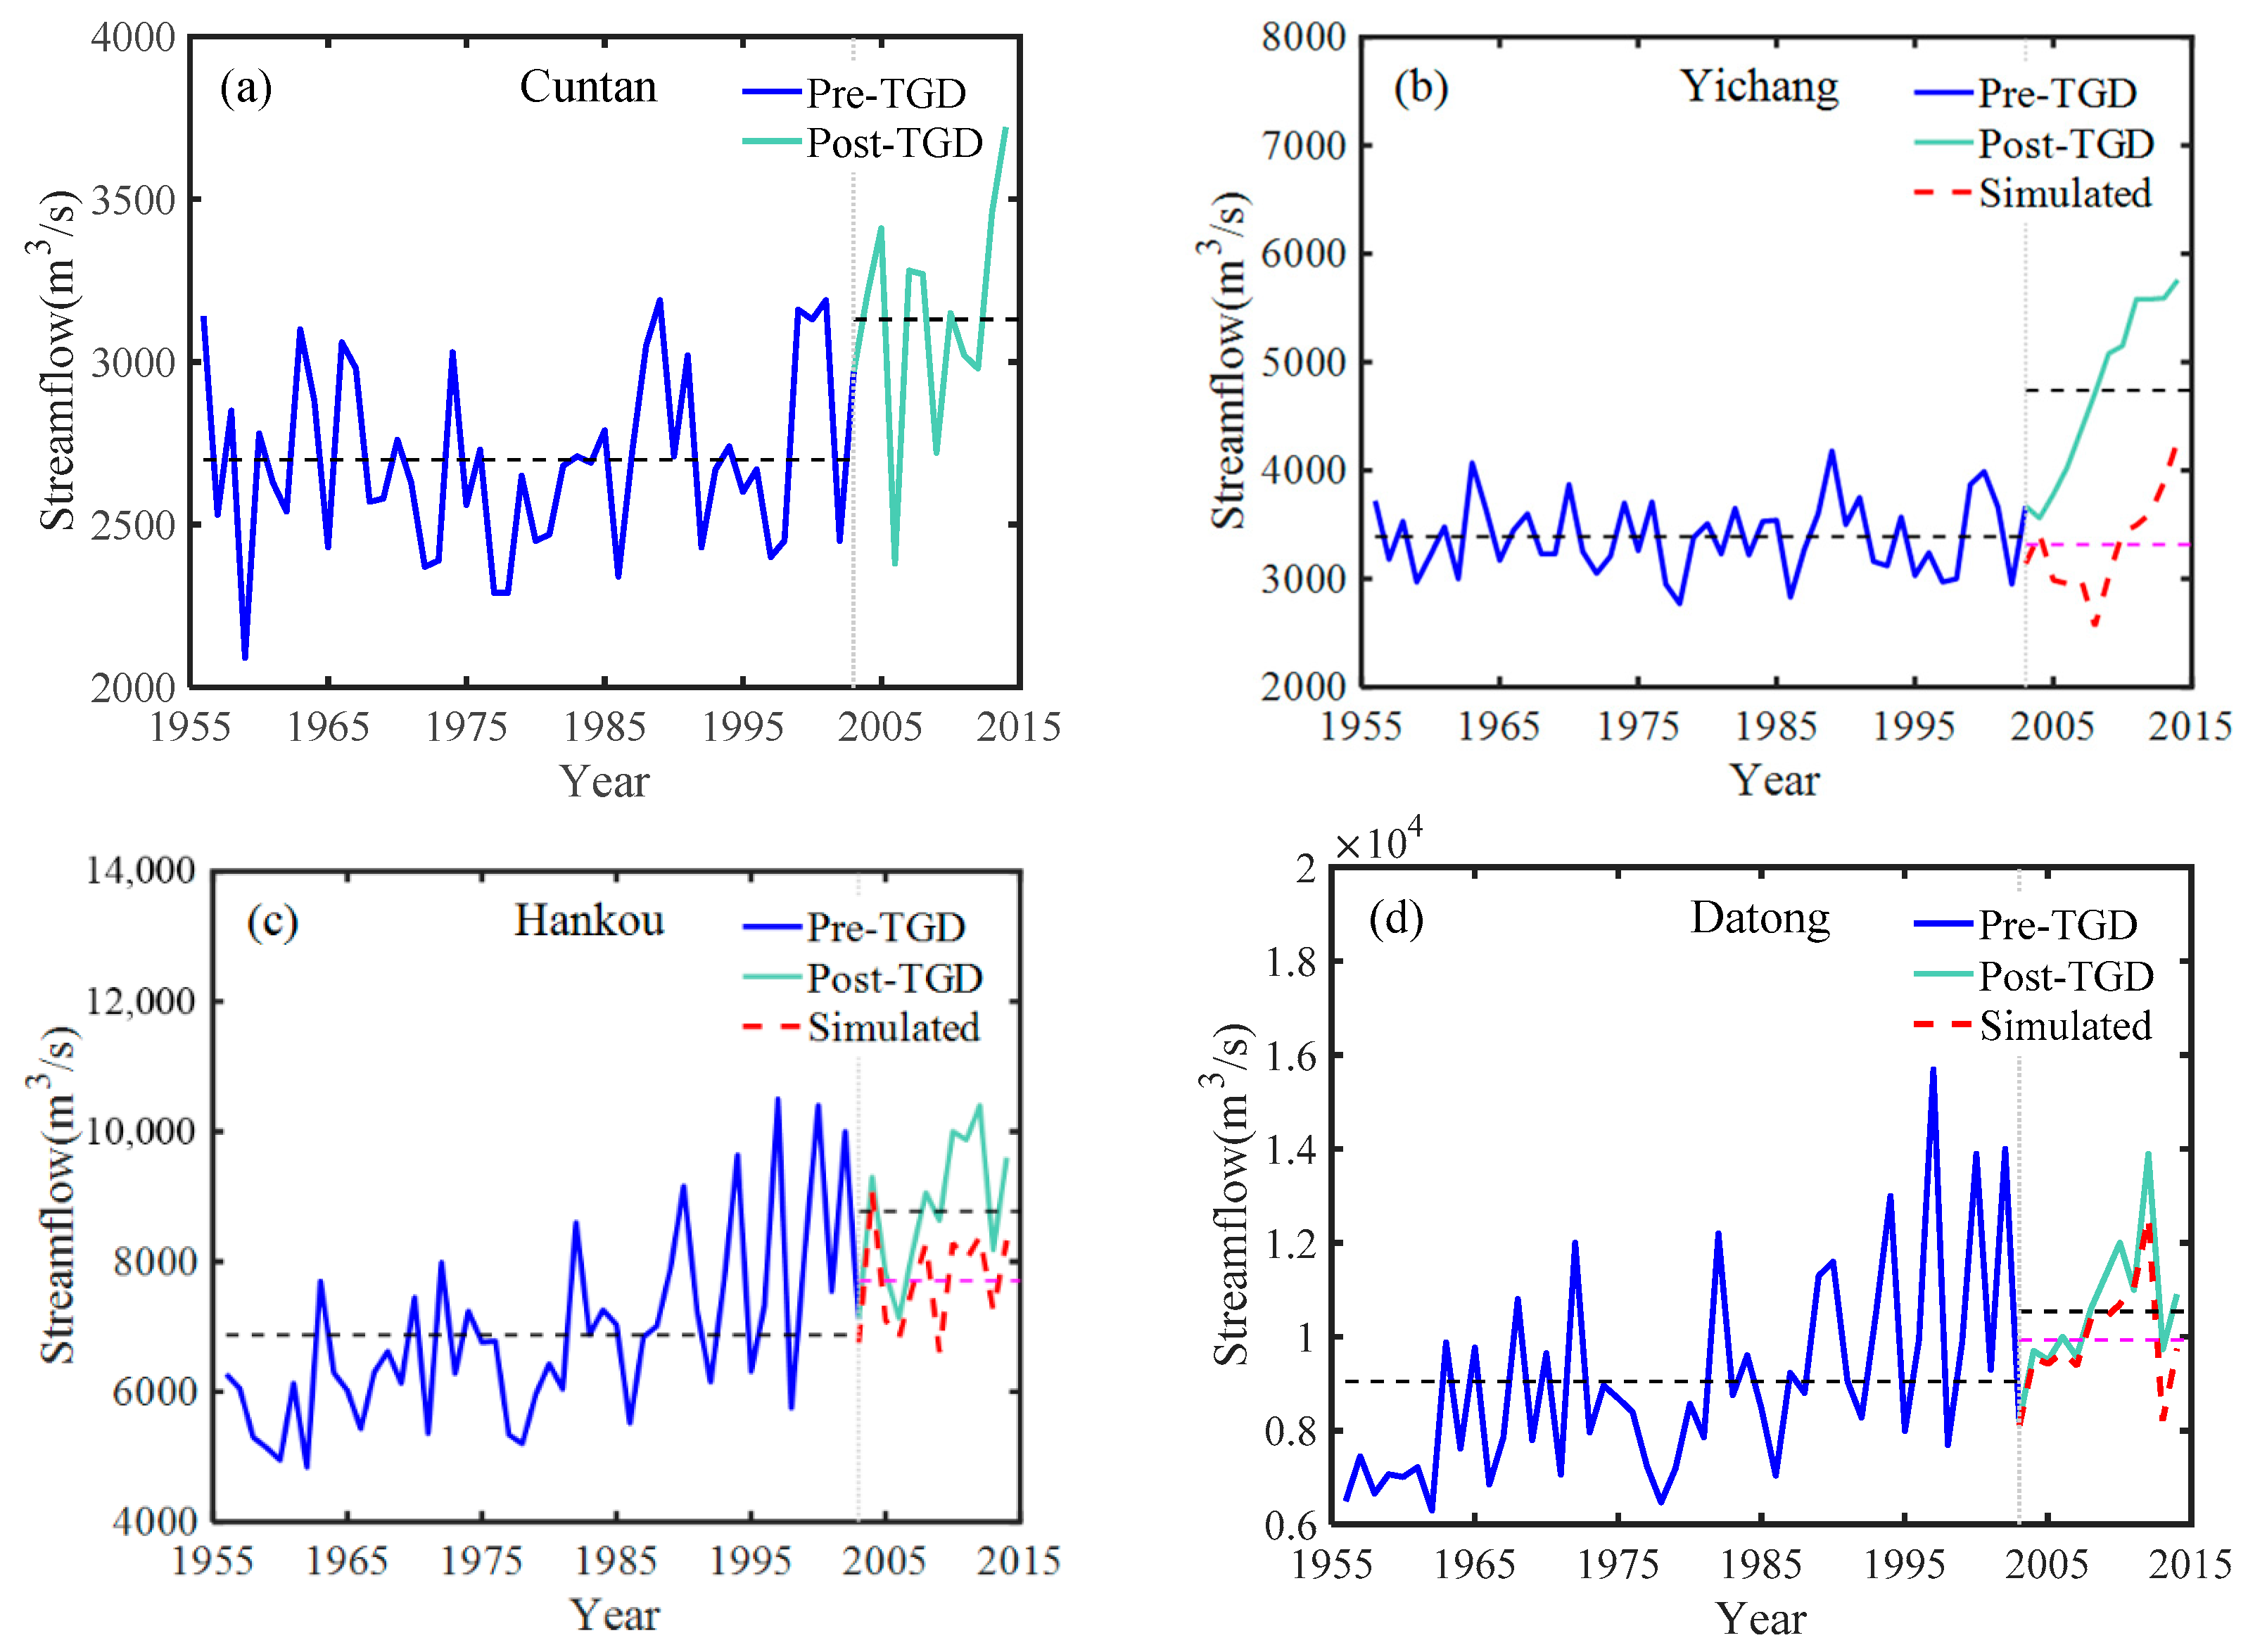
3.2. The Impacts of TGD on Downstream Low Flow in the Yangtze River

Does the operation of the TGD have influenced the streamflow of the main stream of the Yangtze River during the dry season? Mean streamflow at the Cuntan, Yichang, Hankou and Datong stations for the dry season during the period of 1956–2015 were exhibited in Figure 4. It can be seen that the streamflow at the Cuntan station increased slightly after the year of 2003 (Figure 4a). For the lower Yangtze River basin at the Yichang, Hankou and Datong stations, the mean streamflow for the dry season during the post-TGP period was obviously higher than that of the pre-TGP period (Figure 4b–d). The results of the t-test showed that p values of the four stations were all less than 0.05, which indicated the statistical significance difference existed between these two different periods. Table 2 showed the statistical information for the mean streamflow of the dry season at the Cuntan, Yichang, Hankou and Datong stations for the pre-TGD and the post-TGD periods. In this table, Qpre was the observed mean streamflow of the dry season for the pre-TGD period, Qpost was the observed mean streamflow for the dry season during the post-TGD period, Qsim was the reconstructed mean streamflow for the dry season during the post-TGD period. Table 2 showed that the mean streamflow of the dry season increased about 470.14 m3/s during the post-TGD period compared to that of the pre-TGD period at the Cuntan station, however, the mean streamflow of the dry season at the Yichang, Hankou and Datong stations increased higher than that of the Cuntan station. Mean streamflow of the dry season for the period of the post-TGD period increased by 9.01%, 3.57% and 2.1% compared to that of the pre-TGD period at the Yichang, Hankou and Datong stations, respectively (Table 2). As for the reconstructed streamflow, it can be found that the simulated streamflow of the dry season was lower than that of observed streamflow. Thus, it can be inferred that the operation of TGD could even increase the streamflow of the dry season, which could improve the navigation capacity of the Yangtze River during that period (Figure 4b–d).
Cumulative probabilities of the streamflow at the Cuntan, Yichang, Hankou and Datong stations during the pre-TGD and the post-TGD periods in the dry season was analyzed in Figure 5. It can be found that the pattern of the cumulative probabilities of the streamflow at the Cuntan station during the pre-TGD period was similar to that of the post-TGD period (Figure 5a). However, it had clear differences between the Cuntan station and the other stations for the cumulative probabilities of the streamflow in the dry season. The streamflow for the other three stations of the post-TGD period were much greater than that of the pre-TGD period in extreme drought years (p < 10% in Figure 5b–d). Moreover, the cumulative probabilities of the streamflow of the dry season at the Cuntan, Yichang, Hankou and Datong stations during the pre-TGD period were always higher than that of post-TGD period for the drought years (10% < p < 85% in Figure 5). It is noteworthy that the streamflow for all the four stations during the post-TGD period turned to be mildly lower than that of the pre-TGD period for the extreme wet years (p > 85% in Figure 5). Therefore, the TGD could increase the low value streamflow of the extreme drought years and slightly decrease the high value streamflow of the extreme wet years in the downstream.
Figure 6 showed the hydrological annual daily sequence of the beginning of the dry season during the pre-TGD and the post-TGD periods. It can be seen that the TGD operation could advance the beginning date of the dry season at the Yichang, Hankou and Datong stations, while the start date of dry season in the upper Yangtze River basin (Cuntan station) was delayed over 21 days. In fact, the impounding of the TGD has caused the start date of the dry season to be advanced by more than 14, 10 and 9 days at the Yichang, Hankou and Datong stations, respectively. The advancing of the start date of dry season could aggravate the impacts of the drought in October in the lower Yangtze River. However, it should be pointed out that the dry season almost disappeared in some years after the TGD operation, such as the hydrological years of 2012, 2013 and 2014 in Yichang station.
Figure 7 revealed that the streamflow in October decreased sharply due to the impounds of the TGD for the Yichang, Hankou and Datong stations. Although the mean streamflow for the four stations during the post-TGD periods was lower than that of the pre-TGD periods, the simulated streamflow was much lower than the observed streamflow after TGD impounding in the lower Yangtze River. This phenomenon displayed that the impounding of the TGD intensified the drought of the lower Yangtze River in October. Similar results can also be found in Figure 1. Besides, the differences of the streamflow between the pre-TGD and post-TGD in October at Cuntan, Yichang, Hankou and Datong stations were significant by using the t-test method (p < 0.05).

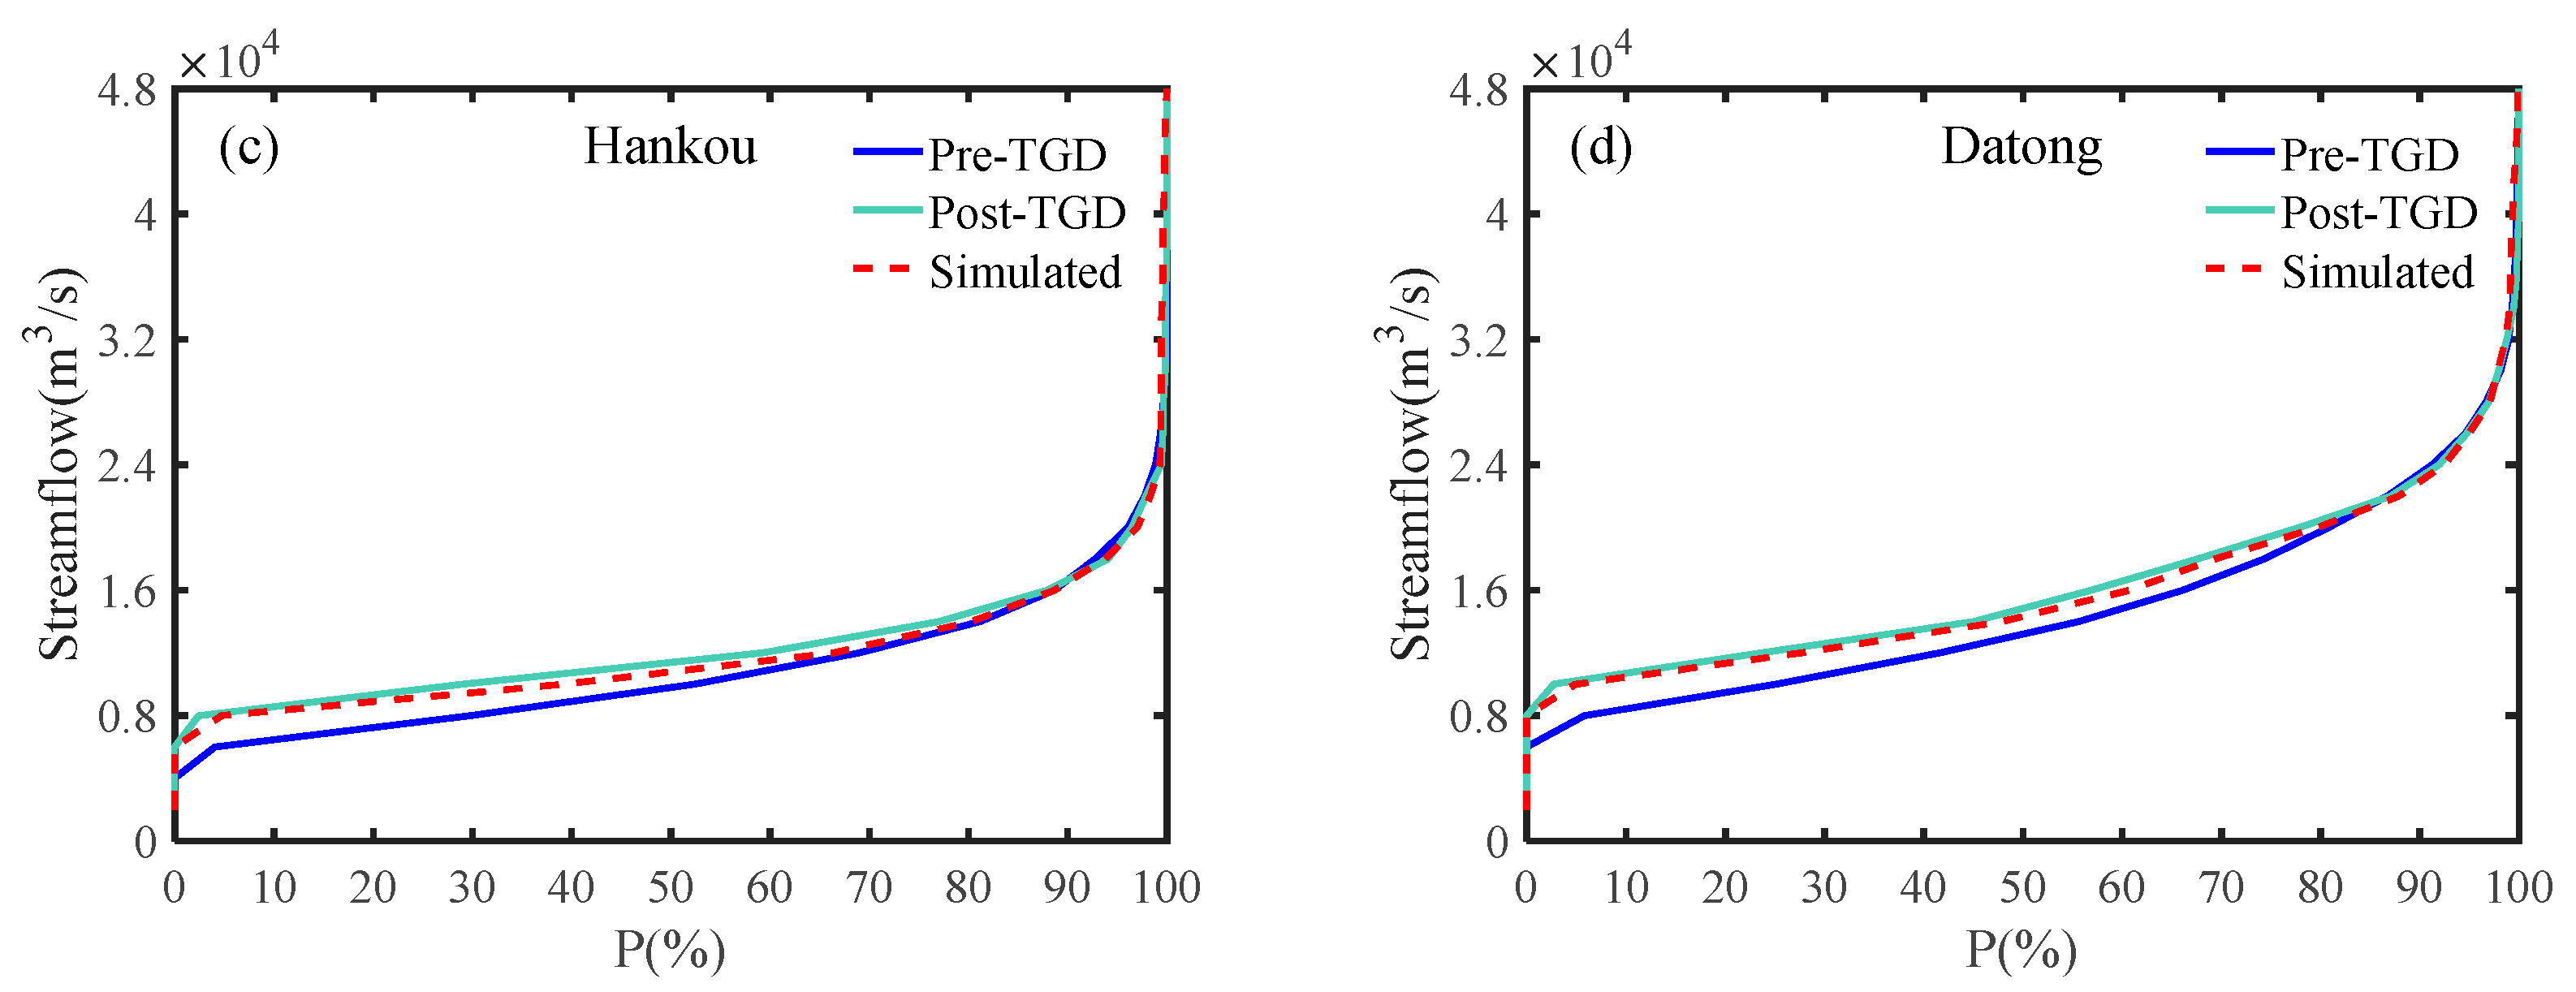
3.3. The Impacts of the TGD on Minimum Streamflow of the Main Yangtze River

Figure 8 showed that the minimum streamflow at the Cuntan, Yichang, Hankou and Datong stations has increased slightly after the year of 2004 due to the operation of the TGD. t-Test was also used in order to calculate that statistical significance of average streamflow before and after the building of the TGD. The results showed that there was a significant difference between average discharges in the two periods for Cuntan, Yichang, Hankou and Datong stations (p < 0.05). Table 3 showed the statistical information for the minimum streamflow at the Cuntan, Yichang, Hankou and Datong stations for the pre-TGD and the post-TGD periods. In Table 3, Qpre was the observed minimum streamflow during the pre-TGD periods, Qpost was the observed minimum streamflow during the post-TGD periods, Qsim was the reconstructed minimum streamflow during the post-TGD periods. It can be found that the minimum streamflow increased by 16.25% during the post-TGD period than that of the pre-TGD period at the Cuntan station, however, the minimum streamflow at the Yichang, Hankou and Datong stations increased higher than that of Cuntan station. In addition, compared with the reconstructed minimum streamflow, the observed minimum streamflow of the Yichang, Hankou and Datong stations increased by 42.91%, 13.76% and 6.06%, respectively (Table 3). It indicated that the operation of TGD could increase the minimum streamflow in the lower Yangtze River as well.
Table 4 exhibited the 10-year, 20-year, 50-year and 100-year return period at the Cuntan, Yichang, Hankou and Datong stations during the dry season from 1956 to 2015. In Table 4, Qobs denoted the observed streamflow, Qsim was the reconstructed streamflow. It can be found that the impoundment of the TGD had increased the streamflow of the return period in the lower Yangtze. The impounding of the TGD had the greatest influence on the Yichang station, it increased the streamflow of the 100-year return period during the dry season by 13.56%. The impounding of the TGD had little influence on the Datong station, the percentage of the raise for the streamflow of a 100-year return period during the dry season was only 0.05%.

4. Discussion

Recently, severe water shortages of the Yangtze River basin have aroused widespread concern and added the probability of the TGD being accountable for the change of the downstream low flow in the Yangtze River. Despite various studies revealing the considerable effects on the Yangtze River [53], the TGD’s impacts on downstream low flow in the Yangtze River still needs to be further assessed.
This work quantified the effects of the TGD on the main stream of the Yangtze River by using a six-decade runoff record in this basin and the inflow and outflow data of the TGD. We found that the operation of the TGD could reduce Yangtze River discharge in the wet season, while increasing the streamflow during the dry season. In addition, the streamflow decreased sharply after the TGD impounding in the middle and lower Yangtze River. Therefore, the impounding of the TGD could reduce the streamflow of main Yangtze River, which could aggravate the drought of Yangtze River. These results agreed well with the previous research [53]. For instance, Dai et al. [53], Guo et al. [54] and Lai et al. [55] demonstrated that dams could create reductions in peak flow and increase low flow by impounding and releasing water. Cowell and Stoudt [49] made the same point through the study of the Kinzua Dam in northwestern Pennsylvania. Guo et al. also described that the building of the TGD has led to less variation in the Yangtze River flow in the majority of the seasons. However, Botter et al. [45] and Mix et al. [46] found that the building of dam leads to remarkable reductions of streamflow in the Piave River, Italy and the upper Colorado River basin, Texas. This conclusion is inconsistent with our research. It is possible that we should focus on the environmental and other human factors, which also influenced the streamflow in the rivers.
This work also quantified the influences of the TGD on downstream low flow of the main stream of the Yangtze River as well. The low flow increased after the operation of the TGD was more than 630 m3/s in the Yichang, Hankou and Datong stations. The TGD could even increase the streamflow by 9.01% for the Yichang station compared with the simulated streamflow. Consequently, the TGD could increase the downstream low flow in the Yangtze River. This improvement wan from upstream to downstream. We also found that the TGD could increase the low value streamflow of the extreme drought years (p < 10%). Meanwhile, the impounding of the TGD decreased the high value streamflow of the extreme wet years (p > 85%) slightly. It can be discovered that the start dates of the dry season in Yichang, Hankou and Datong stations were advanced for 14 days, 10 days and 9 days, respectively. The TGD impounds water mainly in late September and early October while it releases more water in the dry season. This study revealed that the streamflow in October decreased sharply due to the operation of the TGD, which means the impounding of the TGD could intensify the drought of the lower Yangtze River basin in October. However, the influence of the TGD has resulted in less than 10% of the variation in the Yangtze River flow in most of the seasons [56]. Therefore, the TGD inflow value is more or less similar to the outflow. Some studies reached the same conclusions. For example, Fitzhugh and Vogel [47] pointed out that dams throughout the United States reduced the flood flows. Mix et al. [46] discovered that the construction of dam in the upper Colorado River basin of Texas could exacerbate hydrological drought downstream during a severe drought. Some researchers [69] found that the commencement of the dry season could be advanced because of the impounding of dams in Poyang Lake and upland regions of Victoria in southeast Australia. The previous studies also revealed that low water levels in the dry season of the lower Yangtze River have started earlier due to the TGD as well [60,61]. However, there were some researchers that reached different or even contrary conclusions. For example, Williams and Gordon [42] thought that dams might decrease low flow discharges because the width of the low flow channel might be reduced by the invasion of non-aquatic vegetation in the semiarid western US. Some studies found that the dams could advance the appearance of the minimum streamflow. Liu et al. [70] discovered that the TGD postponed the date of the annual minimum daily streamflow. Burke et al. [48] revealed that the operation of Libby Dam could increase the minimum streamflow during the dry season in western North America. This phenomenon has been discovered in our study as well. We found that the operation of the TGD increased the minimum streamflow of Yichang, Hankou and Datong stations. These results prove that dams could cause complex impacts on streamflow in the rivers.
Some researchers also thought that the construction of large dams could lead to the occurrence of earthquakes and the earthquakes might increase the streamflow because they would settle and compact the surficial deposits, liquefy the saturated valley-bottom deposits and result in collapses and landslides [71,72]. However, besides natural disasters resulting from large dams, the increase in extreme weather events such as drought and flood caused by climate change has a potential influence on streamflow as well. Bernard et al. [73] discovered that the higher recurrence of extreme weather events was basically consistent with recent streamflow changes. Zhang et al. [68] pointed out that the extreme droughts in the Poyang Lake basin could lead to the decrease of streamflow. Wang et al. [72] revealed that the flash floods dominated by heavy rains within short time might cause landslides, which in turn blocked the river channels. Therefore, more attention should be paid to find further influences in a changing environment (e.g., the human activities and climate change) on low flow.

5. Conclusions

In this paper, the changing feature of the streamflow of the main Yangtze River with the impacts of the TGD were analyzed by using the daily streamflow at the Cuntan, Yichang, Hankou and Datong hydrological stations during the period of 1956–2016. The main conclusions were as follows:
(1)
The operation of the TGD has significantly increased the downstream low flow. The TGD has increased the low streamflow of the extreme drought years and slightly decreased the high value streamflow of the extreme wet years. Generally, the TGD has greatly changed the monthly and interannual distribution of streamflow in the lower Yangtze River.
(2)
The start date of the dry season in the upper Yangtze River basin was delayed for 21 days, however, the start dates of the dry season at Yichang, Hankou and Datong stations were advanced for 14, 10 and 9 days, respectively. The advancing of the start date of dry season could aggravate the impacts of the drought in October in the lower Yangtze River.
(3)
The minimum streamflow in the lower Yangtze River has increased obviously after the TGD operation. The minimum streamflow has increased by 42.91%, 13.76% and 6.06% at Yichang, Hankou and Datong stations, respectively. Moreover, the minimum streamflow in 100 years has increase obviously at Yichang station. Therefore, large dams in the Yangtze River has had a great impacts on the downstream low flow and similar things happen all over the world. More work should be done to study the complexity and risk affected by large dams on downstream low flow all over the world.

Author Contributions

Z.Z. provided the datasets including the required supporting geoinformation software needed for the analyses; Y.W., Y.W. and T.J. cooperated in designing and improving the concept of the research project and related processes; J.T. and J.C. conducted the data processing and analysis. All the authors participated actively in preparing and reviewing the manuscript.

Funding

This paper is financially supported by National Natural Science Foundation of China (Grant No. 41171020) and Distinguished Young Scholars Fund of Nanjing Forestry University (NLJQ2015-01).

Acknowledgments

The project was supported by the Six Talent Peaks project in Jiangsu Province (Grant no. 2015-JY-017) and the Priority Academic Program Development of Jiangsu Higher Education Institutions (PAPD). We would like to thank the National Climate Centre in Beijing for providing valuable climate datasets.

Conflicts of Interest

The authors declare no conflict of interest.

References

  1. Longobardi, A.; Villani, P. Baseflow index regionalization analysis in a mediterranean area and data scarcity context: Role of the catchment permeability index. J. Hydrol. 2008, 355, 63–75. [Google Scholar] [CrossRef]
  2. Zhou, Z.; Ouyang, Y.; Qiu, Z.; Zhou, G.; Lin, M.; Li, Y. Evidence of climate change impact on stream low flow from the tropical mountain rainforest watershed in Hainan Island, China. J. Water Clim. Chang. 2017, 8, 293–302. [Google Scholar] [CrossRef]
  3. Smakhtin, V.U. Low flow hydrology: A review. J. Hydrol. 2001, 240, 147–186. [Google Scholar] [CrossRef]
  4. Sun, Y.Y.; Sun, P.; Yao, R.; Zhang, Q.; Shi, P.J.; Wang, Y.Z. Characteristics of low streamflow: Possible causes and implications in Huaihe River basin. J.Beijing Normal Univ. (Nat. Sci.) 2018, 54, 543–552. (In Chinese) [Google Scholar]
  5. Wang, P. Analysis on the period characteristic of low flow in pearl river basin and effect factors. J. Hydraul. Eng. 2007, 1, 379–382. (In Chinese) [Google Scholar]
  6. Lu, L.J. Reason analysis and reflection of lower water level in low flow period on Poyang Lake and the Jiujiang reach of Changjiang River. Jiangxi Hydral. Sci. Technol. 2014, 40, 126–129. (In Chinese) [Google Scholar]
  7. Zhang, D. Navigational Risk Assessment in the Dry Season of Yangtze River. Ph.D. Thesis, Wuhan University of Technology, Wuhan, China, 2011. (In Chinese). [Google Scholar]
  8. Palmer, T.A.; Montagna, P.A. Impacts of droughts and low flows on estuarine water quality and benthic fauna. Hydrobiologia 2015, 753, 111–129. [Google Scholar] [CrossRef]
  9. Mosley, L.M.; Zammit, B.; Leyden, E.; Heneker, T.M.; Hipsey, M.R.; Skinner, D.; Aldridge, K.T. The Impact of Extreme Low Flows on the Water Quality of the Lower Murray River and Lakes (South Australia). Water Resour. Manag. 2012, 26, 3923–3946. [Google Scholar] [CrossRef]
  10. Dewson, Z.S.; Alexander, B.W.J.; Death, R.G. A review of the consequences of decreased flow for instream habitat and macroinvertebrates. J. N. Am. Benthol. Soc. 2007, 26, 401–415. [Google Scholar] [CrossRef]
  11. McKay, S.F.; King, A.J. Potential ecological effects of water extraction in small unregulated streams. River Res. Appl. 2006, 22, 1023–1037. [Google Scholar] [CrossRef]
  12. Stanley, E.H.; Fisher, S.G.; Grimm, N.B. Ecosystem Expansion and Contraction in Streams. Bioscience 1997, 47, 427–435. [Google Scholar] [CrossRef] [Green Version]
  13. Caruso, B.S. Temporal and spatial patterns of extreme low flows and effects on stream ecosystems in Otago, New Zealand. J. Hydrol. 2002, 257, 115–133. [Google Scholar] [CrossRef]
  14. Donnelly, T.H.; Grace, M.R.; Hart, B.T. Algal blooms in the Darling-Barwon River, Australia. Water Air Soil Poll. 1997, 99, 487–496. [Google Scholar] [CrossRef]
  15. van Vliet, M.; Ludwig, F.; Zwolsman, J.; Weedon, G.; Kabat, P. Global river temperatures and sensitivity to atmospheric warming and changes in river flow. Water Resour. Res. 2011, 47, W2544. [Google Scholar] [CrossRef]
  16. van Vliet, M.T.H.; Zwolsman, J.J.G. Impact of summer droughts on the water quality of the Meuse river. J. Hydrol. 2008, 353, 1–17. [Google Scholar] [CrossRef]
  17. Lake, P.S. Disturbance, patchiness, and diversity in streams. J. N. Am. Benthol. Soc. 2000, 19, 573–592. [Google Scholar] [CrossRef]
  18. Poff, N.L.; Voelz, N.J.; Ward, J.V.; Lee, R.E. Algal colonization under four experimentally-controlled current regimes in a high mountain stream. J. N. Am. Benthol. Soc. 1990, 9, 303–318. [Google Scholar] [CrossRef]
  19. Walters, A.W.; Post, D.M. How low can you go? Impacts of a low-flow disturbance on aquatic insect communities. Ecol. Appl. 2011, 21, 163–174. [Google Scholar] [CrossRef]
  20. Bond, N.R.; Lake, P.S.; Arthington, A.H. The impacts of drought on freshwater ecosystems: An Australian perspective. Hydrobiologia 2008, 600, 3–16. [Google Scholar] [CrossRef]
  21. Caruso, B.S. Regional river flow, water quality, aquatic ecological impacts and recovery from drought. Hydrol. Sci. J. 2001, 46, 677–699. [Google Scholar] [CrossRef] [Green Version]
  22. Tallaksen, L.M.; van Lanen, H.A.J. Hydrological Drought-Processes and Estimation Methods for Streamflow and Groundwater; Elsevier: Amsterdam, The Netherlands, 2004. [Google Scholar]
  23. Bowles, D.S.; Riley, J.P. Low flow modeling in small steep watersheds. J. Hydraul. Div. 1976, 102, 1225–1239. [Google Scholar]
  24. Gurnell, A.M. How many reservoirs? An analysis of flow recession from a glacier basin. J. Glaciol. 1993, 39, 409–414. [Google Scholar] [CrossRef]
  25. Hopkinson, C.; Young, G.J. The effect of glacier wastage on the flow of the Bow River at Banff, Alberta, 1951–1993. Hydrol. Processes 1998, 12, 1745–1762. [Google Scholar] [CrossRef]
  26. Fountain, A.G.; Tangborn, W.V. The Effect of Glaciers on Streamflow Variations. Water Resour. Res. 1985, 21, 579–586. [Google Scholar] [CrossRef]
  27. Hamlet, A.F.; Mote, P.W.; Clark, M.P.; Lettenmaier, D.P. Effects of Temperature and Precipitation Variability on Snowpack Trends in the Western United States. J. Clim. 2005, 18, 4545–4561. [Google Scholar] [CrossRef]
  28. McCabe, G.J.; Clark, M.P. Trends and Variability in Snowmelt Runoff in the Western United States. J. Hydrometeorol. 2005, 6, 476–482. [Google Scholar] [CrossRef]
  29. Stewart, I.T.; Cayan, D.R.; Dettinger, M.D. Changes in snowmelt runoff timing in western North America under a ’Business as Usual’ climate change scenario. Clim. Chang. 2004, 62, 217–232. [Google Scholar] [CrossRef]
  30. Stewart, I.T.; Cayan, D.R.; Dettinger, M.D. Changes toward Earlier Streamflow Timing across Western North America. J. Clim. 2005, 18, 1136–1155. [Google Scholar] [CrossRef]
  31. Stewart, I.T. Changes in snowpack and snowmelt runoff for key mountain regions. Hydrol. Process 2009, 23, 78–94. [Google Scholar] [CrossRef]
  32. White, E.L. Sustained flowin small Appalachian watersheds. Hydrol. Process 1977, 32, 71–86. [Google Scholar] [CrossRef]
  33. Marquès, M.; Bangash, R.F.; Kumar, V.; Sharp, R.; Schuhmacher, M. The impact of climate change on water provision under a low flow regime: A case study of the ecosystems services in the Francoli river basin. J. Hazard. Mater. 2013, 263, 224–232. [Google Scholar] [CrossRef] [PubMed]
  34. Owen, M. Groundwater Abstraction and River Flows. Water Environ. J. 2010, 5, 697–702. [Google Scholar] [CrossRef]
  35. Hetherington, E.D. Effects offorest harvesting on the hydrologic regime of carnation creek experimental watershed: A preliminary assessment. In Associate Committee on Hydrology; Canadian Hydrology Symposium: Fredericton, NB, Canada, 1982. [Google Scholar]
  36. Harr, R.D.; Levno, A.; Mersereau, R. Streamflow Changes After Logging 130-Year-Old Douglas Fir in Two Small Watersheds. Water Resour. Res 1982, 18, 637–644. [Google Scholar] [CrossRef]
  37. Hicks, B.J.; Beschta, R.L.; Harr, R.D. Long-term changes in streamflow following logging in western Oregon and associated fisheries implication. Water Resour. Bull. 1991, 27, 217–226. [Google Scholar] [CrossRef]
  38. Keppeler, E.T.; Ziemer, R.R. Logging effects on streamflow: Water yield and summer low flows at Caspar Creek in northwestern California. Water Resour. Res. 1990, 26, 1669–1679. [Google Scholar] [CrossRef]
  39. Smith, R.E. Effect of clearfelling pines on water yield in a small Eastern Transvaal catchment, South Africa. Water S. A. 1991, 17, 217–224. [Google Scholar]
  40. Bickerton, M.; Petts, G.; Armitage, P.; Castella, E. Assessing the ecological effects of groundwater abstraction on chalk streams: Three examples from Eastern England. Regul. Rivers Res. Mgmt. 1993, 8, 121–134. [Google Scholar] [CrossRef]
  41. Vörösmarty, C.J.; Green, P.; Salisbury, J.; Lammers, R.B. Global Water Resources: Vulnerability from Climate Change and Population Growth. Science 2000, 289, 284–288. [Google Scholar] [CrossRef]
  42. Williams, G.P.; Gordon, W.M. Downstream Effects of Dams on Alluvial Rivers; Professional Paper; Geological Survey: Washington, DC, USA, 1984; Volume 1286, p. 83. [Google Scholar]
  43. Friedman, J.M.; Osterkamp, W.R.; Scott, M.L.; Auble, G.T. Downstream effects of dams on channel geometry and bottomland vegetation: Regional patterns in the great plains. Wetlands 1998, 18, 619–633. [Google Scholar] [CrossRef]
  44. Nilsson, C.; Reidy, C.A.; Dynesius, M.; Revenga, C. Fragmentation and Flow Regulation of the World’s Large River Systems. Science 2005, 308, 405–408. [Google Scholar] [CrossRef]
  45. Botter, G.; Basso, S.; Porporato, A.; Rodriguez-Iturbe, I.; Rinaldo, A. Natural streamflow regime alterations: Damming of the Piave river basin (Italy). Water Resour. Res. 2010, 46, 1–14. [Google Scholar] [CrossRef]
  46. Mix, K.; Groeger, A.W.; Lopes, V.L. Impacts of dam construction on streamflows during drought periods in the Upper Colorado River Basin, Texas. Lakes Reserv. Res. Manag. 2016, 21, 329–337. [Google Scholar] [CrossRef]
  47. FitzHugh, T.W.; Vogel, R.M. The impact of dams on flood flows in the United States. River Res. Appl. 2011, 27, 1192–1215. [Google Scholar] [CrossRef]
  48. Burke, M.; Jorde, K.; Buffington, J.M. Application of a hierarchical framework for assessing environmental impacts of dam operation: Changes in streamflow, bed mobility and recruitment of riparian trees in a western North American river. J. Environ. Manag. 2009, 90, S224–S236. [Google Scholar] [CrossRef] [PubMed]
  49. Cowell, C.M.; Stoudt, R.T. Dam-induced Modifications to Upper Allegheny River Streamflow Patterns and Their Biodiversity Implications. J. Am. Water Resour. A. S. 2002, 38, 187–196. [Google Scholar] [CrossRef]
  50. Neal, B.P.; Shephard, P.; Austin, K.A.; Nathan, R.J.; Merz, S.K. The Effect of Catchment Farm Dams on Streamflows-Victorian Case Studies. In Proceedings of the Hydro 2000: Interactive Hydrology, Barton, Australia, 5 October 2000. [Google Scholar]
  51. Bonacci, O.; Oskoruš, D. The changes in the lower Drava River water level, discharge and suspended sediment regime. Environ. Earth Sci. 2010, 59, 1661–1670. [Google Scholar] [CrossRef]
  52. Qiu, J. China admits problems with Three Gorges Dam. Nature 2011. [CrossRef]
  53. Dai, Z.J.; Du, J.Z.; Li, J.F.; Li, W.H.; Chen, J.Y. Runoff characteristics of the Changjiang River during 2006: Effect of extreme drought and the impounding of the Three Gorges Dam. Geophys. Res. Lett. 2008, 35, L7401–L7406. [Google Scholar] [CrossRef]
  54. Guo, H.; Hu, Q.; Zhang, Q.; Feng, S. Effects of the Three Gorges Dam on Yangtze River flow and river interaction with Poyang Lake, China: 2003–2008. J. Hydrol. 2012, 416–417, 19–27. [Google Scholar] [CrossRef]
  55. Lai, X.J.; Jiang, J.H.; Yang, G.S.; Lu, X.X. Should the Three Gorges Dam be blamed for the extremely low water levels in the middle-lower Yangtze River? Hydrol. Process 2014, 28, 150–160. [Google Scholar] [CrossRef]
  56. Guo, H.; Hu, Q.; Zhang, Q. Changes in hydrological interactions of the Yangtze River and the Poyang Lake in China during 1957–2008. J. Geogr. Sci. 2011, 66, 609–618. [Google Scholar]
  57. Yang, S.L.; Zhang, J.; Xu, X.J. Influence of the Three Gorges Dam on downstream delivery of sediment and its environmental implications, Yangtze River. Geophys. Res. Lett. 2007, 34, L10401. [Google Scholar] [CrossRef]
  58. Chen, X.Q.; Zong, Y.Q.; Zhang, E.F.; Xu, J.G.; Li, S.J. Human impacts on the Changjiang (Yangtze) River basin, China, with special reference to the impacts on the dry season water discharges into the sea. Geomorphology 2001, 41, 111–123. [Google Scholar] [CrossRef]
  59. Zhang, Q.; Li, L.; Wang, Y.G.; Werner, A.D.; Xin, P.; Jiang, T.; Barry, D.A. Has the Three-Gorges Dam made the Poyang Lake wetlands wetter and drier? Geophys. Res. Lett. 2012, 39, L20401–L20402. [Google Scholar] [CrossRef]
  60. Deng, J.Y.; Fan, S.Y.; Pang, C.N.; Liu, C.C. Adjustment of Regulation and Storage Capacity of Lakes in the Middle Yangtze River Basin During Impoundment of Three Gorges Reservoir. J. Yangtze River Sci. Res. Inst. 2018, 35, 147–152. (In Chinese) [Google Scholar]
  61. Zhang, Q.; Ye, X.H.; Werner, A.D.; Li, Y.L.; Yao, J.; Li, X.H.; Xu, C.Y. An investigation of enhanced recessions in Poyang Lake: Comparison of Yangtze River and local catchment impacts. J. Hydrol. 2014, 517, 425–434. [Google Scholar] [CrossRef] [Green Version]
  62. Cao, L.J.; Zhang, Y.; Shi, Y. Climate change effect on hydrological processes over the Yangtze River basin. Quatern. Int. 2011, 244, 202–210. [Google Scholar] [CrossRef]
  63. Gemmer, M.; Jiang, T.; Su, B.; Kundzewicz, Z.W. Seasonal precipitation changes in the wet season and their influence on flood/drought hazards in the Yangtze River Basin, China. Quatern. Int. 2008, 186, 12–21. [Google Scholar] [CrossRef]
  64. Yu, F.L.; Chen, Z.Y.; Ren, X.Y.; Yang, G.F. Analysis of historical floods on the Yangtze River, China: Characteristics and explanations. Geomorphology 2009, 113, 210–216. [Google Scholar] [CrossRef]
  65. Gao, B.; Yang, D.W.; Zhao, T.T.G.; Yang, H.B. Changes in the eco-flow metrics of the Upper Yangtze River from 1961 to 2008. J. Hydrol. 2012, 448–449, 30–38. [Google Scholar] [CrossRef]
  66. Zhang, Q.; Liu, C.L.; Xu, C.Y.; Xu, Y.P.; Jiang, T. Observed trends of annual maximum water level and streamflow during past 130 years in the Yangtze River basin, China. J. Hydrol. 2006, 324, 255–265. [Google Scholar] [CrossRef]
  67. Yin, H.F.; Liu, G.R.; Pi, J.G.; Chen, G.J.; Li, C.A. On the river–lake relationship of the middle Yangtze reaches. Geomorphology 2007, 85, 197–207. [Google Scholar] [CrossRef]
  68. Zhang, Z.X.; Chen, X.; Xu, C.Y.; Hong, Y.; Hardy, J.; Sun, Z.H. Examining the influence of river–lake interaction on the drought and water resources in the Poyang Lake basin. J. Hydrol. 2015, 522, 510–521. [Google Scholar] [CrossRef]
  69. Wang, D.; Li, Y.T.; Deng, J.Y.; Yang, Y.P. Preliminary analysis of changes in hydraulic elements of Dongting lake in storage period of Three Gorges reservoir. J. Hydroelectr. Eng. 2014, 33, 26–32. (In Chinese) [Google Scholar]
  70. Liu, W.B.; Yang, T.; Du, M.Y.; Sun, F.B.; Liu, C.M. Impact of the Three Gorges Dam on the Hydrology Mechanism of Typical Hydrologic Stations in the Middle and Lower Reaches of the Yangtze River. Ecol. Environ. Monit. TG 2018, 3, 8–15. (In Chinese) [Google Scholar]
  71. Montgomery, D.R.; Greenberg, H.M.; Smith, D.T. Streamflow response to the Nisqually earthquake. Earth Planet. Sci. Lett. 2003, 209, 19–28. [Google Scholar] [CrossRef]
  72. Wang, J.; Yu, Y.; Ou, G.Q.; Pan, H.L.; Qiao, C. Flash Flood Risk Zoning of Areas Hit by Wenchuan Earthquake in the Upper Reach of Minjiang River. J. Yangtze River Sci. Res. Inst. 2017, 34, 54–60. (In Chinese) [Google Scholar]
  73. Bernard, B.; Vincent, K.; Frank, M.; Anthony, E. Comparison of extreme weather events and streamflow from drought indices and a hydrological model in River Malaba, Eastern Uganda. Int. J. Environ. Stud. 2013, 70, 940–951. [Google Scholar] [CrossRef]
Figure 1. Location of the study area and the monthly average streamflow distribution of the Cuntan (a); Yichang (b); Hankou (c) and Datong (d) stations.
Water 11 00065 g001
Figure 2. Observed and reconstructed annual mean streamflow for Cuntan (a), Yichang (b), Hankou (c) and Datong (d) during the pre-Three Gorges Dam (TGD) (1956–2003) and post-TGD (2004–2015) periods (the difference in annual mean streamflow before and after the TGD operation was statistically significant at the 0.05 significance level using the method of t-test).
Water 11 00065 g002aWater 11 00065 g002b
Figure 3. The accumulated monthly streamflow anomalies compared with the average over (a) 1956–2016 and (b) 2004–2016 in the Yangtze River basin. The inflow and outflow of the TGD represent the water balance of the TGD.
Water 11 00065 g003aWater 11 00065 g003b
Figure 4. Mean streamflow at Cuntan (a); Yichang (b); Hankou (c) and Datong (d) for the dry season during the period of 1956–2015 (the difference in average streamflow before and after the TGD operation was statistically significant at the 0.05 significance level with t-test).
Water 11 00065 g004aWater 11 00065 g004b
Figure 5. Cumulative probabilities of streamflow for pre-TGD and post-TGD period in Yangtze River at Cuntan (a); Yichang (b); Hankou (c) and Datong (d).
Water 11 00065 g005aWater 11 00065 g005b
Figure 6. The hydrological annual daily sequence of the start of dry season of Cuntan (a); Yichang (b); Hankou (c) and Datong (d) from hydrological year 1956 to 2014.
Water 11 00065 g006
Figure 7. Streamflow at Cuntan (a); Yichang (b); Hankou (c) and Datong (d) in October during the period of 1956–2015 (the difference in average streamflow before and after the TGD operation was statistically significant at the 0.05 significance level with t-test).
Water 11 00065 g007
Figure 8. Minimum streamflow at Cuntan (a), Yichang (b), Hankou (c) and Datong (d) during the period of 1956–2015 (the difference in average streamflow before and after the TGD operation was statistically significant at the 0.05 significance level with the t-test).
Water 11 00065 g008
Table 1. The annual average streamflow for the Cuntan, Yichang, Hankou and Datong stations during the pre-TGD and the post-TGD periods (∆Q1 means Qpost minus Qpre, ∆Q2 means Qpost minus Qsim).
StationsQpre (m3/s)Qpost (m3/s)Qsim (m3/s)∆Q1 (m3/s)∆Q1/Qpre (%)∆Q2 (m3/s)∆Q2/Qsim (%)
Cuntan10,886.6110,350.38−536.23−4.93
Yichang13,702.1112,370.6212,448.84−1331.49−9.72−78.21−0.63
Hankou22,399.6921,037.8821,117.02−1361.81−6.08−79.14−0.37
Datong28,273.7126,563.9626,643.18−1709.75−6.05−79.21−0.3
Table 2. Mean streamflow of the dry season at the Cuntan, Yichang, Hankou and Datong stations for the pre-TGD and the post-TGD periods (∆Q1 means Qpost minus Qpre, ∆Q2 means Qpost minus Qsim).
StationsQpre (m3/s)Qpost (m3/s)Qsim (m3/s)∆Q1 (m3/s)∆Q1/Qpre (%)∆Q2 (m3/s)∆Q2/Qsim (%)
Cuntan4132.274602.41470.1411.38
Yichang5360.015998.595502.77638.5811.91495.839.01
Hankou10,834.7812,110.911,693.191276.1211.78417.713.57
Datong14,773.2716,026.7915,696.481253.528.49330.312.1
Table 3. Minimum streamflow at the Cuntan, Yichang, Hankou and Datong stations for the pre-TGD and the post-TGD periods (∆Q1 means Qpost minus Qpre, ∆Q2 means Qpost minus Qsim).
StationsQpre (m3/s)Qpost (m3/s)Qsim (m3/s)∆Q1 (m3/s)∆Q1/Qpre (%)∆Q2 (m3/s)∆Q2/Qsim (%)
Cuntan2693.193130.83437.6416.25
Yichang3383.194738.333315.611355.1440.061422.7242.91
Hankou6870.648771.677710.361901.0327.671061.3113.76
Datong9044.4710,533.339931.931488.8716.46601.406.06
Table 4. The 10-year, 20-year, 50-year and 100-year return period of Yichang, Hankou and Datong stations during the dry season from 1956 to 2015 (∆Q means Qobs minus Qsim).
Return Period (Years)YichangHankouDatong
Qobs (m3/s)Qsim (m3/s)∆Q/Qsim (%)Qobs (m3/s)Qsim (m3/s)∆Q/Qsim (%)Qobs (m3/s)Qsim (m3/s)∆Q/Qsim (%)
10631661452.7813,04912,9121.0618,20018,1080.51
20663262845.5513,54613,4190.9519,10519,0320.38
50702063859.9514,04813,9420.7620,06820,0280.2
1007298642613.5614,34114,2540.6220,66220,6510.05

