Article

Ecohydrological Changes and Resilience of a Shallow Lake Ecosystem under Intense Human Pressure and Recent Climate Change

by
Arkadiusz Bartczak
1,*,
Sandra Słowińska
2,
Sebastian Tyszkowski
1,
Mateusz Kramkowski
1,
Halina Kaczmarek
1,
Jarosław Kordowski
1 and
Michał Słowiński
1
1
Department of Environmental Resources and Geohazards, Institute of Geography and Spatial Organization, Polish Academy of Sciences, Kopernika 19, 87-100 Toruń, Poland
2
Department of Geoecology and Climatology, Institute of Geography and Spatial Organization, Polish Academy of Sciences, Twarda 51/55, 00-818 Warsaw, Poland
*
Author to whom correspondence should be addressed.
Water 2019, 11(1), 32; https://doi.org/10.3390/w11010032
Submission received: 7 December 2018 / Revised: 18 December 2018 / Accepted: 21 December 2018 / Published: 24 December 2018
(This article belongs to the Special Issue Effects of Climate Change on Water Resources)

Abstract

:
In this work we present the complicated situation of a faunistically and floristically valuable ecosystem of the Rakutowskie Lake wetlands complex, which is part of the Special Protection Area for Birds of “Błota Rakutowskie” (PLB40001) and “Błota Kłócieńskie” Habitats Directive Sites (PLH040031) included in the Natura 2000 network. Numerous ornithological observations have drawn our attention to the problem of rapidly progressing overgrowth of the lake and significant fluctuations in its water surface area. These fluctuations, especially in the spring period, significantly limit safe reproduction possibilities of very rare species of water–marsh birds. A multidirectional and comprehensive spectrum of research works allowed us to determine the genesis of the ecosystem and show that the shallow lake is undergoing the final stage in its evolution. The economic aspect of human activity (changes in land use and land development works) has contributed to serious degradation of the ecosystem. Climate changes observed in recent years (increased air temperature and, consequently, higher evaporation) additionally deepen and accelerate this process. The research made it possible to determine how the ecosystem functions today, but it is also an attempt to determine our predictions about its future.

1. Introduction

Wetlands are “hot spots” in terms of broadly understood environmental protection but also, more specifically, in the fields of biogeography and biodiversity [1,2]. Not only do wetlands play a substantial role in maintaining their biodiversity [3] but they are also invaluable as natural habitats or bird migration hubs [4,5]. Structurally and qualitatively diverse ecosystems with a low degree of transformation guarantee a high number, diversity and quality of species [6]. There are numerous research projects indicating how complex the functioning of such ecosystems is and that restraining their transformation or restoring the already transformed ones is a truly daunting task [7,8]. Wetlands have proved to be particularly sensitive ecosystems which can be easily altered or even obliterated by the smallest of changes, especially that of a hydrological character. Land improvement activities combined with a shift in land use in Europe have caused about 60% of the continent’s wetlands to disappear in recent decades [9,10], thus, posing a remarkable threat to biodiversity, or more specifically, to species diversity. As reported by Ma, et al. [11] the loss and degradation of wetlands worldwide has adversely affected water birds, which heavily depend on wetland habitats.
An example of a valuable, European-scale, wetland area is the ecosystem of Rakutowskie Lake located in central Poland in the Vistula River valley. The lake is included in the Special Protection Area for Birds of Błota Rakutowskie (PLB40001) within Natura 2000 network. As such, it is among Poland’s most valuable migration hubs and habitats for birds, especially those of water and wetland species. The ecosystem of Rakutowskie Lake is not only an important stopover place on the bird migration route but more importantly, it is their breeding place. The information contained in “Monitoring populacji ptaków Polski w latach 2012–2013” [12] shows that in the 2007–2013 period, birds of open wetlands in Poland demonstrated a downward trend—the abundance of the average species from this group is decreasing at an average rate of 1.5% per year. Based on the aggregate indicator of wetland birds in Poland, it is known that within the space of seven years the abundance of the average species in this group decreased by a total of about 10%. At the same time, conservationists have been concerned about a significant decrease in the surface area of Rakutowskie Lake in recent years, which greatly limits the reproduction possibilities of birds.
Changes in the number of bird species and bird population are often used as signals of general changes in the condition of and pressures on ecosystems [13].
The causes of changes in lake ecosystems in young glacial areas can be divided into natural ones, resulting from their evolution and those of an anthropogenic character. The pace of changes for shallow lakes, as is the case with Rakutowskie, is much faster than it is for deep ones [14]. At the same time, it becomes crucial to determine whether the changing state of the ecosystem is a short-term disturbance or it is a constant trend that will permanently and negatively affect such an important place on the migratory and reproductive path of birds. This is a significant problem as in the vicinity of Rakutowskie Lake there is no site that could naturally assume its ecological functions.
The authors found the problem inspirational enough to embark on a multi-directional and comprehensive research project concerning the lake and its vicinity. It included the analysis of geological conditions as well as the assessment of hydroclimatic conditions and land cover changes. With the help of the above, we attempted to determine the geological spatial relations between the lake and the surrounding wetlands. At the heart of the research lay the central idea to recreate the original lake basin. Subsequently, the available cartographic and photogrammetric materials were thoroughly analysed to determine the changes in land cover or possible alterations in the drainage systems. Bearing in mind the ongoing climate change [15,16] and the fact that the studied ecosystem lies in an area of water deficit [17], we have assessed the hydroclimatic conditions in this area for the last 50 years. On completing multidirectional and comprehensive analyses and research we expect to be able to determine the genesis of the ecosystem, its changes and their reasons, the way in which it functions today, and eventually, suggest predictions for its possible future.

2. Materials and Methods
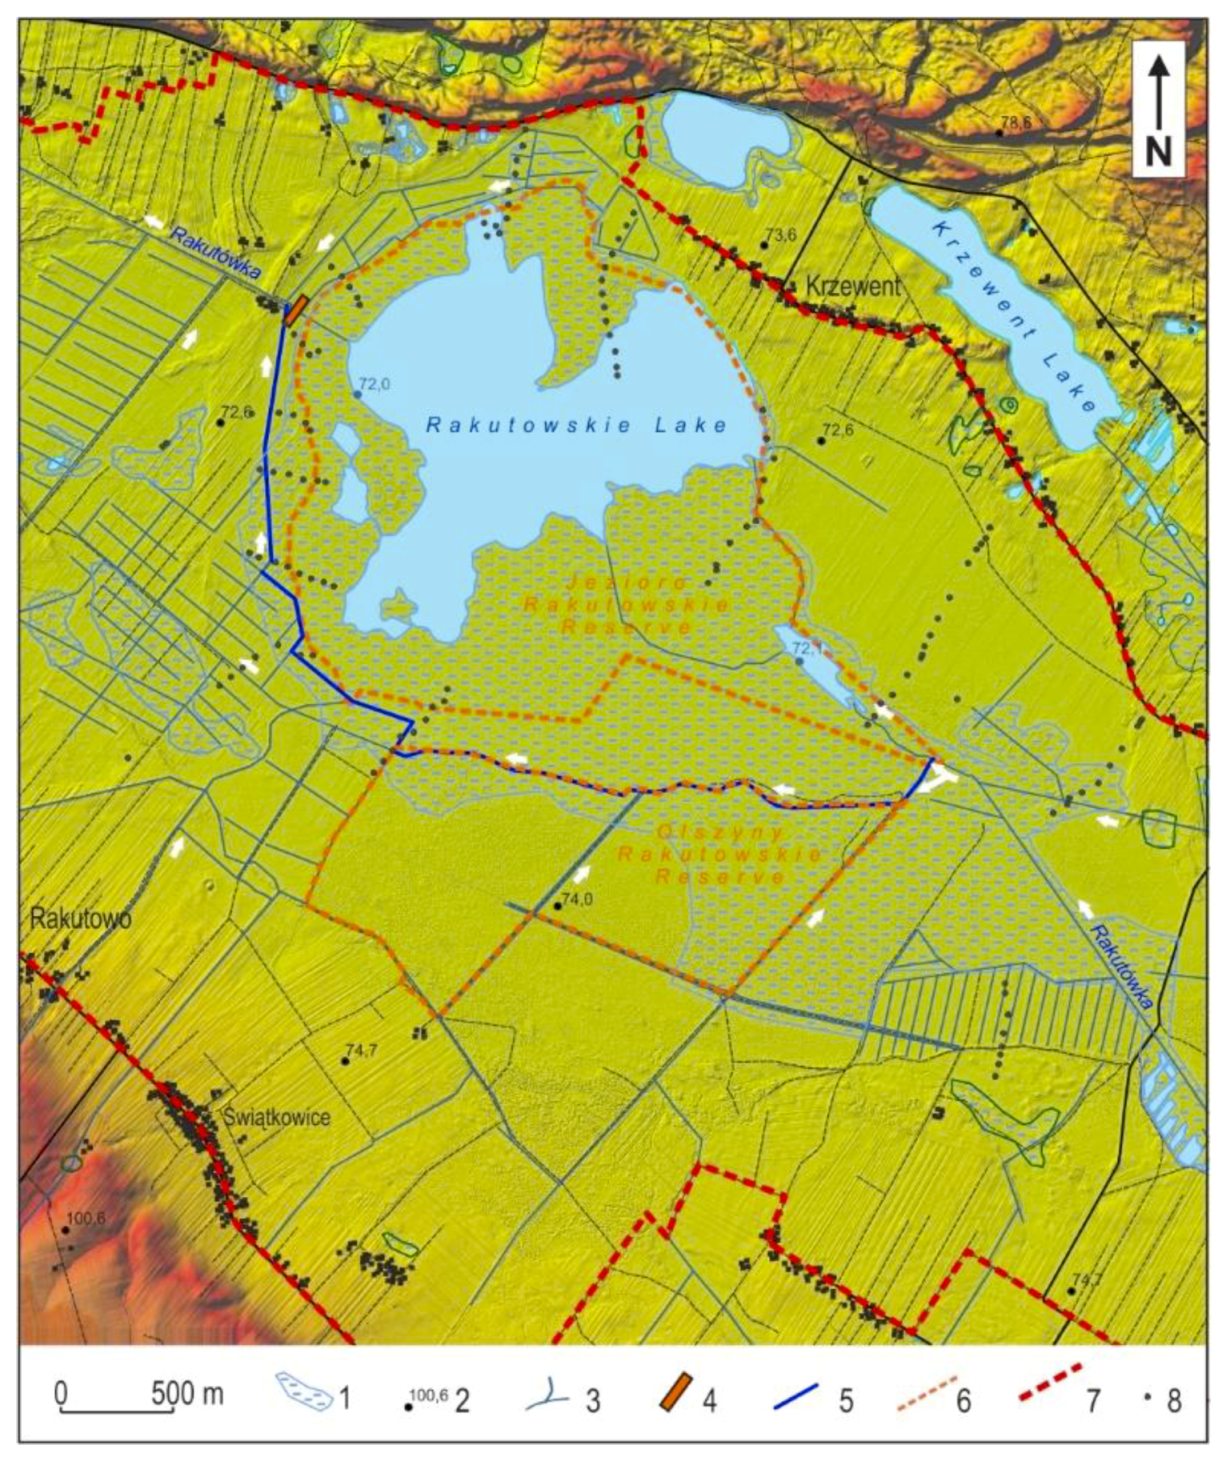
2.1. Study Area

Rakutowskie Lake is located in central Poland near the city of Włocławek within the complex of Gostynin-Włocławek Landscape Parks (Figure 1). The Rakutówka river is 37.8 km long [18], and its total catchment area calculated on the outflow from the lake is 180.9 km2. The Rakutówka is part of the Zgłowiączka river system which is included in the area with one of the largest water deficits in Poland. The research area lies in the temperate intermediate climate zone which is influenced by both humid air masses from the Atlantic Ocean and dry inland ones.
The average annual precipitation in the commune of Baruchowo in the period 1967–2015 amounted to 533 mm and ranged from about 340 mm (2015) to about 780 mm (2001). The mean yearly air temperature for this same period was 8.2 °C and the mean specific discharge from the Zgłowiączka drainage basin equalled 2.61 dm3 s−1 km−2 (the general figure for Poland in 1901–2000 was 5.56 dm3 s−1 km−2 [19]). In dry years the mean specific discharge falls below 1 dm3 s−1 km−2 (0.54 dm3 s−1 km−2 in 1990 and 0.56 dm3 s−1 km−2 in 2015). As for the type of their supply regime, the rivers present within the territory covered by the study are groundwater, snow, and rain-fed types [20]. The most effective feeding of rivers occurs in the spring when the snow cover thaws. Spring snowmelt and late-spring snowmelt combined with spring rainfall cause rivers to swell [17].
The spring period is of decisive importance for bird breeding. The high water level in the lake (the lake surface area) at this particular time is a guarantee of safety for birds—especially those nesting in the shore rushes as water is a natural barrier protecting the nest from land predators. Up until the 1990s, the outflow from the lake was regulated by a penstock which would temporarily retain the spring excess water in the lake (currently, this process is no longer controlled). In summer and autumn months, the lowest discharges occur in watercourses, and in extremely dry years the surface water feeding of Rakutowskie Lake is lost leading to a remarkable decrease in its surface area.
The Rakutówka river has a typical polygenetic valley characteristic of young glacial areas [21]. Following Rosgen [22] classification of river valleys, the valley is of a lacustrine type. Rakutowskie Lake has a melt genesis which is typical of young glacial areas [21,23,24,25]. The Płock Basin area is composed of quaternary sediments whose thickness reaches 35–40 m, represented primarily by rather lithologically homogenous sand–gravelly fluvioglacial series, locally separated by a series of silt–clay sediments [26,27]. The bottom of the Płock Basin is morphologically dominated by extensive levels of fluvial terraces varied by numerous dune forms. Rakutowskie Lake lies within the VI valley level in the direct vicinity of Kuyavian Plateau [28]. It occupies the central part of a large, slightly elongated basin with a morphological axis parallel to the edge of the adjacent moraine plateau. The Rakutowskie Lake basin is a large shallow (2.5 m deep) depression with long, gentle slopes surrounded by extensive biogenic plains with a limited thickness of the peat cover (max 2 m) with a denivelation not exceeding 2.4 m (71.5–73.9 m above sea level).

Habitat of Rakutowskie Lake and Rakutówka River

The natural values of this ecosystem have been confirmed by the creation of two nature reserves: Olszyny Rakutowskie forest reserve (1978) with an area of 174.62 ha and Rakutowskie Lake fauna reserve (1982) with an area of 414.07 ha (Figure 2).
In 2004, a protected area named Błota Rakutowskie (PLB040001) as Special Protection Areas (SPAs) of 4437.9 ha was created as part of the Natura 2000 network. Moreover, in 1981 the area of Błota Rakutowskie (EIBAE 028) was registered by the International Council for Bird Preservation (ICBP) and by the International Waterfowl and Wetlands Research Bureau (IWRB) as a refuge for birds in Europe. What is more, the Polish Society for the Protection of Birds (PSPB) has classified the area as a refuge for birds in Poland. In 2009, an area called Błota Kłócieńskie (PLH040031) was separated under the Habitats Directive. There are stages of Special Areas of Conservation (SACs) with a total area of 3899.3 ha.
Among vertebrates, birds are the most numerous and the most valuable group in the Rakutowskie Lake ecosystem. For the most part, they are species which are extremely adapted to living in a wetland environment. Out of 234 species of birds identified here, 130 are breeding ones. [29].
The most important species protected in Poland or Europe include: Botaurus stellaris, Ixobrychus minutus, Ciconia nigra, Ciconia ciconia, Cygnus cygnus, Haliaeetus albicilla, Circus aeruginosus, Circus cyaneus, Circus pygargus, Pandion haliaetus, Porzana porzana, Porzana parva, Crex crex, Grus grus, Philomachus pugnax, Tringla glareola, Chlidonias niger, Alcedo atthis, Dendrocopos medius, Luscinia svecica, Lanius colluro and Emberioza hortulana.
The most important migrating birds are: Ardea cinerea, Anser fabalis, Anser anser, Anas penelope, Anas strepera, Anas querguedula, Bucephala clangula, Charadrius dubius, Charadrius hiaticula, Vanellus vanellus, Gallinago gallinago, Limosa limosa and Tringa totanus, Larus ridibundus.
In terms of the vegetation of the shore line of Rakutowskie Lake, there is a wide strip of rushes with a dominance of Phragmites australis and Typha latifolia oraz Schoenoplectus lacustris.
Growing at the bottom of the lake and surfacing in the summer Cladium Mariscus deserves special attention. The bays of the lake are occupied by Nymphaea Alba and Nuphar Lutea, while almost the entire bottom of the lake is covered with a meadow of charales (Characeae sp.). The lake is surrounded by extensively used meadows and pastures, including significant areas of molinia meadows with many characteristic species Dianthus superbus, Gentiana pneumonanthe, Kadenia dubia, Lathyrus palustris, Orchis militaris, and Viola persicifolia.
From the south, it is surrounded by a complex of wet alder forests and ash and alder riparian forests, as well as elm and ash forests whereas to the north there is a pine forest.

2.2. Methods

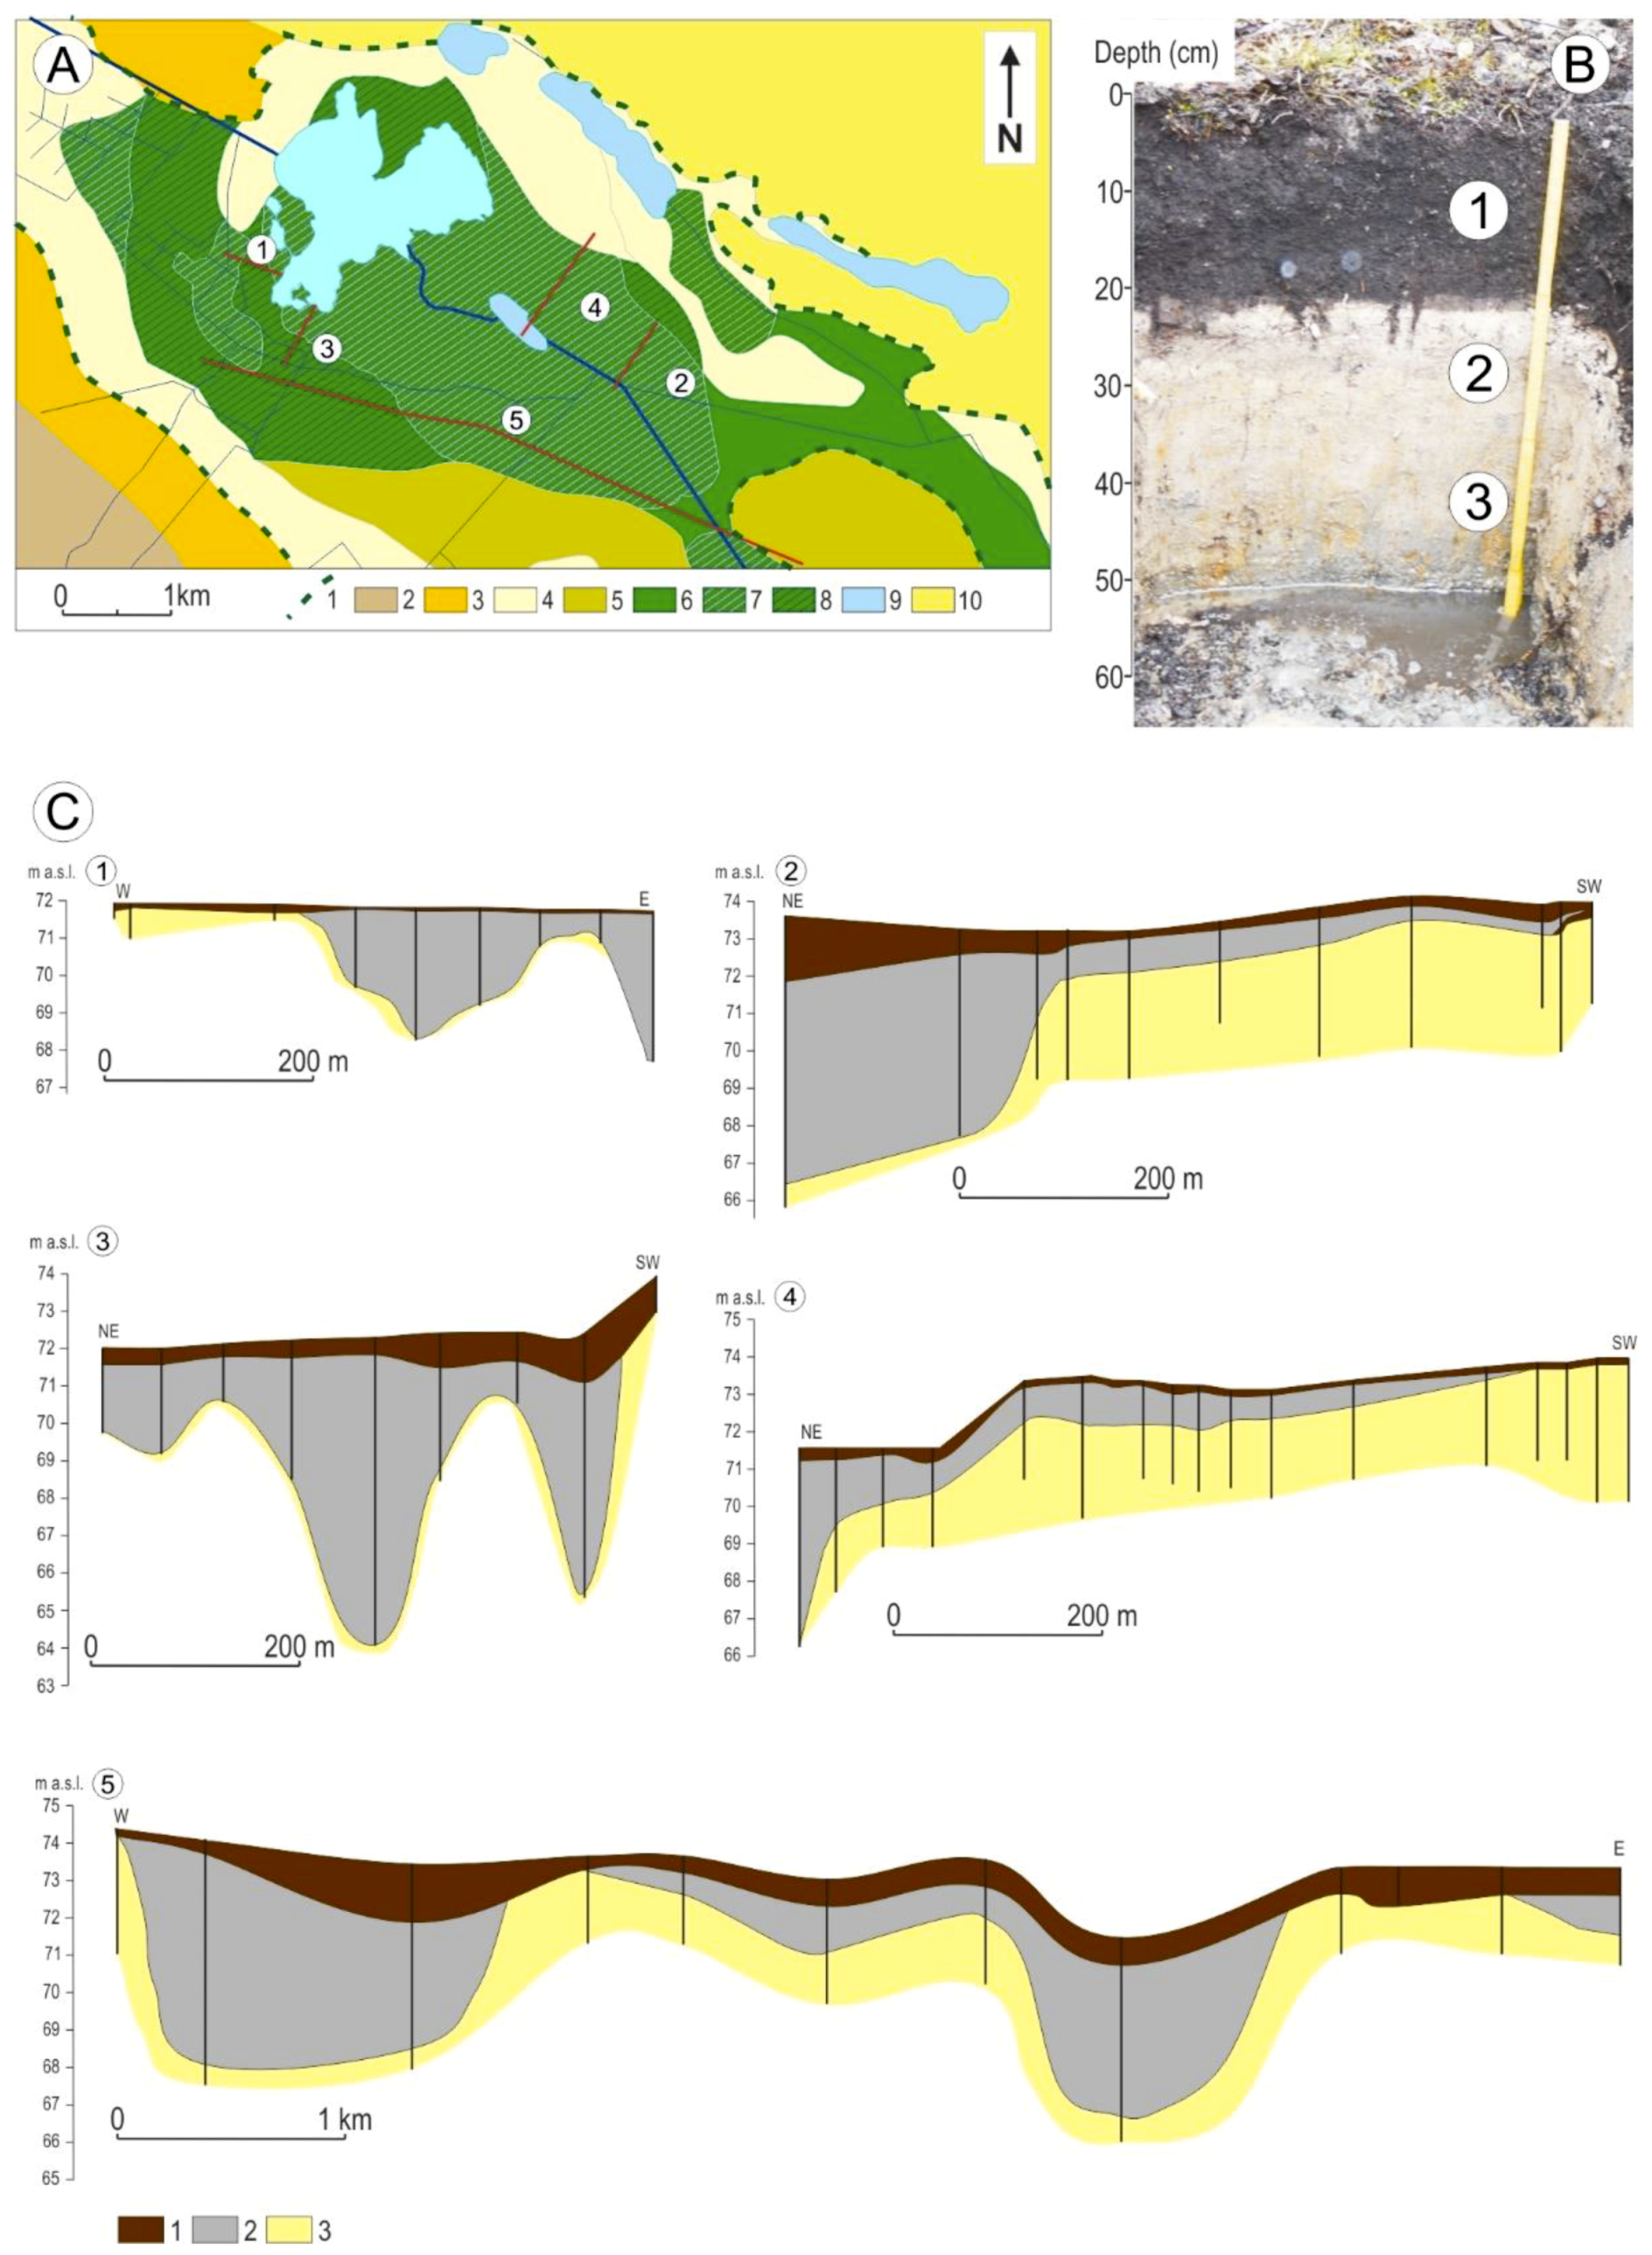
2.2.1. Geology, Morphology of the Area

The detailed recognition of the surface geological structure within a radius of approximately 2–5 km from the lake, and especially the determination of the extent and type of biogenic sediments, also those present in the till, was deemed crucial for understanding the evolution of Rakutowskie Lake and its surroundings. The geological structure was identified using manual and mechanical drilling to a depth of 15 m. With biogenic sediments, drilling and sludge collection was performed with the use of an Instorf-type light probe, enabling the intake of intact fragments of sediments. Then, a Livingstone piston probe was utilised. Each time, the obtained sediment samples were investigated macroscopically in terms of their genesis (lacustrine, peat) and the degree of their degradation. The study also made use of general information obtained from geological maps 1: 50,000 [26,27].
As part of geological work, 184 drillings were made with a total length of over 1200 m. Most of them were more than 5 m deep. However, those made in places with deep occurrence of biogenic sediments exceeded several meters, with the maximum depth of 17 m. Drilling was performed in cross-sections with respect to the lake’s denivelation axis, and in concentric sections relative to the lake. The area of nearly 30 km2 has been examined.
To analyse the relief, a digital elevation model (DEM) with a resolution of 0.5 m was performed on the basis on authors’ own Global Navigation Satellite System Real Time Kinematic (GNSS RTK) survey and Light Detection and Ranging (LiDAR) data from aerial laser scanning (ALS). ALS point clouds were also used to assess land cover. All data has been integrated and processed in the ARC GIS (Version: 10.2.2. ESRI 2014, ArcGIS Desktop: Release 10, Environmental Systems Research Institute, Redlands, CA, USA), SAGA GIS (System for Automated Geoscientific Analyses, Version: 2.3.1, http://www.saga-gis.org) software.

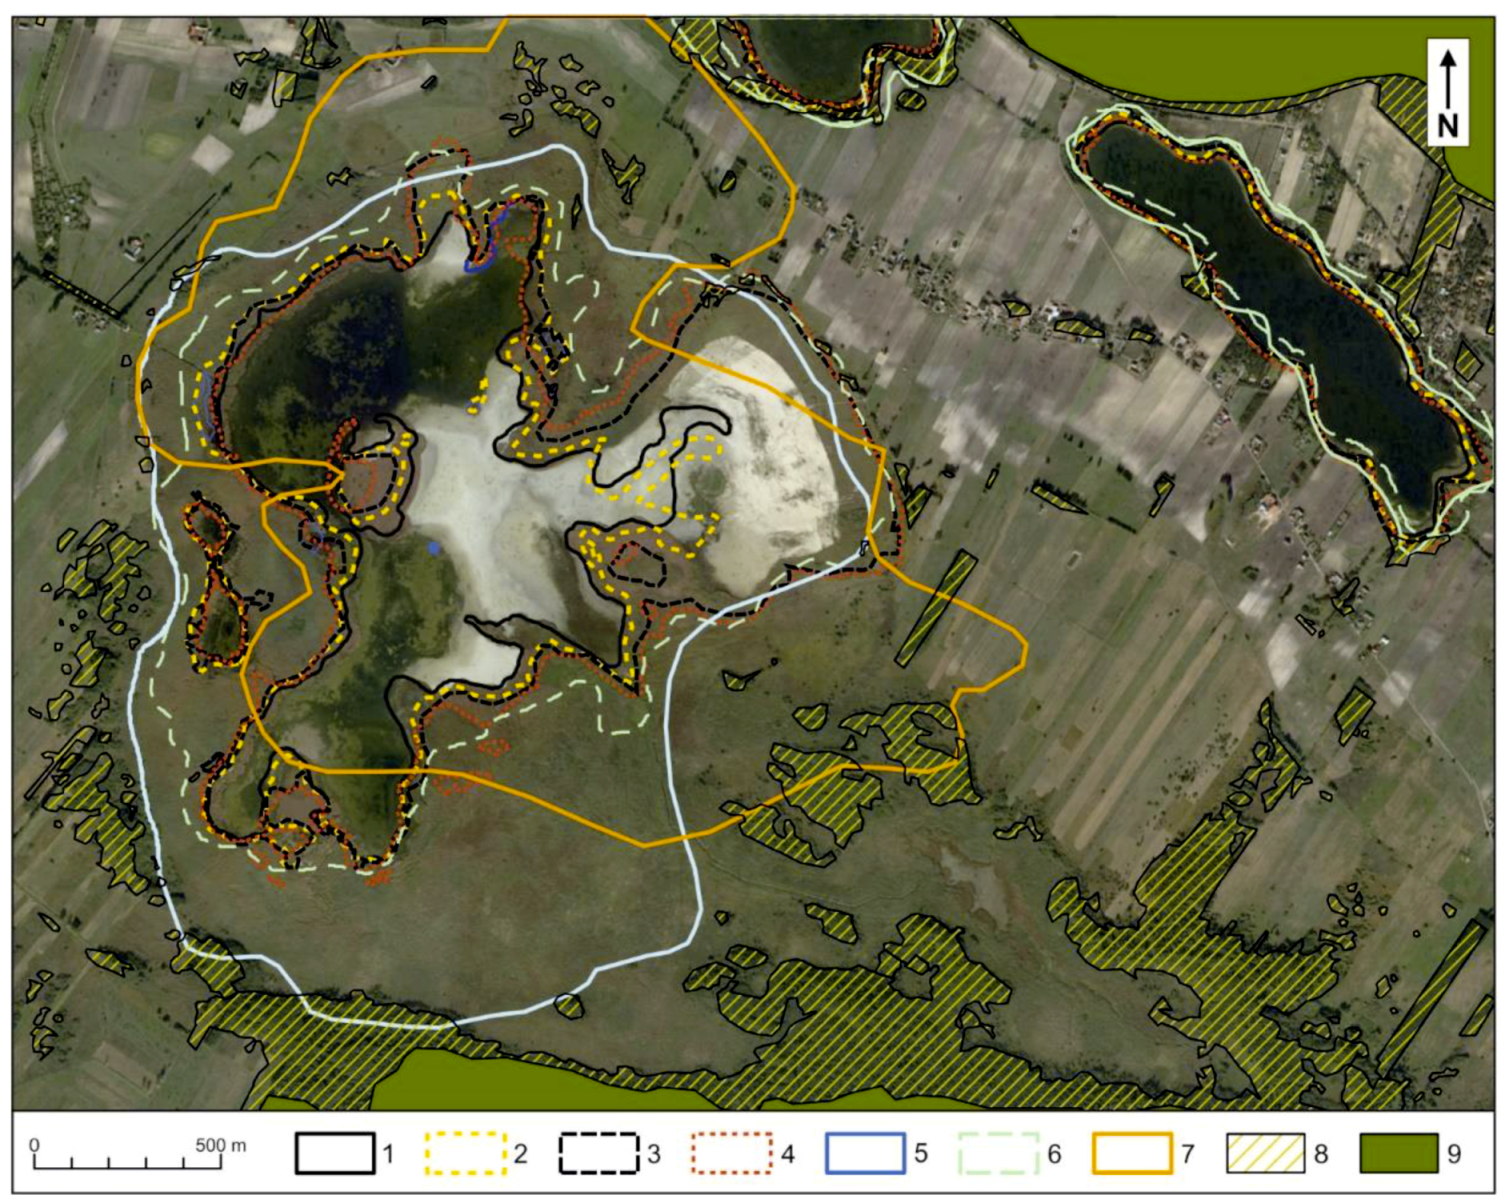
2.2.2. Cartographic and Photogrammetric Materials, Satellite Images
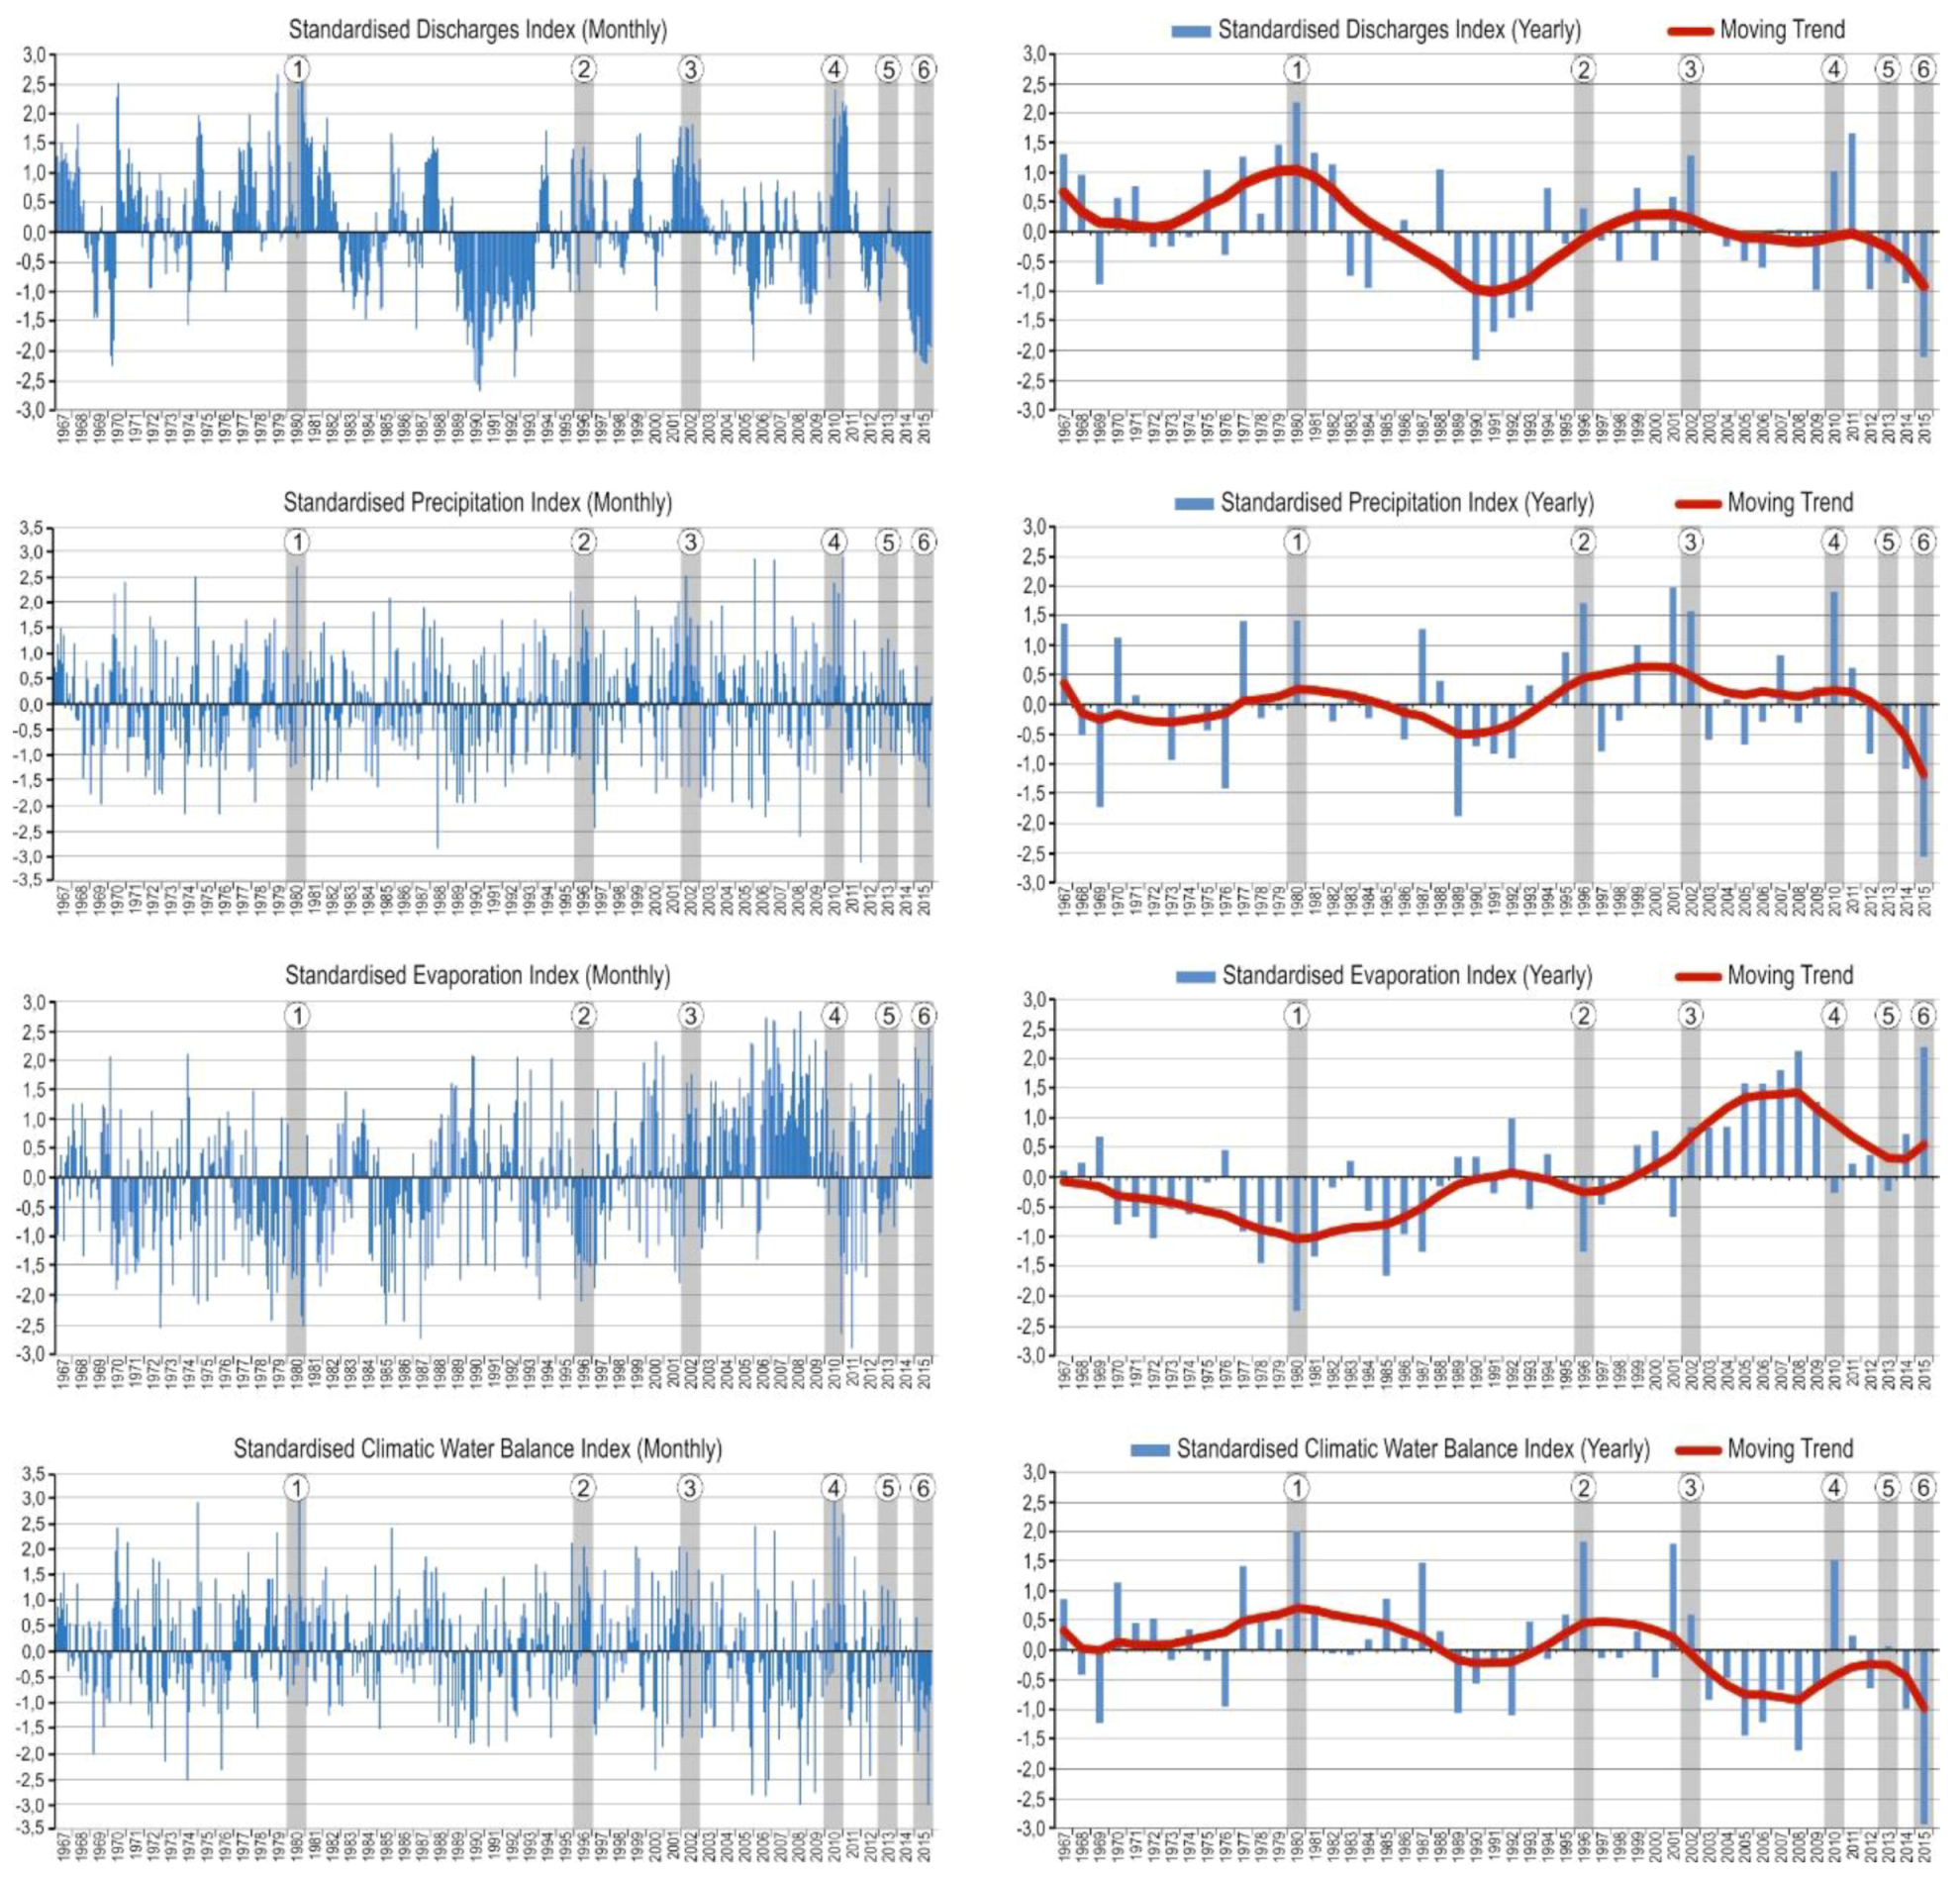
To assess land cover and hydrographical changes in the vicinity of Rakutowskie Lake, both past and modern cartographic materials were used (Table 1).
Although the oldest materials (A, B) were created on the basis of triangulation series, the geometry of field features is imperfect. Nevertheless, on their basis, it is possible to determine the nature of land cover and mutual spatial relations between selected elements of the geographical environment. The other maps (C–I) are cartometric elaborations enabling detailed quantitative and qualitative analyses.
Photogrammetric materials (Table 2) and satellite images were used to assess transformations after 1961, treating the orthophotomap as the basis for the georectification of aerial photographs. Maps (A–H) have been adjusted and georectified in the ArcGIS program.

2.2.3. Hydroclimate

Hydrological and meteorological data covering the period 1967–2015 provided by the Institute of Meteorology and Water Management constituted the input material for the analyses which were carried out for the hydrological year, i.e., from 31 October to 1 November.
The Ivanov formula [30,31] was used to calculate the monthly mean values of evaporation, which is E = 0.0018 × ( 25 + t ) 2 × ( 100 f ) (mm/month), where: t —mean monthly air temperature (°C), f —mean monthly relative air humidity (%). Moreover, the Climatic Water Balance (CWB) was treated as the difference between the total precipitation in a given period and evaporation in the same period.
Hydrological data obtained from the authors’ own measurement network (project implemented in 2010–2013) were used to conduct a detailed hydroclimatic analysis for 2011 and 2012.
To homogenise and compare the examined series, a statistical verification of the assumption about the normality of the analysed series of monthly values (in a set of homologous values) was made. For this purpose, the Shapiro–Wilk test [32] was used, thus, verifying the hypothesis (α = 0.05) that the examined series are convergent with the normal distribution. The normalisation procedure was then carried out using the Box-Cox method [33,34]. The effectiveness of the transformation was re-tested with the Shapiro–Wilk test, and then the transformed series were standardised. The performed normalisation and standardisation processes made it possible to compare multiple series with input data differing both in terms of the scale of data as well as their unit of measurement. These indicators inform about the multiplicity of the standard deviation of the studied characteristics from their multi-annual mean values (for homologous series in monthly periods).
Finally, the normalised and standardised monthly and annual values were classified. In the original classification presented by Mckee, et al. [35], and later by Guttman [36], the limit value of the index indicating a shortage was the standard deviation of –1.0, while 1.0 meant excess. Based on the results of research on drought in the central part of Poland (Wielkopolska and Kujawy), [37,38,39,40] proposed a modification of the original classification, lowering the index threshold to –0.5 (shortage) and 0.5 (excess). The analysis was based on the modified classification in accordance with Table 3 and Table 4. The figures in the first column in Table 3 are relevant to all the variables, i.e., Standardised Discharge Index (SDI), Standardised Precipitation Index (SPI), Standardised Climatic Water Balance Index (SCWBI).

3. Results

3.1. Geology, Morphology of the Area

The digital elevation model (DEM) clearly indicates that the surroundings within the radius of 1.0–2.0 km from Rakutowskie Lake are not particularly varied hypsometrically as the denivelations in this area do not exceed 1.0 m. The lake does not have a shoreline which would clearly stand out in the general morphology of the area. Its basin is almost flat with the maximum depth recorded during the bathymetric works reaching 2.0 m and with medium depths ranging between 0.5 and 1.0 m.
Based on the terrain model, the lake surface area was calculated at different water levels, taking the maximum possible variants. At the ordinate of the water surface at 71.7 m a.s.l. (above sea level) the area is 270 ha, at 71.8 m a.s.l. is 310 ha, at 71.9 m a.s.l. it is 400 ha, at 72.0 m a.s.l. it is as much as 470 ha.
The range of biogenic sediments reaches far beyond the current range of the lake (Figure 3), especially towards the south-east along the axis of the valley. The surroundings of Rakutowskie Lake take the character of a vast biogenic plain developed in a sandy plain (sandy depression) between a plateau and a dune belt. In most drills, near the surface, the presence of cane peat strata was revealed, the thickness of which increased as it approached the denivelation axis from 0.2 to 0.7 m. The peat was characterised by a varied degree of decomposition and mineralisation, mainly dependent on type of land use. From the south, Rakutowskie Lake is surrounded by gyttjas lying on sands gradually turning into peats on sands. From the north, the lake is surrounded by peats lying on gyttjas that turn into lake sands. On hay meadows going away from the lake, the peat was heavily decomposed, indicating a long period of extensive dryness. Under the peat strata, there were mostly lake deposits in the form of carbonate gyttjas, which were documented to a depth of over 9 m. Their average thickness was 3.0–5.0 m. On the floor of biogenic sediments, there were usually fluvioglacial sands, less often fluvioglacial sands and silt. The morphology of these sediments is varied with recesses to be found especially in the southern part (Figure 3).
There are no impermeable deposits under the biogenic sediments. (Figure 3). To the south-east along the valley of the Rakutówka river, there is a strip of peaty silts on gyttjas which is about 1.5 km wide. During the drilling works and based on readings obtained from several piezometers installed all around the study area it was determined that the groundwater level was stabilised near the surface and was directly related to the current level of water in the lake and the general drainage system.
In the central part of the lake, at a depth of 2.0 m, core drilling was carried out. Although the drilling did not reach the bottom of the biogenic sediments, it documented the presence of carbonate and detritus gyttjas, the thickness of which was 15 m. In the immediate vicinity of the lake edges from the south, there is an oncoming floating mat.

3.2. Cartographic and Photogrammetric Materials, Satellite Images
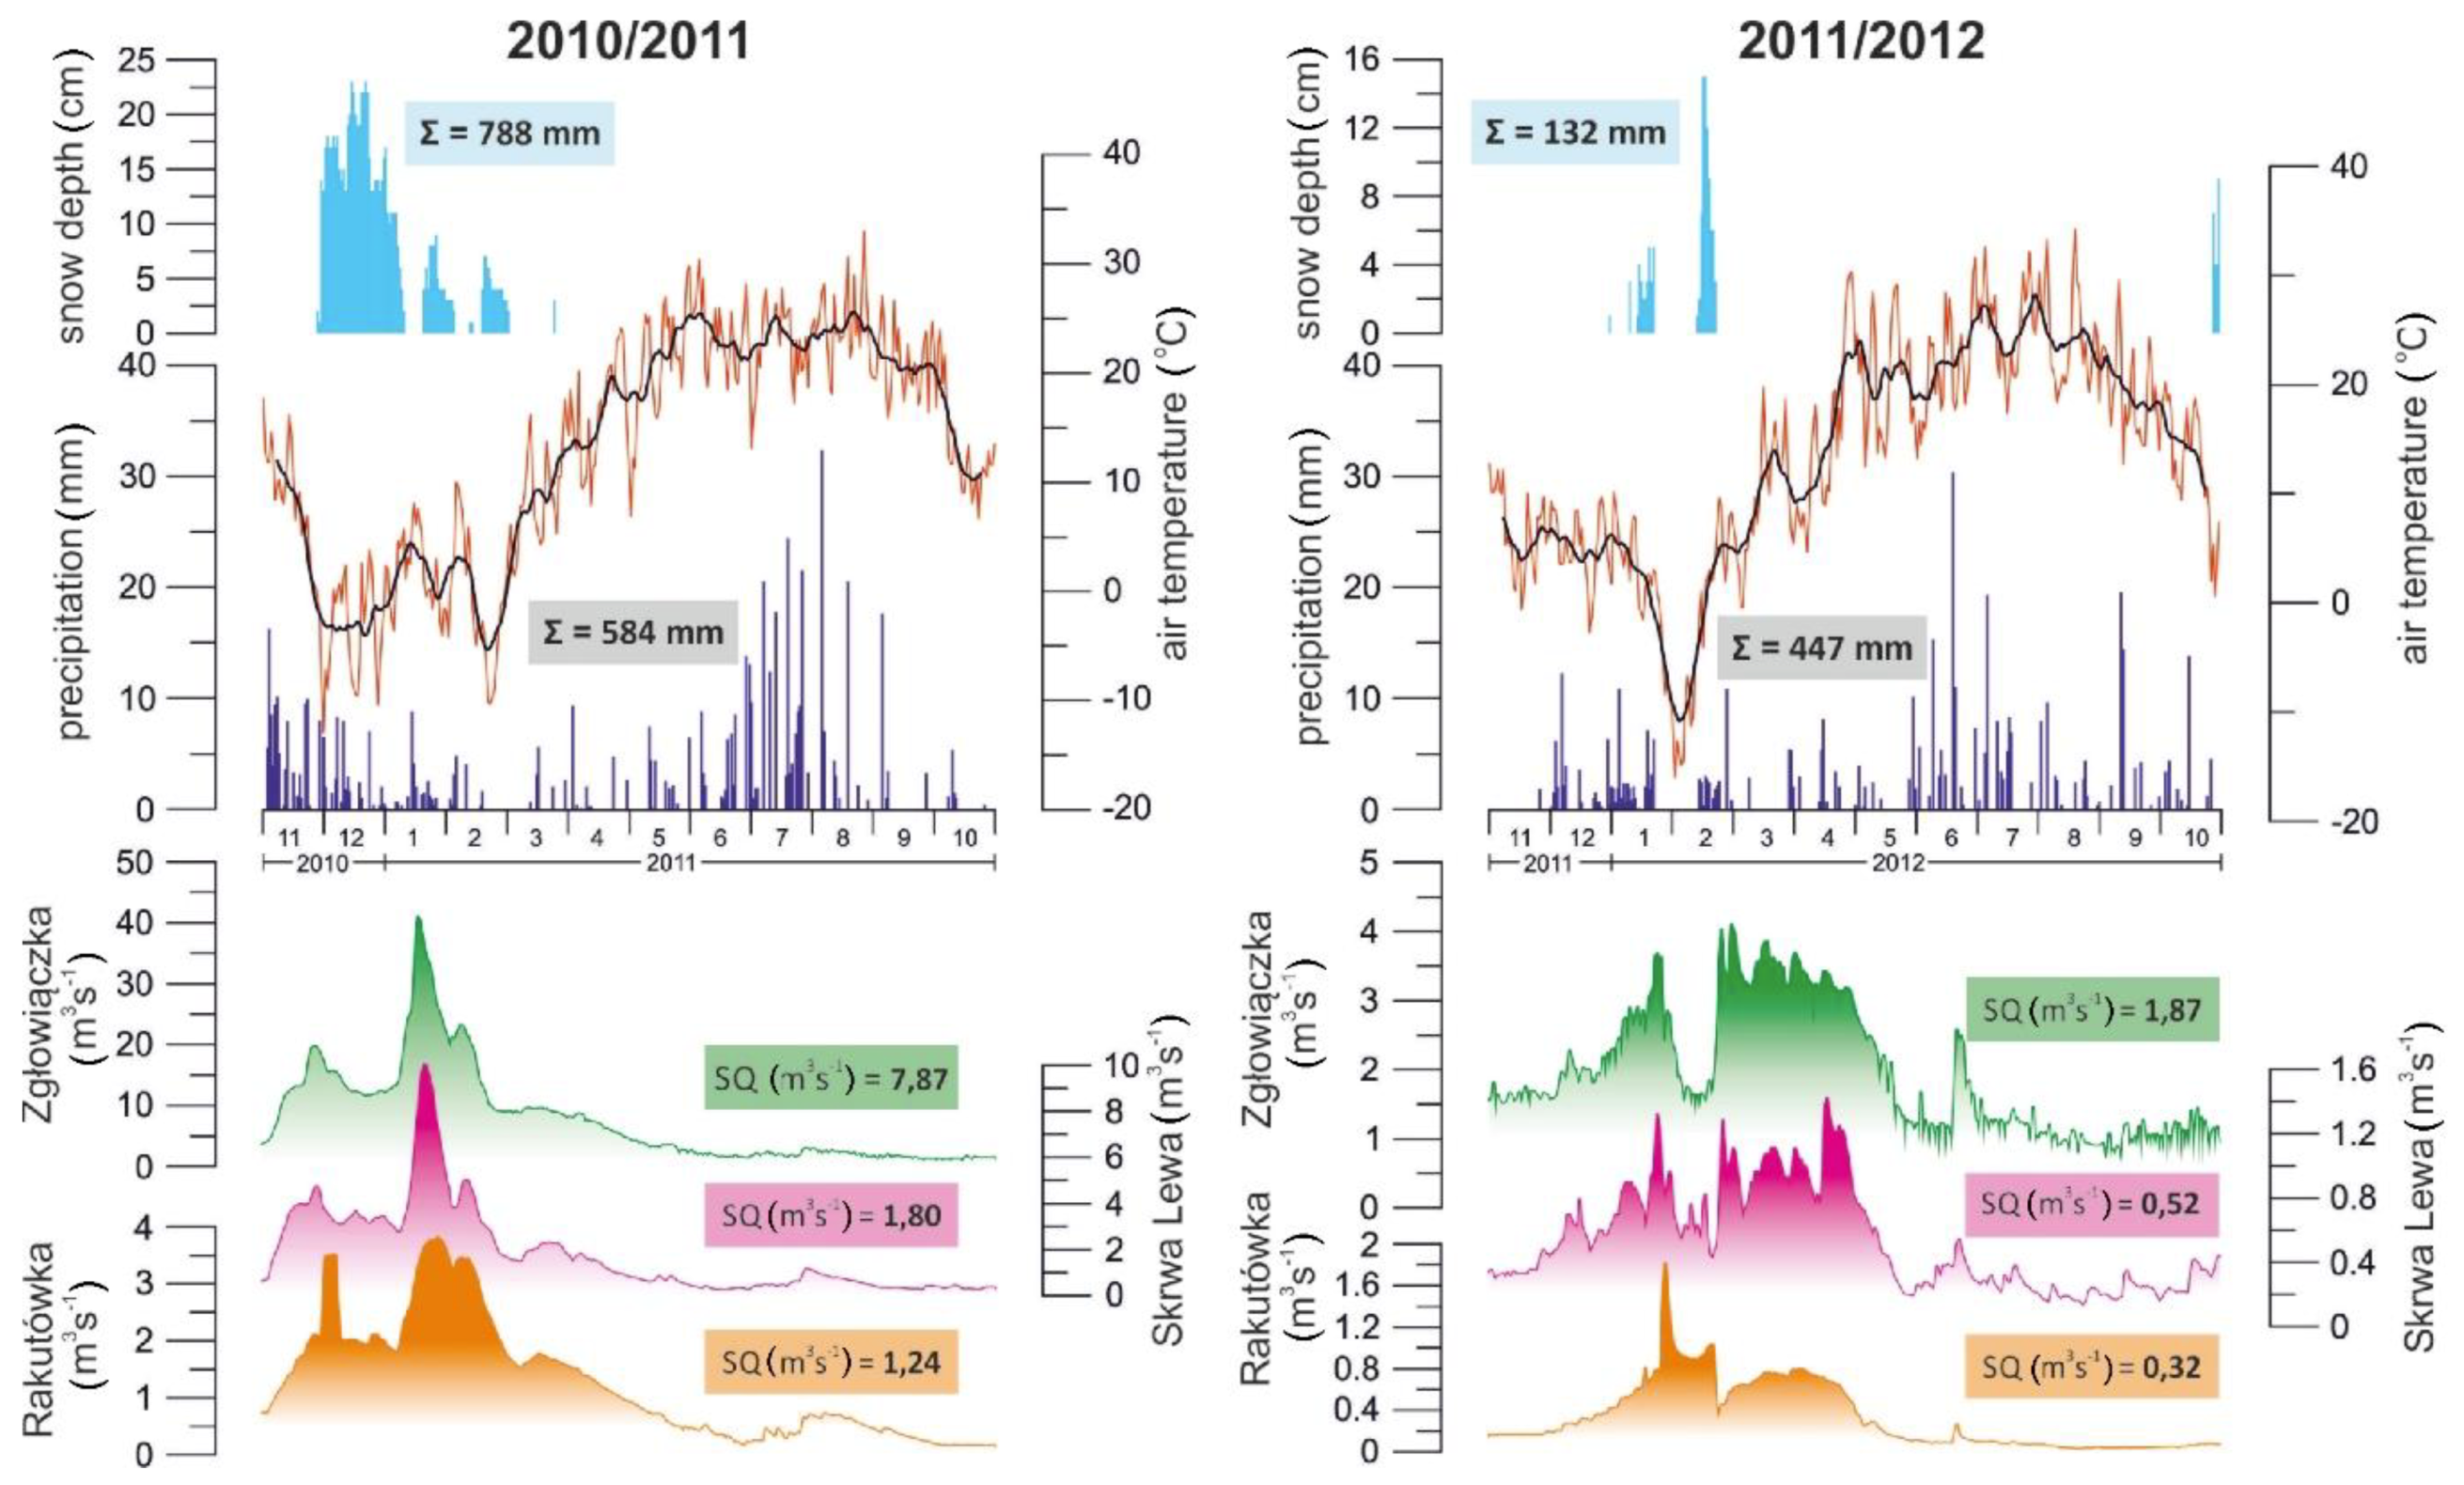
The picture of the surroundings of Rakutowskie Lake and the drainage system depicted on the oldest maps dating back to the mid-19th century differs from the contemporary one (Figure 4). The lake used to be fed directly by four watercourses incoming from the south. Wooded areas stretched in the south and over a duned strip in the north, and to the west of the lake, there was an area of marshy meadows. On the maps created in the years 1902–1911, the lake had a surface area of about 307 ha and was fed by three watercourses from the south and west.
Additionally, the southern tributaries have been regulated—their beds have been straightened. Manifestations of human activity are also visible in the lake’s surroundings—sand dunes in the north of the lake have been deforested. 1911–1930 is the period when the emergence of an amelioration network and peat extraction sites is visible, as well as further deforestation of the area east of the lake. The main feeding watercourse, about 4 km before its mouth, was split and regulated. The same maps show the creation of a water mill on the Rakutówka river, about 5 km downstream the outflow from the lake. A map from 1930 presents the largest documented lake range, amounting to 329.3 ha. At that time, the southernmost edge of Rakutowskie Lake reached the forest line, more than 400 m up on the situation presented on the previous map. On a map from 1945, the area of the lake is smaller by 31% and amounts to 227 ha. The reduction of the lake surface area in that period caused the drainage ditches on the south to be cut off from the lake rendering the Rakutówka its only river tributary. Later on, until 1961, the lake reduces its area by another 50.8 ha. The amelioration network around the lake is also being expanded which results in the water flowing in from the north and south being caught by the surrounding drainage ditches and channelled directly to the Rakutówka river below the lake. In addition, the layout of the main lake feeder gets changed. Approx. 1 km upstream from the lake an artificial river bed is created, thus, directing water to the southern part of the lake. Aerial photographs taken in 1980 show further, yet not so intense, transformations of the lake’s neighbourhood. The old northern bed of the Rakutówka significantly shallows and gets overgrown losing its importance in feeding the lake. At that time, the lake’s surface area amounts to 171.2 ha. Within the northern bay, the shoreline, defined by the boundary of dense vegetation, has receded from 250 to 400 m. Vegetation is entering the exposed drained surface, the terrestrialisation of the lake is progressing. The range of use of meadows and reeds in the surrounding is also increasing with some of them being mowed up to the very edge of the water.
Up until 1996, an intense process of encroaching the lake is visible reducing its area by 31%. Reeds and willow clumps enter the northern bay so much so that in aerial photographs taken in 2009 the bay is already a land area completely covered with dense vegetation. Further growth of reeds and the development of a floating mat about 40 m inwards the lake resulted in further reduction of the lake area from 119.5 ha in 1996 to 101.8 ha in 2009. In addition, there is a significant increase in the number of mainly willow bushes.

3.3. Hydroclimate

The volume of water resources in the studied area varies continuously not only from year to year but also in the annual cycle [17,41]. In the analysed multi-year period, characteristic clusters of months and years classified as wet or dry periods are clearly pronounced (Figure 5). A kind of grouping of signals was observed. Two periods particularly stand out from the point of view of the conducted analysis.
The first one lasted from 1989 to 1993. During that period, 90% of the months were generally classified as dry, of which 10 as slightly dry, 24 as moderately dry, 14 as severely dry and 6 as extremely dry. Water resources in the period were extremely small as evidenced by the mean specific discharge from the entire Zgłowiączka river basin, which in these years, amounted to 0.94 dm3 s−1 km−2 (36% of the mean specific discharge for the period 1967–2015).
The second period lasted from 2005 to 2015, which also marked the end of the research period. The mean specific discharge from the whole Zgłowiączka basin in those years was 2.11 dm3 s−1 km−2 (80.8% of the mean specific discharge for the period 1967–2015). However, the years 2012–2015 belonged to the slightly dry (2012–2014) and extremely dry group (2015). The mean specific discharge in those years was 1.23 dm3 s−1 km−2 (47.1% of the mean specific discharge for the period 1967–2015), and in 2015 only 0.56 dm3 s−1 km−2 (21.5% of the mean specific discharge for the period 1967–2015).
The above-mentioned periods coincide with periods of low precipitation (Figure 5). The value of annual precipitation for each year of the period 1989-1993 fell into the slightly dry (1990–1992) and severely dry category (1989). The average annual air temperature in the period was 8.6 °C, and the average annual evaporation amounted to 570 mm. As a consequence, the climatic water balance was negative and reached an average of −116 mm (in 1989—209 mm and in 1992—215 mm).
It should also be noted that after 1980 a steady increase in evaporation is visible until 2008. Extreme annual evaporation values in that period ranged from 358 mm (1980) to 796 mm (2008) and on average they stood at 564 mm per year. However, from 1999 to 2008 (except for 2001) all the years belonged to the slightly dry (1999–2004), moderately dry (2009), severely dry (2005–2007) and extremely dry category (2008). This steady increase in evaporation from year to year caused, in periods when the annual precipitation did not differ or was lower than normal, the climatic water balance to reach extremely unfavourable values. In the period from 2003 to 2015, nine years were generally classified as dry. The average annual value of the climatic water balance for these years (2003, 2005–2009, 2012, 2014–2015) was −230 mm, and in 2015 it amounted to −465 mm.
The lake surface area is characterised by considerable dynamics of change both interseasonally and interannually (Figure 6). The lake was the largest in 1980 and 2002 when its surface area stood at 171.2 ha and 201.3 ha, respectively. By contrast, 2015 lies at the other extreme with the surface area of merely 70.9 ha.
The variability of water resources in the annual cycle is primarily related to the supply regime. It reflects the amount of energy supplied and the amount, type and annual distribution of precipitation. The most effective supply occurs in the spring period and is the effect of the snow cover thawing. Whereas, the lowest discharges are recorded in the summer months—despite the fact that this is the period of the highest rainfall.
The detailed hydroclimatic situation is presented in Figure 7. The year 2010 was among anomalously humid ones in terms of precipitation. This is especially true for its summer half-year. It was then when a total of 565 mm of rainfall was recorded with the mean precipitation in the summer half-year for the period 1967–2010 of 342 mm. Also, the beginning of 2011 belonged to extremely humid periods—in November 2011 a rainfall total of 107 mm was recorded (the average rainfall in November 1951–2010 was 38 mm).
High autumn precipitation greatly improved water supply in the studied catchments. At the end of November, the average daily air temperature dropped below zero, and there was heavy snowfall (Figure 7). The thickness of the snow cover reached 23 cm (22.XII.), while its average and total thickness in the period from November 28 to January 10 was 14.6 cm and 644 cm, respectively (in 2011 as a whole, 10.2 cm and 785 cm, respectively).
The mid-winter warming that occurred in the first half of January caused the snow cover to melt completely. During this warming, the average daily air temperature climbed to 5.9 °C, which caused a rapid increase in the river discharge reaching about 41 m3 s–1 (Zgłowiączka), 10 m3 s–1 (Lewa Skrwa) and 4 m3 s–1 (Rakutówka).
In spring 2012, an increased discharge is visible although it is not as intense as in the previous year (Figure 7). Also, the annual precipitation in 2012 was 23% lower than that in 2011. In the summer (July and August) of 2012, the water level in Rakutowskie Lake dropped below the level of the bottom of the Rakutówka bed on the outflow from the lake. A period of only a year sufficed to change the size of water resources in the study area radically.

4. Discussion

The Płock basin, where Rakutowskie Lake is located, is a polygenetic form, resulting from consecutive erosion and glacial, fluvioglacial and fluvial accumulation processes. Research indicates that the lake’s basin, as was the case with the neighbouring ones, probably arose as a result of the melting of buried lumps of dead-ice. The assessment of the age of the adjacent Żłoby Lake, which is a part of the original Rakutowskie basin, indicates that the accumulation there has been taking place for at least 14,530 +/– 150 years Before Present (BP) [42].
The object under study is a vast biogenic plain which is the filling of a (former) paleolake, the area of which was nearly 9 km2 (900 ha), which is over eight times as much as the modern Rakutowskie Lake. At least 18 m deep, the paleolake had gentle slopes and was characterised by a vast littoral zone (Figure 3).
The sequence of the geological structure of the neighbourhood of Rakutowskie Lake indicates that the basin has been gradually filled both by bottom sediments and by a fen. The shape of the basin, from the very beginning of its existence to the present day, has clearly favoured overgrowing processes. Small average depth, extensive, shallow and quickly heating littoral has precipitated the processes of biogenic production and the expansion of vegetation (Figure 3).
The disappearance of lakes in the zone of young glacial Europe is a natural process. Currently, a large proportion of former lake basins have already been completely filled with sediments and function as peatlands or wetlands, which in turn, as a result of hydrotechnical works, have often been transformed into agricultural land. In the 20th-century Poland alone, the total area of lakes decreased by 44% [43,44].
The process of overgrowing observed in the case of Rakutowskie Lake is rather spectacular due to the sheer size of the lake and its morphology. Sandy formations occurring in the paleobasin substrate also affect the modern (seasonal) functioning of this lake. Direct contact of biogenic sediments, especially peats, with sands makes the water escape route from the lake open, and its level remains strongly dependent on the level of groundwater (Figure 3).
The analysis of the geological structure and the morphology of the area suggests that, in terms of geomorphology, we are dealing with the last phase of the lake’s existence aiming at a complete filling of the basin and turning it into a wetland area.
The investigation of cartographic materials indicates a clear change in the use of the area surrounding Rakutowskie Lake in the period following 1945 (Figure 4). The burning needed to rebuild the country’s economy after the war resulted in the strong development of agriculture. To increase the area of meadows, intensive, large-scale draining of wetlands began, and so it happened with Rakutowskie Lake [17,18,45,46,47].
The introduction of penstocks and ditches, as well as the regulation of the river bed on the tributaries, were aimed at faster drainage of spring waters to facilitate agricultural activity. Rapid drainage of water resulted in the need to reduce the water level in the area to such an extent that in 1955 the zero point on the water gauge on the Rakutówka river downstream of the lake was lowered by 1 m [46]. In addition, the rapid development of vegetation in the partially drained lake bed observed in that period was further promoted by an increase in the number of artificial fertilisers used in Poland [48,49].
It should also be remembered that land development works at that time were carried out on the basis of economic and technical factors, neglecting the issues of nature conservation [50]. As a consequence, such a strong interference in the hydrological system became a threat to the functioning of the lake’s ecosystem. Charman [51] and Rydin and Jeglum [2] showed that hydrological transformations, such as land development, affect the vegetation structure, increase humification of biogenic sediments consequently leading to a reduced possibility of water retention in such ecosystems.
It was not until the 1970s and 1980s when actions contrary to those conducted so far were promoted after a natural reserve had been created. A penstock was built at the outflow from the lake, so that after draining the excess water after spring thaws the remaining part of it should be stored as long as possible for the summer-autumn period, i.e., during the periods of water shortage in this area. However, the original course of the river network feeding water directly to the lake has never been restored.
Within the boundaries of the reserve, mowing of grass and reeds was stopped, and unlimited development of vegetation was allowed. However, the water level in the lake continued to be adapted to economic needs, contributing to reducing the area available to bird habitats. The creation of reserves resulted in the cessation of human interference in the direct lake catchment leading to unlimited development of vegetation. This results in a twofold effect—on one hand, vegetation maintains water in the catchment [52], on the other hand, the spontaneously developing reed belt in the lake causes high transpiration [53]. The degradation of this ecosystem is related to the overlap, in the longer history, of land development works and accelerated climate changes observed in recent decades. On the one hand, the studied ecosystem highlights problems and challenges in managing wetlands in the era of rapidly occurring climate changes. On the other hand, it shows how dynamic, and how sensitive to yearly hydro-climatic changes ecosystems are.
Our thinking and work related to the protection of such ecosystems as the Rakutowskie Wetlands should not be limited to mere stopping the progressive change of the lake surface, but also, and perhaps first and foremost, it should promote the adaptation and functioning of the ecosystem in changing climatic conditions. Global and regional predictions and projections of climate change indicate a further increase in air temperature, which will result in increased evapotranspiration.
In the studied area, it will contribute to the reduction of water resources as precipitation will largely remain unchanged. Milly et al. [54] hypothesised that stationarity of hydroclimatic processes understood as the state according to which natural systems fluctuate within unchanged brackets of a certain variability, is already out of date. In their opinion, hydroclimatic changes go beyond the framework of historical behaviour. Therefore, stationarity should no longer serve as the most important assumption in the assessment and planning of solutions related to water resources.
Changes in climate elements, including an increase in air temperature, transform and accelerate both the water cycle and changes in the structure of water balance in river or lake catchments [30,55,56,57]. The rapid decrease in the surface area of Rakutowskie Lake is probably a result of the observed increase in evaporation and periodically smaller precipitation (Figure 5).
Overlapping of these elements causes a large growth in water deficiencies manifested in a negative Climatic Water Balance. Since 1981, there has been a steady year-to-year increase in this climate element, which is a consequence of the rising air temperature (Figure 5).
In the examined period 1967–2015, driven by climatic conditions (Figure 5), considerable dynamics of the surface area of Rakutowskie Lake were observed (Figure 6). The surface area was the largest in the years 1980 and 2002 which, in terms of discharge volume, are respectively classified as extremely wet (lake surface area of 171.2 ha) and moderately wet (lake surface area of 201.3 ha). 2015, in turn, proved to be an exceptionally disastrous year for the lake’s ecosystem. It was when extremely unfavourable meteorological conditions in the form of low precipitation and high evaporation overlapped. Consequently, the year was classified as extremely dry (Figure 5) and the lake surface area decreased to 70.9 ha (Figure 6). Hence, it was merely 35% of the area observed in 2012. Despite interannual fluctuations of the surface area of the lake, the downward trend is clearly marked over the examined period. Climate warming resulting in increased local evaporation is generally believed to be the major reason of the decreased amount of water in lakes.
This is confirmed by the works of, among others [58], who calculated for the Greater Poland region (adjacent to the research area from the West) that in each year from 1996 to 2006 evaporation from the free surface of water exceeded the rainfall.
The annual evaporation rates increased from 600 mm in 1996 (mean annual air temperature 8 °C) to 1000 mm in 2006 (mean annual air temperature 10 °C). According to Reference [58], it was the increase in evaporation that caused the water level in lakes to drop by about 1 m, and the level of groundwater by about 3–4 m over that period.
Therefore, in the nearest future, one should expect increased frequency, intensity and range of hydrological droughts. This is confirmed by the work of References [41,59], who identified and assessed the intensity of dry periods in the eastern part of Kujawy in the period 1951–2010. Their work shows that after 1980 there were two ”waves” of dry periods which were reflected in the size of the discharge from the analysed area.
The first is the period from 1989 to 1993 (summer low-water period on the Zgłowiączka river lasted from 89 days in 1993 to 168 days in 1990), and the second from 2003 to 2009 (the duration of summer low-water periods ranged from 50 days in 2009 to 225 days in 2008). These results coincide with the results of our analyses. The projections for the future of the ecosystem of Rakutowskie Lake are less than optimistic. Szwed et al. [60] presented their projections of the impact of climate change on Poland’s water resources for 2061–2090 (reference period 1961–1990). They showed that the median of the cumulative probability curve of climatic water balance values (difference between precipitation P and evapotranspiration E) for the summer period in Poland will decrease from −32 mm (1961–1990) to –50 mm (2061–2090), and the probability of occurrence of a negative water balance will increase from 0.84 to 0.96, respectively. In addition, they showed that in the forecasted period of 2061–2090, the likelihood of a state of balance between E and P in Poland would decrease twofold. Thus, the rainfall deficit will increase by 100%. The greatest rainfall shortages will occur in the central part of Poland, i.e., where the studied ecosystem is located.
An analysis of results obtained from a number of research methods shows conjugations and interactions of factors affecting the current ecological system of Rakutowskie Lake and its surroundings (Figure 8). This enabled the determination whether the changes that occur in the ecosystem are a result of short-term disturbances, after the occurrence of which the ecosystem, as far as its resilience allows, is able to recover, or it is the next phase in its evolution.
In geological terms, we are dealing with the last stage of the lake’s functioning. Filling with sediments which has been continuing for the past several thousand years is about to end. This makes the ecosystem increasingly unstable and vulnerable to external factors such as climate fluctuations or human activity. The geological and geomorphological character of Rakutowskie Lake surroundings made it possible for humans to enter and adapt the wetland areas to their needs. Our research also revealed a dissonance between the desire to drain the areas around the lake, especially in spring, and the availability of this area for bird breeding.
It also showed that even small human activities can have huge environmental consequences and can affect vast areas. In the case of such a wobbly and sensitive ecosystem that functions in the area of a negative Climatic Water Balance, a small change in precipitation or air temperature triggers its rapid reaction.
At this point, some questions should be asked—what will be the future of the Rakutowskie Lake ecosystem and what will be its response to the projected acceleration and intensification of the hydrological cycle in Poland? Given the observed tendencies of climate change, will the “lake-marsh” ecosystem change into a “marsh” one? What will be the reaction of the animal world to such a change? At this stage of the research, we leave these questions unanswered.

5. Conclusions

A multidirectional research approach based on geological, geomorphological, geodetic, hydrological and climatological analyses made it possible to indicate at which stage of evolution the ecosystem of Rakutowskie Lake is at the moment. The use of many research methods has shown that this ecosystem is an element of the environment which is very sensitive (hot-spot) to disturbances, and this sensitivity is a result of a number of natural and anthropogenic processes.
Given the fact that geological conditions (filling the lake basin with sediments) indicate an inevitable transformation of the lake into a wetland in the coming decades, we must adapt to the current situation and take an active part in protecting the bird breeding areas. However, there are concerns that even with proper water management in this area, changing climatic conditions (increase in air temperature and intensification of evapotranspiration) will determine the habitat conditions, unavoidably drying it up.
Bird species whose natural habitat of living and reproduction are water and marsh ecosystems, and for which this area has been protected, will be among the most affected. There will be more and more such areas on a global scale. Therefore, there is a need for extended research to diagnose the stage of their evolution and current status, and to adapt the type of protection, so that they can serve their habitat function for as long as possible.

Author Contributions

Conceptualizations A.B., S.S., S.T., M.K., H.K., M.S.; formal analysis A.B., S.S., S.T., M.K., H.K., J.K., M.S.; investigation A.B., S.S., S.T., M.K., H.K., J.K., M.S.; writing—original draft preparation A.B., S.S., S.T., M.K., H.K., M.S.; visualization S.T., M.K., M.S., A.B.; Writing—review, and editing: M.K., M.S., H.K., A.B.; supervision A.B.

Funding

This research received no external funding.

Acknowledgments

The results presented herein are a part of the work financed from the science funds for 2010–2013 as a research project N N306 47 35 38. This study is a contribution to the project NCN 015/17/B/ST10/03430, UMO-2015/19/N/ST10/02655 and 2015/19/B/ST10/03039.

Conflicts of Interest

The authors declare no conflicts of interest.

References

  1. Joosten, H.; Clarke, D. Wise Use of Mires and Peatlands—Background and Principles Including a Framework for Decision-Making; International Peat Society et International Mire Conservation Group: Jyvaskyla, Finland, 2002; p. 304. [Google Scholar]
  2. Rydin, H.; Jeglum, J.K. The Biology of Peatlands; Oxford university press: Oxford, UK, 2006. [Google Scholar]
  3. Page, S.E.; Baird, A.J. Peatlands and global change: Response and resilience. Annu. Rev. Environ. Resour. 2016, 41, 35–57. [Google Scholar] [CrossRef]
  4. Turetsky, M.R.; Bond-Lamberty, B.; Euskirchen, E.; Talbot, J.; Frolking, S.; McGuire, A.D.; Tuittila, E.S. The resilience and functional role of moss in boreal and arctic ecosystems. New Phytol. 2012, 196, 49–67. [Google Scholar] [CrossRef] [PubMed] [Green Version]
  5. Shaw, A.J.; Shaw, B.; Stenøien, H.K.; Golinski, G.K.; Hassel, K.; Flatberg, K.I.; Carine, M. Pleistocene survival, regional genetic structure and interspecific gene flow among three northern peat-mosses: Sphagnum inexspectatum, S. orientaleands and S. miyabeanum. J. Biogeogr. 2015, 42, 364–376. [Google Scholar] [CrossRef]
  6. Głowaciński, Z. Red List of Threatened Animals in Poland; Instytut Ochrony Przyrody PAN: Kraków, Poland, 2002; p. 155. [Google Scholar]
  7. Graf, M.D.; Rochefort, L. Moss regeneration for fen restoration: Field and greenhouse experiments. Restor. Ecol. 2010, 18, 121–130. [Google Scholar] [CrossRef]
  8. Granath, G.; Moore, P.A.; Lukenbach, M.C.; Waddington, J.M. Mitigating wildfire carbon loss in managed northern peatlands through restoration. Sci. Rep. 2016, 6, 28498. [Google Scholar] [CrossRef] [Green Version]
  9. Zedler, J.B.; Kercher, S. Wetland resources: Status, trends, ecosystem services, and restorability. Annu. Rev. Environ. Resour. 2005, 30, 39–74. [Google Scholar] [CrossRef]
  10. Żmihorski, M.; Pärt, T.; Gustafson, T.; Berg, Å.; Rohr, J. Effects of water level and grassland management on alpha and beta diversity of birds in restored wetlands. J. Appl. Ecol. 2016, 53, 587–595. [Google Scholar] [CrossRef]
  11. Ma, Z.; Cai, Y.; Li, B.; Chen, J. Managing wetland habitats for waterbirds: An international perspective. Wetlands 2010, 30, 15–27. [Google Scholar] [CrossRef]
  12. Chodkiewicz, T.; Neubauer, G.; Chylarecki, P.; Sikora, A.; Cenian, Z.; Ostasiewicz, M.; Wylegała, P.; Ławicki, Ł.; Smyk, B.; Betleja, J.; et al. Monitoring populacji ptaków Polski w latach 2012–2013. Biul. Monit. Przyr. 2013, 11, 1–72. (In Polish) [Google Scholar]
  13. Agency, E.E. Environmental Assessment Report; Environment Agency: Bristol, UK, 2000.
  14. Eiseltová, M. Restoration of lakes, streams, floodplains, and bogs in Europe. In Principles and Case Studies; Eiseltová, M., Ed.; Springer: Berlin, Germany, 2010; Volume 3, p. 374. [Google Scholar]
  15. IPCC. Contribution of Working Group II to the Fifth Assessment Report of the Intergovernmental Panel on Climate Change; Cambridge University Press: Cambridge, UK; New York, NY, USA, 2014; p. 688. [Google Scholar]
  16. Kundzewicz, Z. Zmiany klimatu, ich przyczyny i skutki: Obserwacje i projekcje. Landf. Anal. 2011, 15, 39–49. (In Polish) [Google Scholar]
  17. Bartczak, A. Wieloletnia zmienność odpływu rzecznego z dorzecza Zgłowiączki. Prace Geograficzne IGiPZ PAN 2007, 209, 164. (In Polish) [Google Scholar]
  18. Gierszewski, P. Charakterystyka środowiska hydrochemicznego wód powierzchniowych zachodniej części kotliny płockiej. Pra. Geogr. IGiPZ PAN 2000, 176, 136. (In Polish) [Google Scholar]
  19. Fal, B.; Bogdanowicz, E. Zasoby wód powierzchniowych Polski. Wiadom. IMiGW 2002, 25, 3–38. (In Polish) [Google Scholar]
  20. Jokiel, P. Zasoby Wodne Środkowej Polski w XXI Wieku; Wydawnictwo UŁ: Łódź, Poland, 2004. (In Polish) [Google Scholar]
  21. Błaszkiewicz, M.; Piotrowski, J.A.; Brauer, A.; Gierszewski, P.; Kordowski, J.; Kramkowski, M.; Lamparski, P.; Lorenz, S.; Noryśkiewicz, A.M.; Ott, F.; et al. Climatic and morphological controls on diachronous postglacial lake and river valley evolution in the area of last glaciation, northern Poland. Quat. Sci. Rev. 2015, 109, 13–27. [Google Scholar]
  22. Rosgen, D.L. Applied River Morphology; Wildland Hydrology: Fort Collins, CO, USA, 1996. [Google Scholar]
  23. Słowiński, M.; Błaszkiewicz, M.; Brauer, A.; Noryśkiewicz, B.; Ott, F.; Tyszkowski, S. The role of melting dead ice on landscape transformation in the early holocene in Tuchola pinewoods, north Poland. Quat. Int. 2015, 388, 64–75. [Google Scholar] [CrossRef]
  24. Wulf, S.; Ott, F.; Słowiński, M.; Noryskiewicz, A.M.; Drager, N.; Martin-Puertas, C.; Czymzik, M.; Neugebauer, I.; Dulski, P.; Bourne, A.J.; et al. Tracing the laacher see tephra in the varved sediment record of the Trzechowskie palaeolake in central northern Poland. Quat. Sci. Rev. 2013, 76, 129–139. [Google Scholar] [CrossRef]
  25. Kordowski, J. The role of blocks of dead ice in the deposition of late glacial sediments in a large valley: A case study from the Vistula river valley in the Grudziądz basin, north Poland. Geogr. Pol. 2013, 86, 341–361. [Google Scholar] [CrossRef]
  26. Roman, M. Objaśnienia do Szczegółowej Mapy Geologicznej Polski 1:50000, Ark; Państwowy Instytut Geologiczny: Gostynin, Poland, 2011. (In Polish) [Google Scholar]
  27. Baraniecka, M.D. Objaśnienia do Szczegółowej Mapy Geologicznej Polski 1:50000 Arkusz Lubień Kujawski; PIG: Warszawa, Poland, 1993. (In Polish) [Google Scholar]
  28. Glazik, R. Wpływ zbiornika wodnego na Wiśle we Włocławku na zmiany stosunków wodnych w dolinie. Dokument. Geog. IGiPZ PAN 1978, 2–3, 119. (In Polish) [Google Scholar]
  29. Bobrek, R.; Hasny, J.; Kajzer-Bonk, J.; Wayda, M.; Springer, S.; Żmuda, A. Międzysezonowa powtarzalność dynamiki jesiennej migracji wróblowych Passeriformes nad Jeziorem Rakutowskim. Orn. Polon. 2016, 57, 39–57. (In Polish) [Google Scholar]
  30. Przybylak, R.; Vizi, Z.; Araźny, A.; Kejna, M.; Maszewski, R.; Uscka-Kowalkowska, J. Poland’s climate extremes index, 1951–2005. Geogr. Pol. 2007, 80, 47–58. [Google Scholar]
  31. Siedlecki, M.; Fortuniak, K.; Pawlak, W. Porównanie wybranych metod określania parowania w Łodzi. Przegl. Geofizyc. 2012, 2, 211–221. (In Polish) [Google Scholar]
  32. Shapiro, S.S.; Wilk, M.B. An analysis of variance test for normality (complete samples). Biometrika 1965, 52, 591–611. [Google Scholar] [CrossRef]
  33. Box, G.E.; Cox, D.R. An analysis of transformations. J. R. Stat. Soc. Ser. B 1964, 26, 211–252. [Google Scholar] [CrossRef]
  34. Box, G.E.; Cox, D.R. An analysis of transformations revisited, rebutted. J. Am. Stat. Assoc. 1982, 77, 209–210. [Google Scholar] [CrossRef]
  35. Mckee, T.B.; Doesken, N.J.; Kleist, J. The relationship of drought frequency and duration times scales. In Proceedings of the 8th Conference on Applied Climatology, Janvier, Anaheim, CA, USA, 17–22 January 1993; American Meteorological Society: Anaheim, CA, USA, 1993; pp. 179–184. [Google Scholar]
  36. Guttman, N.B. Accepting the standardized precipitation index: A calculation algorithm. JAWRA J. Am. Water Resour. Assoc. 2007, 35, 311–322. [Google Scholar] [CrossRef]
  37. Bąk, B.; Łabędzki, L. Modification of standardized precipitation index SPI for drought monitoring in Poland, Meteorological services’ tasks in NATO operations, missions and excercises. In Proceedings of the 5th International Symposium on Military Meteorology, Poznań, Poland, 29 September–2 October 2003; WAT Warszawa: Poznań, Poland, 2003; pp. 15–22. [Google Scholar]
  38. Łabędzki, L.; Bąk, B. Indicator-based monitoring and forecasting water deficit and surplus in agriculture in Poland. Ann. Wars. Univ. Life Sci. Land Reclam. 2015, 47, 355–369. [Google Scholar] [CrossRef] [Green Version]
  39. Łabędzki, L. Problematyka susz w Polsce. Woda Środ. Obsz. Wiej. 2004, 4, 47–66. (In Polish) [Google Scholar]
  40. Łabędzki, L. Estimation of local drought frequency in central Poland using the standardized precipitation index SPI. Irrig. Drain. 2007, 56, 67–77. [Google Scholar] [CrossRef]
  41. Bartczak, A.; Glazik, R.; Tyszkowski, S. Czasowe i przestrzenne zróżnicowanie odpływu jednostkowego w zlewni rzeki Zgłowiączki (wschodnia część Kujaw). Sci. Nat. Technol. 2014, 8, 28. (In Polish) [Google Scholar]
  42. Harasimiuk, A.; Wicik, B.; Grabowski, T. The lake deposits in Płock basin (case studies of Lakes Rakutowskie and Żłoby). Limnol. Rev. 2010, 10, 23–28. (In Polish) [Google Scholar] [CrossRef]
  43. Konatowska, M.; Rutkowski, P. Zmiany powierzchni i poziomu lustra wody jeziora Kamińsko (nadleśnictwo doświadczalne Zielonka) na przestrzeni ostatnich 150 lat. Studia i Materiały Centrum Edukacji Przyrodniczo-Leśnej 2008, 10, 205–217. (In Polish) [Google Scholar]
  44. Miller, P. Ubywa Jezior; Przyroda Polska: Warszawa, Poland, 2003. (In Polish) [Google Scholar]
  45. Marszelewski, W.; Glazik, R. Uwarunkowania hydrologiczne zlewni Jeziora Rakutowskiego i ich przemiany pod wpływem antropopresji. In Aktywna Ochrona Bioróżnorodności Rezerwatu Jezioro Rakutowskie; Materiały Seminaryjne, Zespół Parków Krajobrazowych Brudzeńskiego i Gostynińsko-Włocławskiego: Kowal, Poland, 2002; Volume 28, pp. 28–37. (In Polish) [Google Scholar]
  46. Bartczak, A.; Birek, E.; Brykała, D.; Gierszewski, P.; Glazik, R. Wpływ wybranych czynników antropogenicznych na zmiany stosunków wodnych w zachodniej części Kotliny Płockiej. In Zintegrowany Monitoring Środowiska Przyrodniczego; Funkcjonowanie Środowiska Przyrodniczego w Okresie Przemian Gospodarczych w Polsce, Biblioteka Monitoringu Środowiska: Szymbark, Poland, 2009; pp. 117–130. (In Polish) [Google Scholar]
  47. Kramkowski, M.; Bartczak, A.; Kaczmarek, H.; Słowiński, M.; Tyszkowski, S. Naturalne i antropogeniczne uwarunkowania przestrzennych zmian obszarów wodno-błotnych na przykładzie Jeziora Rakutowskiego w świetle archiwalnych materiałów kartograficznych i fotogrametrycznych. Problemy Ekologii Krajobrazu 2014, 37, 169–179. (In Polish) [Google Scholar]
  48. Szurek, J.C. Family farms in polish agricultural policy: 1945–1985. East Eur. Polit. Soc. 1987, 1, 225–254. [Google Scholar] [CrossRef]
  49. Gondek, Z. Rozwój przemysłu nawozowego w Polsce. Roczniki Gleboznawcze 1971, 22, 79–87. (In Polish) [Google Scholar]
  50. Kędziora, A. Zagrożenia zasobów wodnych w Wielkopolsce. In Rozwój Rolnictwa w Kierunku Zrównoważonym; Wieland, E., Ed.; Dodatek do miesięcznika Przegląd Komunalny: Poznań, Poland, 1998; pp. 49–63. (In Polish) [Google Scholar]
  51. Charman, D. Peatlands and Environmental Change; Wiley: Hoboken, NJ, USA, 2002. [Google Scholar]
  52. Ptak, M. Zmiany powierzchni jezior na tle zmian lesistości w środkowym i dolnym dorzeczu Warty od końca XIX wieku. In Woda w Badaniach Geograficznych; Ciupa, T., Suligowski, R., Eds.; Gospodarki Przestrzennej UJ: Kraków, Poland, 2010. (In Polish) [Google Scholar]
  53. Herbst, M.; Kappen, L. The ratio of transpiration versus evaporation in a reed belt as influenced by weather conditions. Aquat. Bot. 1999, 63, 113–125. [Google Scholar] [CrossRef]
  54. Milly, P.C.; Betancourt, J.; Falkenmark, M.; Hirsch, R.M.; Kundzewicz, Z.W.; Lettenmaier, D.P.; Stouffer, R.J. Climate change. Stationarity is dead: Whither water management? Science 2008, 319, 573–574. [Google Scholar] [CrossRef] [PubMed]
  55. Szwed, M.; Graczyk, D.; Pińskwar, I.; Kundzewicz, Z.W. Projections of climate extremes in Poland. Geogr. Pol. 2007, 80, 191–202. [Google Scholar]
  56. Gutry-Korycka, M.; Sadurski, A.; Kundzewicz, Z.W.; Pociask-Karteczka, J.; Skrzypczyk, L. Zasoby wodne a ich wykorzystanie. Nauka 2014, 1, 77–98. (In Polish) [Google Scholar]
  57. Li, H.; Gao, Y.; Li, Y.; Yan, S.; Xu, Y. Dynamic of Dalinor lakes in the inner Mongolian plateau and its driving factors during 1976–2015. Water 2017, 9, 749. [Google Scholar] [CrossRef]
  58. Kędziora, A.; Kępińska-Kasprzak, M.; Kowalczak, P.; Kundzewicz, Z.; Miler, A.; Pierzgalski, E.; Tokarczyk, T. Zagrożenia związane z niedoborem wody. Gospodarka Wodna 2014, 1, 373–376. (In Polish) [Google Scholar]
  59. Bartczak, A.; Glazik, R.; Tyszkowski, S. Identyfikacja i ocena intensywności okresów suchych we wschodniej części Kujaw. Nau. Przyr. Technol. 2014, 8, 46. (In Polish) [Google Scholar]
  60. Szwed, M.; Karg, G.; Pińskwar, I.; Radziejewski, M.; Graczyk, D.; Kędziora, A.; Kundzewicz, Z.W. Climate change and its effect on agriculture, water resources and human health sectors in Poland. Nat. Hazards Earth Syst. Sci. 2010, 10, 1725–1737. [Google Scholar] [CrossRef] [Green Version]
Figure 1. Study area location, 1. International ecological corridors, 2. International core area, 3. National core areas, 4. Rain gauging station, 5. Stream gauge, 6. Lake catchment area, 7. Gostynin–Włocławek Landscape Park border.
Water 11 00032 g001
Figure 2. Surrounding of Rakutowskie Lake, 1. Wetlands, 2. Elevation points, 3. Drainage system, 4. Penstock, 5. Drainage ditch, 6. Nature reserve borders, 7. Nature 2000 borders, 8. Drilling locations.
Water 11 00032 g002
Figure 3. Geological structure: (A) Geological map (based on field work and Geological Map of Poland 1:50,000) 1. The range of biogenic sediment and lake sand 2. Clay, 3. Fluvio–glacial sands, 4. Lake sands, 5. Muds, 6. Peat, 7. Peat on Gyttja, 8. Peat on sands, 9. Gyttja, 10. Water, 11. Aeolian sands; (B) Soil profile photo 1. Decomposed peat, 2. Calcareous gyttja, CaCO3—70%, mineral matter 30%, 3. Silty sands; (C) Geological cross-sections 1. Decomposed peat, 2. Calcareous Gyttja, 3. Silty sand.
Water 11 00032 g003
Figure 4. The range of Rakutowskie Lake and the forest areas in 1911–2009 mapped on Google Earth 7.3.2.5491 (3 October 2015). Rakutowskie, Poland. 52°32’10.09” N, 19°14’25.17” E, Eye alt 3.44 km DigitalGlobe 2018. http://www.earth.google.com (1 October 2018). The range of the lake in the years: 1. 2009, 2. 1996, 3. 1980, 4. 1961, 5. 1945, 6. 1944, 7. 1911. The range of the forest in the years: 8. 2009, 9. 1945.
Water 11 00032 g004
Figure 5. Values of monthly and yearly indices with the moving trend for the latter in the period 1967–2015. The selected periods (months and years) correspond to the satellite images depicted in Figure 6.
Water 11 00032 g005
Figure 6. Satellite images presenting the range of Rakutowskie Lake corresponding to selected periods marked in Figure 5. The Figure is based on: 1. Panchromatic aerial photos 1:30,000; 2. RGB Photo 1:26,000; 3–6. Google earth 7.3.2.5491. Rakutowskie, Poland. 52°32’10.09” N, 19°14’25.17” E, Eye alt 3.44 km DigitalGlobe 2018. http://www.earth.google.com (1 October 2018).
Water 11 00032 g006
Figure 7. Hydrometeorological conditions in the study area in the water years of 2011 and 2012.
Water 11 00032 g007
Figure 8. Schematic model of ecological changes of the Rakutowskie Lake ecosystem.
Water 11 00032 g008
Table 1. Cartographic materials used for analysis.
No.NameYearScaleComments
ATopograficzna Karta Królestwa Polskiego
Topographic Map of the Kingdom of Poland
18431:126,000based on a topographic photo, scale 1:42,000
BReymann’s SpecialkarteApprox. 18451:200,000
CKöniglich-Preussische Landesaufnahme19021:300,000
DKarte des Westlichen Russlands19111:100,000based on Russian maps, scale
1:42,000 and 1:8000
EMapa Operacyjna Polski
Operational Map of Poland
19221:300,000executed by the Military Geographical Institute (MGI), based on a German map Übersichtskarte von Mitteleuropa (Outline Map of Central Europe) from 1916
FMap WIG
MGI map
19301:100,000
GTopographische Karte (Meßtischblatt)1941, 19441:25,000
HKarte des Deutschen Reiches-Großblatt/Einheitsblatt19451:100,000based on Meßtischblatt from 1930 and aerial maps from June 1941
ITopographic map19831:10,000
Table 2. Photogrammetric materials used for analysis.
TypeYearScale
panchromatic aerial photos1961-09-241:18,000
panchromatic aerial photos19801:30,000
RGB (Red, Green, Blue) photo1996-08-191:26,000
RGB orthophotomap2009-09-091:5000
Table 3. Classification of Standardised: Discharge Index (SDI), Precipitation Index (SPI) and Climatic Water Balance Index (SCWBI) for months and years.
SDI, SPI, SCWBIClassification
2.00 and moreExtremely wet
1.50 ÷ 2.00Severely wet
1.00 ÷ 1.50Moderately wet
0.50 ÷ 1.00Slightly wet
−0.50 ÷ 0.50Normal
−0.50 ÷ −1.00Slightly dry
−1.00 ÷ (−1.50)Moderately dry
−1.50 ÷ (−2.00)Severely dry
−2.00 and lessExtremely dry
Table 4. Classification of Standardised Evaporation Index (SEI) for months and years.
SEIClassification
2.00 and moreExtremely dry
1.50 ÷ 2.00Severely dry
1.00 ÷ 1.50Moderately dry
0.50 ÷ 1.00Slightly dry
−0.50 ÷ 0.50Normal
−0.50 ÷ (−1.00)Slightly wet
-1.00 ÷ (−1.50)Moderately wet
−1.50 ÷ (−2.00)Severely wet
−2.00 and lessExtremely wet

