Topographical Analysis of the 2013 Typhoon Haiyan Storm Surge Flooding by Combining the JMA Storm Surge Model and the FLO-2D Flood Inundation Model


Abstract

1. Introduction
2. Data and Methods
2.1. Storm Surge Model (JMA)
2.2. Coastal Inundation Model
3. Results and Discussion
3.1. Results of Storm Surge Coastal Inundation Model
3.2. Model Results Analysis
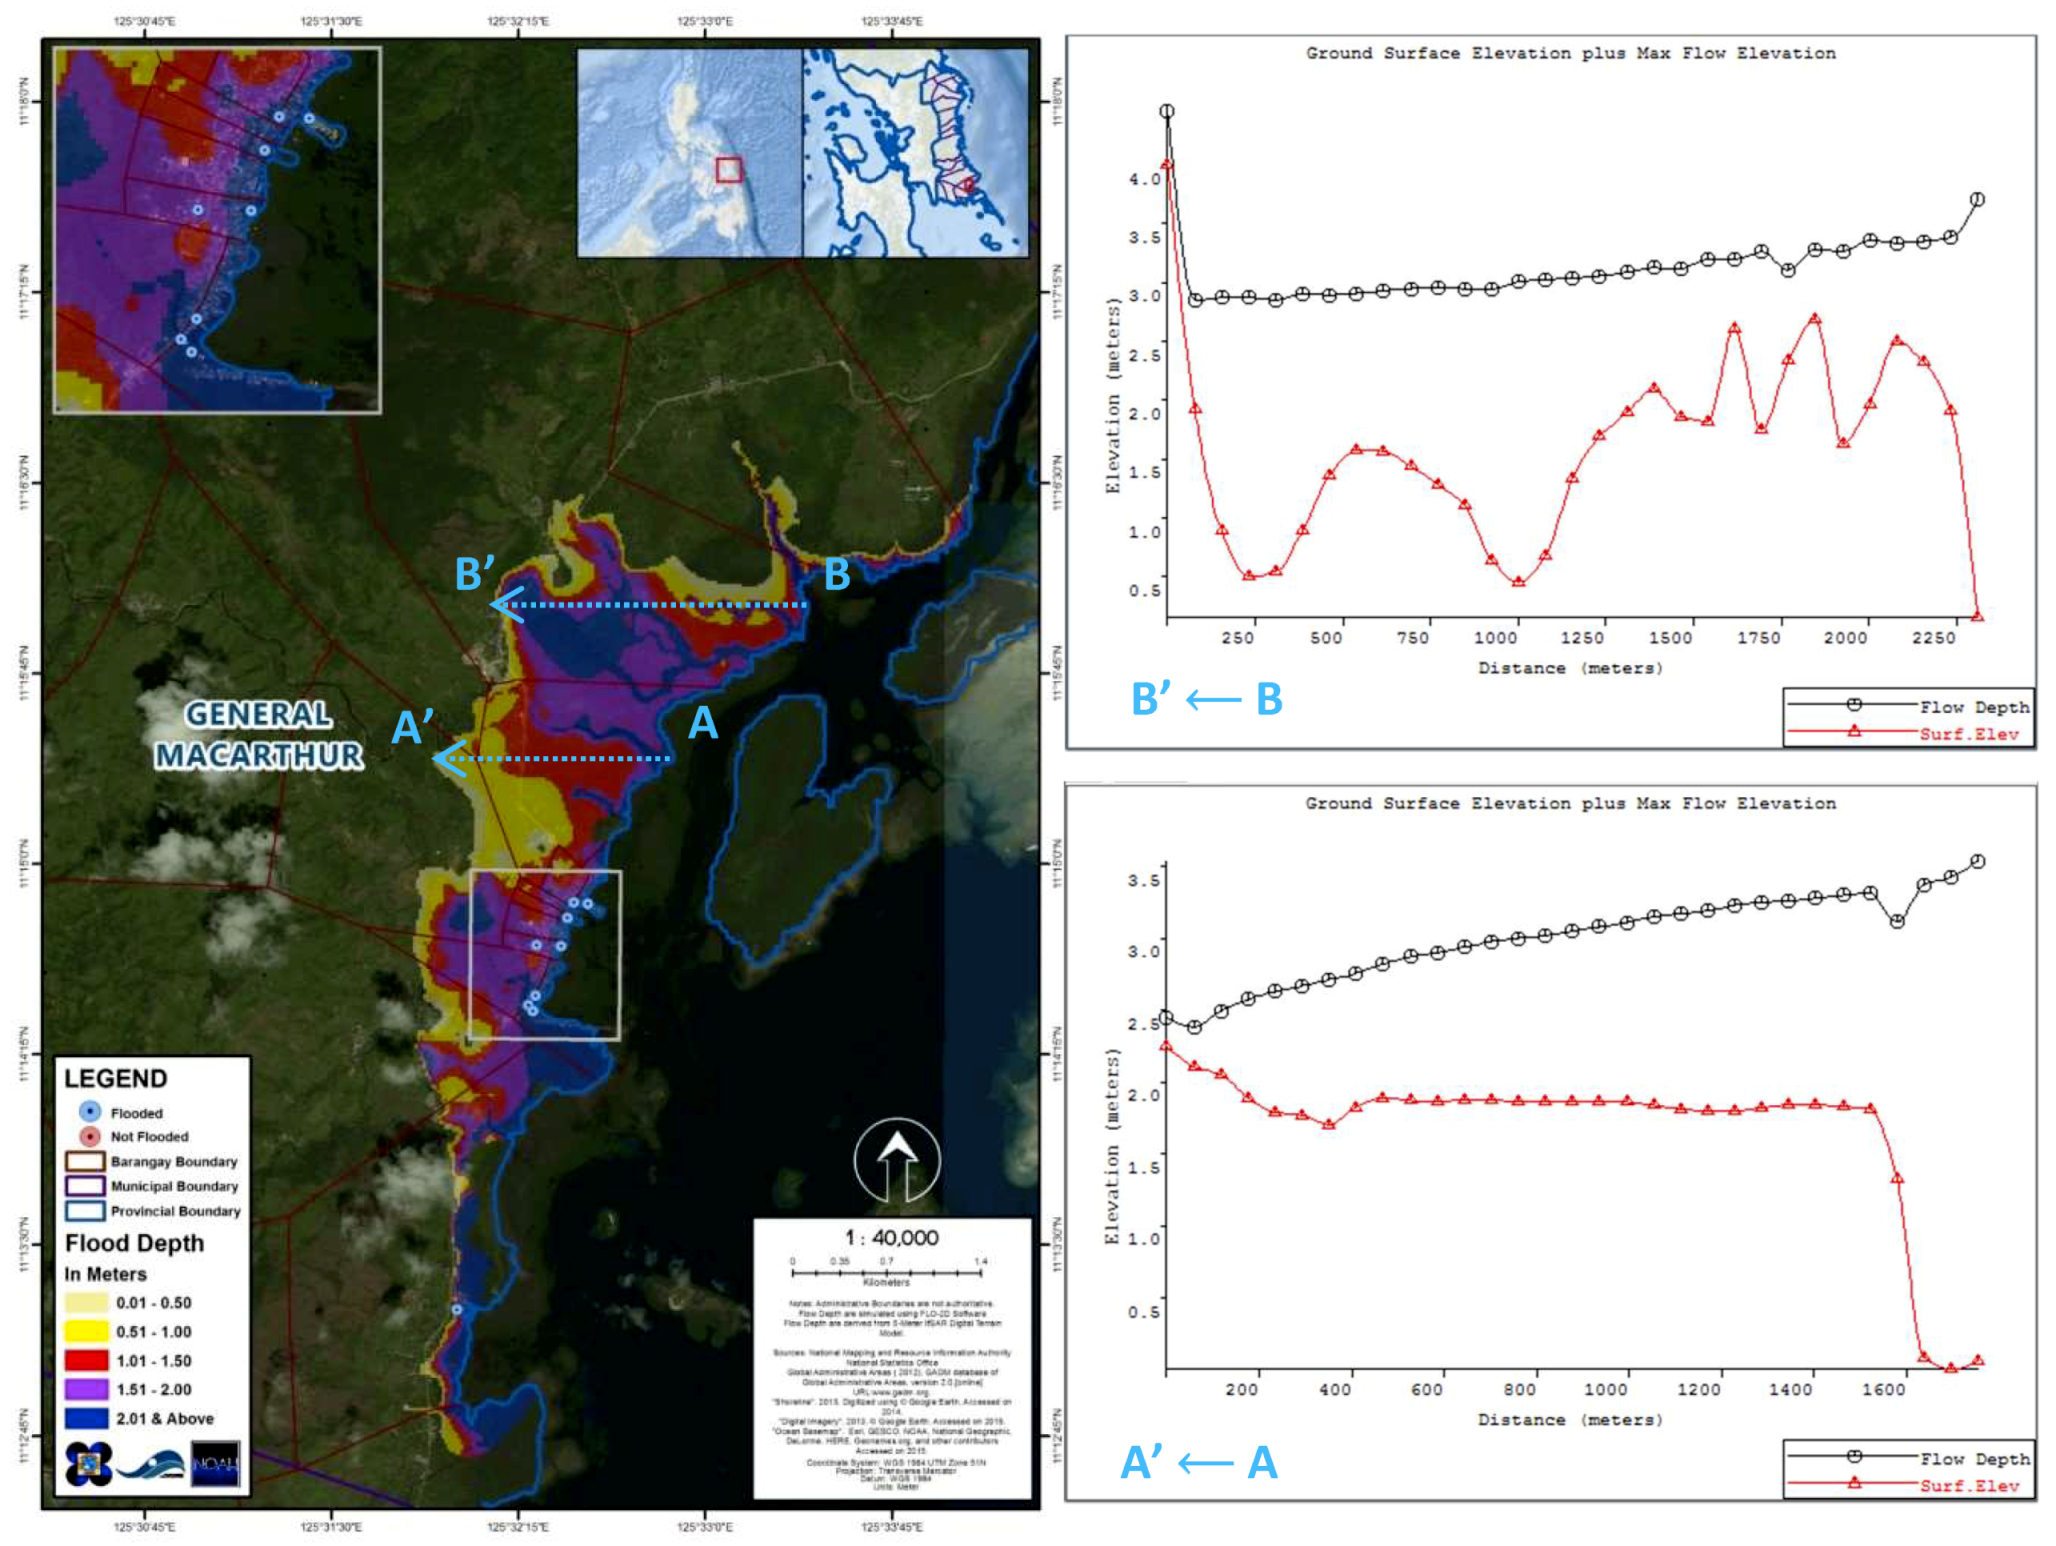
3.2.1. Effect of Elevation on Storm Surge Flow Depth
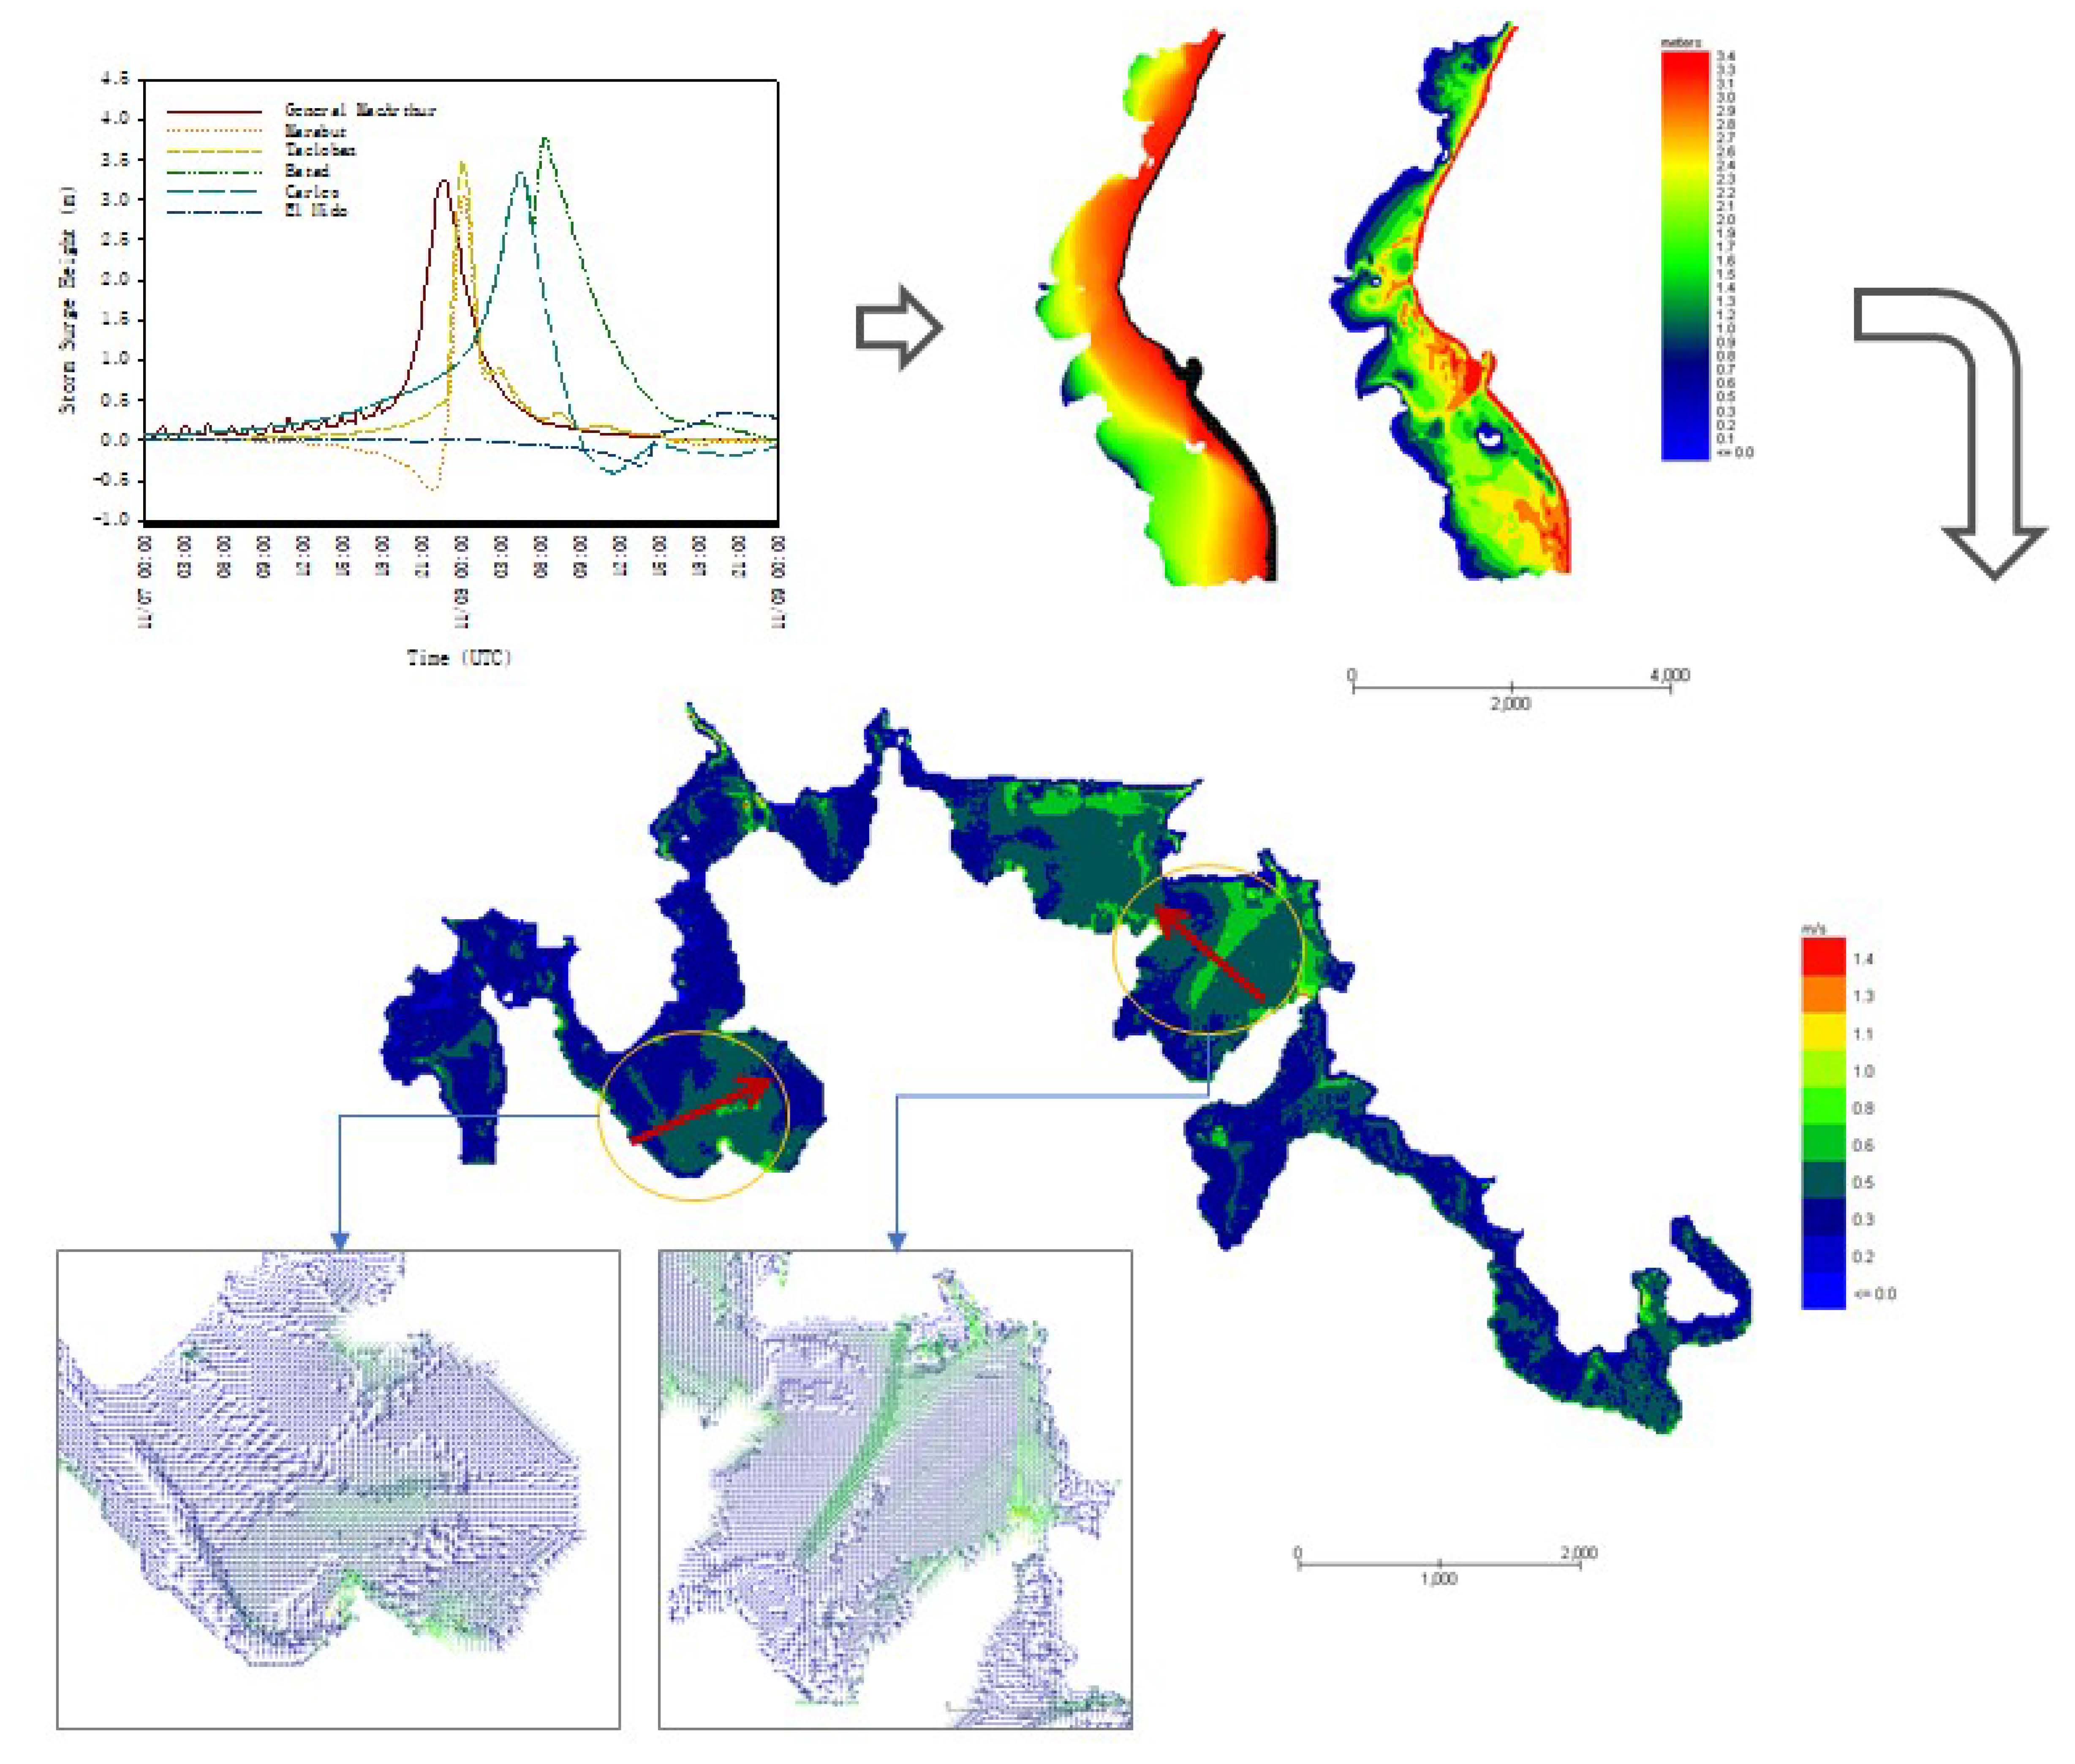
3.2.2. Effect of Elevation on Storm Surge Velocity
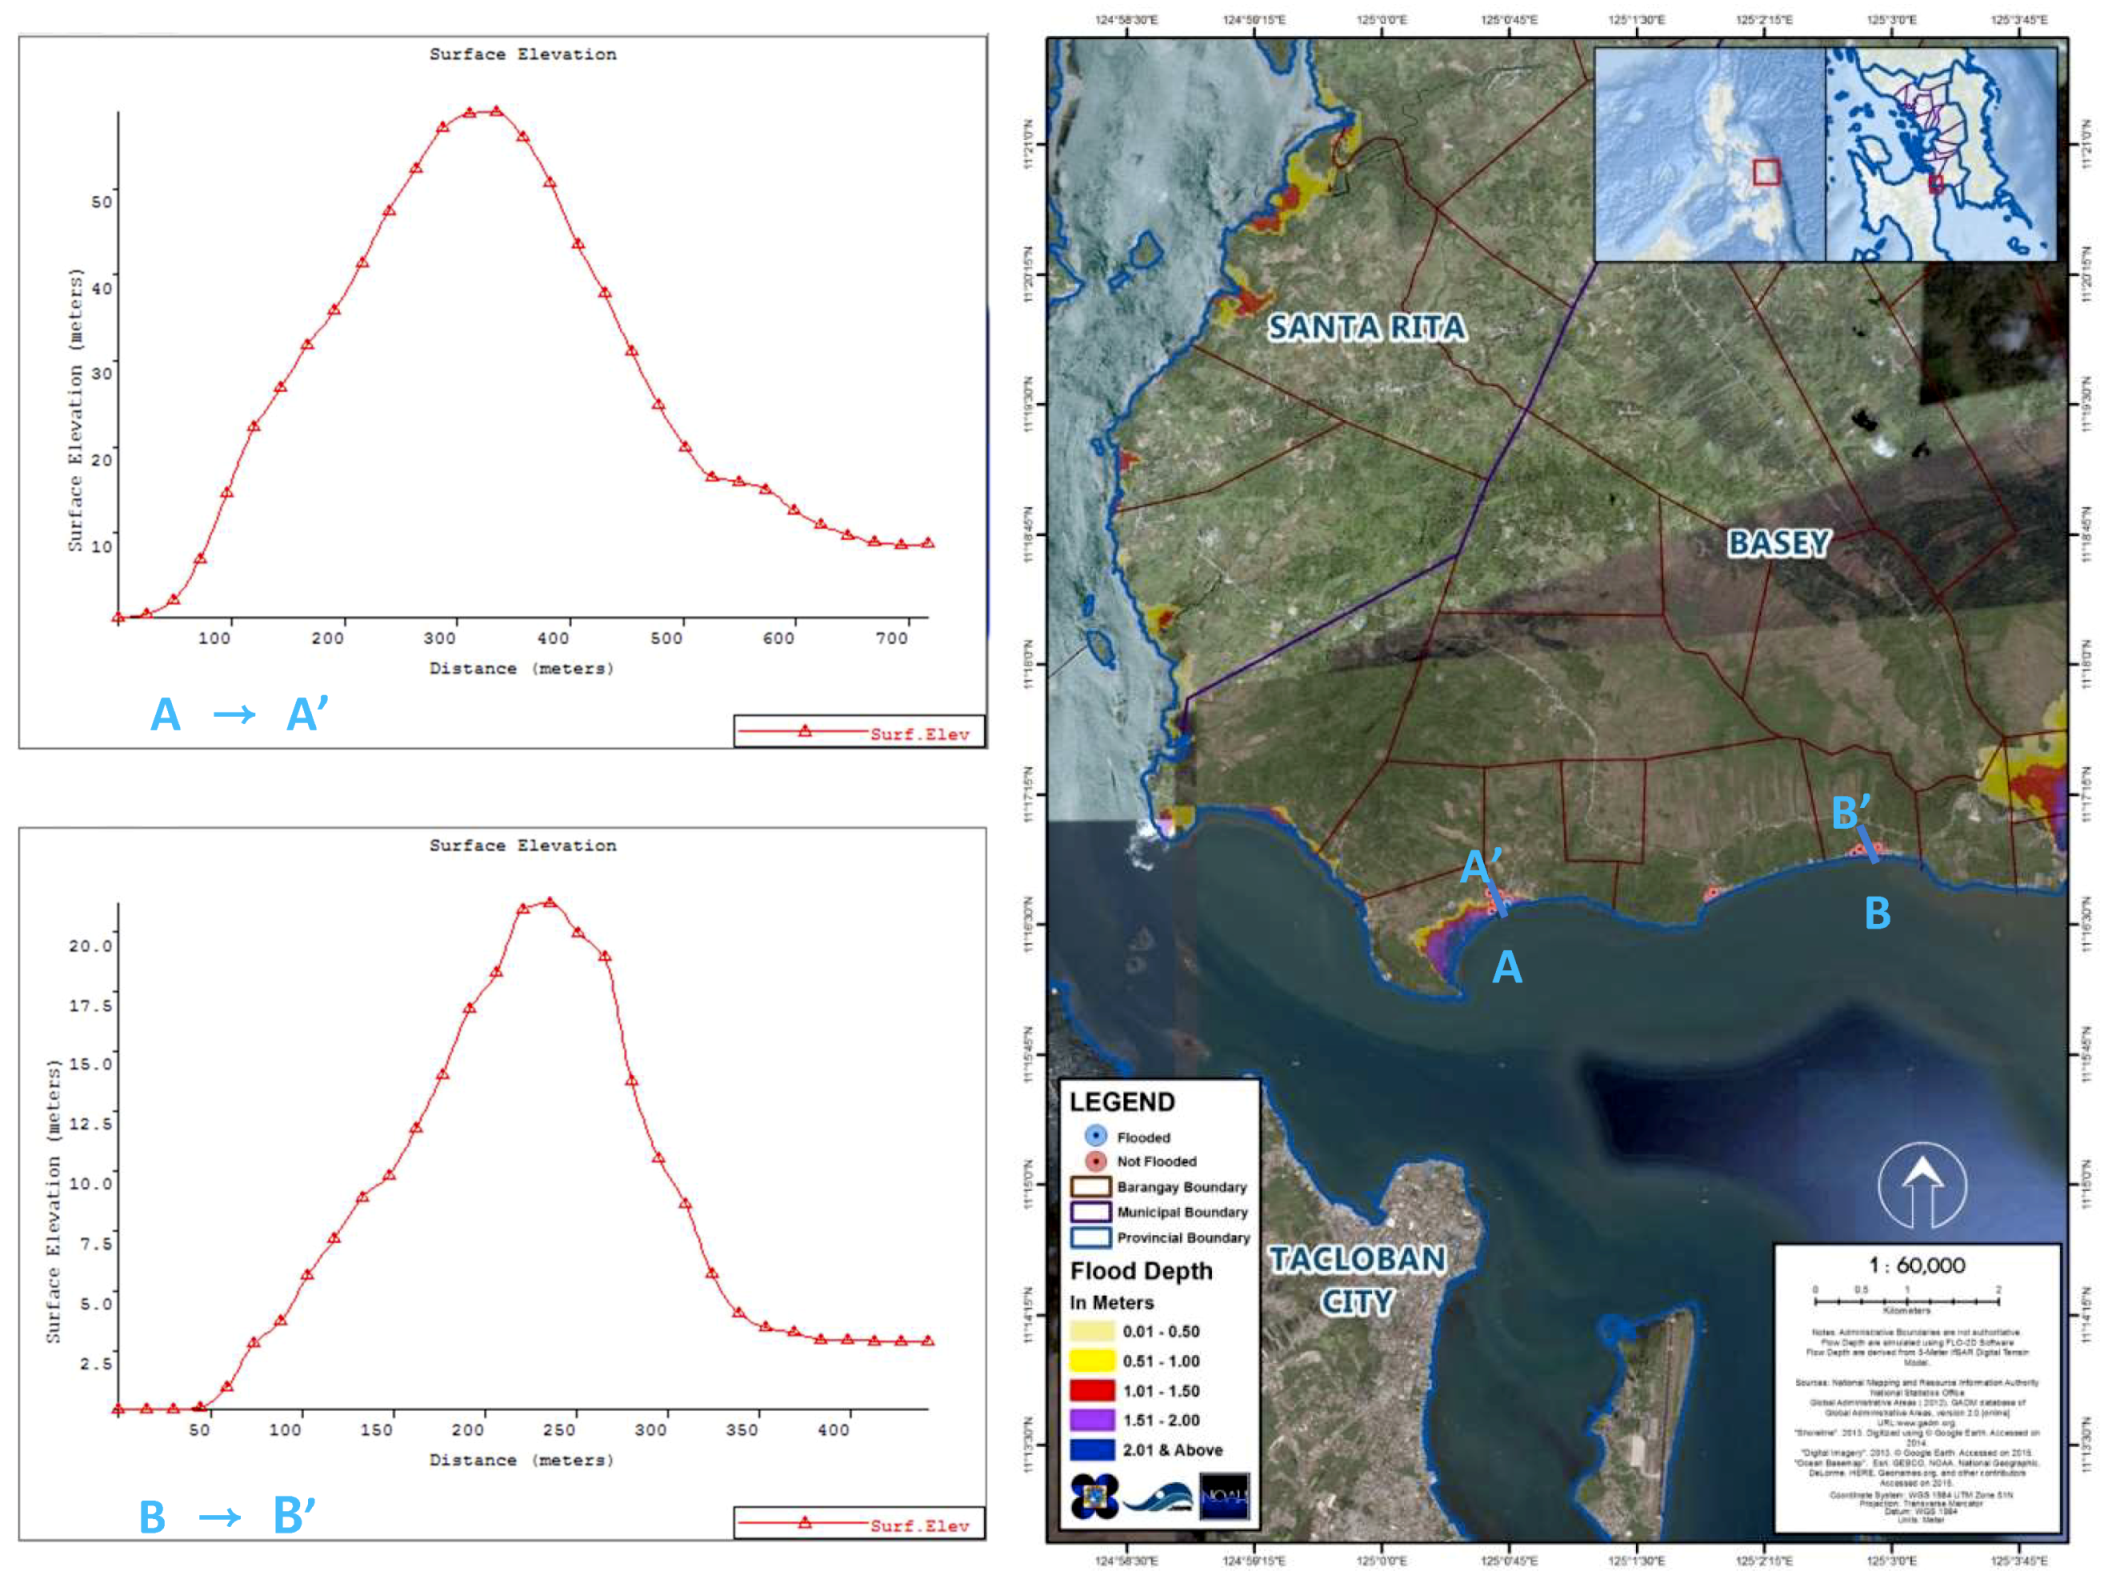
3.2.3. Effect of Coastal Shape on Storm Surge Flow Depth
3.2.4. Effect of Coastal Shape on Storm Surge Velocity
3.2.5. Effect of Angle of Approach on Flow Depth
4. Conclusions
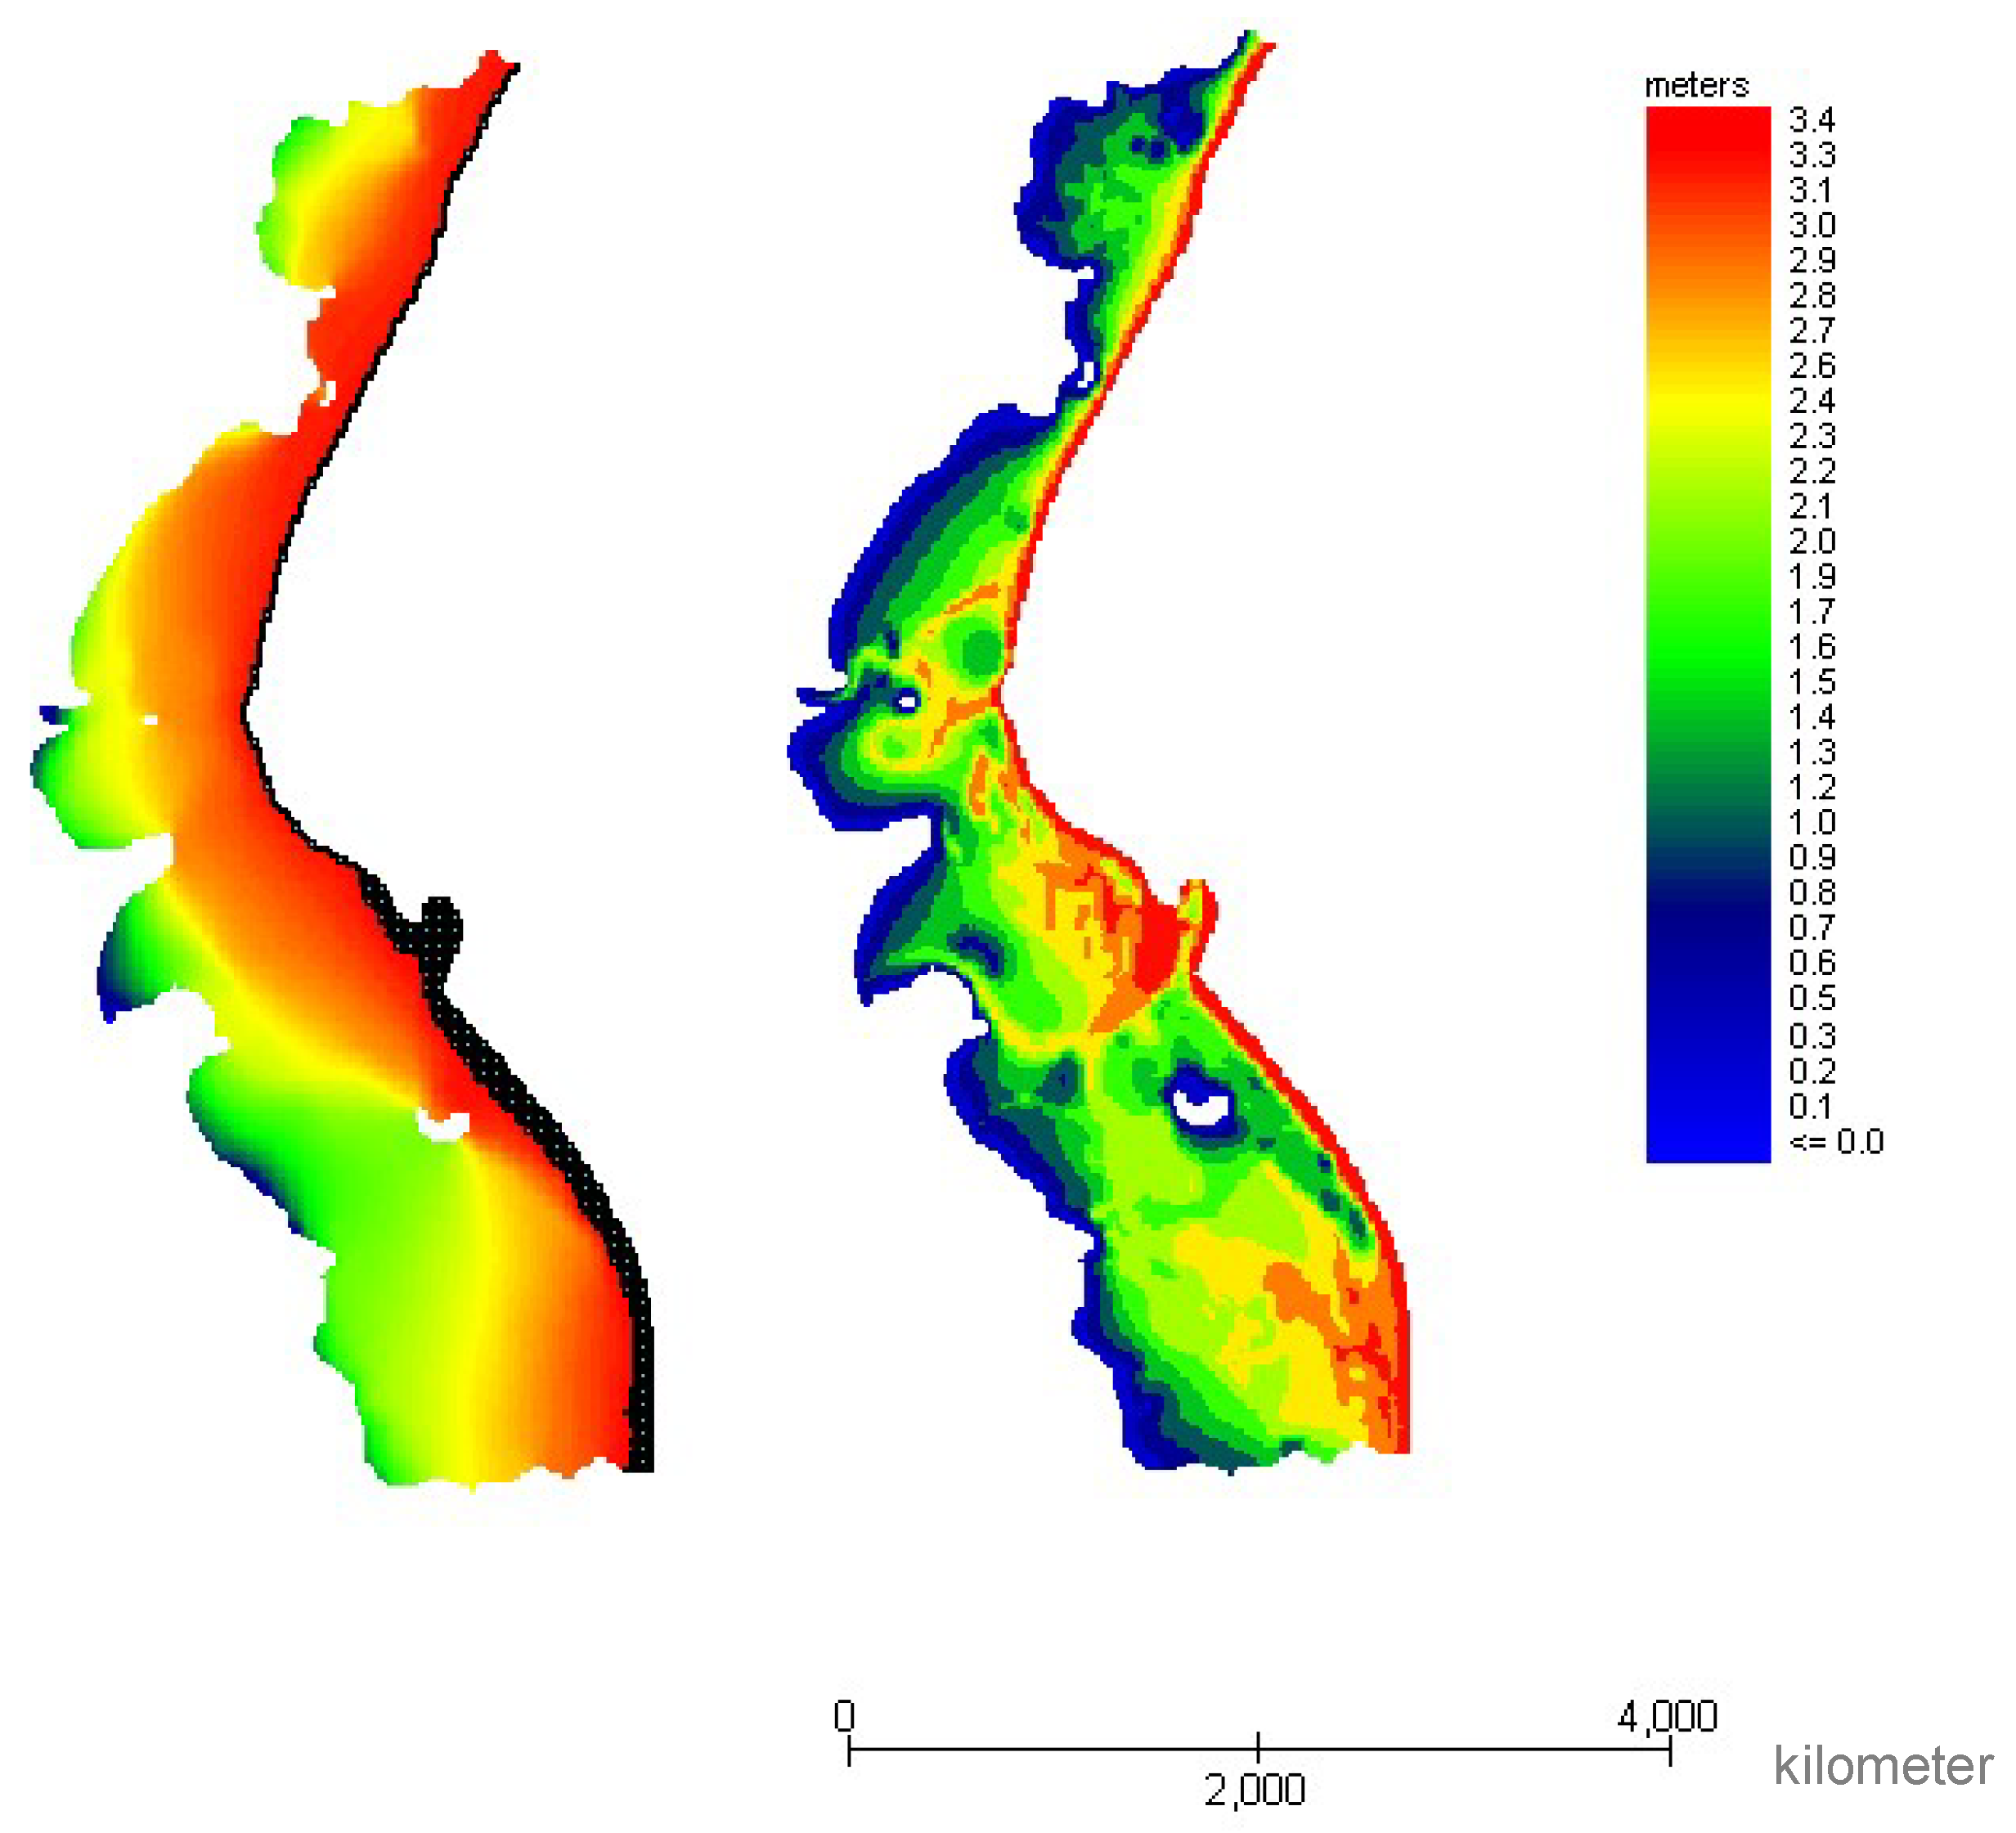
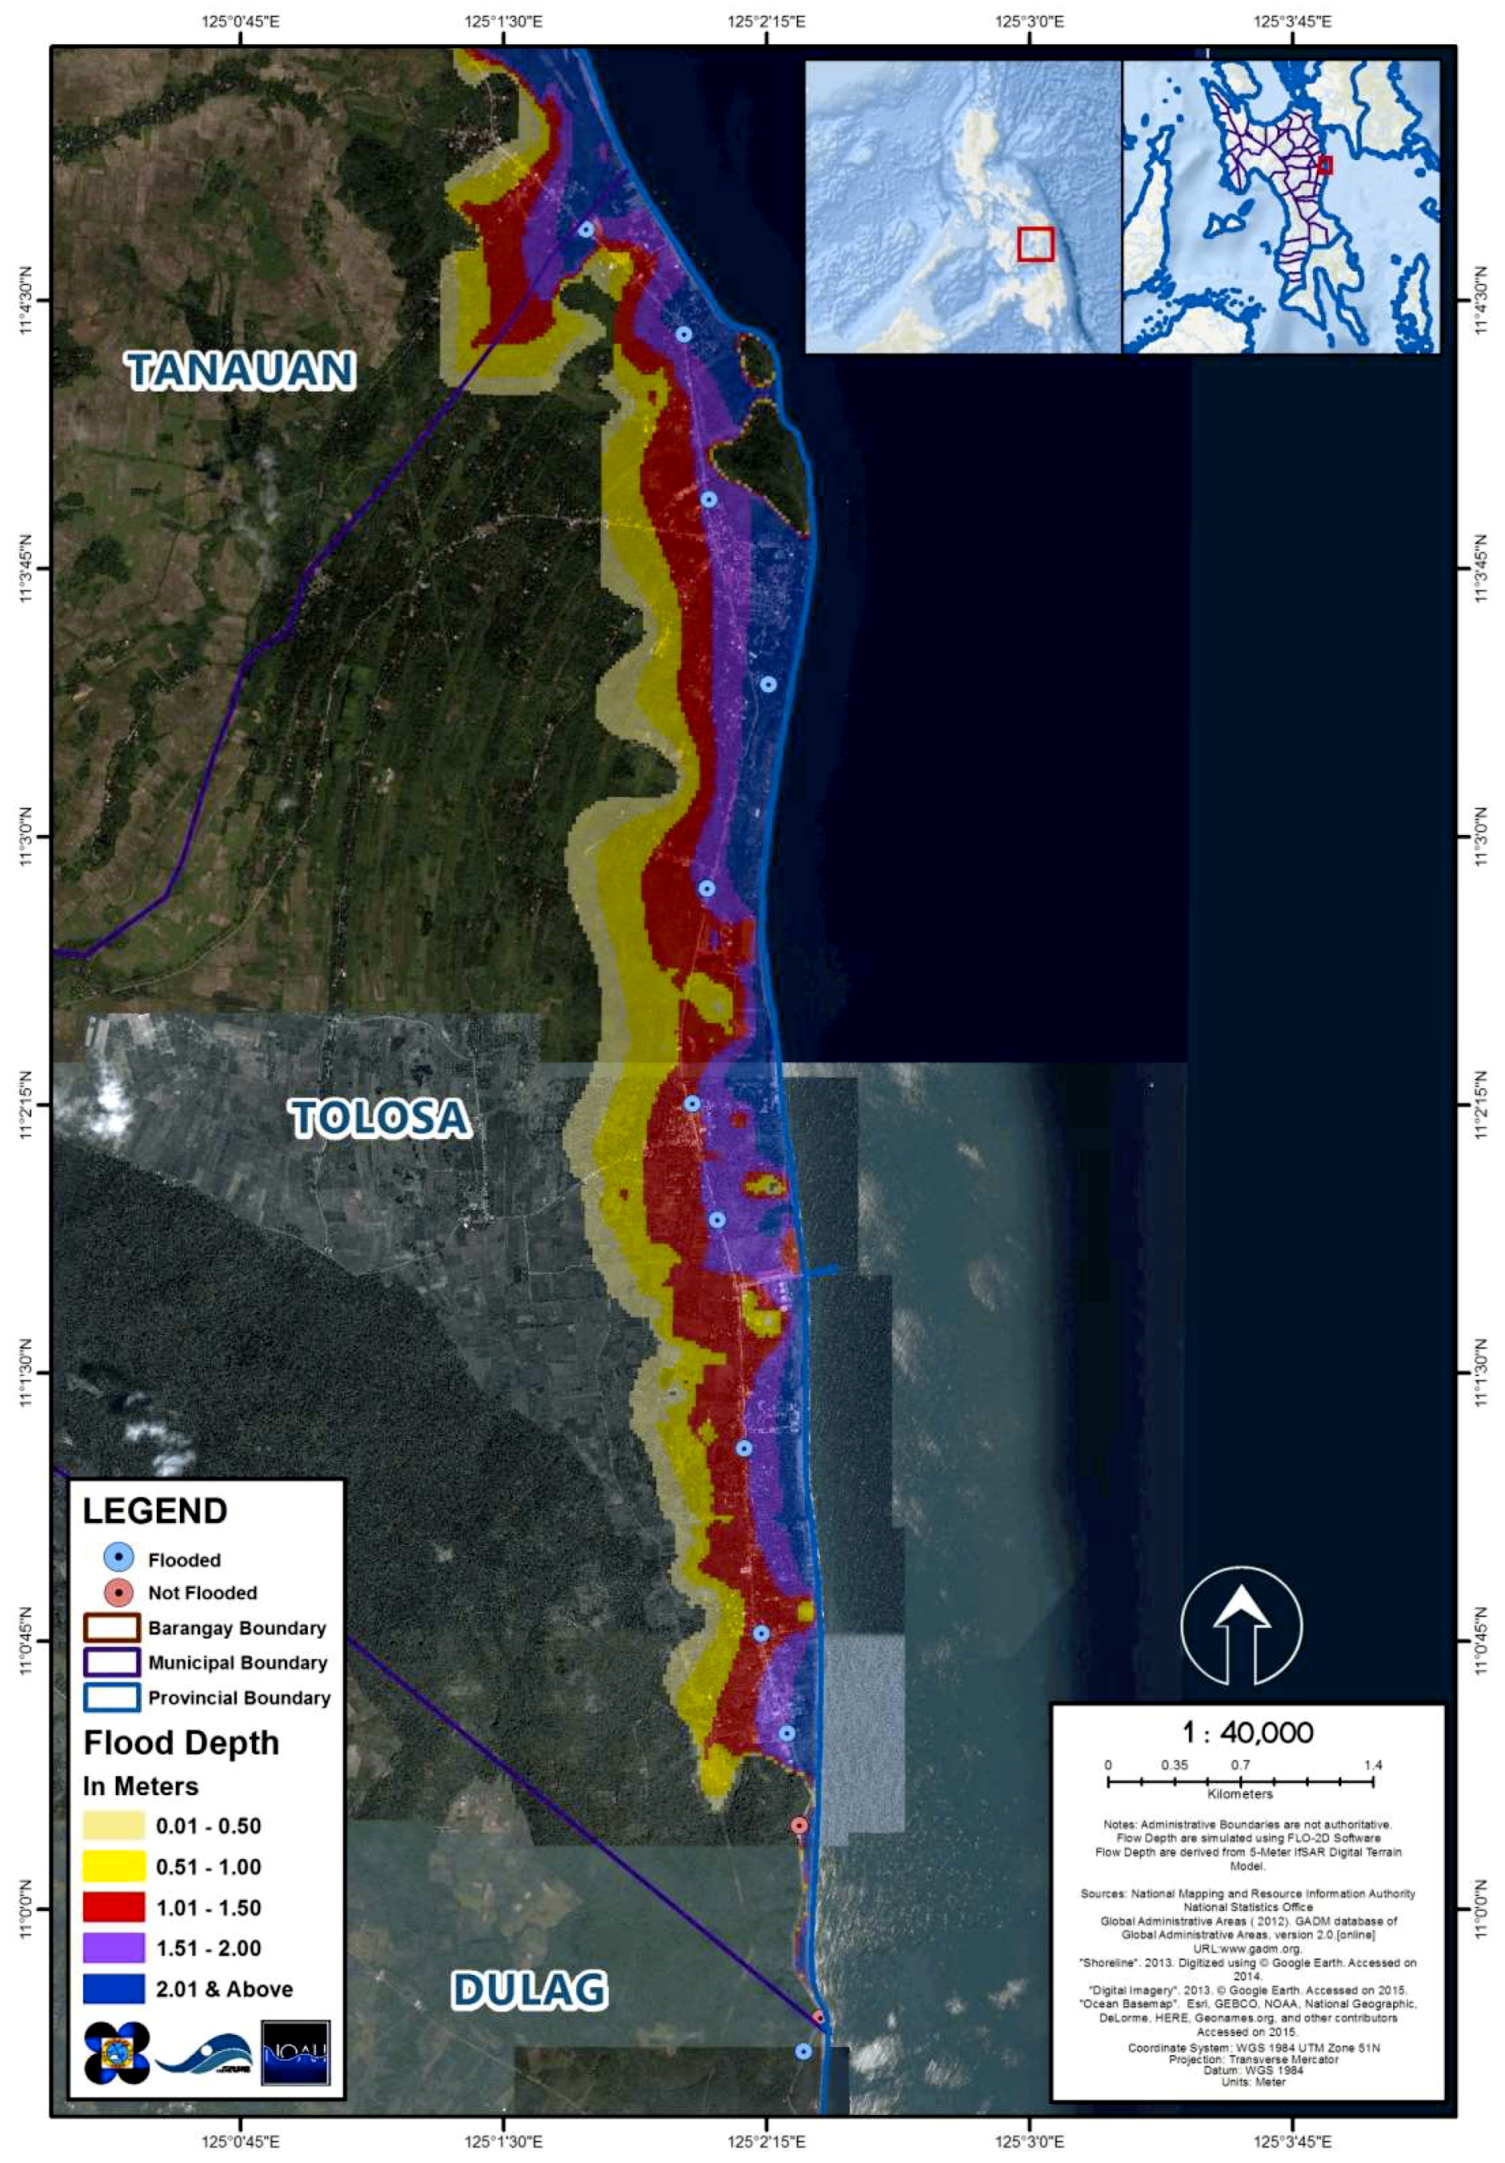
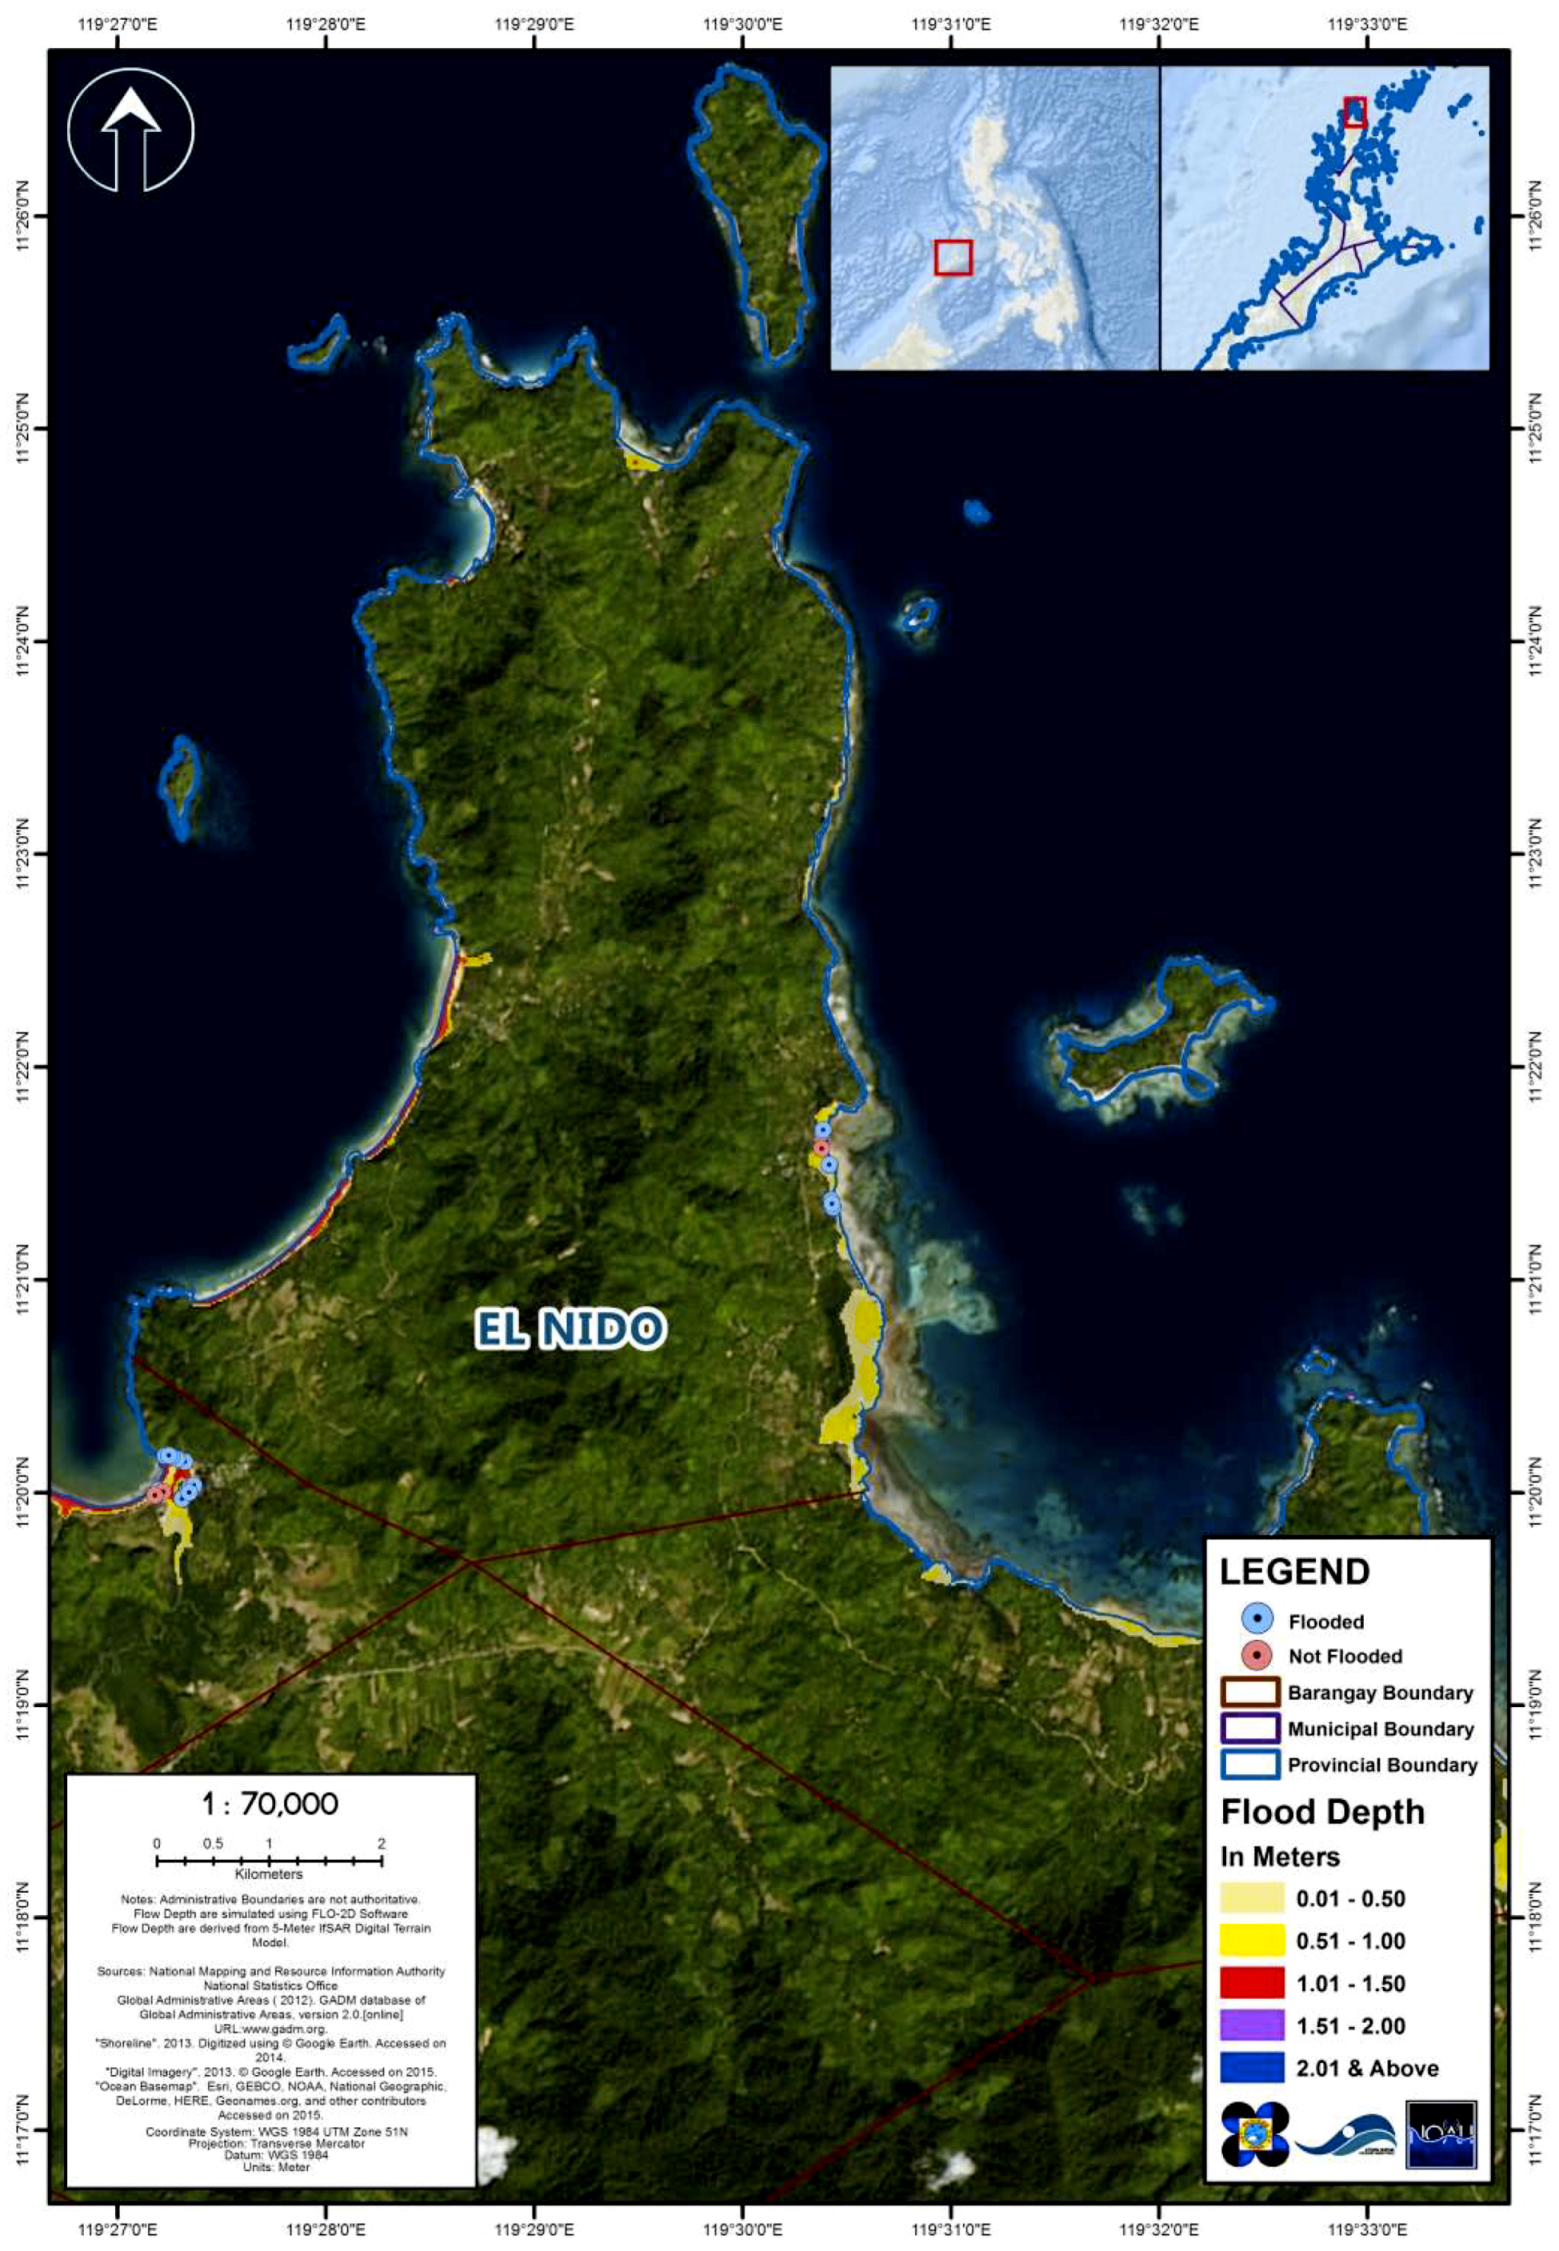
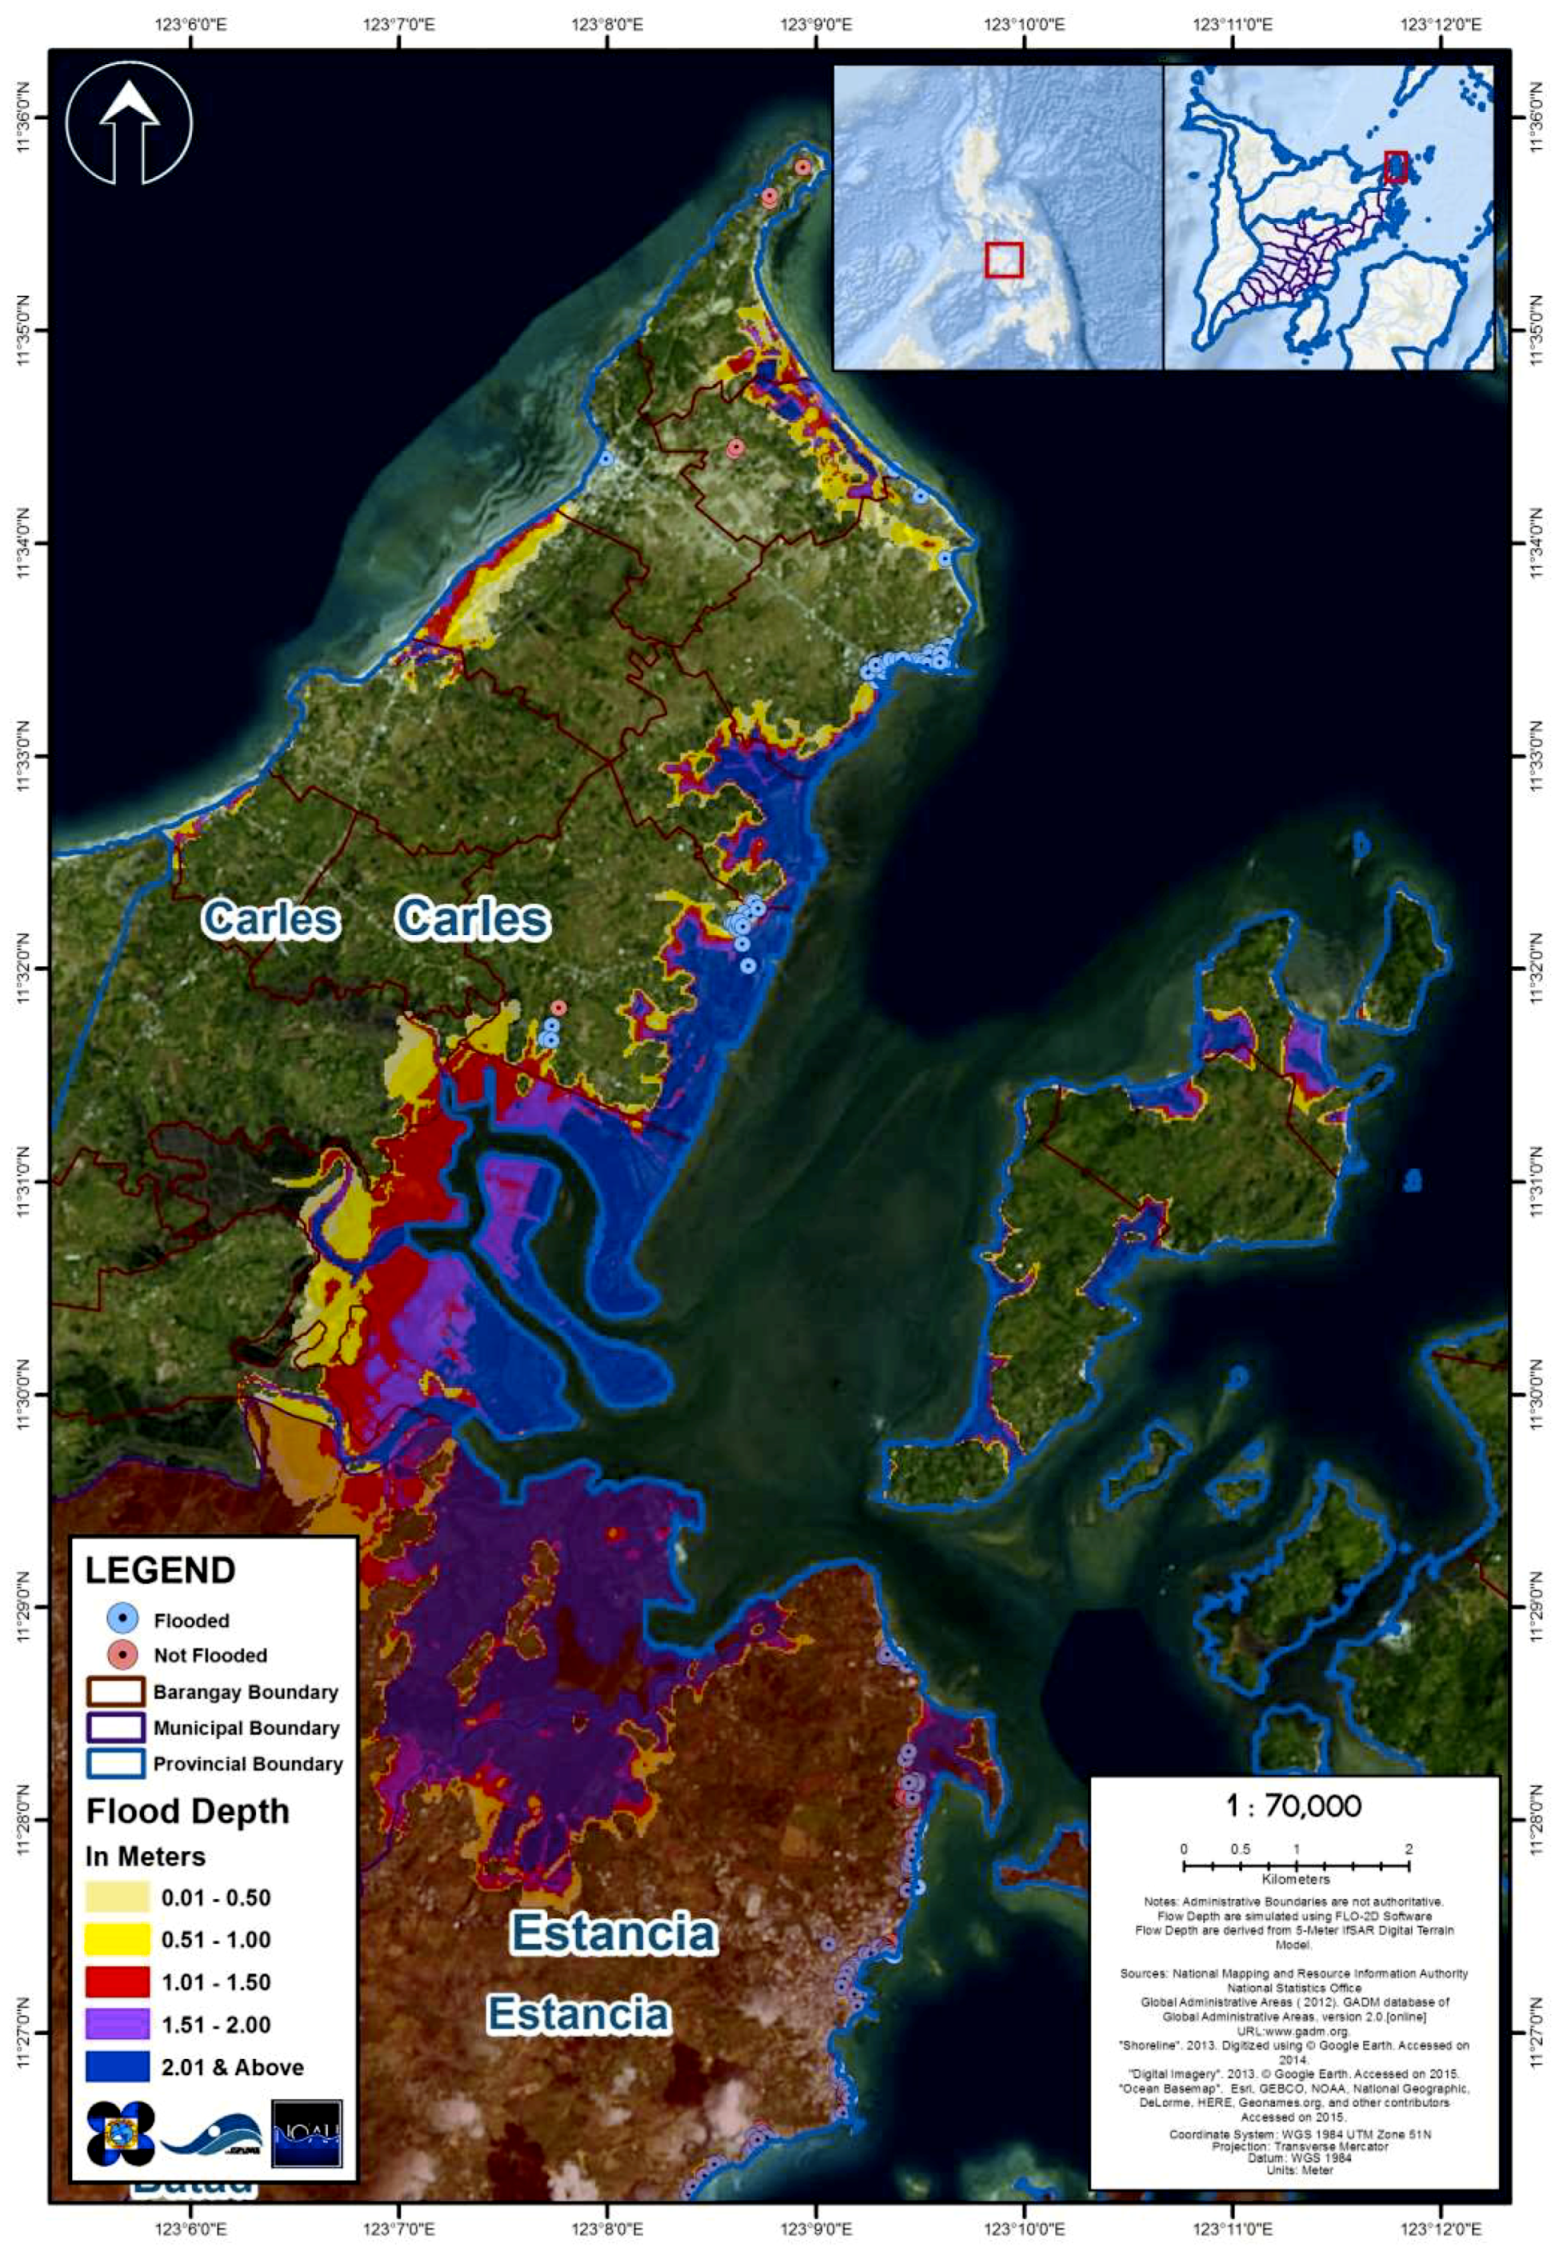
- Flow depth analysis in terms of elevation indicated that deeper flooding events were experienced in areas with lower ground elevations (estuaries, low elevation sand lines), whereas coastal areas with higher elevations were not inundated even when the area was directly located on the coast.
- Flow velocity analysis in terms of elevation indicated that the maximum velocity increased in the center of catchments with higher elevation and equal distance from storm surge inflows; floods flowed faster in areas that would drive the fluid to compress.
- Flow depth analysis in terms of coastal shape indicated that some areas are flooded more than others, even with the same elevation, due to differences in coastal shape. This is due to the fact that fluid is more likely to be dispersed when hitting a convex coast, whereas fluid hitting a concave coast is likely to accumulate in the center, leading to a greater extent of flooding.
- Flow velocity analysis in terms of coastal shape revealed that in some regions with same level of elevation, flood velocity appeared to be faster in the central areas of catchment that had inflow parameters in all directions.
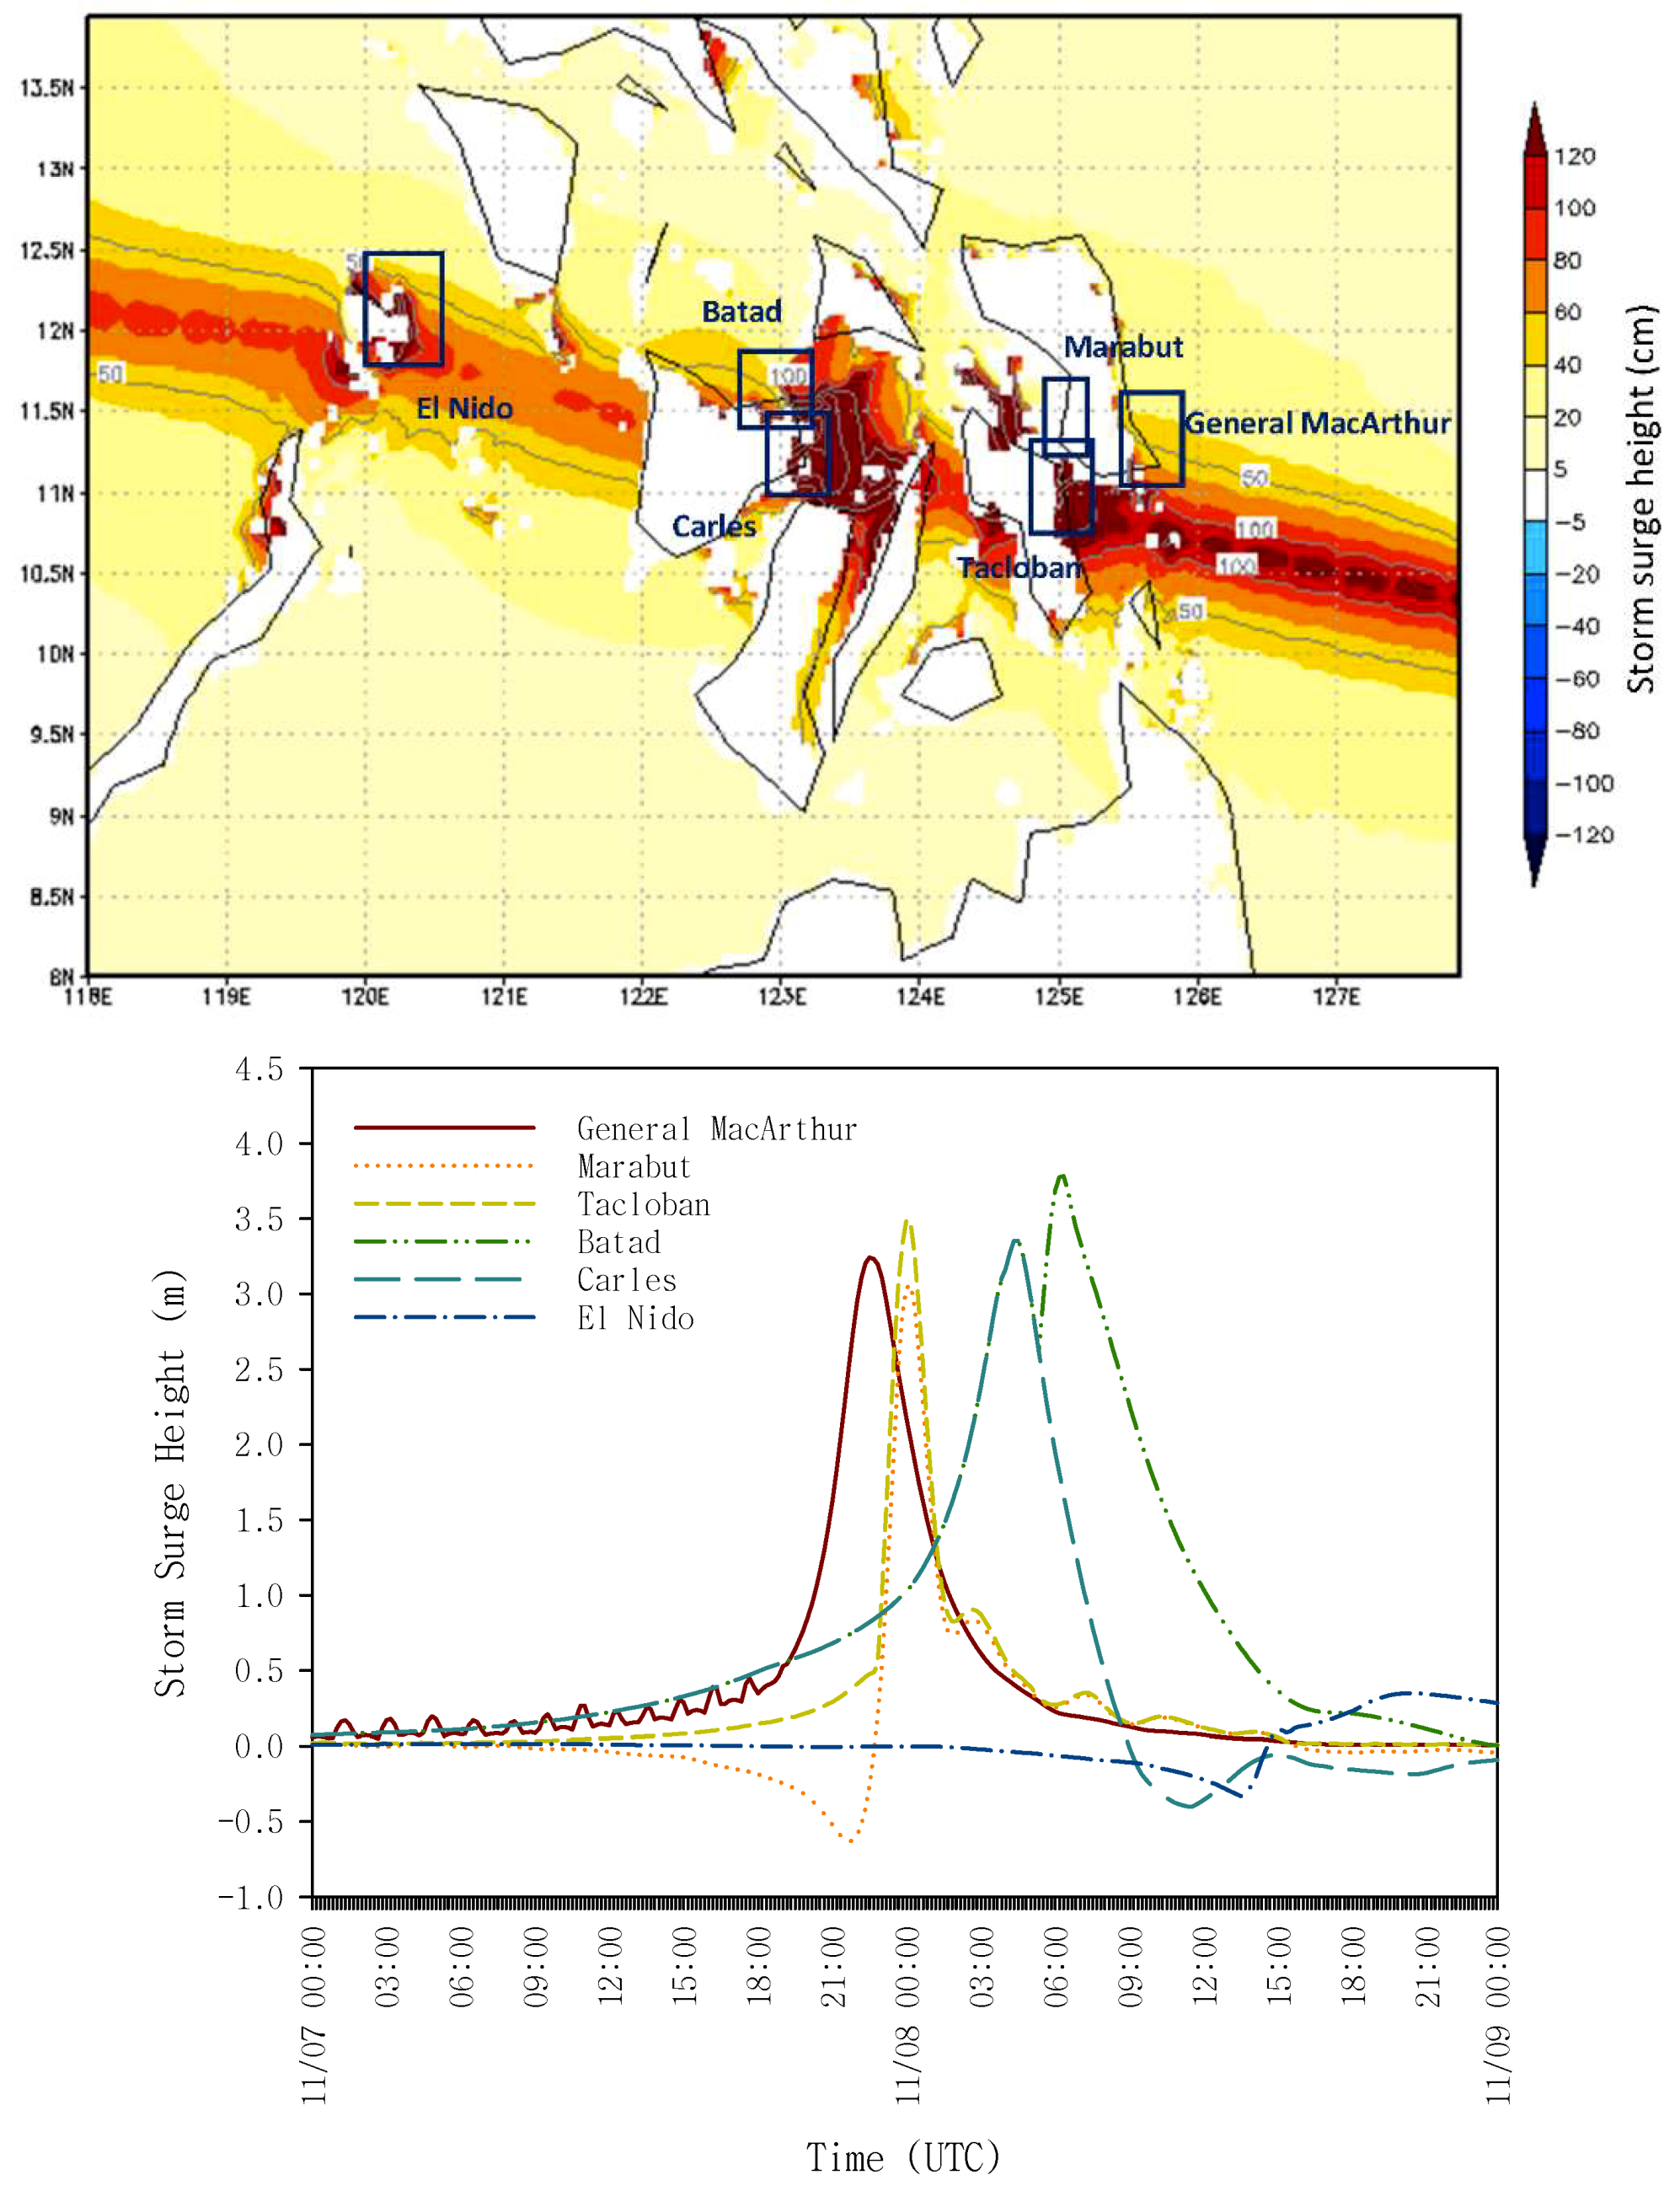
- Flow depth analysis in terms of a typhoon’s angle of approach indicated that extents are farther in the areas that are directly hit by the typhoon; coastlines that are perpendicular to the to the typhoon’s directional approach displayed a greater tendency to produce storm surges to a greater extent than those that are parallel to the coast.
Author Contributions
Acknowledgments
Conflicts of Interest
References
- National Disaster Risk Reduction and Management Council. NDRRMC Update: Final Report re Effects of Typhoon “Yolanda” (Haiyan). 2014. Available online: http://www.ndrrmc.gov.ph/attachments/article/1329/FINAL_REPORT_re_Effects_of_Typhoon_YOLANDA_HAIYAN_06-09NOV2013.pdf (accessed on 18 October 2018).
- Lagmay, A.; Agaton, R.; Bahala, M.; Briones, J.; Cabacaba, K.; Caro, C.; Dasallas, L.; Gonzalo, L.; Ladiero, C.; Lapidez, J.; et al. Devastating storm surge of Typhoon Haiyan. Int. J. Dis. Risk Reduct. 2015, 11, 1–12. [Google Scholar] [CrossRef]
- Mercado, A. On the Use of NOAA’s Storm Surge Model, SLOSH, in Managing Coastal Hazards—The Experience in Puerto Rico. Nat. Hazards 1994, 10, 235–246. [Google Scholar] [CrossRef]
- Li, J.; Nie, B. Storm surge prediction: Present status and future challenges. Procedia IUTAM 2017, 25, 3–9. [Google Scholar] [CrossRef]
- Elsaesser, B.; Bell, A.; Shannon, N.; Robinson, C. Storm surge hind- and forecasting using Mike21FM—Simulation of surges around the Irish Coast. In Proceedings of the DHI International User Conference, Copenhagen, Denmark, 6–8 September 2010. [Google Scholar]
- Veeramony, J.; Condon, A.; Linzell, R.; Watson, K. Validation of Delft3D as a Coastal Surge and Inundation Prediction System; Naval Research Laboratory Stennis Space Center: Hancock County, MA, USA, 2016. [Google Scholar]
- Higaki, M.; Hayashibara, H.; Nozaki, F. Outline of the Storm Surge Prediction Model at the Japan Meteorological Agency. RSMC Tokyo-Typhoon Cent. Tech. Rev. 2009, 11, 25–38. [Google Scholar]
- Nakamura, R.; Shibayama, T. Ensemble forecast of extreme storm surge: A case study of 2013 Typhoon Haiyan. Coast. Eng. Proc. 2017, 1, 10. [Google Scholar] [CrossRef]
- Lee, H.; Lim, K. Storm surge and storm waves modeling due to Typhoon Haiyan in November 2013 with improved dynamic meteorological conditions. Procedia Eng. 2015, 116, 699–706. [Google Scholar] [CrossRef]
- May, S.; Engel, M.; Brill, D.; Cuadra, C.; Lagmay, A.; Santiago, J.; Suarez, J.; Reyes, M.; Brucker, H. Block and boulder transport in Eastern Samar (Philippines) during Supertyphoon Haiyan. Earth Surf. Dyn. Discuss. 2015, 3, 739–771. [Google Scholar] [CrossRef]
- Soria, J.; Switzer, A.; Pilarczyk, J.; Siringan, F.; Khan, N.; Fritz, H. Typhoon Haiyan overwash sediments from Leyte Gulf coastlines show local spatial variations with hybrid storm and tsunami signatures. Sediment. Geol. 2017, 358, 121–138. [Google Scholar] [CrossRef]
- Kim, K. Typhoon storm surge simulation for Typhoon Haiyan. J. Int. Dev. Coop. 2015, 21, 17–25. [Google Scholar]
- Soria, J.; Switzer, A.; Villanoy, C.; Fritz, H.; Bilgera, P.; Cabrera, O.; Siringan, F.; Yacat-Sta. Maria, Y.; Ramos, R.; Fernandez, I. Repeat storm surge disasters of Typhoon Haiyan and its 1897 predecessor in the Philippines. Am. Meteorol. Soc. 2016, 97, 31–48. [Google Scholar] [CrossRef]
- Takagi, H.; Mikami, T.; Esteban, M.; Matsumaru, R. Track Analysis, Simulation and Field Survey of the 2013 Typhoon Haiyan. J. Flood Risk Manag. 2014, 10, 42–52. [Google Scholar] [CrossRef]
- Mori, N.; Kato, M.; Kim, S.; Mase, H.; Shibutani, Y.; Takemi, T.; Tsuboki, K.; Yasuda, T. Local amplification of storm surge by Super Typhoon Haiyan in Leyte Gulf. Geophys. Res. Lett. 2014, 41, 5106–5113. [Google Scholar] [CrossRef] [PubMed]
- Bricker, J.; Takagi, H.; Mas, E.; Kure, S.; Adriano, B.; Yi, C.; Roeber, V. Spatial variation of damage due to storm surge and waves during Typhoon Haiyan in the Philippines. J. Jpn. Soc. Civil Eng. 2014, 70, 231–235. [Google Scholar] [CrossRef]
- Japan Meteorological Agency. RSMC Best Track Data. 2013. Available online: http://www.jma.go.jp/jma/jma-eng/jma-center/rsmc-hp-pub-eg/Besttracks/bst2015.txt (accessed on 2 June 2016).
- Smith, S.D.; Banke, E.G. Variation of the sea surface drag coefficient with wind speed. Quart. J. R. Meteorol. Soc. 1975, 101, 665–673. [Google Scholar] [CrossRef]
- Frank, W.M. Composite analysis of the core of a mature hurricane. Mon. Weather Rev. 1984, 112, 2401–2420. [Google Scholar] [CrossRef]
- Hasegawa, H.; Kohno, N.; Hayashibara, H. JMA’s Storm Surge Prediction for the WMO Storm Surge Watch Scheme (SSWS). RSMC Tokyo-Typhoon Cent. Tech. Rev. 2012, 14, 12. [Google Scholar]
- FLO-2D Software, Inc. FLO-2D Reference Manual 2009 | Flood | Fluid Dynamics; FLO-2D Software, Inc.: Nutrioso, AZ, USA, 2017. [Google Scholar]
- Lapidez, J.P.; Tablazon, J.; Dasallas, L.; Gonzalo, L.A.; Cabacaba, K.M.; Ramos, M.M.A.; Suarez, J.K.; Santiago, J.; Lagmay, A.M.F.; Malano, V. Identification of storm surge vulnerable areas in the Philippines through the simulation of Typhoon-induced storm surge levels over historical storm tracks. Nat. Hazards Earth Syst. Sci. 2015, 3, 919–939. [Google Scholar] [CrossRef]
- National Hurricane Center. Storm Surge Overview. 2016. Available online: http://www.nhc.noaa.gov/surge/surge_intro.pdf (accessed on 15 July 2016).
- Drews, C. Directional Storm Surge in Enclosed Seas: The Red Sea, the Adriatic, and Venice. J. Mar. Sci. Eng. 2015, 3, 356–367. [Google Scholar] [CrossRef]
- Drews, C.; Galarneau, T. Directional Analysis of the Storm Surge from Hurricane Sandy 2012, with Application to Charleston, New Orleans, and the Philippines. PLoS ONE 2015, 10, e0122113. [Google Scholar] [CrossRef] [PubMed]


© 2019 by the authors. Licensee MDPI, Basel, Switzerland. This article is an open access article distributed under the terms and conditions of the Creative Commons Attribution (CC BY) license (http://creativecommons.org/licenses/by/4.0/).
Share and Cite
Dasallas, L.; Lee, S. Topographical Analysis of the 2013 Typhoon Haiyan Storm Surge Flooding by Combining the JMA Storm Surge Model and the FLO-2D Flood Inundation Model. Water 2019, 11, 144. https://doi.org/10.3390/w11010144
Dasallas L, Lee S. Topographical Analysis of the 2013 Typhoon Haiyan Storm Surge Flooding by Combining the JMA Storm Surge Model and the FLO-2D Flood Inundation Model. Water. 2019; 11(1):144. https://doi.org/10.3390/w11010144
Chicago/Turabian StyleDasallas, Lea, and Seungsoo Lee. 2019. "Topographical Analysis of the 2013 Typhoon Haiyan Storm Surge Flooding by Combining the JMA Storm Surge Model and the FLO-2D Flood Inundation Model" Water 11, no. 1: 144. https://doi.org/10.3390/w11010144
APA StyleDasallas, L., & Lee, S. (2019). Topographical Analysis of the 2013 Typhoon Haiyan Storm Surge Flooding by Combining the JMA Storm Surge Model and the FLO-2D Flood Inundation Model. Water, 11(1), 144. https://doi.org/10.3390/w11010144