Article

Diurnal and Semidiurnal Cyclicity of Radon (222Rn) in Groundwater, Giardino Spring, Central Apennines, Italy

1
Dipartimento di Scienze della Terra, Sapienza Università di Roma, P.le Aldo Moro 5, 00185 Roma, Italy
2
Consiglio Nazionale delle Ricerche, IGAG, c.o. Dipartimento di Scienze della Terra, Sapienza Università di Roma, P.le Aldo Moro 5, 00185 Roma, Italy
3
Istituto Nazionale di Geofisica e Vulcanologia, sede di Roma, Via di Vigna Murata 605, 00143 Roma, Italy
4
Dipartimento di Ingegneria e Geologia, Università G. d’Annunzio Chieti-Pescara, 66100 Chieti, Italy
*
Author to whom correspondence should be addressed.
Water 2018, 10(9), 1276; https://doi.org/10.3390/w10091276
Submission received: 30 July 2018 / Revised: 4 September 2018 / Accepted: 13 September 2018 / Published: 18 September 2018
(This article belongs to the Special Issue Isotopes in Hydrology and Hydrogeology)

Abstract

:
Understanding natural variations of Rn (222Rn) concentrations is the fundamental prerequisite of using this radioactive gas as a tracer, or even precursor, of natural processes, including earthquakes. In this work, Rn concentrations in groundwater were continuously measured over a seven-month period, during 2017, in the Giardino Spring, Italy, together with groundwater levels in a nearby well installed into a fractured regional aquifer. Data were processed to reduce noise, and then analyzed to produce the Fourier spectra of Rn concentrations and groundwater levels. These spectra were compared with the spectrum of tidal forces. Results showed that diurnal and semidiurnal cycles of Rn concentrations, and filtered oscillations of groundwater levels, in the nearby well, are correlated with solar and luni-solar components of tidal forces, and suggested no correlation with the principal lunar components. Therefore, influencing factors linked to solar cycles, such as daily oscillations of temperature and atmospheric pressure, and related rock deformations, may have played a role in Rn concentrations and groundwater levels. An open question remains regarding the correlation, which is documented elsewhere, of Rn concentrations and groundwater levels with the lunar components of the solid Earth tides.

1. Introduction

Radon (222Rn) is an endogenous natural radioactive noble gas, and is a product of the decay chain of Uranium (238U). 222Rn (half-life of 3.82 days) is the most commonly occurring radon isotope in nature, produced by α-decay from Radium (226Ra), it is soluble in water, and its behavior and concentration in groundwater is strongly influenced by the geological nature of substratum, and by the occurrence of Rn parent elements [1,2]. Moreover, the concentration of Rn in soil depends on chemical, physical, and geological factors, such as geochemical mobility of Rn precursors, grain size, distribution of sediments, porosity, permeability, and seasonal variations, including temperature and atmospheric pressure [3,4,5]. In particular, the migration of Rn is driven by rock permeability, that increases with the presence of fractures, structural discontinuities, and karst cavities [6]. The most important processes for Rn transport in groundwater are diffusion and convection. Also, the presence of microbubbles in groundwater can favor Rn migration [7]. Radon is a heavy element and preferentially moves upward by way of a fluid carrier. Moreover, when a nucleus of 226Ra decays, the nucleus of neoformed 222Rn undergoes the so-called alpha-recoil effect, and is pushed in the opposite direction to that of the particle α (equivalent to a nucleus of 4He), with an energy equal to 85 keV. This energy is sufficient for the Radon nucleus to move distances between 20 and 70 nm in rock, about 100 nm in water, and about 6300 nm in air [8]. According to the model proposed in [6] only a fraction of the gas produced inside the solid matrix can abandon the rock. The radio nuclei must decay at a certain distance from the surface of the rock particles, so as to undergo convective transport by the fluids (gas or water) that permeate the rock.
Several previous studies focused on Rn flow from the subsoil to surface, and on its use as a hydrogeochemical tracer, thus finding various applications in different fields of the geosciences, particularly as a potential precursor of seismic events [9,10,11,12,13], or as a by-product of earthquakes [14]. Radon is also commonly used as a tracer of submarine groundwater discharge [15,16]. In addition, attention has been focused on the influence of solid Earth tides on Rn concentrations. These long-wave crustal deformations may cause significant responses in the emanation of subsoil gases, due to changes in permeability or in rock media, following the contraction and decompaction cycle of rock material during tidal waves. Hence, solid Earth tides may be responsible for the periodic liberation of Rn, principally via the movement of groundwater in response to the opposing effects of aquifer compression and dilation during tidal crustal displacements [17]. Solid Earth tides have vertical and horizontal components. They uplift the ground up to 30–40 cm, and swing it horizontally up to 10–20 cm, at the passage of the waves [18]. Therefore, particularly due to the horizontal component, the crust is daily undergoing contractional and dilational cycles during the tide travel, determining expulsion and recall of fluids, respectively. The observation of Earth tide cycles on Rn time series are rarely evidenced by experimental data, and are restricted to very particular natural environments. Data acquired in a gypsum mine near Walferdange (Luxembourg) [19], and in a subglacial laboratory in the French Alps [20], both show evidences of gravitational Earth tide signatures in airborne Rn concentrations.
Diurnal and subdiurnal cycles of Rn time series have been observed in different monitoring sites [4,21,22,23]. Although predictive models, based on gas transport in soils, have been formerly proposed, a definitive driving mechanism for the high frequency Rn variations has not yet been identified [24,25]. Moreover, surprisingly, daily and sub-daily signals have also been measured in confined Rn systems [26,27].
To measure possible cyclic and noncyclic variations of Rn content in groundwater, and to infer the related causes, since April 2017, we installed and operated a Rn probe in the Giardino Spring (Central Apennines, Italy, Figure 1a). The area is strongly hazardous, from a seismic point of view [28], and is presently characterized by a GPS-measured low-strain rate. This latter characterisation has been interpreted as a potential indicator of future and large earthquakes [29]. Furthermore, hydrogeological and hydrogeochemical monitoring stations operate in the area to study the relationship between seismicity and hydrogeology [30,31].
In this study, we used Rn and groundwater table data from the Sulmona plain (i.e., the Giardino Spring for Rn monitoring and the PF 60.3 well for hydrogeological monitoring; see Figure 1a) to examine their cyclic and noncyclic variations. Determining the complete set of possible natural variations of Rn in groundwater is the fundamental prerequisite of using Rn as a tracer, or even precursor, of natural processes, including the seismic cycle and strong earthquakes [32,33,34,35]. Indeed, as the study area is strongly seismic [28], we have installed a Rn monitoring station in the attempt of identifying the long-term behavior of Rn in relation to the seismic cycle.

2. Geological and Hydrogeological Settings

The Central Apennines fold-thrust belt (Figure 1a) was formed during Oligocene-Quaternary times, with a main eastward vergence and a classical foreland-ward propagation of thrust sheets, followed by the Tyrrhenian back-arc extension [38,39,40,41]. Since at least Oligocene times, the central Apennines has migrated eastward, relative to the European plate, due to the slab retreat of the westerly-directed subduction of the Adriatic plate. This geodynamic setting generated a tectonic wave, with a growing accretionary wedge, on the slab hinge, and the contemporaneous extension to the west along the Apennines belt. At present, the extensional regime is particularly seismogenic along the axis of the central Apennines, while the compressional regime is active along the eastern margin of the Apennines and the Western Adriatic Sea. The current rates of extension measured by the GPS network is within 3–4 mm/y [42].
Therefore, due to extensional tectonics, the accretionary prism has been progressively dissected and down-faulted by a system of NW-striking extensional faults (Figure 1a), that bind several intra-mountain basins, which are mostly filled by Pliocene-Quaternary continental deposits [43]. One of these active extensional structures is the Mt. Morrone Fault, striking NW-SE by approximately 25 km and dipping toward SW by about 50–60° (Figure 1a). This fault is considered responsible for historical and pre-historical earthquakes up to Mw 6.5 or stronger. Its last activation likely occurred during the 2nd century AD [44,45,46,47].
The central Apennines belt is characterized by large fractured aquifers, hosted by thick Meso-Cenozoic carbonate sequences. The aquifers are often compartmentalized and sealed by clay-rich, low-permeability layers (aquicludes), such as foredeep siliciclastic marine deposits [48,49]. The study area is located between the Gran Sasso range and the Mt. Morrone carbonate aquifers. Regional groundwater flow paths converge to feed a few base-flow springs in the Sulmona plain. The Mt. Morrone carbonate aquifer is confined by low permeability layers: (1) The thrust zone between the Gran Sasso carbonate unit (top) and the Mt. Morrone carbonate unit (bottom), in the northern sector; (2) the thrust zone between the Mt. Morrone unit (top) and the Laga siliciclastic unit (bottom), in the eastern sector [50]; and (3) the Mt. Morrone active extensional fault, in the western sector, isolating the carbonate deep aquifer from local shallow aquifers in the Sulmona plain [51,52]. The Giardino Spring (Figure 1a) is a main discharge conduit of the regional Mt. Morrone aquifer. In detail, this spring is located in the north-western portion of the aquifer, at the intersection with the Mt. Morrone normal fault. The spring is characterized by steady flow and chemical regimes, and a high discharge rate of approximately 1 m3/s [30,31,53]. Its waters are predominantly taken (passively) for drinking purposes by Azienda Comprensoriale Acquedottistica S.p.A. (ACA Pescara).
The PF 60.3 hydrogeological monitoring station consists of a 100 m deep well, into which we installed a multiparametric probe (OTT ecoLog800). The well is instated, presumably, in the same regional aquifer that feeds the Giardino Spring (Mt. Morrone aquifer, [53]). No active abstractions influencing the groundwater level and spring discharge are ongoing in this aquifer, as documented by previous [53] and present (this work) monitoring. Moreover, previous monitoring [53] showed that precipitations have negligible effects on the groundwater level and spring discharge.

3. Materials and Methods

We performed continuous monitoring of Rn gas in groundwater levels from April 2017 to October 2017. In particular, we measured 222Rn water concentrations using an AlphaGUARD (Model PQ2000PRO; see Figure 1b) probe, with high storage capacity, integrated with a RAM 7 module for stripping gas from the water. Through a low-flow pump, the gas was subsequently sent to the detector for measurements. Thanks to additional sensors, in addition to Rn water concentrations, the device simultaneously measured ambient temperature, relative humidity, and atmospheric pressure.
The AlphaGUARD detector consists of a pulse ionization chamber associated with an alpha spectrometer that identifies the specific pulses caused by Rn. The probe ensures a fast and precise response to different concentrations, and maintenance-free operations because of long-term, stable calibration (sensitivity 1 CPM at 20 Bq/m³; error 3%). The probe is suitable for continuous monitoring of Rn concentrations between 2 and 2,000,000 Bq/m³ [54]. Measurements were automatically repeated and stored every ten minutes.
We measured the groundwater levels in the PF 60.3 well using the OTT ecoLog 800 multiparametric probe (Figure 1c), aided by an automatic system for continuous acquisition and remote data transmission, including groundwater level, temperature, and electrical conductivity (groundwater level: resolution 0.001 m, error ±0.05%; temperature: resolution 0.001 °C, error 0.1 °C; electrical conductivity: resolution 0.001 mS/cm, error ±0.5%). The frequency of data measurements were every five minutes. The barometric pressure of groundwater level measurements were automatically compensated for.
As the monitoring stations are within a continental mountain range (Central Apennines, Figure 1a), we also considered solid Earth tides. In particular, for the same period of the Rn and hydrogeological time series, we calculated the solid Earth tides of the study area using the CalSky—Solid Earth Tides free resource [55].

4. Results

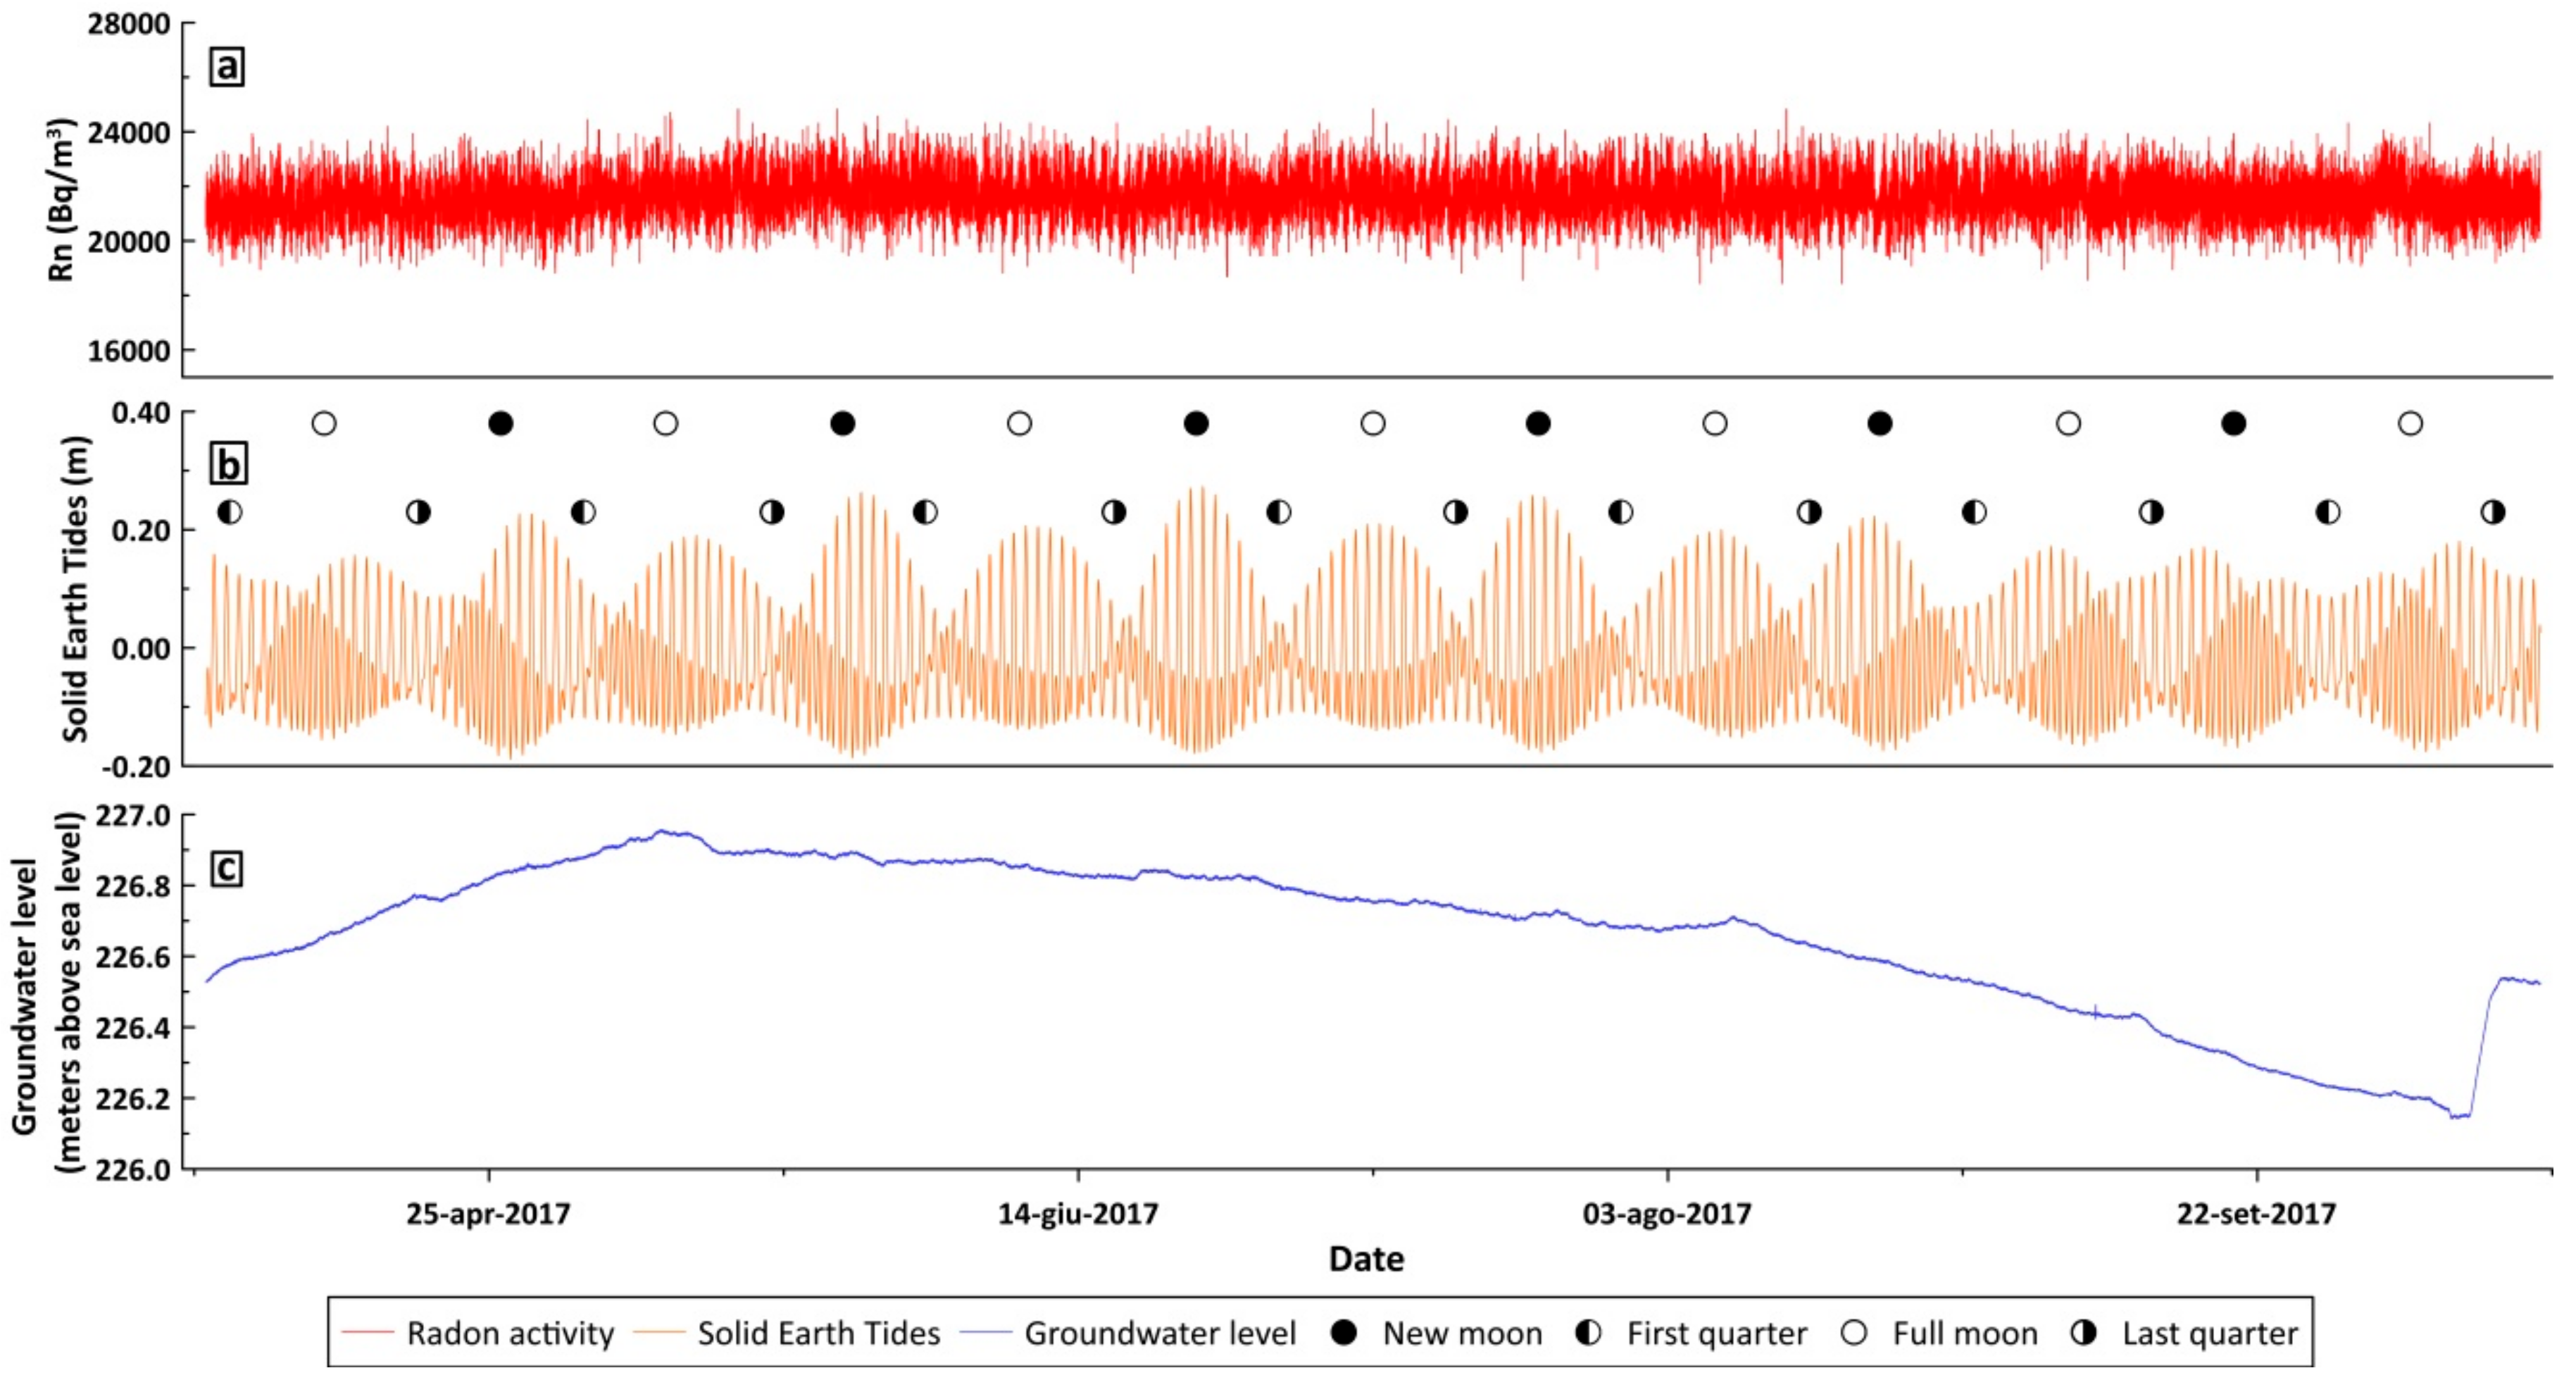
The Rn concentrations in groundwater recorded in the Giardino Spring are shown in Figure 2a, together with contemporaneous solid Earth tides (Figure 2b) and groundwater level variations (Figure 2c; see all data in Supplementary Materials). The Rn time series (Figure 2a) presents a regular and steady trend, with an average value of 21606 Bq/m3 and an average standard deviation of 835 Bq/m3. The time series of solid Earth tides (Figure 2b) shows evident periodic variations in the amplitude coinciding with different moon phases [56]. The groundwater levels are characterized by a typical seasonal variation of about 80 cm (i.e., change between minimum and maximum values), which is a very limited oscillation, that is in agreement with the role of the base-flow discharge in the area.

5. Data Processing and Discussion

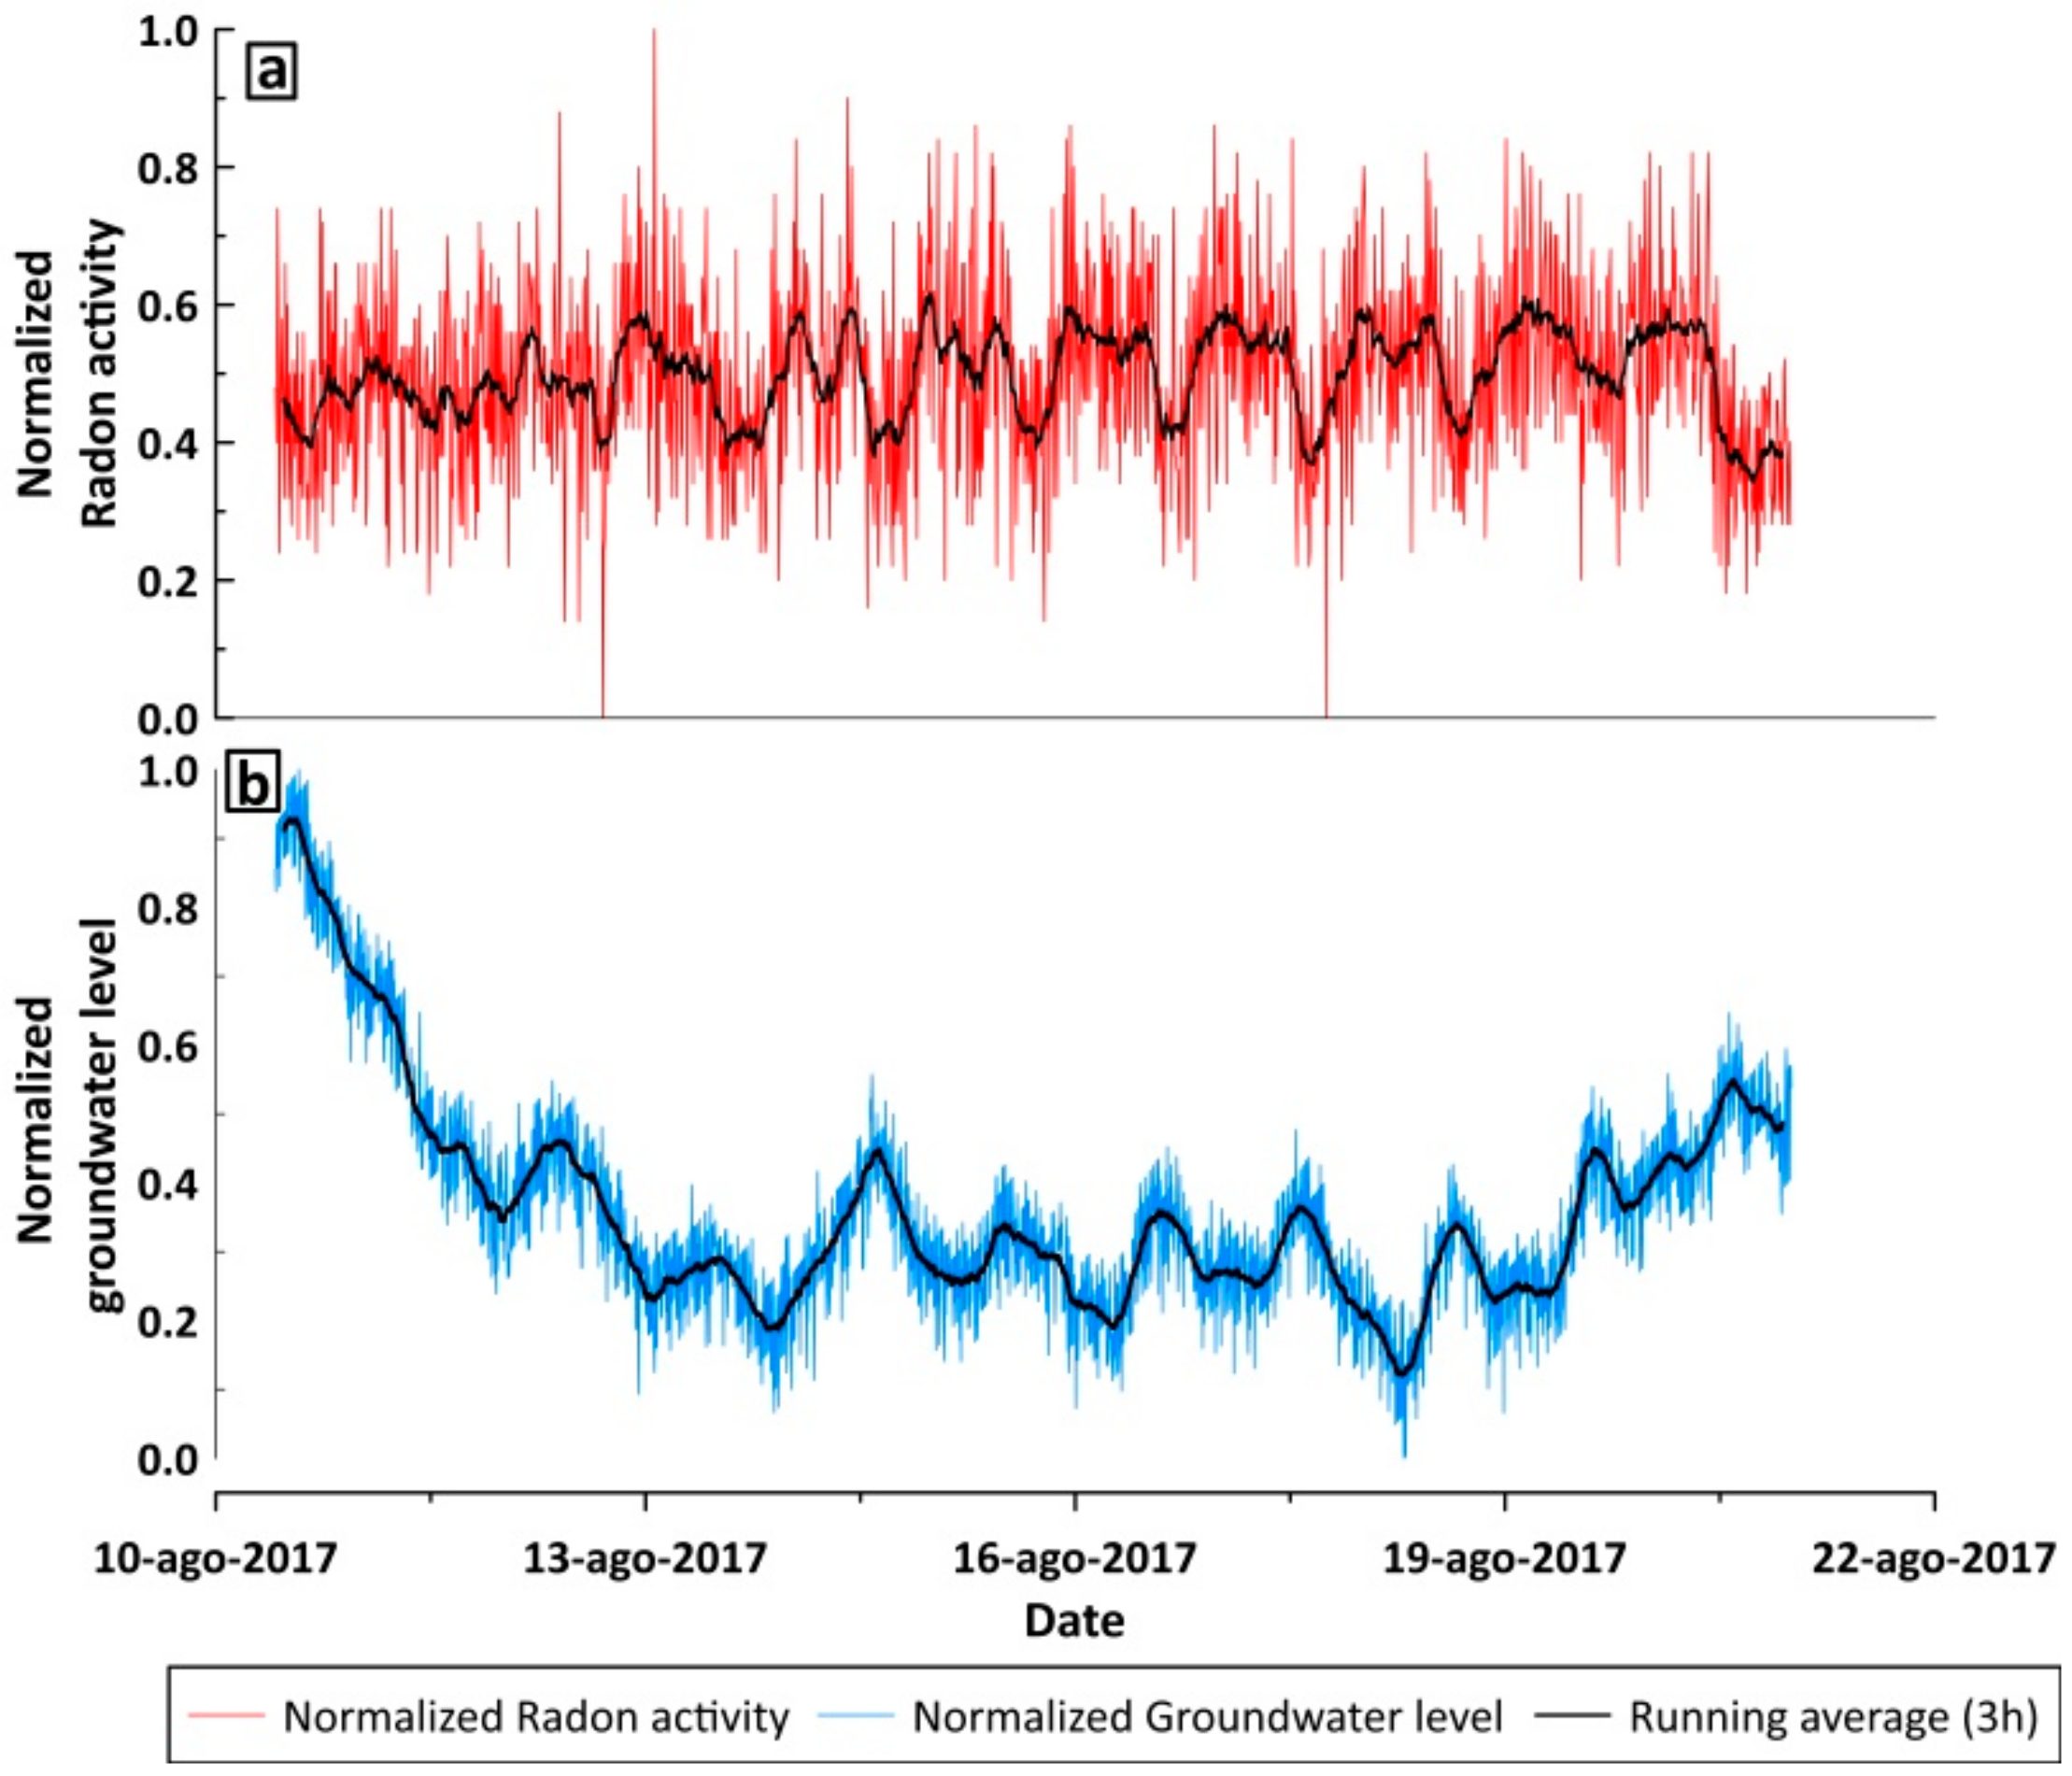
With the aim of reducing the high frequency noise in the recorded Rn and groundwater, we filtered the time series using a moving average with a three-hour sliding window (see all data in Supplementary Materials). Figure 3 shows two subsamples of averaged data, in which periodic fluctuations can be observed.
To verify the relationship between our time series (Rn and groundwater levels), with respect to solid Earth tides, we carried out a spectral and coherence analysis, evaluating the correlation in the frequency space. In particular, we processed the recorded time series using a filter that provided the normalization of both signals, and filtered the high frequency noise using moving averages.
To make an effective comparison between time series of quantities of different natures, it is convenient to normalize the data to make them dimensionless. The normalization of a series Y(t) is usually made by defining the following equation:
Ynorm (t) = (Y(t) − Ymin)/(Ymax − Ymin)
where Ymax and Ymin are, respectively, the maximum and minimum values assumed by Y(t) in the considered time interval. Therefore, the quantities in Figure 3 are dimensionless and easily usable for a correlation analysis.
We obtained the coherence analysis using the ‘mscohere’ function (in MatlabR2017b; [57]) that computes a correlation estimate between 0 and 1, as a function of the signal frequencies. Coherence values are approximately 0.75 and 0.89 for the diurnal fluctuations, and 0.79 and 0.94 for the semidiurnal fluctuations, for the Rn groundwater concentrations and groundwater levels, respectively. The coherence analysis (Supplementary Materials) shows the highest coefficient values in the diurnal periodicity (24 h: one cycle per day) and in the semidiurnal periodicity (12 h: two cycles per day), for both analyzed parameters.
Generally, tidal signals consist of different ‘harmonics’, meaning a sum of periodic sinusoidal functions [58]. Principal periodic components of solid Earth tides represent the complex gravitational interaction between the Earth, Moon, and Sun. These components are characterized by different amplitudes and frequencies [59]. The necessary condition for establishing a correlation between solid Earth tides and other temporal series (e.g., Figure 2), is that the spectra of these temporal series coincide entirely with the spectrum of solid Earth tides [60], or at least that the major characteristic “lunar” components are observed (e.g., O1 and M2 components). To estimate the spectral content of our data (Supplementary Materials), and because the observations were not rigorously evenly sampled, we used the appropriate ‘plomb’ function (MatlabR2017b) based on the Lomb-Scargle algorithms [61,62].
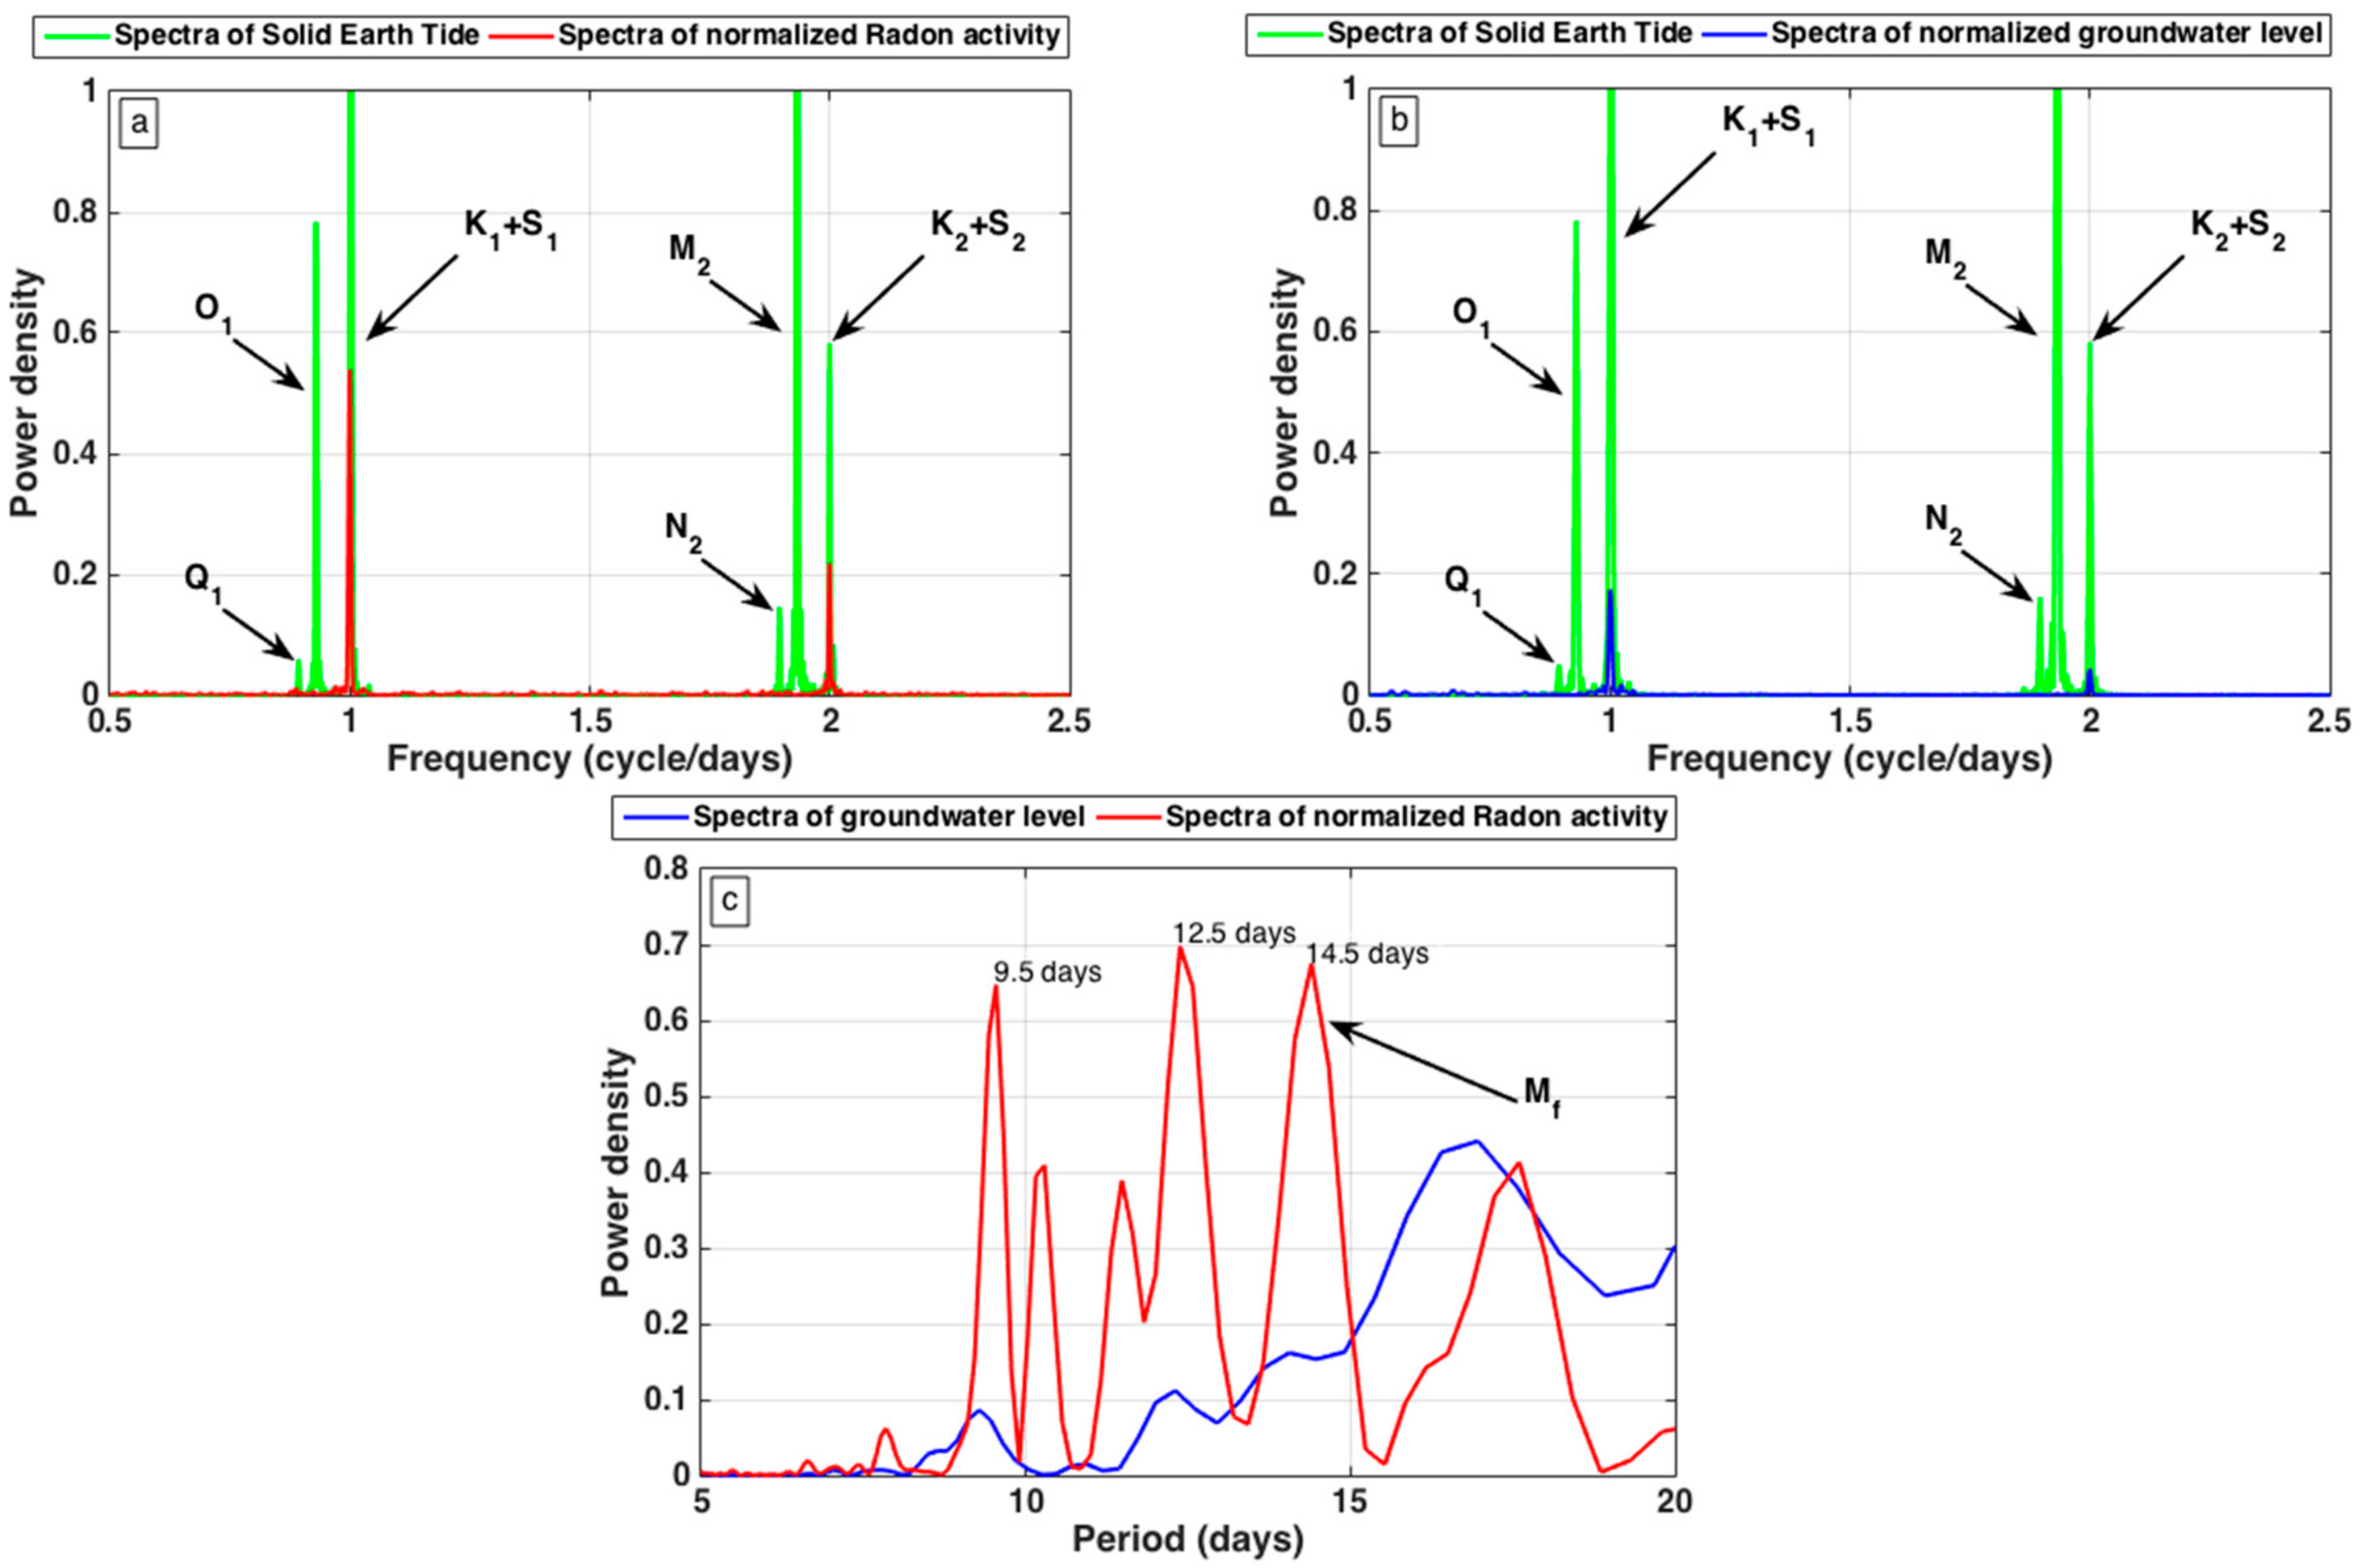
The data analysis indicates a coincidence of diurnal and semi-diurnal periodicities, of Rn groundwater concentrations, groundwater levels, and tidal forces, reflecting the principal solar peaks S2 and S1, at 12 h, 24 h and 4 min, respectively (Figure 4a,b). Due to the limited data sampling period, the luni-solar semidiurnal component K2, and the luni-solar diurnal component K1, are not separable from the main solar tides (S1 and S2). To properly separate these components, we would need at least a few years of continuous observations. Hence, the 12 h and 24 h peaks should be considered as the sum of tidal harmonics (possibly lunar and solar), with approximate periods of 12 h ± 4 min and 24 h ± 8 min, respectively. The spectra of the Rn groundwater concentrations and groundwater levels miss the O1, M2, Q1, and N2 principal Fourier components of the solid Earth tide spectrum (Figure 4a,b). O1, M2, Q1, and N2 are the principal lunar diurnal, principal lunar semidiurnal, larger lunar elliptic diurnal, and large lunar elliptic semidiurnal components, respectively [63]. These components should have been figured out over our data span.
The long-term Fourier spectrum of the time series of both Rn groundwater concentrations and groundwater levels are shown in Figure 4c. This spectrum reveals an identifiable component at 14.5 days for Rn concentrations. This component is close to the half lunar month (lunar fortnightly Mf 13.7 days), but it is not significantly different because of the limited period of time of our observations. However, the Mf component is not evident in groundwater levels time series. In synthesis, our recorded data does not show a clear correlation with solid Earth tides (i.e., the principal lunar components are missing or are hidden below the noise level, see Figure 4). In comparison, the diurnal and semidiurnal cyclicity of both Rn groundwater concentrations and groundwater levels are clearly correlated with the mean solar day, at diurnal (S1) and semidiurnal (S2) periods (Figure 4a,b). It is noteworthy that a similar cyclicity of Rn concentrations were measured in the Sopronbánfalva Geodynamic Observatory, Hungary [23]. In this latter study, Rn concentrations were measured in parallel with rock deformation, temperature, and barometric pressure. It was found that Rn concentration variations bore considerable similarity and relation to the solar S1 and S2 components, inducing rock deformation, temperature, and barometric variations, whereas the principal lunar semidiurnal M2 and diurnal O1 tidal waves did not correlate with Rn concentrations. In many further studies, environmental factors, such as atmospheric pressure, humidity, and temperature, have been proposed as the main factors influencing the periodicities observed in Rn time series [4,21,64,65]. Therefore, similarly to results obtained from the Sopronbánfalva Observatory, we infer that the lack of O1 and M2 constituents, in the Rn concentrations of the Giardino Spring, may confirm the fact that the detected S1 and S2 tidal components appear because of the daily variations of temperature and barometric pressure. It is also true; however, that though the Rn concentration and groundwater level changes are correlated (Figure 3), the measured groundwater level changes have compensated for the barometric pressure, by use of the probe. Hence, we infer that the detected S1 and S2 tidal components should be correlated with daily thermoelastic deformations or barometric pressures on rocks, rather than barometric cycles on fluid media [66,67].
An open question remains regarding the correlation between Rn concentrations and solid Earth tides (specifically the lunar components). This correlation has been suggested by many previous studies [19,20,24,68,69,70,71,72]. The lack of this correlation in our data is unexplained in this work and deserves future investigation.

6. Conclusions

Radon in groundwater from the Giardino Spring (Central Italy) and groundwater levels in the Sulmona plain (Central Apennines, Italy) show diurnal and semidiurnal cycles. The substantial absence of the principal lunar components, in the Rn groundwater concentration and groundwater level spectra, reveals no correlations with gravitational (lunar) components of the solid Earth tide spectrum. In contrast, the diurnal and semidiurnal cyclicity, of both Rn groundwater concentrations and groundwater levels, cannot exclude the effects of gravity on tides, indicating other environmental factors are prevailing. Therefore, influencing factors linked to solar cycles, such as daily cycles of temperature, pressure, and related rock deformation, may have played a role in the Rn groundwater concentrations and groundwater levels.
Determining the complete set of possible natural variations of Rn concentrations in groundwater is the fundamental prerequisite of using Rn as a tracer, or even precursor, of natural processes, including the seismic cycle and strong earthquakes [32]. For these reasons, the preliminary results presented in this work bear new insights into the study and understanding of Rn in nature. The next step is to establish a new integrated monitoring system that should measure—continuously and over large regions—gas activity, pore–pressure changes, and cyclical crustal deformation processes (e.g., Reference [67]). To this purpose, two other multiparametric stations are being installed in Central Apennines.

Supplementary Materials

The following are available online at https://www.mdpi.com/2073-4441/10/9/1276/s1, Tables.

Author Contributions

Conceptualization, M.B., A.B., C.D. and M.P.; Data curation, M.D.B. and F.G.; Formal analysis, F.G., R.D. and F.R.; Funding acquisition, M.P.; Investigation, S.R.; Methodology, M.D.B., F.G., R.D. and F.R.; Project administration, C.D. and M.P.; Resources, M.P. and S.R.; Software, R.D. and F.R.; Supervision, M.B., A.B., C.D. and M.P.; Validation, C.D. and M.P.; Writing—original draft, M.D.B. and F.G.; Writing—review & editing, A.B.; Geological and Hydrogeological framing M.D.B., F.G., M.B., A.B., M.P., S.R.

Funding

This research received no external funding.

Acknowledgments

We thank ACA Azienda Comprensoriale Acquedottistica for letting us install probes in the Giardino Spring. A. Lacchini and all the personnel from the Laboratorio di Idrogeologia Quantitativa (Sapienza University of Rome) are thanked for logistic and technical support. Two anonymous reviewers are warmly thanked for constructive comments.

Conflicts of Interest

The authors declare no conflict of interest.

References

  1. Sundal, A.V.; Henriksen, H.; Soldal, O.; Strand, T. The influence of geological factors on indoor Radon concentrations in Norway. Sci. Total Environ. 2004, 328, 41–53. [Google Scholar] [CrossRef] [PubMed]
  2. Fonollosa, E.; Peñalver, A.; Borrull, F.; Aguilar, C. Radon in spring waters in the south of Catalonia. J. Environ. Radioact. 2016, 151, 275–281. [Google Scholar] [CrossRef] [PubMed]
  3. King, P.T.; Michel, J.; Moore, W.S. Groundwater geochemistry of 228Ra, 226Ra, 222Rn. Geochim. Cosmochim. Acta 1982, 46, 1173–1182. [Google Scholar] [CrossRef]
  4. Pinault, J.L.; Baubron, J.C. Signal processing of diurnal and semidiurnal variations in Radon and atmospheric pressure: A new tool for accurate in situ measurement of soil gas velocity, pressure gradient, and tortuosity. J. Geophys. Res. 1997, 102, 18101–18120. [Google Scholar] [CrossRef]
  5. Morawska, L.; Phillips, C.R. Dependence of the radon emanation coefficient on radium distribution and internal structure of the material. Geochim. Cosmochim. Acta 1993, 57, 1783–1797. [Google Scholar] [CrossRef]
  6. Tanner, A.B. Radon migration in the ground: A supplementary review. Nat. Radiat. Environ. III 1980, 1, 5–56. [Google Scholar]
  7. Vàrhegyi, A.; Hakl, J.; Monnin, M.; Morin, J.P.; Seidel, J.L. Experimental study of Radon transport in water as test for a transportation microbubble model. J. Appl. Geophys. 1992, 29, 37–46. [Google Scholar] [CrossRef]
  8. Sasaki, T.; Gunji, Y.; Okuda, T. Mathematical modeling of radon emanation. J. Nucl. Sci. Technol. 2004, 41, 142–151. [Google Scholar] [CrossRef]
  9. Ingebritsen, S.E.; Manga, M. Earthquakes: Hydrogeochemical precursors. Nat. Geosci. 2014, 7, 697. [Google Scholar] [CrossRef]
  10. Riggio, A.; Santulin, M. Earthquake forecasting: A review of Radon as seismic precursor. Boll. Geofis. Teorica Appl. 2015, 56, 95–114. [Google Scholar]
  11. Woith, H. Radon earthquake precursor: A short review. Eur. Phys. J. Spec. Top. 2015, 224, 611–627. [Google Scholar] [CrossRef]
  12. Scholz, C.H.; Sykes, L.R.; Aggarwal, Y.P. Earthquake prediction: A physical basis. Science 1973, 181, 803–810. [Google Scholar] [CrossRef] [PubMed]
  13. Wakita, H.; Nakamura, Y.; Notsu, K.; Noguchi, M.; Asada, T. Radon anomaly: A possible precursor of the 1978 Izu-Oshima-kinkai Earthquake. Science 1980, 207, 882–883. [Google Scholar] [CrossRef] [PubMed]
  14. Adinolfi Falcone, R.; Carucci, V.; Falgiani, A.; Manetta, M.; Parisse, B.; Petitta, M.; Rusi, S.; Spizzico, M.; Tallini, M. Changes on groundwater flow and hydrochemistry of the Gran Sasso carbonate aquifer after 2009 L’Aquila earthquake. Ital. J. Geosci. 2012, 131, 459–474. [Google Scholar] [CrossRef]
  15. Lambert, M.J.; Burnett, W.C. Submarine groundwater discharge estimates at a Florida coastal site based on continuous radon measurements. Biogeochemistry 2003, 66, 55–73. [Google Scholar] [CrossRef]
  16. Burnett, W.C.; Dulaiova, H. Radon as a tracer of submarine groundwater discharge into a boat basin in Donnalucata, Sicily. Cont. Shelf Res. 2006, 26, 862–873. [Google Scholar] [CrossRef]
  17. Bredehoft, J.D. Response of well-aquifer systems to Earth tides. J. Geophys. Res. 1967, 72, 3075–3087. [Google Scholar] [CrossRef]
  18. Carcaterra, A.; Doglioni, C. The westward drift of the lithosphere: A tidal ratchet? Geosci. Front. 2018, 9, 403–414. [Google Scholar] [CrossRef]
  19. Kies, A.; Majerus, J.; D’Oreye, D.L. Underground radon gas concentrations related to Earth tides. Nuovo Cimento Soc. Ital. Fis. C 1999, 22, 287–293. [Google Scholar]
  20. Richon, P.; Moreau, L.; Sabroux, J.C.; Pili, E.; Salaün, A. Evidence of both M2 and O1 Earth tide waves in radon-222 air concentration measured in a subglacial laboratory. J. Geophys. Res. 2012, 117. [Google Scholar] [CrossRef]
  21. Shapiro, M.H.; Rice, A.; Mendenhall, M.H.; Melvin, J.D.; Tombrello, T.A. Recognition of environmentally caused variations in radon time series. Pure Appl. Geophys. 1984, 122, 309–326. [Google Scholar] [CrossRef]
  22. Steinitz, G.; Piatibratova, O.; Kotlarsky, P. Possible effect of solar tides on radon signals. J. Environ. Radioact. 2011, 102, 749–765. [Google Scholar] [CrossRef] [PubMed]
  23. Mentes, G.; Eper-Pápai, I. Investigation of temperature and barometric pressure variation effects on radon concentration in the Sopronbánfalva Geodynamic Observatory, Hungary. J. Environ. Radioact. 2015, 149, 64–72. [Google Scholar] [CrossRef] [PubMed] [Green Version]
  24. Steinitz, G.; Piatibratova, O.; Barbosa, S.M. Radon daily signals in the Elat Granite, southern Arava, Israel. J. Geophys. Res. Solid Earth 2007, 112. [Google Scholar] [CrossRef] [Green Version]
  25. Richon, P.; Perrier, F.; Pili, E.; Sabroux, J.C. Detectability and significance of 12 h barometric tide in radon-222 signal, dripwater flow rate, air temperature and carbon dioxide concentration in an underground tunnel. Geophys. J. Int. 2009, 176, 683–694. [Google Scholar] [CrossRef]
  26. Steinitz, G.; Piatibratova, O.; Kotlarsky, P. Sub-daily periodic radon signals in a confined radon system. J. Environ. Radioact. 2014, 134, 128–135. [Google Scholar] [CrossRef] [PubMed]
  27. Bellotti, E.; Broggini, C.; Di Carlo, G.; Laubenstein, M.; Menegazzo, R. Precise measurement of the 222Rn half-life: A probe to monitor the stability of radioactivity. Phys. Lett. B 2015, 743, 526–530. [Google Scholar] [CrossRef] [Green Version]
  28. Galli, P.; Galadini, F.; Pantosti, D. Twenty years of paleoseismology in Italy. Earth-Sci. Rev. 2008, 88, 89–117. [Google Scholar] [CrossRef]
  29. Riguzzi, F.; Crespi, M.; Devoti, R.; Doglioni, C.; Pietrantonio, G.; Pisani, A.R. Geodetic strain rate and Earthquake size: New clues for seismic hazard studies. Phys. Earth Planet. Int. 2012, 206, 67–75. [Google Scholar] [CrossRef]
  30. Barberio, M.D.; Barbieri, M.; Billi, A.; Doglioni, C.; Petitta, M. Hydrogeochemical changes before and during the 2016 Amatrice-Norcia seismic sequence (central Italy). Sci. Rep. 2017, 7, 11735. [Google Scholar] [CrossRef] [PubMed]
  31. Petitta, M.; Mastrorillo, L.; Preziosi, E.; Banzato, F.; Barberio, M.D.; Billi, A.; Cambi, C.; De Luca, G.; Di Carlo, G.; Di Curzio, D.; et al. Water-table and discharge changes associated with the 2016–2017 seismic sequence in central Italy: Hydrogeological data and a conceptual model for fractured carbonate aquifers. Hydrogeol. J. 2018, 26, 1–18. [Google Scholar] [CrossRef]
  32. Igarashi, G.; Saeki, S.; Takahata, N.; Sumikawa, K.; Tasaka, S.; Sasaki, Y.; Takahashi, M.; Sano, Y. Ground-water radon anomaly before the Kobe earthquake in Japan. Science 1995, 269, 60–61. [Google Scholar] [CrossRef] [PubMed]
  33. Tsunogai, U.; Wakita, H. Precursory chemical changes in ground water: Kobe earthquake, Japan. Science 1995, 269, 61–63. [Google Scholar] [CrossRef] [PubMed]
  34. Piersanti, A.; Cannelli, V.; Galli, G. The Pollino 2012 seismic sequence: Clues from continuous radon monitoring. Solid Earth 2016, 7, 1303–1316. [Google Scholar] [CrossRef]
  35. Cannelli, V.; Piersanti, A.; Spagnuolo, E.; Galli, G. Preliminary analysis of radon time series before the Ml = 6 Amatrice earthquake: Possible implications for fluid migration. Ann. Geophys. 2016. [Google Scholar] [CrossRef]
  36. Ithaca (ITaly HAzard from CApable Faults) Database. Available online: http://www.isprambiente.gov.it/en/projects/soil-and-territory/italy-hazards-from-capable-faulting (accessed on 10 September 2018).
  37. ISPRA Database SINAnet (Rete del Sistema Informativo Nazionale Ambientale). Available online: http://www.sinanet.isprambiente.it/it (accessed on 10 September 2018).
  38. Doglioni, C. A proposal for the kinematic modelling of W-dipping subductions-possible applications to the Tyrrhenian-Apennines system. Terra Nova 1991, 3, 423–434. [Google Scholar] [CrossRef]
  39. Cavinato, G.P.; Celles, P.G.D. Extensional basins in the tectonically bimodal central Apennines fold-thrust belt, Italy: Response to corner flow above a subducting slab in retrograde motion. Geology 1999, 27, 955–958. [Google Scholar] [CrossRef]
  40. Billi, A.; Tiberti, M.M.; Cavinato, G.P.; Cosentino, D.; Di Luzio, E.; Keller, J.V.A.; Kluth, C.; Orlando, L.; Parotto, M.; Praturlon, A.; et al. First results from the CROP-11 deep seismic profile, central Apennines, Italy: Evidence of mid-crustal folding. J. Geol. Soc. 2006, 163, 583–586. [Google Scholar] [CrossRef]
  41. Patacca, E.; Scandone, P.; Di Luzio, E.; Cavinato, G.P.; Parotto, M. Structural architecture of the central Apennines: Interpretation of the CROP 11 seismic profile from the Adriatic coast to the orographic divide. Tectonics 2008, 27. [Google Scholar] [CrossRef] [Green Version]
  42. Devoti, R.; D’Agostino, N.; Serpelloni, E.; Pietrantonio, G.; Riguzzi, F.; Avallone, A.; Cavaliere, A.; Cheloni, D.; Cecere, G.; D’Ambrosio, C.; et al. A combined velocity field of the Mediterranean region. Ann. Geophys. 2017, 60, 0215. [Google Scholar] [CrossRef]
  43. Cavinato, G.P.; Carusi, C.; Dall’Asta, M.; Miccadei, E.; Piacentini, T. Sedimentary and tectonic evolution of Plio–Pleistocene alluvial and lacustrine deposits of Fucino Basin (central Italy). Sediment. Geol. 2002, 148, 29–59. [Google Scholar] [CrossRef]
  44. Gori, S.; Giaccio, B.; Galadini, F.; Falcucci, E.; Messina, P.; Sposato, A.; Dramis, F. Active normal faulting along the Mt. Morrone south-western slopes (central Apennines, Italy). Int. J. Earth Sci. 2011, 100, 157–171. [Google Scholar] [CrossRef]
  45. Gori, S.; Falcucci, E.; Dramis, F.; Galadini, F.; Galli, P.; Giaccio, B.; Messina, P.; Pizzi, A.; Sposato, A.; Cosentino, D. Deep-seated gravitational slope deformation, large-scale rock failure, and active normal faulting along Mt. Morrone (Sulmona basin, Central Italy): Geomorphological and paleoseismological analyses. Geomorphology 2014, 208, 88–101. [Google Scholar] [CrossRef] [Green Version]
  46. Galadini, F.; Galli, P. Archaeoseismology in Italy: Case studies and implications on long-term seismicity. J. Earthq. Eng. 2001, 5, 35–68. [Google Scholar] [CrossRef]
  47. Romano, M.A.; Nardis, R.D.; Garbin, M.; Peruzza, L.; Priolo, E.; Lavecchia, G.; Romanelli, M. Temporary seismic monitoring of the Sulmona area (Abruzzo, Italy): A quality study of microearthquake locations. Nat. Hazards Earth Syst. Sci. 2013, 13, 2727–2744. [Google Scholar] [CrossRef]
  48. Celico, P. Schema idrogeologico dell’Appennino carbonatico centro-meridionale. Mem. Note dell’Ist. Geol. Appl. 1979, 14, 1–97. [Google Scholar]
  49. Boni, C.; Bono, P.; Capelli, G. Schema Idrogeologico dell’Italia centrale: Note illustrative e carte. Mem. Soc. Geol. Ital. 1986, 35, 991–1012. [Google Scholar]
  50. Salvati, R. Natural hydrogeological laboratories: A new concept in regional hydrogeology studies. A case history from central Italy. Environ. Geol. 2002, 41, 960–965. [Google Scholar] [CrossRef]
  51. Miccadei, E.; Cavinato, G.P.; Vittori, E. Elementi neotettonici della conca di Sulmona. Stud. Geol. Camerti 1992, 1, 165–174. [Google Scholar]
  52. Desiderio, G.; Folchi Vici d’Arcevia, C.; Nanni, T.; Rusi, S. Hydrogeological mapping of the highly anthropogenically influenced Peligna Valley intramontane basin (Central Italy). J. Maps 2012, 8, 165–168. [Google Scholar] [CrossRef] [Green Version]
  53. Conese, M.; Nanni, T.; Peila, C.; Rusi, S.; Salvati, R. Idrogeologia della Montagna del Morrone (Appennino Abruzzese): Dati preliminari. Mem. Soc. Geol. Ital. 2001, 56, 181–196. [Google Scholar]
  54. Csige, I. Radon and Space Radiation Protection Measurements. Ph.D. Thesis, Lajos Kossuth University, Budapest, Hungary, 1997. [Google Scholar]
  55. CalSky—Solid Earth Tides Free Resource. Available online: https://www.calsky.com (accessed on 10 September 2018).
  56. Lowrie, W. Fundamentals of Geophysics; Cambridge University Press: Cambridge, UK, 2007; pp. 50–56. [Google Scholar]
  57. MatlabR2017b ‘Mscohere’ Function. Available online: Available online: https://mathworks.com/help/signal/ref/mscohere.html (accessed on 10 September 2018).
  58. Doodson, A.T. The harmonic development of the tide-generating potential. Proc. R. Soc. Lond. A 1921, 100, 305–329. [Google Scholar] [CrossRef]
  59. Schureman, P. Manual of Harmonic Analysis and Prediction of Tides; USA Department of Commerce: Washington, DC, USA, 1940. [Google Scholar]
  60. Groves-Kirkby, C.J.; Denman, A.R.; Crockett, R.G.M.; Phillips, P.S. Periodicity in Domestic Radon Time Series-Evidence for Earth Tides. In Proceedings of the 11th International Congress of the International Radiation Protection Association (IRPA11e6a27), Madrid, Spain, 23–28 May 2004; pp. 23–28. [Google Scholar]
  61. Lomb, N.R. Least-Squares Frequency Analysis of Unequally Spaced Data. Astrophys. Space Sci. 1976, 39, 447–462. [Google Scholar] [CrossRef]
  62. Scargle, J.D. Studies in Astronomical Time Series Analysis. II. Statistical Aspects of Spectral Analysis of Unevenly Spaced Data. Astrophys. J. 1982, 263, 835–853. [Google Scholar] [CrossRef]
  63. Melchior, P. The Earth’s Tides; Pergamon: Oxford, UK, 1966. [Google Scholar]
  64. Ball, T.K.; Cameron, D.G.; Colma, T.B.; Roberts, P.D. Behavior of Radon in the geological environment: A review. Q. J. Eng. Geol. 1991, 24, 169–182. [Google Scholar] [CrossRef]
  65. Finkelstein, M.; Eppelbaum, L.V.; Price, C. Analysis of temperature influences on the amplitude frequency characteristics of Radon gas concentration. J. Environ. Radioact. 2006, 86, 251–270. [Google Scholar] [CrossRef] [PubMed]
  66. Jin, S.; Wu, Y.; Heinkelmann, R.; Park, J. Diurnal and semidiurnal atmospheric tides observed by co-located GPS and VLBI measurements. J. Atmos. Sol.-Terr. Phys. 2008, 70, 1366–1372. [Google Scholar] [CrossRef]
  67. Mentes, G. Investigation of the relationship between rock strain and radon concentration in the tidal frequency-range. J. Appl. Geophys. 2018, 155, 232–236. [Google Scholar] [CrossRef]
  68. Sugisaki, R. Deep-seated gas emission induced by the earth tide: A basic observation for geochemical earthquake prediction. Science 1981, 212, 1264–1266. [Google Scholar] [CrossRef] [PubMed]
  69. Igarashi, G.; Wakita, H. Tidal responses and earthquake-related changes in the water level of deep wells. J. Geophys. Res. Solid Earth 1991, 96, 4269–4278. [Google Scholar] [CrossRef]
  70. Aumento, F. Radon tides on an active volcanic island: Terceira, Azores. Geofís. Int. 2002, 41, 499–505. [Google Scholar]
  71. Chanton, J.P.; Burnett, W.C.; Dulaiova, H.; Corbett, D.R.; Taniguchi, M. Seepage rate variability in Florida Bay driven by Atlantic tidal height. Biogeochemistry 2003, 66, 187–202. [Google Scholar] [CrossRef]
  72. Crockett, R.G.; Gillmore, G.K.; Phillips, P.S.; Denman, A.R.; Groves-Kirkby, C.J. Tidal synchronicity of built-environment radon levels in the UK. Geophys. Res. Lett. 2006, 33, L05308. [Google Scholar] [CrossRef]
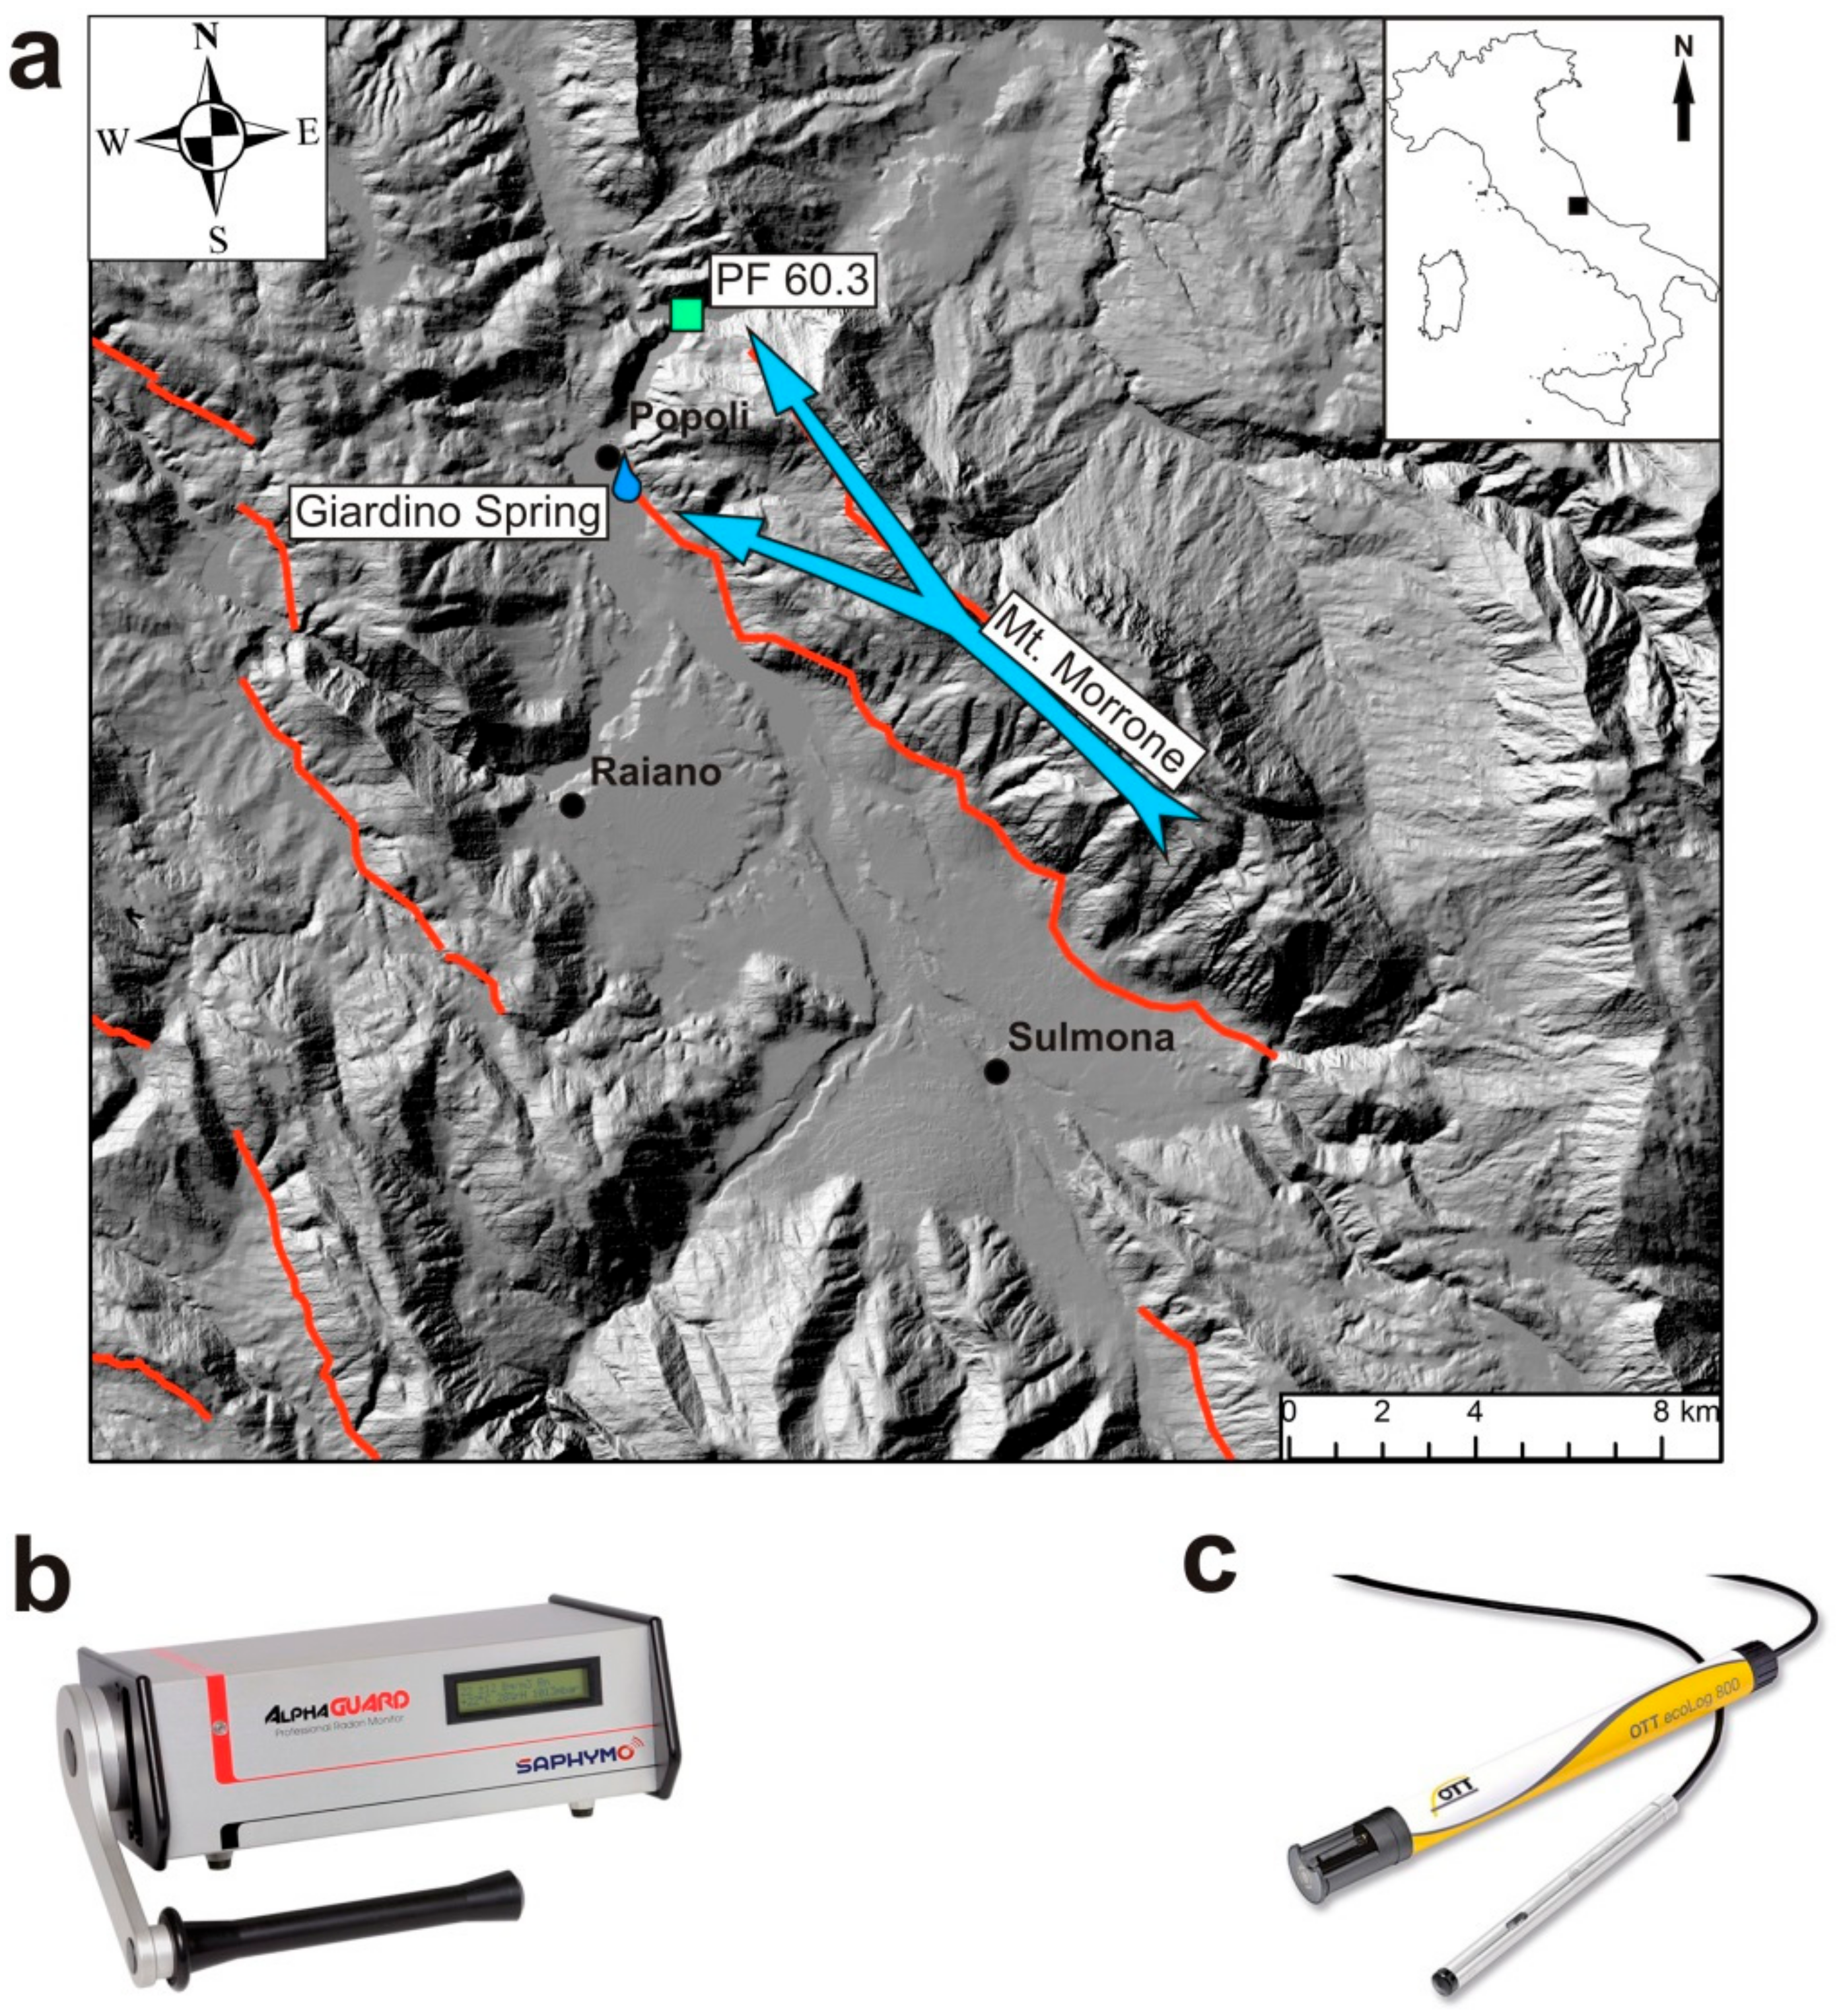
Figure 1. (a) Map of Central Apennines (see location in upper right inset). Active faults (all extensional) are from the Ithaca database [36]). Base digital elevation model is from the ISPRA (Istituto Superiore per la Protezione e la Ricerca Ambientale) database SINAnet [37]). Location of the well (PF 60.3) and Giardino Spring, monitored in this work, are displayed with blue and green symbols, respectively. The blue arrow indicates the principal groundwater flow path of the Mt. Morrone aquifer; (b) AlphaGUARD (Model PQ2000PRO) instrument, for professional radon monitoring; (c) OTT ecoLog 800 multiparametric probe, for continuous acquisition and remote transmission of data, including groundwater level, temperature, and electrical conductivity.
Water 10 01276 g001
Figure 2. (a) Time series (1 April 2017–15 October 2017) of Rn activity in the Giardino Spring (Figure 1a); (b) time series (1 April 2017–15 October 2017) of calculated solid Earth tides in the study area using the CalSky [55] with different moon phases (c) time series (1 April 2017–15 October 2017) of groundwater levels recorded in the PF 60.3 well (100 m deep; Figure 1a).
Water 10 01276 g002
Figure 3. (a) Time series (10 August 2017–22 August 2017) of normalized (see text for normalization) Radon activity in the Giardino Spring (Figure 1a); (b) time series (10 August 2017–22 August 2017) of normalized groundwater levels recorded in the PF 60.3 well (100 m deep; Figure 1a). The black line indicates the three-hours moving average of signals.
Water 10 01276 g003
Figure 4. (a) Fourier spectral analysis of solid Earth tides and Rn activity time series; (b) Fourier spectral analysis of solid Earth tides and groundwater levels time series; (c) long-term Fourier spectral analysis of groundwater levels and Rn activity.
Water 10 01276 g004