1. Introduction
Ice monitoring in many European rivers is rather scattered and the collected data are not sufficient to fully understand the ice processes. The frequent and accurate monitoring of ice processes in rivers is important since it may help to identify possible flood risks caused by jamming. As stated in [
1], ice-related observed data are often subjective to the given observer, and frequently represented in a descriptive form of the ice type. In many locations, the ice period duration, the first ice date, and the breakup date are collected, e.g., in Poland [
1,
2,
3,
4], Russia [
5], Central Europe [
6,
7,
8,
9], or Finland [
10,
11]. Ice cover thickness has been measured in major Polish rivers from the fifties of the last century, and data are collected at ten-day intervals. Currently, ice thickness data are still measured by the Regional Water Management Board and by the hydrological surveillance service of the Institute of Meteorology and Water Management. Unfortunately, the data are measured in very few locations along the river, which cannot provide sufficient information to recreate ice jam formations, which are typically local and very dynamic phenomena.
In recent years, satellite produced images have provided information on the distribution of river ice and are a good complement to field measurements [
12,
13,
14]. In Canada, the Moderate Resolution Imaging Suite (MODIS) and Visible Infrared Imaging Resolution Suite (VIIRS) instruments are used to produce ice cover maps within the CREST River Ice Observing System (CRIOS). Cloud obscuration is the main limitation that hampers the use of optical sensors for ice cover detection and mapping. Even though automatically produced cloud masks are used in the mentioned system, it is still a big challenge to discriminate ice covered grid cells from clouds [
15]. Also, the quality of the observed swaths, usually up to a 250 m special resolution, and the time coverage (daily or less), are not adequate to reproduce ice jam processes, which are quite local events and may cause flooding within hours [
16,
17,
18].
All the mentioned data will not include complicated and highly dynamic ice processes, which are usually the most important from the perspective of basin management, inland navigation, flood protection, and hydropower generation issues. Although statistical information of ice processes helps to understand general trends in cover formation and ice movement, the complexity of the processes makes it nearly impossible to achieve a higher accuracy level. Field studies and satellite picture analyses will not give precise answers on ice forecasting, or possible scenarios for ice movement and jam formation along a river. Sometimes, the dynamics of ice are described on the basis of a subjective interpretation or so-called ‘expert opinion’ only, which clearly does not satisfy engineering requirements.
As shown in [
19], the formation of an ice jam is the result of a congestion of ice due to the convergence of ice flow. Another mechanism shows that ice will start to accumulate if its concentration increases. The first process is usually related to an ice bridge or other obstacles which could cause a reduction of the flow area or bending of the channel. The second mechanism of jamming is related to a change in the hydraulic slope affecting the retardation of the ice movement. Both processes take place in a relatively small area, the consequence of which is the formation of an ice jam. Jamming is a self-perpetuating process and once initiated, may lead to complete blocking of the river channel if the hydraulic conditions do not change. In reality, this situation is very unusual and ice jam formation proceeds in a less dramatic way. Typically, the flow under the ice accumulation is always preserved. Grounded jams are very rare or momentary events as the hydraulic condition changes dynamically as a result of ice accumulation.
Mathematical models can supplement the inadequacies of field and lab studies to help understand the physical processes of river ice, and at the same time, they can also be a tool to help design and plan engineering projects. They have become valuable tools for exploring the research area of river ice, such as understanding the physical processes and simulating river ice phenomena, and even forecasting ice floods. A notable example of such application could be the implementation of a mathematical model for the Great Lakes river system, including Lake Erie and the Niagara River [
20,
21] or St Mary’s River and Lake Superior [
22], as well as the Elbe River in Germany [
23], Lake Notoro in Hokkaido [
24], or the Ningxia–Inner Mongolia Reach of the Yellow River [
25].
Various numerical models have been developed to help simulate the formation of very dynamic and often destructive jam events [
26]. The process of the jamming or bridging of the surface ice run by congestion, thus initiating the accumulation of incoming surface ice into an ice cover or ice jam could be modeled by using a dynamic force balance model, as described in [
27]. Models based on static theory [
28] will not allow the forecasting of the location and timing of an ice jam, and are therefore not suitable tools to be applied to rivers where ice jam forecasting needs to be modeled. The DynaRICE model is a two-dimensional coupled hydrodynamic and ice dynamic model allowing the prediction of where and when the ice jam will be formed. Since the ice dynamics in the DynaRICE model are governed by the balance of internal and external forces, the formation of the ice jam will proceed spontaneously with negligible user interference.
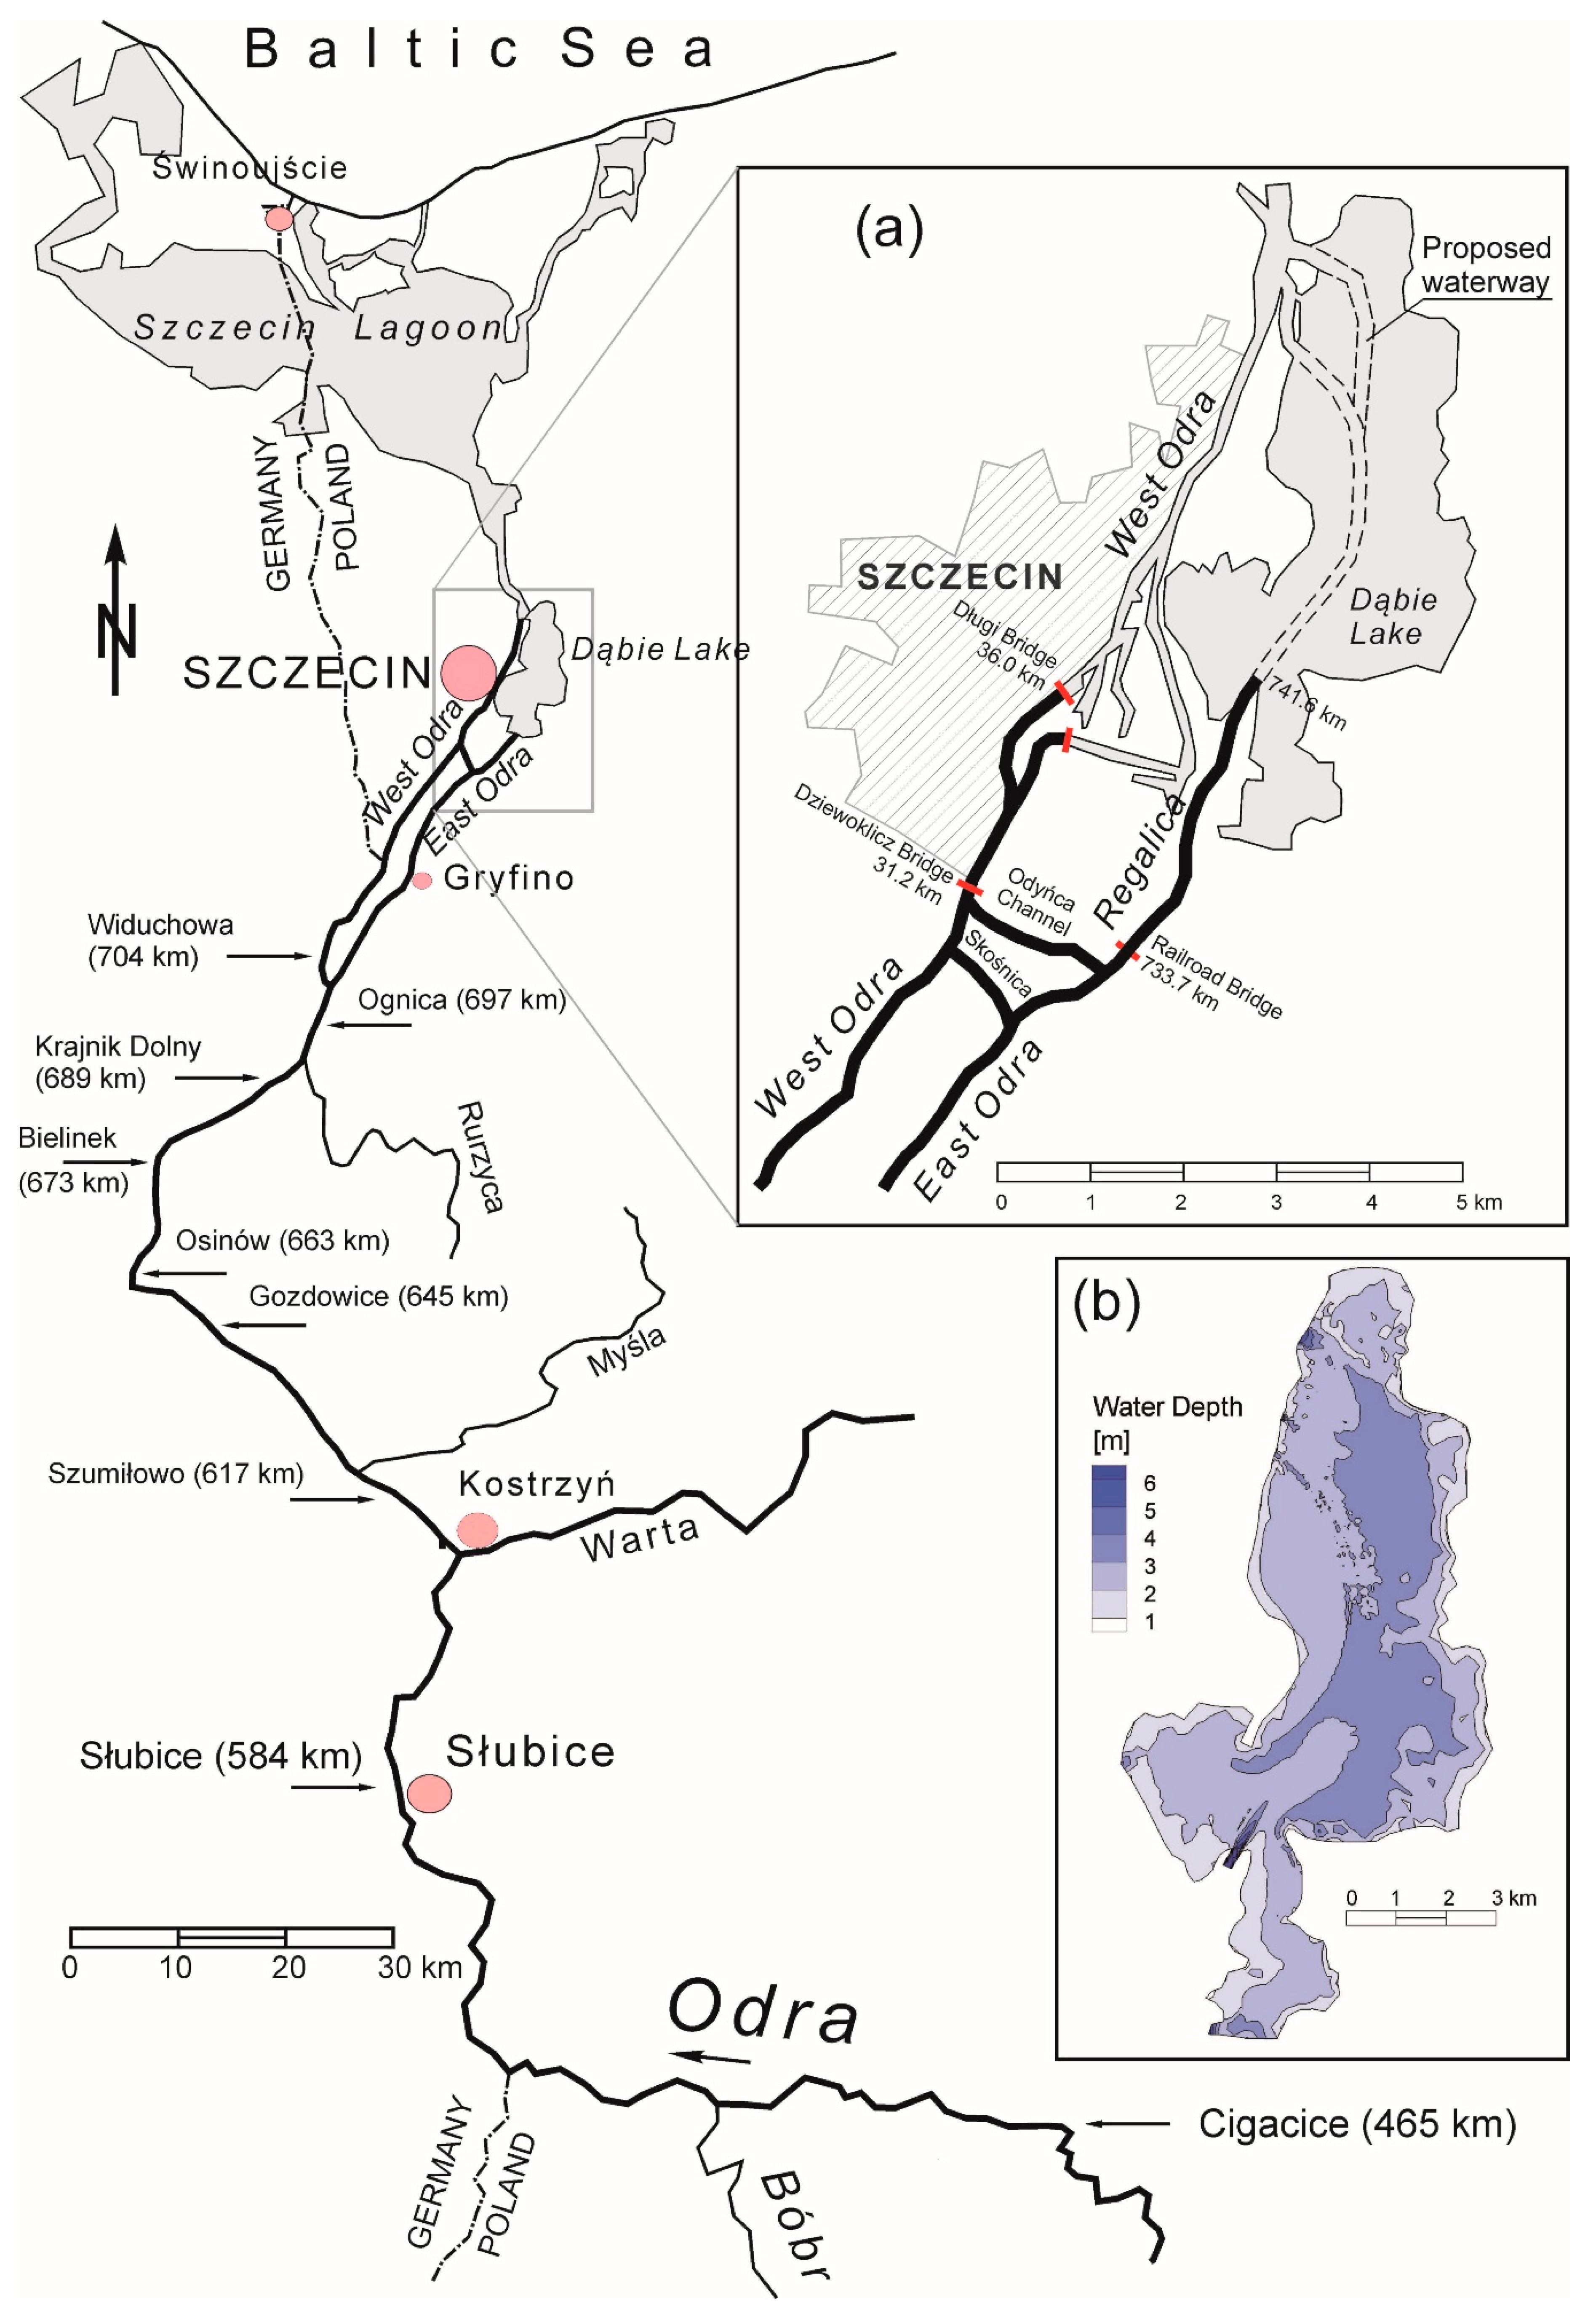
The application of a mathematical model to support the decision-making process in river engineering practice was presented regarding the case of the Odra River, the course of which, in the middle and lower reach, is shown on the sketch in
Figure 1. The Odra, which is the border river between Poland and Germany, freezes seasonally and due to this, requires regular attention and icebreaking operations. Despite the significant impact of the Odra River on the public safety of both Poland and Germany, the amount of research on ice-related flooding and ice processes in the river is rather inconsiderable. Some incomplete information on ice processes in the Odra River can be found in [
29]. A general description of the river and the ice processes, together with the relative frequency and probability of ice formation at the Hohensaaten gauge, is presented in [
30]. Phenological observations of ice phenomena in the Middle Odra were made in [
1] and at the Wrocław water junction in [
31] and for the river estuary in [
32].
Ensuring and improving flood protection is one of the most important factors to determine sustainable and stable social and economic development in regions and countries. The Odra-Vistula Flood Management Project (OVFMP) is implemented with the assistance of international financial institutions, including the International Bank for Reconstruction and Development and the Council of Europe Development Bank, as well as with financial support from the Cohesion Fund and the state budget. The OVFMP assumes the implementation of the most urgent tasks in the field of flood protection within selected parts of the river basins of the two largest Polish rivers, the Vistula River and the Odra River. Beside others, one objective of the OVFMP is to increase flood protection for people living in selected areas of the Odra and Upper Vistula basins. The Odra-Vistula Flood Management Project consists of five components. In this paper, Component 1, flood protection of the Middle and Lower Odra River, will be discussed. This component aims to enhance protection against summer floods and winter floods for the cities and smaller towns located along the Odra River. The activities will include, among others, the (re)construction of dikes and other protective works on banks, dredging of the Odra riverbed and its channels, river training works, and the reconstruction of spur dikes. All mentioned works will be carried out to ensure the safety of icebreaking operations, which require a sufficient depth over the entire river course. Five bridges also need to be raised to facilitate the safe passage of icebreakers.
The project includes various activities carried out within a vast section of the Odra River with a total length of approx. 440 km (within: the Lower and Middle Odra River). The works necessary for implementation are: (1) flood protection of areas in the Odra River outlet section, (2) flood protection in the Middle and Lower Odra, and (3) flood protection of Słubice city [
33]. The first and last tasks mainly focus on the construction and modernization of existing embankments of the river, in order to increase the security of the adjacent areas, as well as works aimed at improving flow conditions for flood waters in the area between the embankments. Works planned for implementation in the second task will result in improving river conveyance for water and ice runoff during the spring or mid-winter breakup, to reduce the ice jam flood risk. This is mainly focused on enabling the operation of icebreakers along a long section of the river, which requires ensuring a river depth to class III of the regional waterway, which will allow the navigation of vessels with a maximum draught of 1.6–2.0 m [
34]. In addition, five bridges need to be raised to facilitate the safe passage of the icebreakers underneath, including, but not limited to, the bridges shown on
Figure 1a [
35].
2. Ice Condition in the Odra River
The channel of the Odra River was regulated in the early 19th century, with corrections made in 1924–1941. River engineering works mainly concerned the use of a system of spurs located on both river banks for the so-called low water level; however, the efforts have never been completed. Currently, the crowns, heads, and main bodies of the structures are damaged to a varying degree, and a number of erosion potholes can be found between the spurs [
36]. Despite significant alterations made to the riverbed, resulting from adjusting the Odra River to the function of a waterway in the last centuries, the Odra maintained its typical features of a large lowland river. The river source is in the Sudety Mountains and the mouth of the Odra is at the Baltic Sea, via Lake Dąbie and Szczecin Bay (
Figure 1).
Ice phenomena on the Odra River are observed every season, with some exceptions. Typically, the first ice occurs in Lake Dąbie, where static cover is formed due to the low water velocity. The lake is shallow and sheltered with low waves and weak currents. The average depth of the lake is about 2.6 m according to data from the Szczecin Regional Water Board (see
Figure 1b). This all contributes to relatively fast cover formation, which forms an ice bridge for incoming ice. If conditions are suitable, frazil ice will be formed in the Odra River and travel downstream. When this reaches the leading edge of the ice cover on Lake Dąbie, it will accumulate, forming a hanging dam or dynamic ice cover. Thermal simulations of the ice cover formation on Lake Dąbie have been carried out to show the possible extent of static ice cover. The methods and obtained results are described in the next sections.
Ice formation and breakup in the Odra River may lead to severe jamming situations, resulting, for instance, from the damage of river engineering structures and from years of neglect in water management. The situation is further amplified by the hydraulic characteristic of the flow in the Lower Odra River, which is strongly affected by the high water level of the Baltic Sea. The sea water system, together with the north wind, causes an extensive backwater, the effect of which can be observed up to the Warta outlet (about 200 km). Locations of ice jam-prone sections of the river are indicated on the map presented in
Figure 1. In the paper, two ice jam-prone locations are analyzed: the border river section (571–586 km) in the vicinity of Słubice and the sharp bend in the Middle Odra near Cigacice (466–468 km).
A number of possible engineering solutions could be considered to minimize ice jam formation on rivers, including ice control structures [
37], thermal melting [
38], icebreaking operations [
39], or ice blasting [
40]. However, from a technical and economical point of view, the most reliable for the Odra River is to use specially designed vessels called icebreakers. To allow a safe icebreaking operation, the ship’s power must be sufficient and the hull must have a specific shape and be strengthened to withstand the ice load. Currently, there is a joint effort from both the German and Polish sides to relieve winter flood risks by using 20 icebreakers. The majority of the vessels are old and even though the fleet was recently updated by four new ships, the average age of Polish icebreakers is 27 years and German ones is 44 years. The icebreaking operation is completed nearly every season, starting from Lake Dąbie, and continues upstream to release all ice jams on the Lower and Middle river sections. For the estuarine section of the East Odra, the ice could be additionally melted by using warm water, which is used as a coolant in the thermal power plant at Gryfino. The main obstacles for icebreakers in the Lower Odra are the bridges which, in many cases, do not have enough clearance. In the case of an increased water level due to an ice jam, the vertical clearance is too little for icebreakers to pass safely. In the Middle Odra, the biggest issue hampering the safe operation is the river depth, which may not exceed 1.0 m. To operate efficiently in the Odra, the icebreaker must have a draught of about 1.8 m, which is related to the horsepower required to break ice cover of a thickness up to 30 cm (single floes) and exceeding 1.0 m in the case of an ice jam.
Mathematical model simulations were carried out to evaluate a “zero action” approach for the Odra, and to analyze flood safety as a consequence of the rejection of any further river engineering works. Those who support the continuation of the Odra River modernization maintain that building river walls, longitudinal dikes with crosspieces on concave curves and in the passages between the curves, and spurs on convex banks, is the best solution to the problem, albeit not permanent. Opponents of the idea point to the fact that Western countries have ceased building dams and river engineering structures on lowland rivers. They claim that the construction of more engineering structures would destroy naturally valuable areas, reserves, and Natura 2000 conservation sites. Therefore, it was desirable to recognize the ice condition in the Lower and Middle Odra River in the current state of the river bathymetry, and to point out the possible problems related to winter water management and the icebreaking operation.
3. Materials and Methods
A two-dimensional DynaRICE model of coupled ice and water dynamics was used in this study as a powerful and robust engineering tool. In the hydrodynamic model, water flow under and through ice rubble is included in the form of modified shallow water equations. The conservation of mass equation for total water discharge is shown below [
41]:
in which
water surface elevation;
and
are components of the total unit width of water discharge;
,
are components of the unit width of water discharge beneath the ice layer;
and
represent the water discharge in the upper layer; and
ice concentration. In the current study, since a stationary ice jam is generally considered, the water flow in the upper layer is the seepage discharge in the ice accumulation. The effect of movable ice and its effect on water hydrodynamics is included in momentum equations:
in which,
and
are generalized eddy viscosity coefficients;
and
are shear stresses at the ice–water interface and the river bed; and
is the water depth underneath the ice–water interface. Ice to water resistance is caused by a difference in relative velocity producing shear stress at the ice–water interface
.
DynaRICE was developed with the consideration of ice as a continuum and the governing equations for the conservation of momentum in a two-dimensional horizontal plane will be presented as follows [
42]:
where
is the unit mass (per area) of an ice particle;
is the ice velocity vector;
is the ice internal resistance force;
and
are the wind and water drag, respectively; and
is a gravity force. The solution to the ice dynamics equation was generated by using the SPH method with a method of images implemented for land boundaries [
42].
A thermal calculation of ice cover growth and decay could be achieved by the implementation of a full heat balance at the water surface or ice surface. In addition, the heat flux from water to ice needs to be included in the calculation. Considering that heat balance calculations require a large amount of meteorological data, the full approach may not be readily available at the project site. A number of linear equations have been adopted and employed to determine energy flux on the earth surface. These types of formula are easy to use and do not require a large amount of data. The simulation results can be a good estimation of the process under analysis, especially when applied to long-term simulations with calibrated heat exchange coefficients. However, it must be noted that linear models cannot accurately describe the diurnal variation of the heat exchange process, especially the contribution of solar radiation. Since the diurnal variation of solar radiation and air temperature could be important to some of the ice processes, such as frazil and anchor ice evolution, the linearized expression may include a component proportional to the difference between the river surface temperature
and the air temperature
, and an independent short wave radiation component
[
41]:
in which,
and
are empirical constants and
is the net short wave radiation. If the diurnal variations are not of significant interest, the linear equation can be further simplified to
For the model application, a number of input data were required, which were obtained from the Szczecin Regional Water Management Board (Lake Dąbie bathymetry) and the Wroclaw Regional Water Management Board (bathymetry of the Odra River in Słubice and Cigacice). In addition to constructing the proper boundary conditions, the water discharge characteristics and corresponding water surface elevations were obtained from the Institute of Meteorology and Water Management. Wind and air temperature data were also obtained from historical records of the Institute of Meteorology and Water Management. Detailed information about the model input in each model implementation is presented in the next section.
4. Results and Discussion
The simulation results of the mathematical DynaRICE model implemented in three sections situated along the Odra River are presented here, together with a discussion of the produced results. First, the thermal formation of ice cover on Lake Dąbie was simulated. Next, the ice dynamics model was applied to a 5 km section of the Lower Odra River and finally, to a sharp bend on the Middle Odra River.
4.1. Simulation Results of Ice Cover Formation on Lake Dąbie in Winter 2018
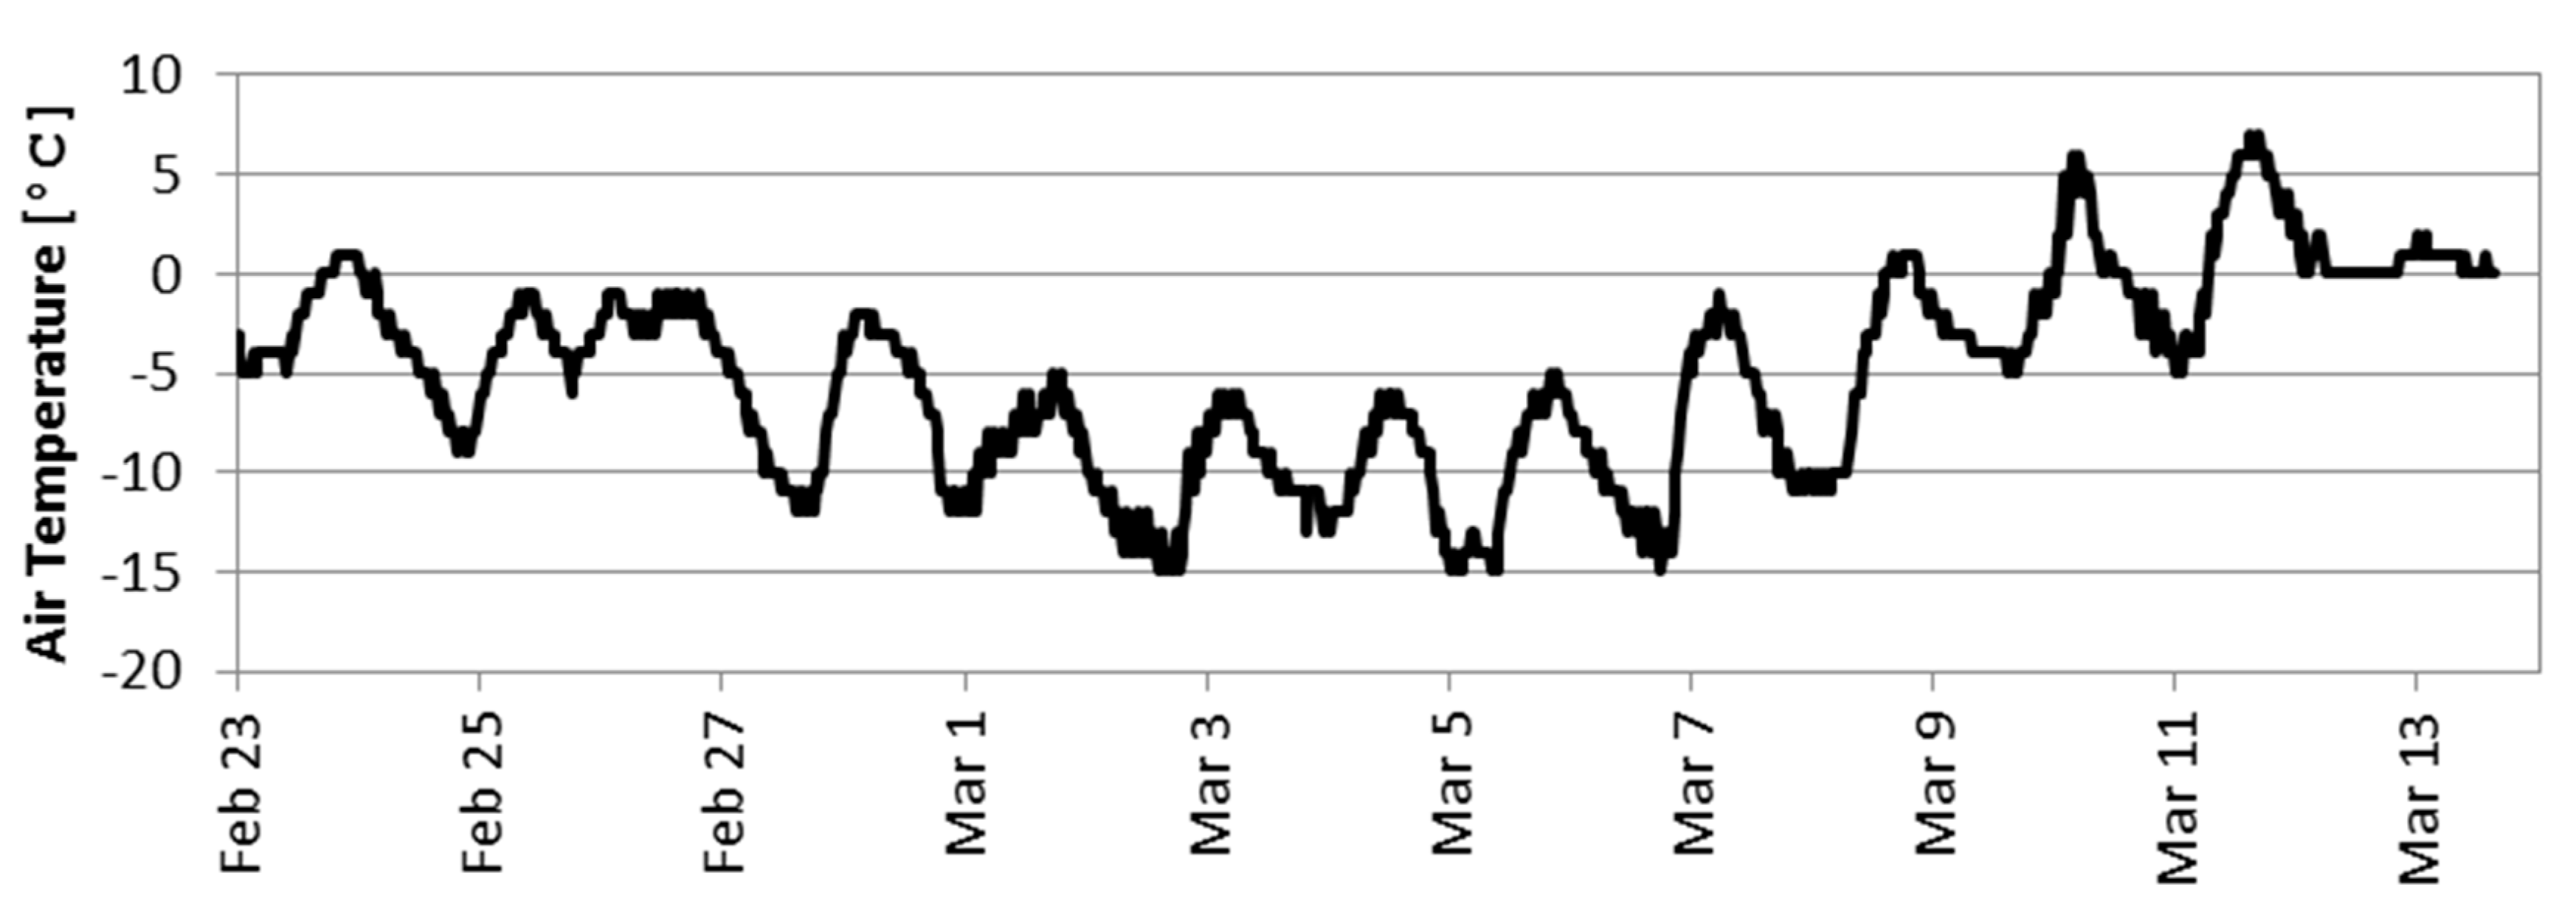
Air temperature recorded in February and March 2018 was used for the simulation (
Figure 2). Water discharge is not observed on the East Odra or Regalica (main inflow to Lake Dąbie—see
Figure 1a) Rivers; therefore, typical flow conditions were used (low flow Q = 300 m
3/s and average flow Q = 575 m
3/s—data from [
43]). Lake bathymetry data from the Szczecin Regional Water Board were used, as shown in
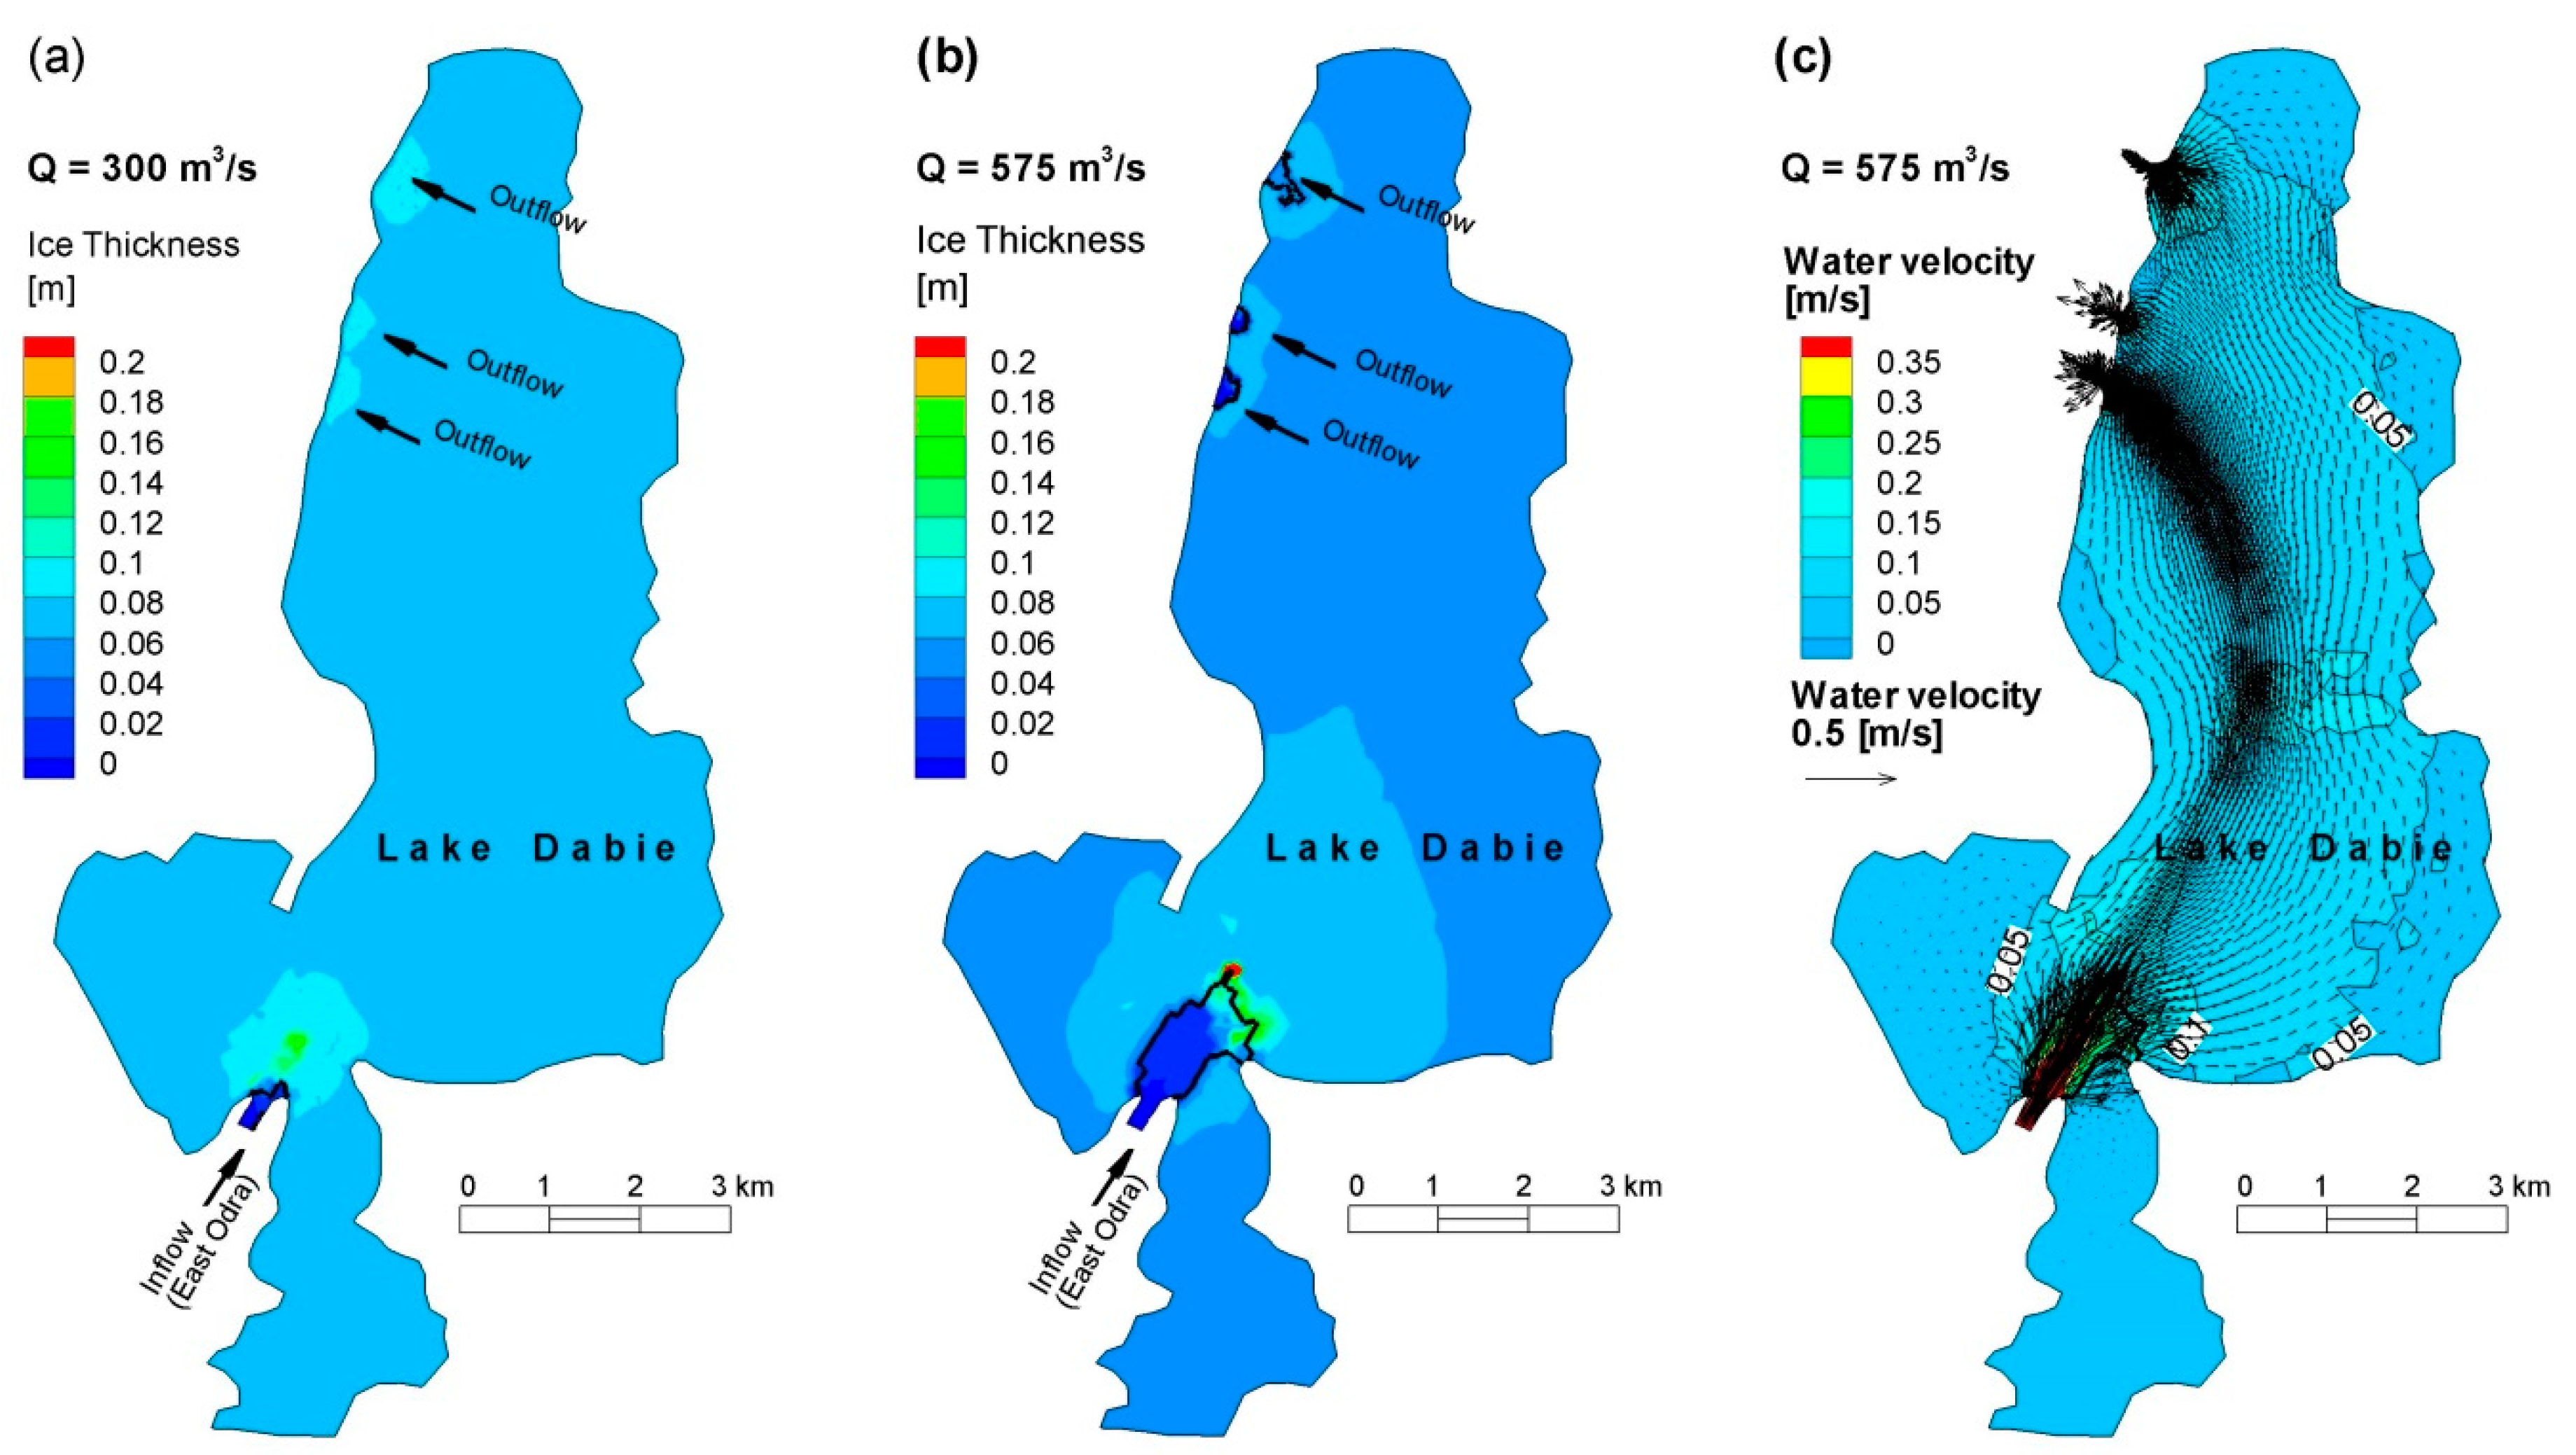
Figure 1b. The thermal formation of ice cover on Lake Dąbie was simulated using the DynaRICE model, which allows the calculation of the ice growth based on the full thermal budget of the water or ice surface and the water hydrodynamics. First, the static ice zones are determined based on the local water velocity [
44]. Next, the thermal flux is calculated and if the heat loss from the water surface is achieved, the ice formation process may be started. The ice cover growth could be calculated based on the heat flux on the air-ice surface by including short and long wave radiation, heat flux due to evaporation, rain or snow fall, and conductive flux. Since detailed meteorological data were not known, a simplified linear approach was used here, as shown in Equation (6).
The simulation results show that static ice covers nearly the entire lake. In the case of low water discharge, the thickness is slightly higher, reaching 6 cm near the South-Western shore of the lake (
Figure 3). The calculated ice thickness is similar to the observed value, reported to be in the range of 5–10 cm.
This leads to the conclusion that in the regular winter season, ice cover will initiate at Lake Dąbie and it will progress upstream through the accumulation of incoming surface ice. The progress of dynamic ice cover is initiated by the stability conditions at the leading edge of the cover. In the last decades, the maximum extent of equilibrium cover rarely reached Kostrzyń (Warta River outlet—
Figure 1) or Słubice.
4.2. Ice Transport in the Słubice Region (Lower Odra, 581–586 km, Poland-Germany Border)
Among others, the Lower River section in the vicinity of Słubice—Frankfurt is under constant surveillance due to its high risk of possible ice jams and the consequent flooding of both cites. The main cause of a hampered ice flow is a bridge and a longitudinal dike narrowing the river to about 50% of its regular width. This leads to ice contraction and possible stoppage, which may occur in the case of a high concentration of incoming ice. To check the ice condition in the vicinity of the Słubice-Frankfurt Bridge, a mathematical model was applied to a 5 km stretch of the Odra River. The model was set up to simulate the ice run in the typical winter conditions expected during breakup. The DynaRICE model was used as the most reliable and to allow the simulation of a dynamic balance between ice dynamics and river hydrodynamics [
27]. The model was widely tested and successfully applied to a number of domains, including the St. Clair River [
45] or the Vistula River [
46].
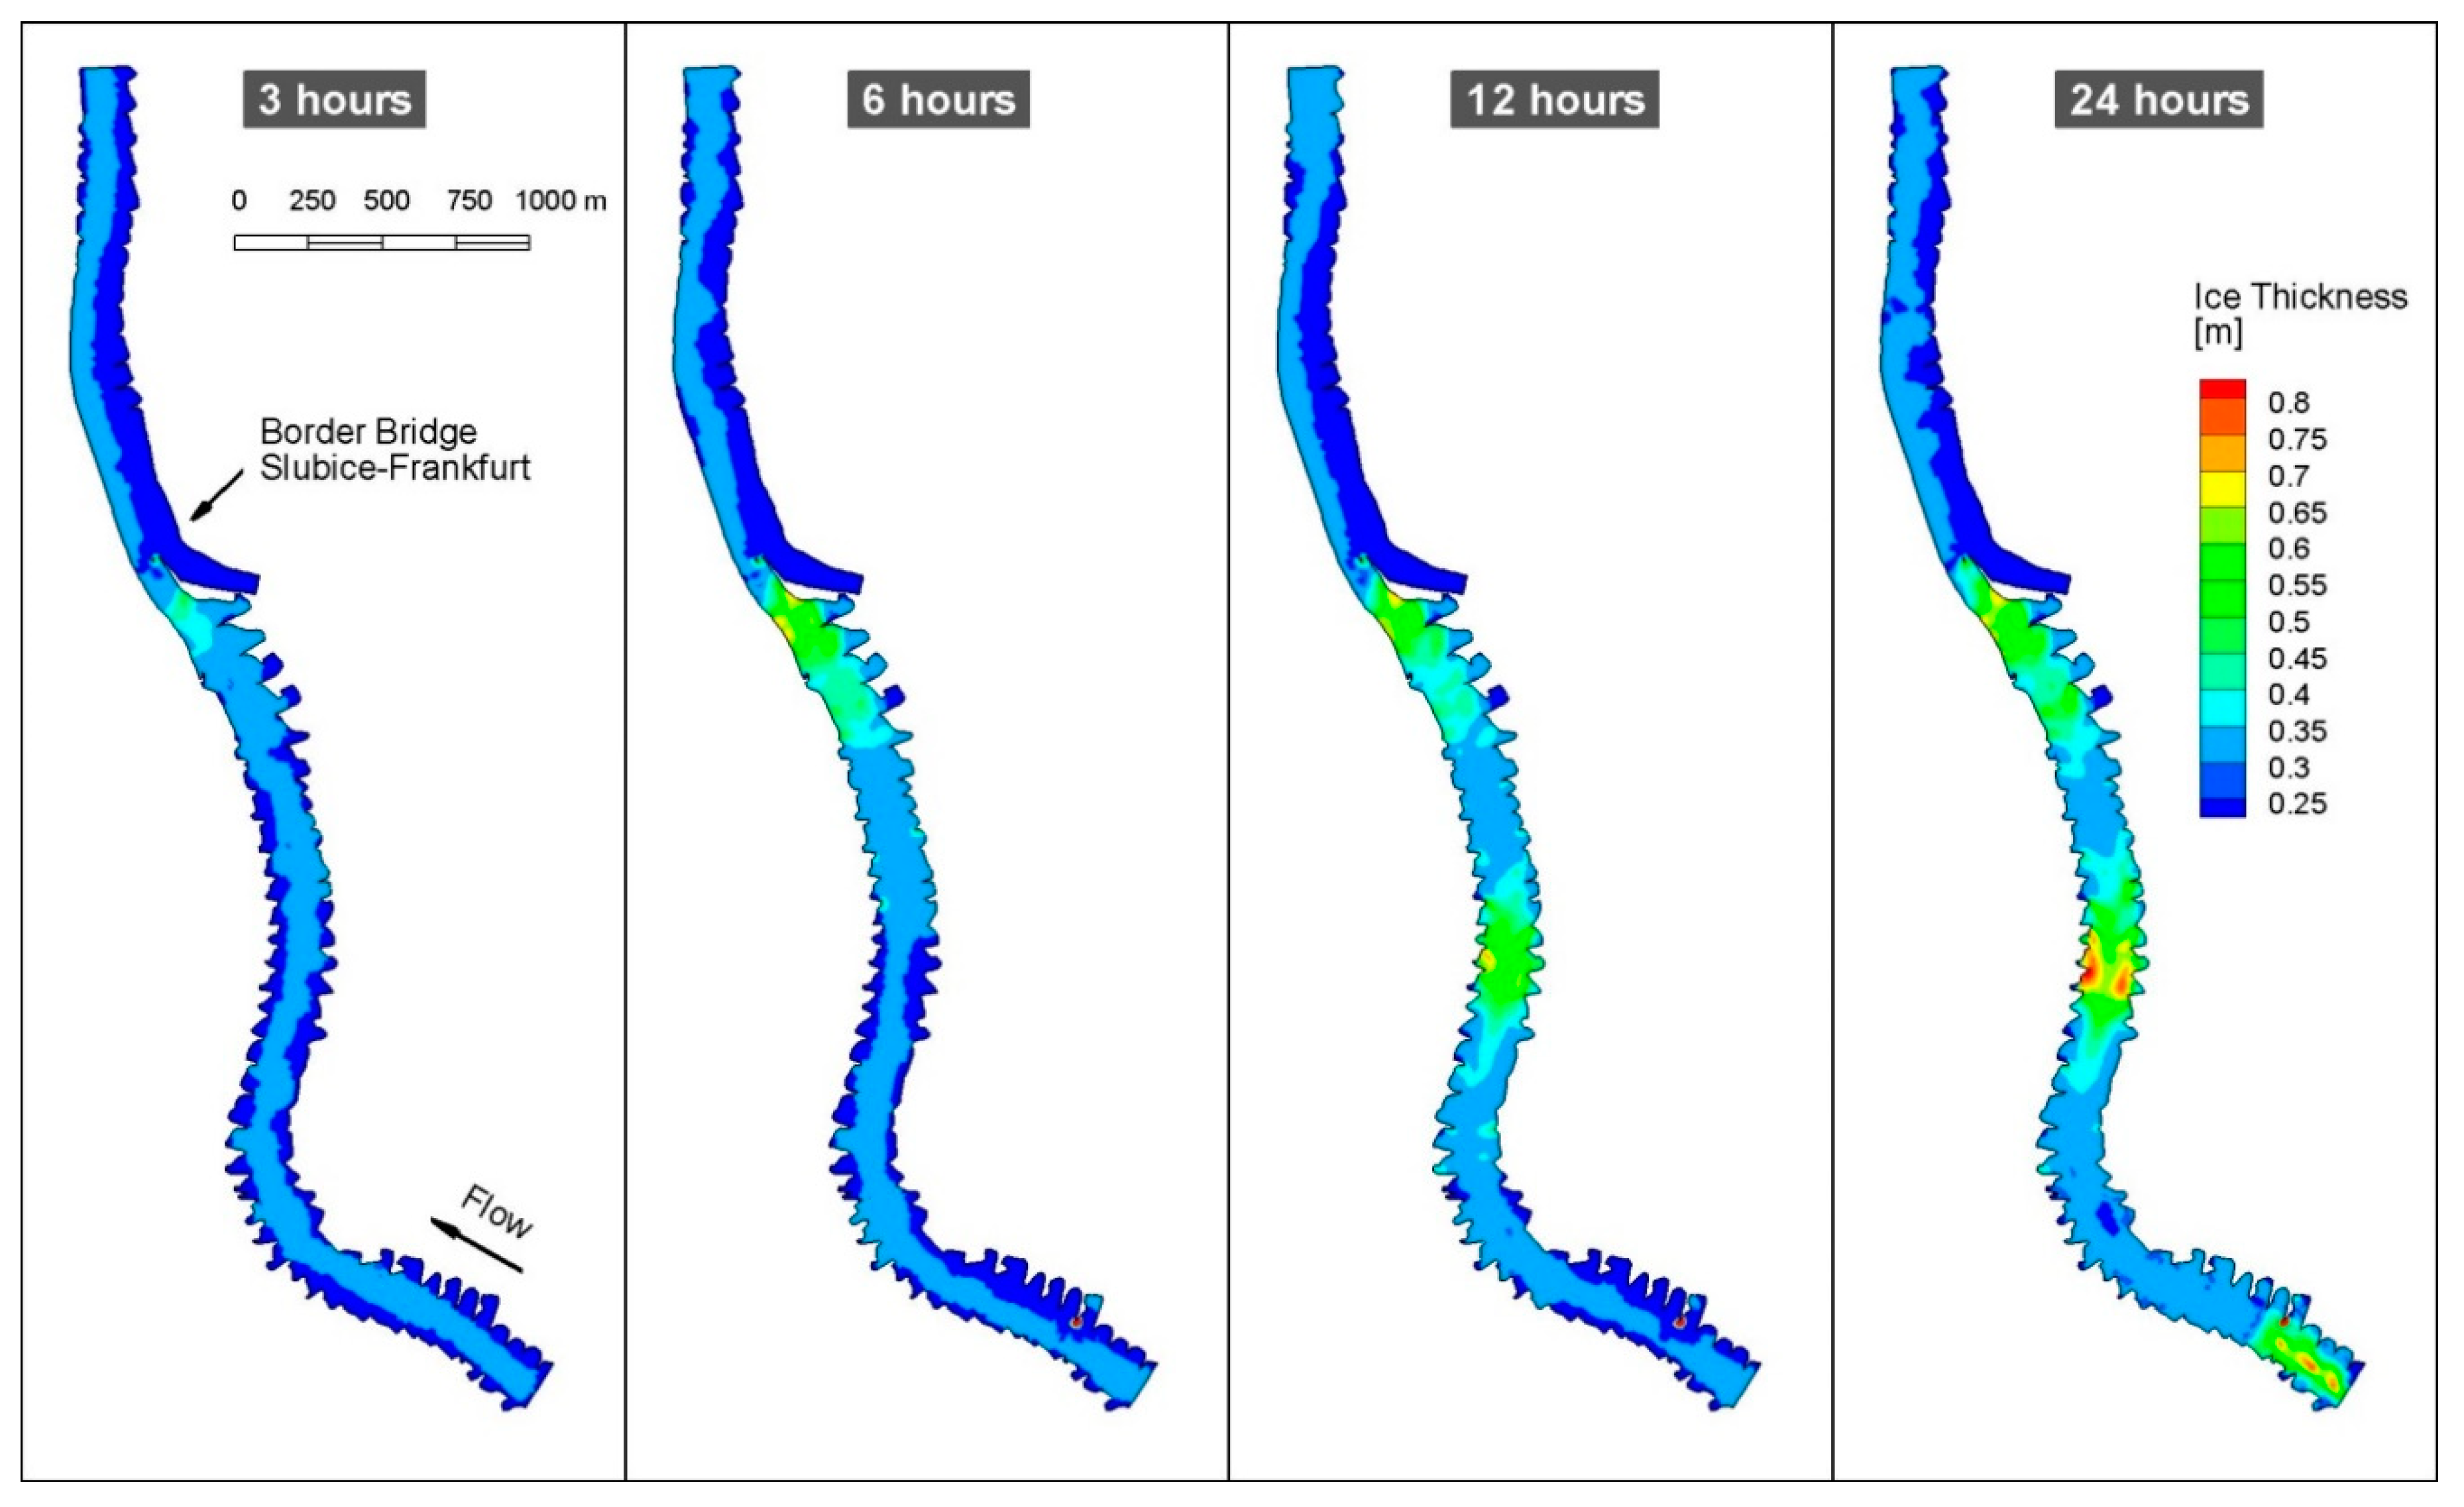
Boundary conditions for river hydrodynamics were set to represent the flow conditions observed during core winter months. The data from Słubice gauging station were analyzed, where daily water surface elevation is recorded. Water discharge is also provided for the Słubice station by the Polish Institute of Meteorology and Water Management. Additionally, the station has some ice thickness observations; however, this is mostly quantitative information on the ice type. Detailed river bathymetry and shoreline data, measured in 2017 for OVFMP, were used for the study. Since detailed ice conditions for the Lower Odra River are not known, the input data for the model were set at the upstream boundary at an initial ice concentration of 0.4 and initial ice floe thickness of 0.3 m. The simulation results for the low flow condition (Q = 160 m
3/s) are presented in
Figure 4 in the form of a contour plot of ice thickness. The simulated results showed a very fast process of ice accumulation and jamming, which initiated at the bridge cross-section and developed quickly upstream, reaching the domain boundary after 24 h.
The simulated results were prepared to represent the situation observed during the breakup operation. Mechanical breakup is proceeded in such a way that icebreakers form an ice-free channel to release ice and water stored in the jams. Next, the channel should be cleaned and widened to allow any additional ice to pass downstream without stoppage. The main reason for ice-free channel maintenance is the high risk of accumulation formed from the ice released from the river upstream. Because the cross-section area in the vicinity of Słubice Bridge is significantly reduced compared to the river cross-sections upstream, it was assumed that ice could naturally accumulate there. The simulation results of the numerical model study show jamming upstream of the bridge, which confirms this argument.
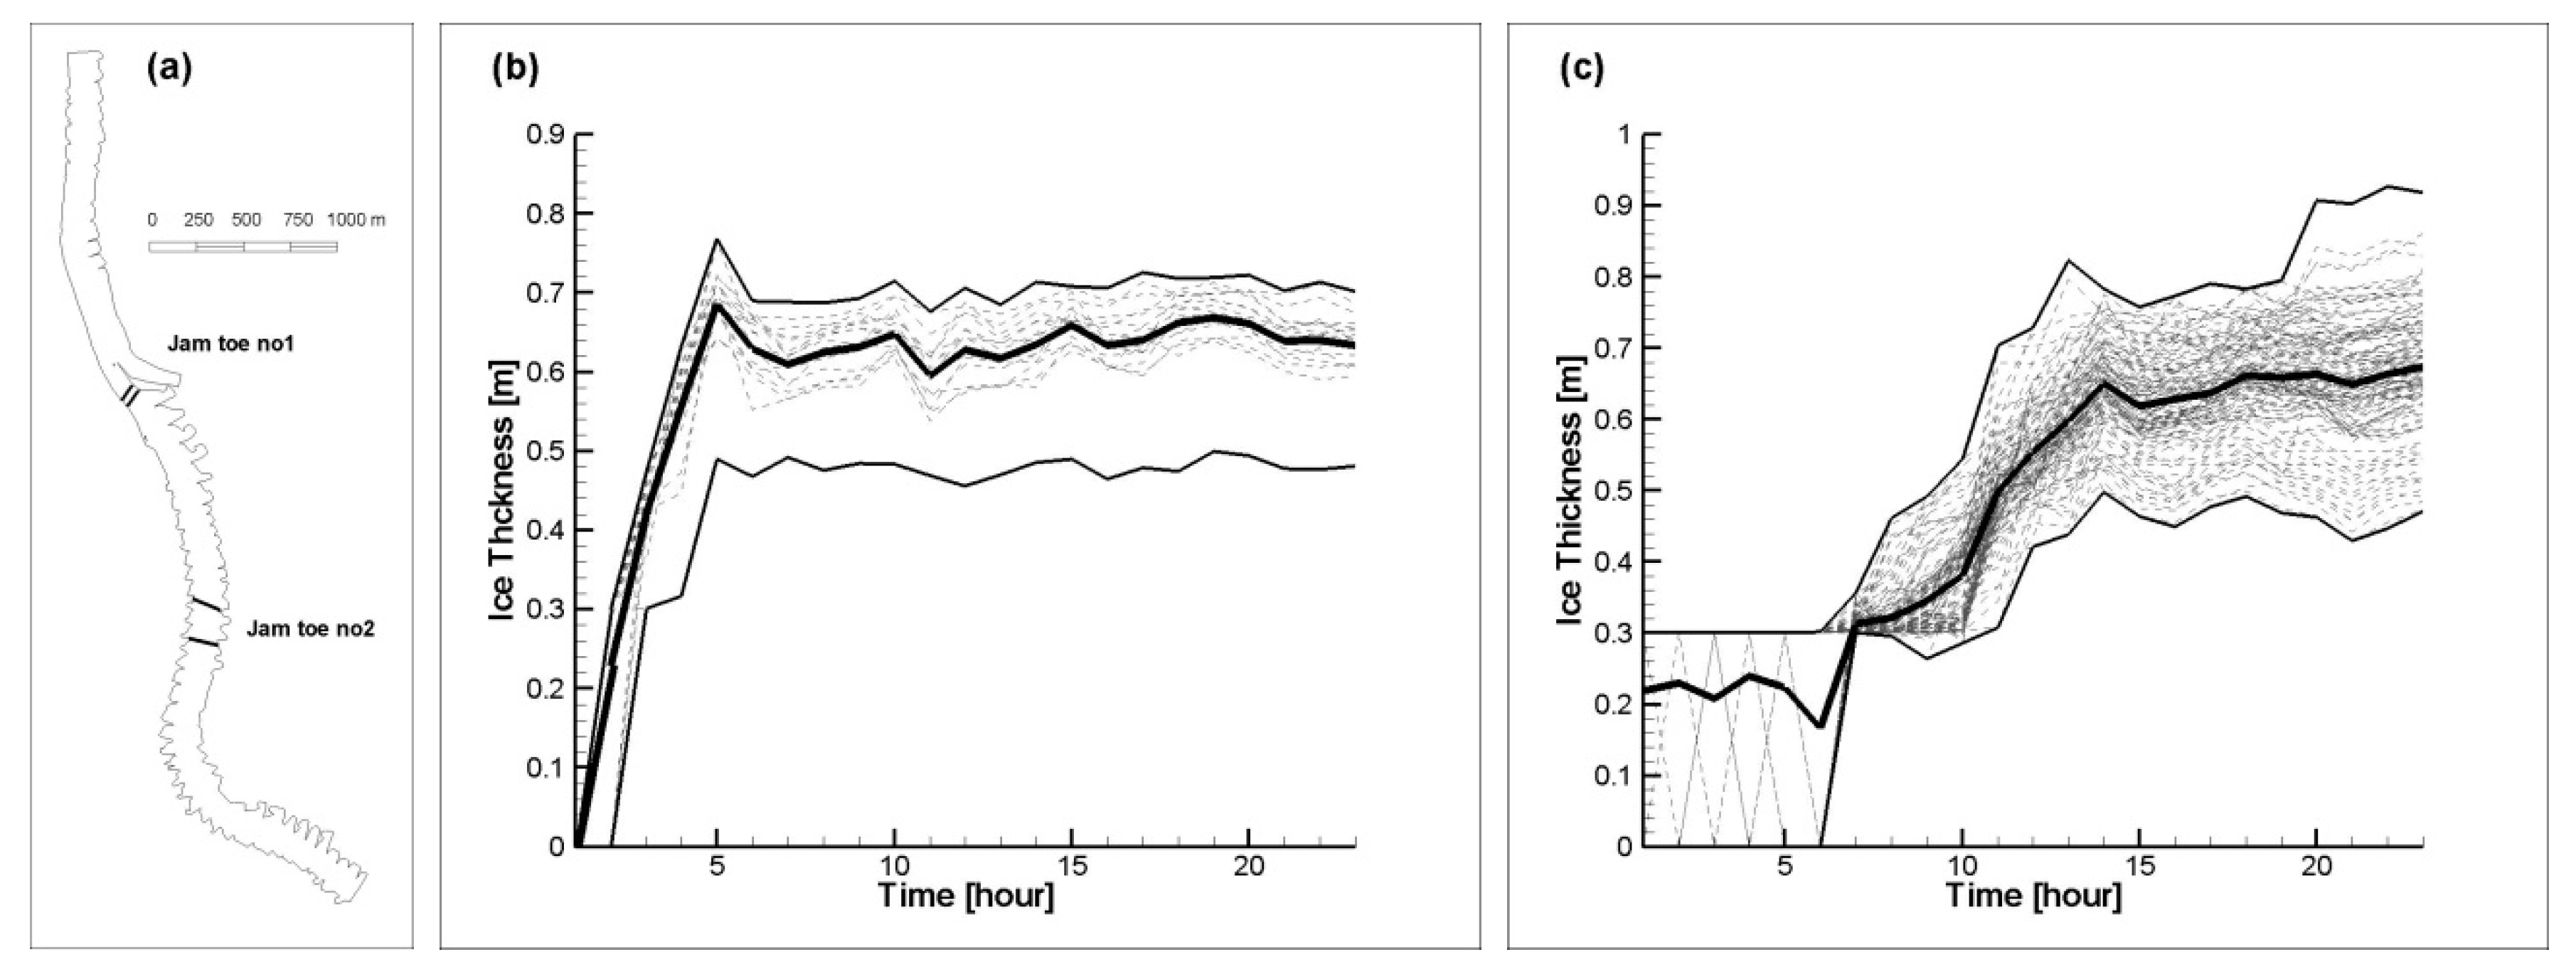
The model results show that the process of ice accumulation is very fast and if not controlled by icebreakers, it will lead to a jam of nearly 1.0 m formed in one day.
Figure 5 shows the ice thickness increase over time in two locations where the development of an ice jam toe is observed. The first location is directly upstream of the Słubice Bridge, as shown in
Figure 5a. In this place, the ice is retarded quickly and a rapid increase in its thickness is observed during the first 5 h of simulation (
Figure 5b). Over the next hours, the toe does not increase its thickness, which reached up to 0.7 m. In another preselected area, shown in
Figure 5c and located about 1300 m upstream of the bridge, the ice first moved without stoppage. Next, after about 6 h of simulation, an ice pile-up was observed, which led to an accumulation with a maximum thickness exceeding 0.9 m. It is clear to see that the second jam formation is directly affected by the accumulation at the bridge. Once the ice is stopped at the bridge, the incoming ice will slow down and stop quickly in the next location, about 1 km upstream.
This ice formation, if created downstream from the operating icebreaker, may be a severe obstacle causing a dangerous situation. To release an ice jam with a thickness of up to 1 m and a range of about 3 km will require using icebreakers with a significant horsepower. Since the horsepower of the icebreaker is related to its hull shape and draught, the river must have parameters allowing such a large ship to operate safely. This leads to the conclusion that to satisfy safety requirements on the Lower Odra, the modernization of river regulating structures along with dredging is needed. In order to minimize the impact on the river habitat, it is important to make use of those existing structures which are in good condition to any extent possible.
4.3. Ice Transport on the Middle Odra (Cigacice Case, 466–468 km)
The next simulation was carried out for a sharp river bend on the Middle Odra where spur dikes on both river banks exist. The spurs, as river training structures, were built to enhance navigation and protect erodible banks, but they originate from the first river regulations (mid-19th century) and are mostly in bad shape. The existence of these structures causes an intense vortex action, which is created at the streamward end of a spur dike. Intermittent vortices of a lesser strength occur along both the upstream and downstream face of the dike. This turbulence causes the bed material to be suspended, resulting in a scour hole that develops around the spur dike; the extent of which is determined by the bed material’s angle of response. On analyzing the bathymetry of the bed, extensive scouring is visible on the concave part of the bank and the river depth varies significantly along the thalweg.
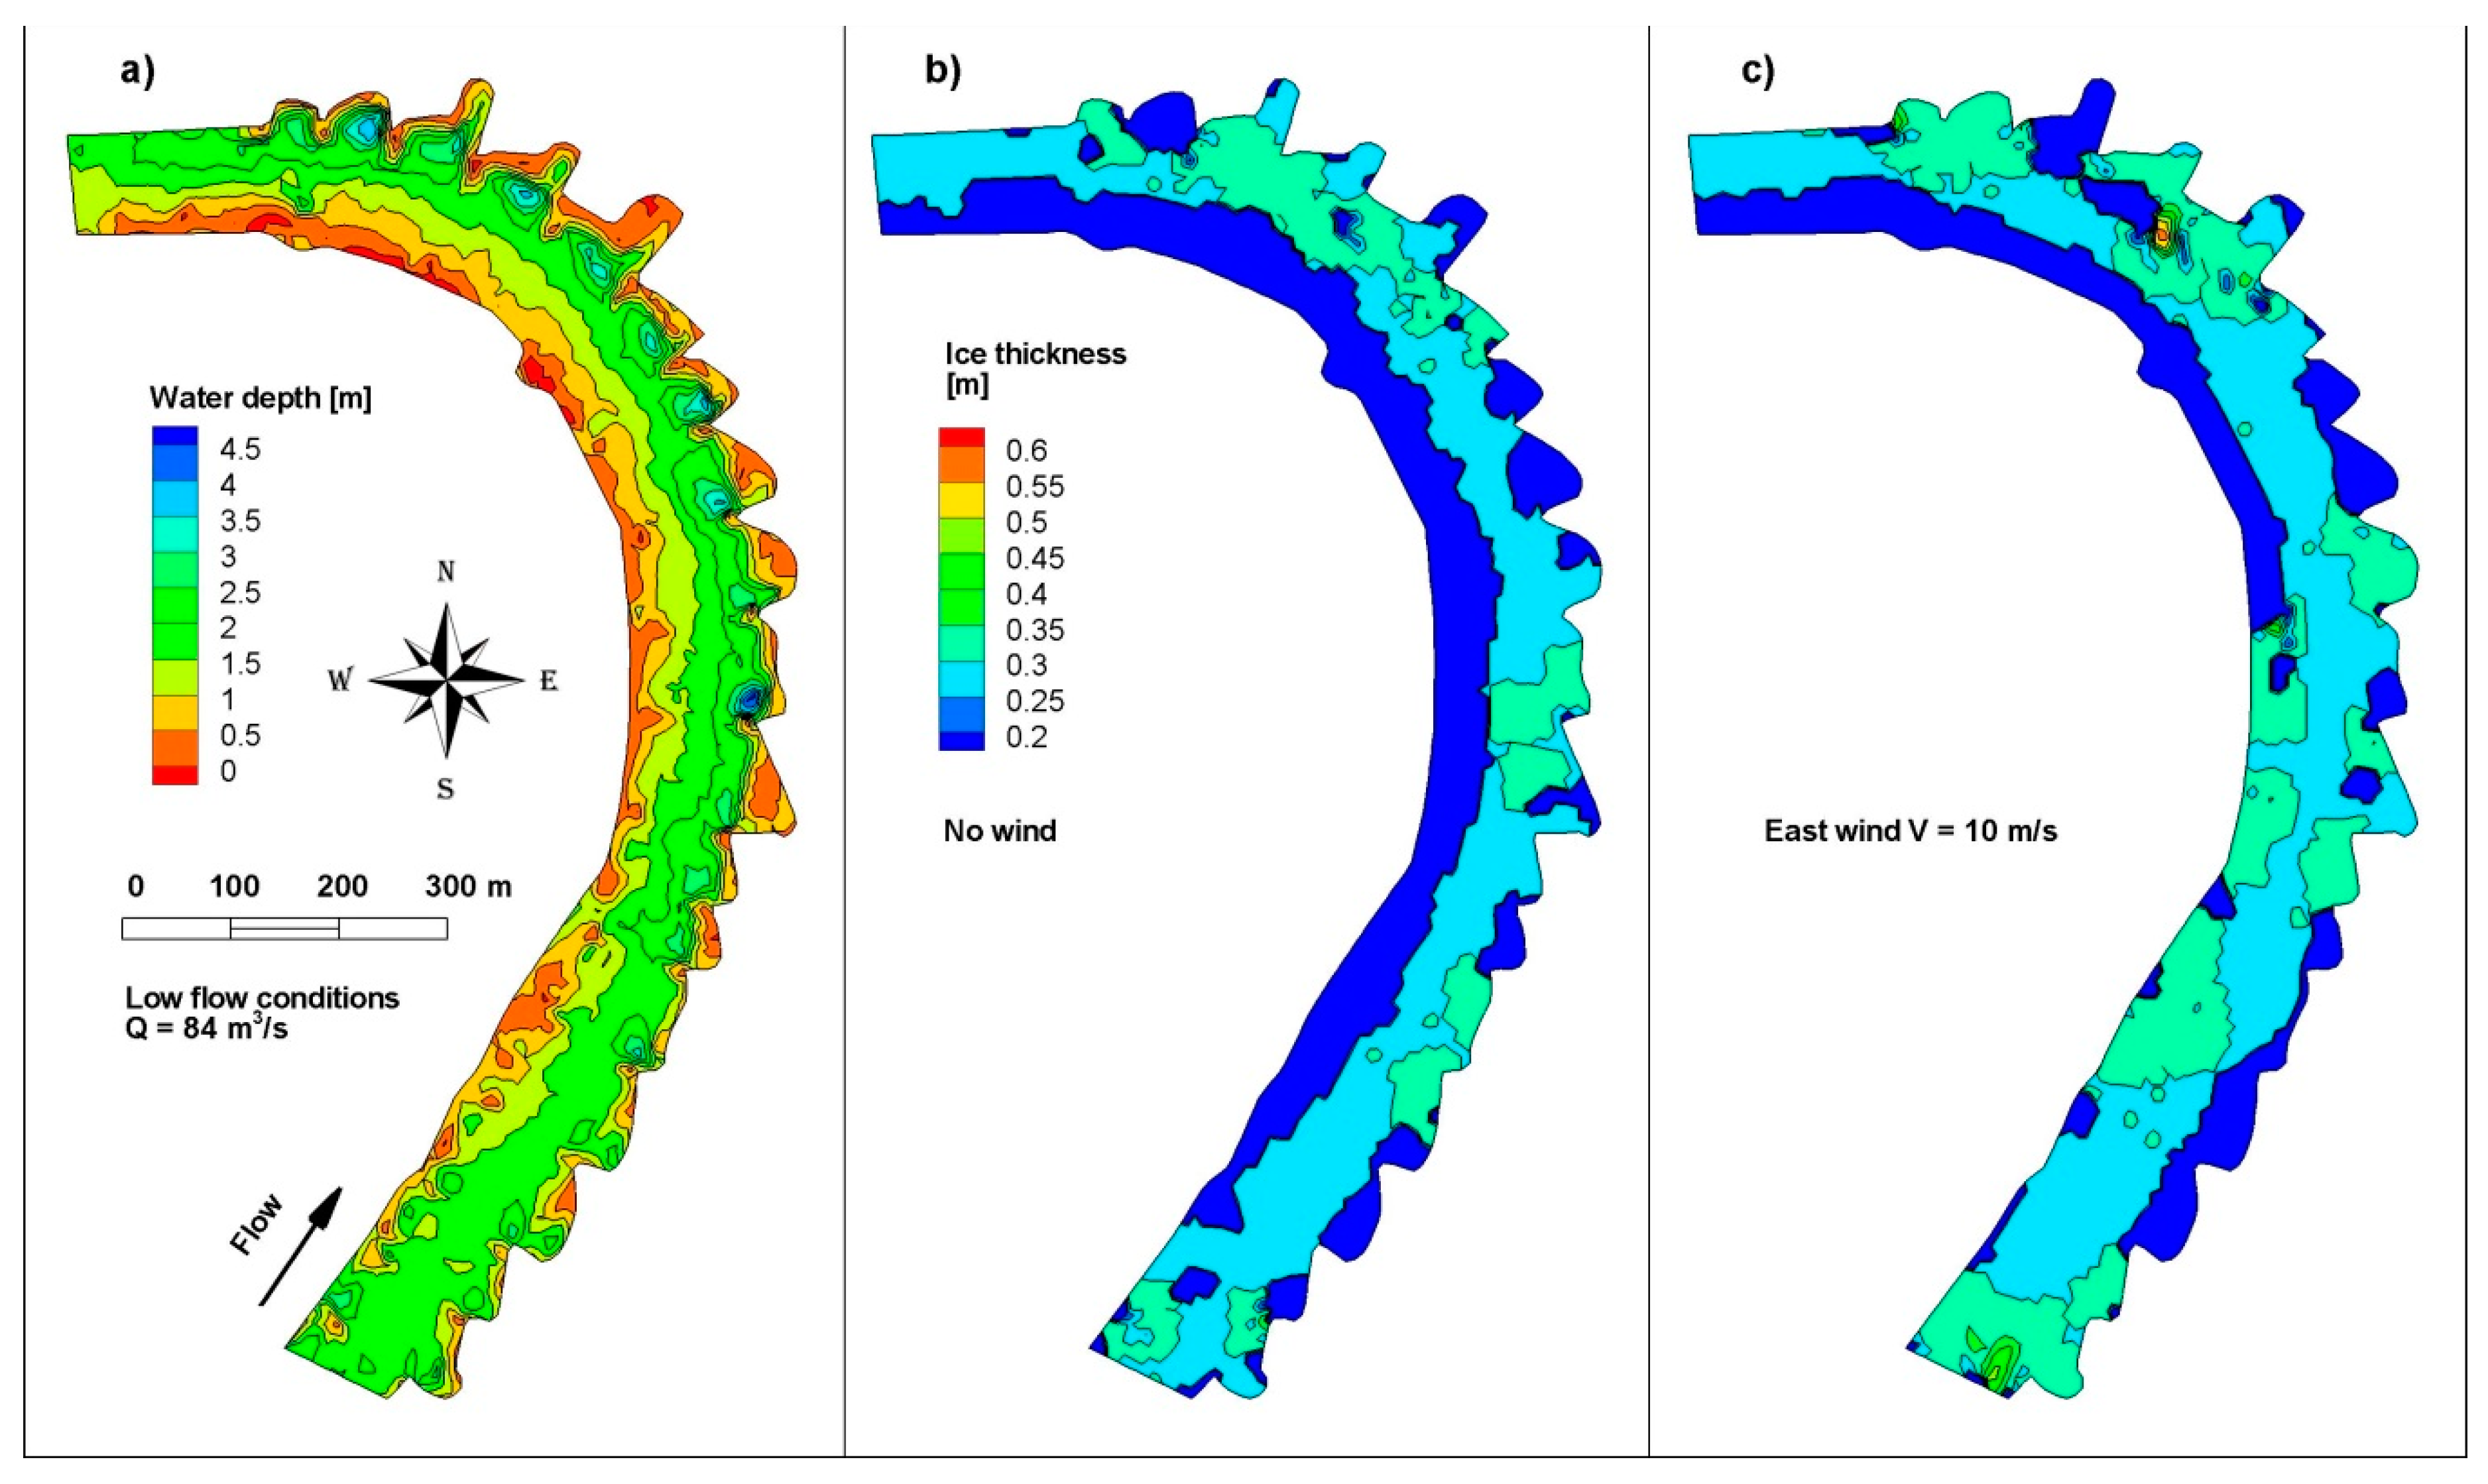
The mathematical model was set up on the 2 km section of the river upstream of the Cigacice gauging station (
Figure 6a). For the hydrodynamic boundary condition, water discharge representing a low flow condition was set up (Q = 84 m
3/s). In addition, an east wind with a velocity of 10 m/s was simulated to study the effect of ice drifting towards the shallow left bank of the river. The ice was supplied to the model upstream with a concentration of 0.3 and an initial thickness of 0.2 m. The simulation was carried out for 24 h with a constant water and ice flow condition.
The simulation results showed that ice has a tendency to move close to the nose of the spur dikes on the concave bank, where the depth varies significantly (0.5–4.0 m) due to erosion and accumulation caused by the river training structures. In some locations, ice settles on the river bottom, causing a grounded jam (
Figure 6b). Due to the east wind action, ice is pushed towards the left bank, where it stops on extensive shoals (
Figure 6c).
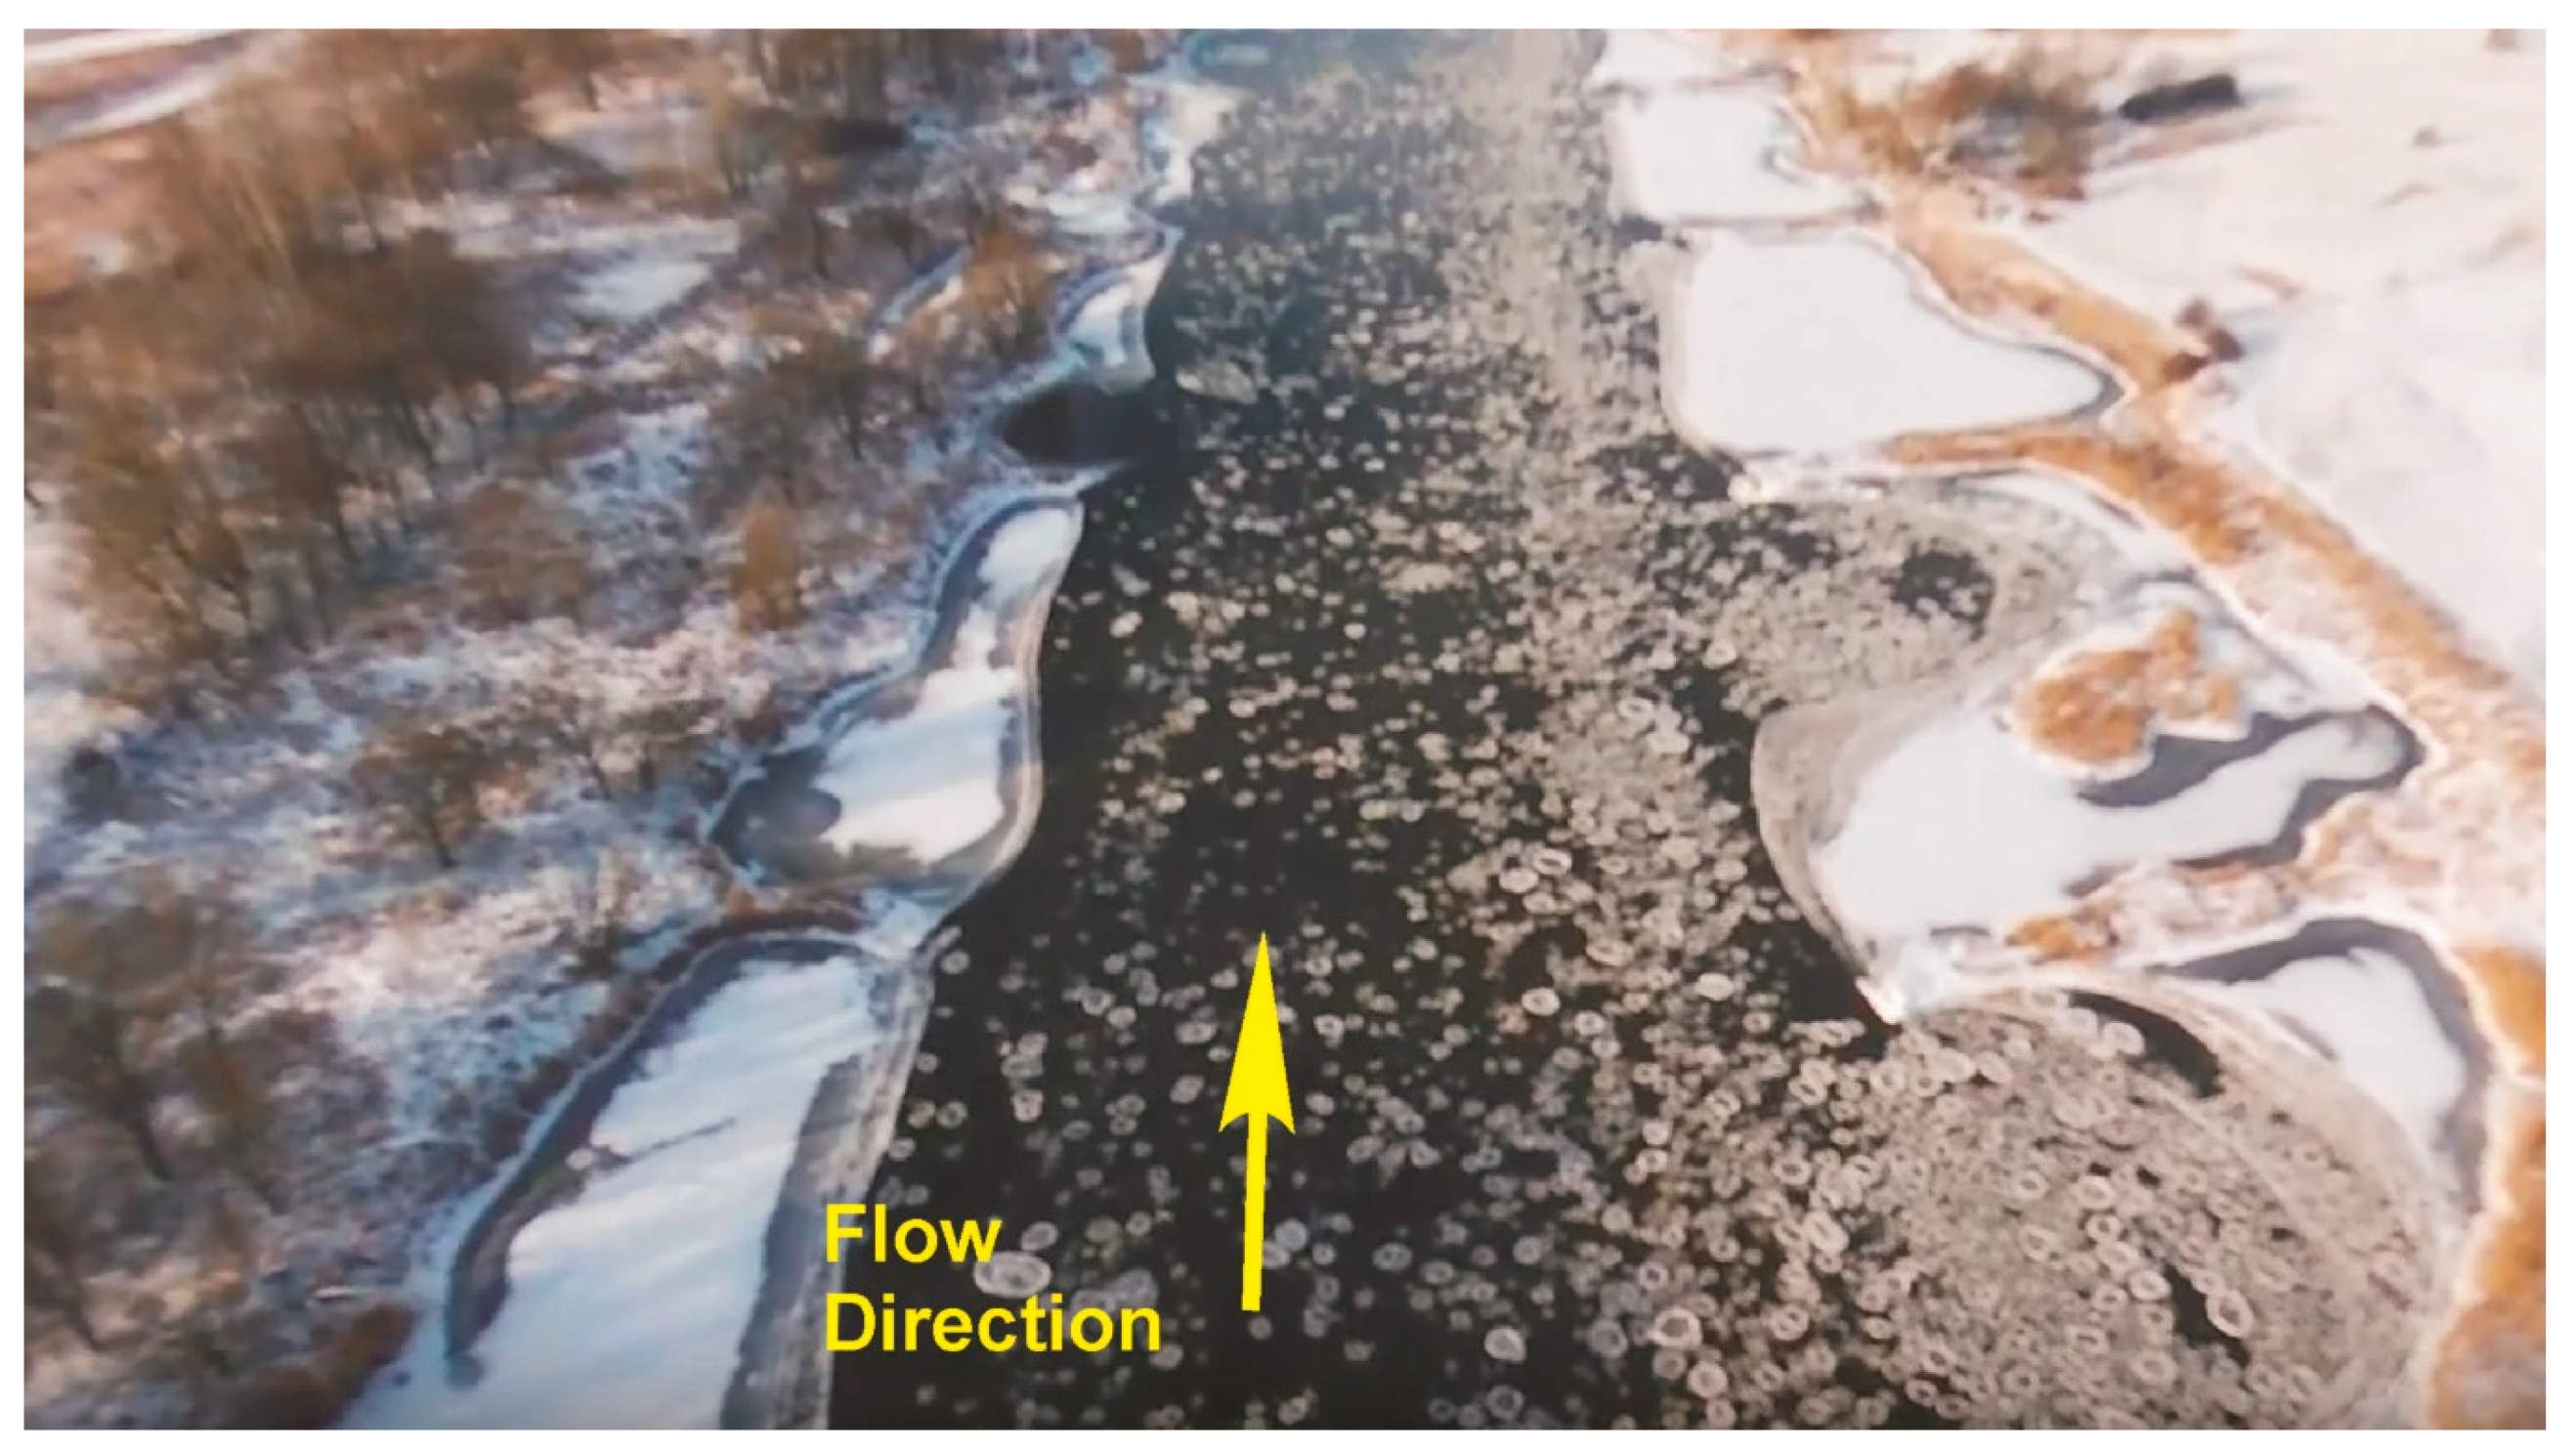
The general pattern of ice movement in the river section near Cigacice has been compared with the available material, including satellite images and aerial photos made by an unmanned aerial vehicle. Unfortunately, no ice thickness data are collected in that river section; therefore, a direct comparison was not possible. The situation from 13 January 2017, presented in
Figure 7, shows a similar ice movement pattern to that in
Figure 6b, with a higher concentration along the right river bank. The average daily discharge for this day was in the range of 150 m
3/s, and no wind was recorded.
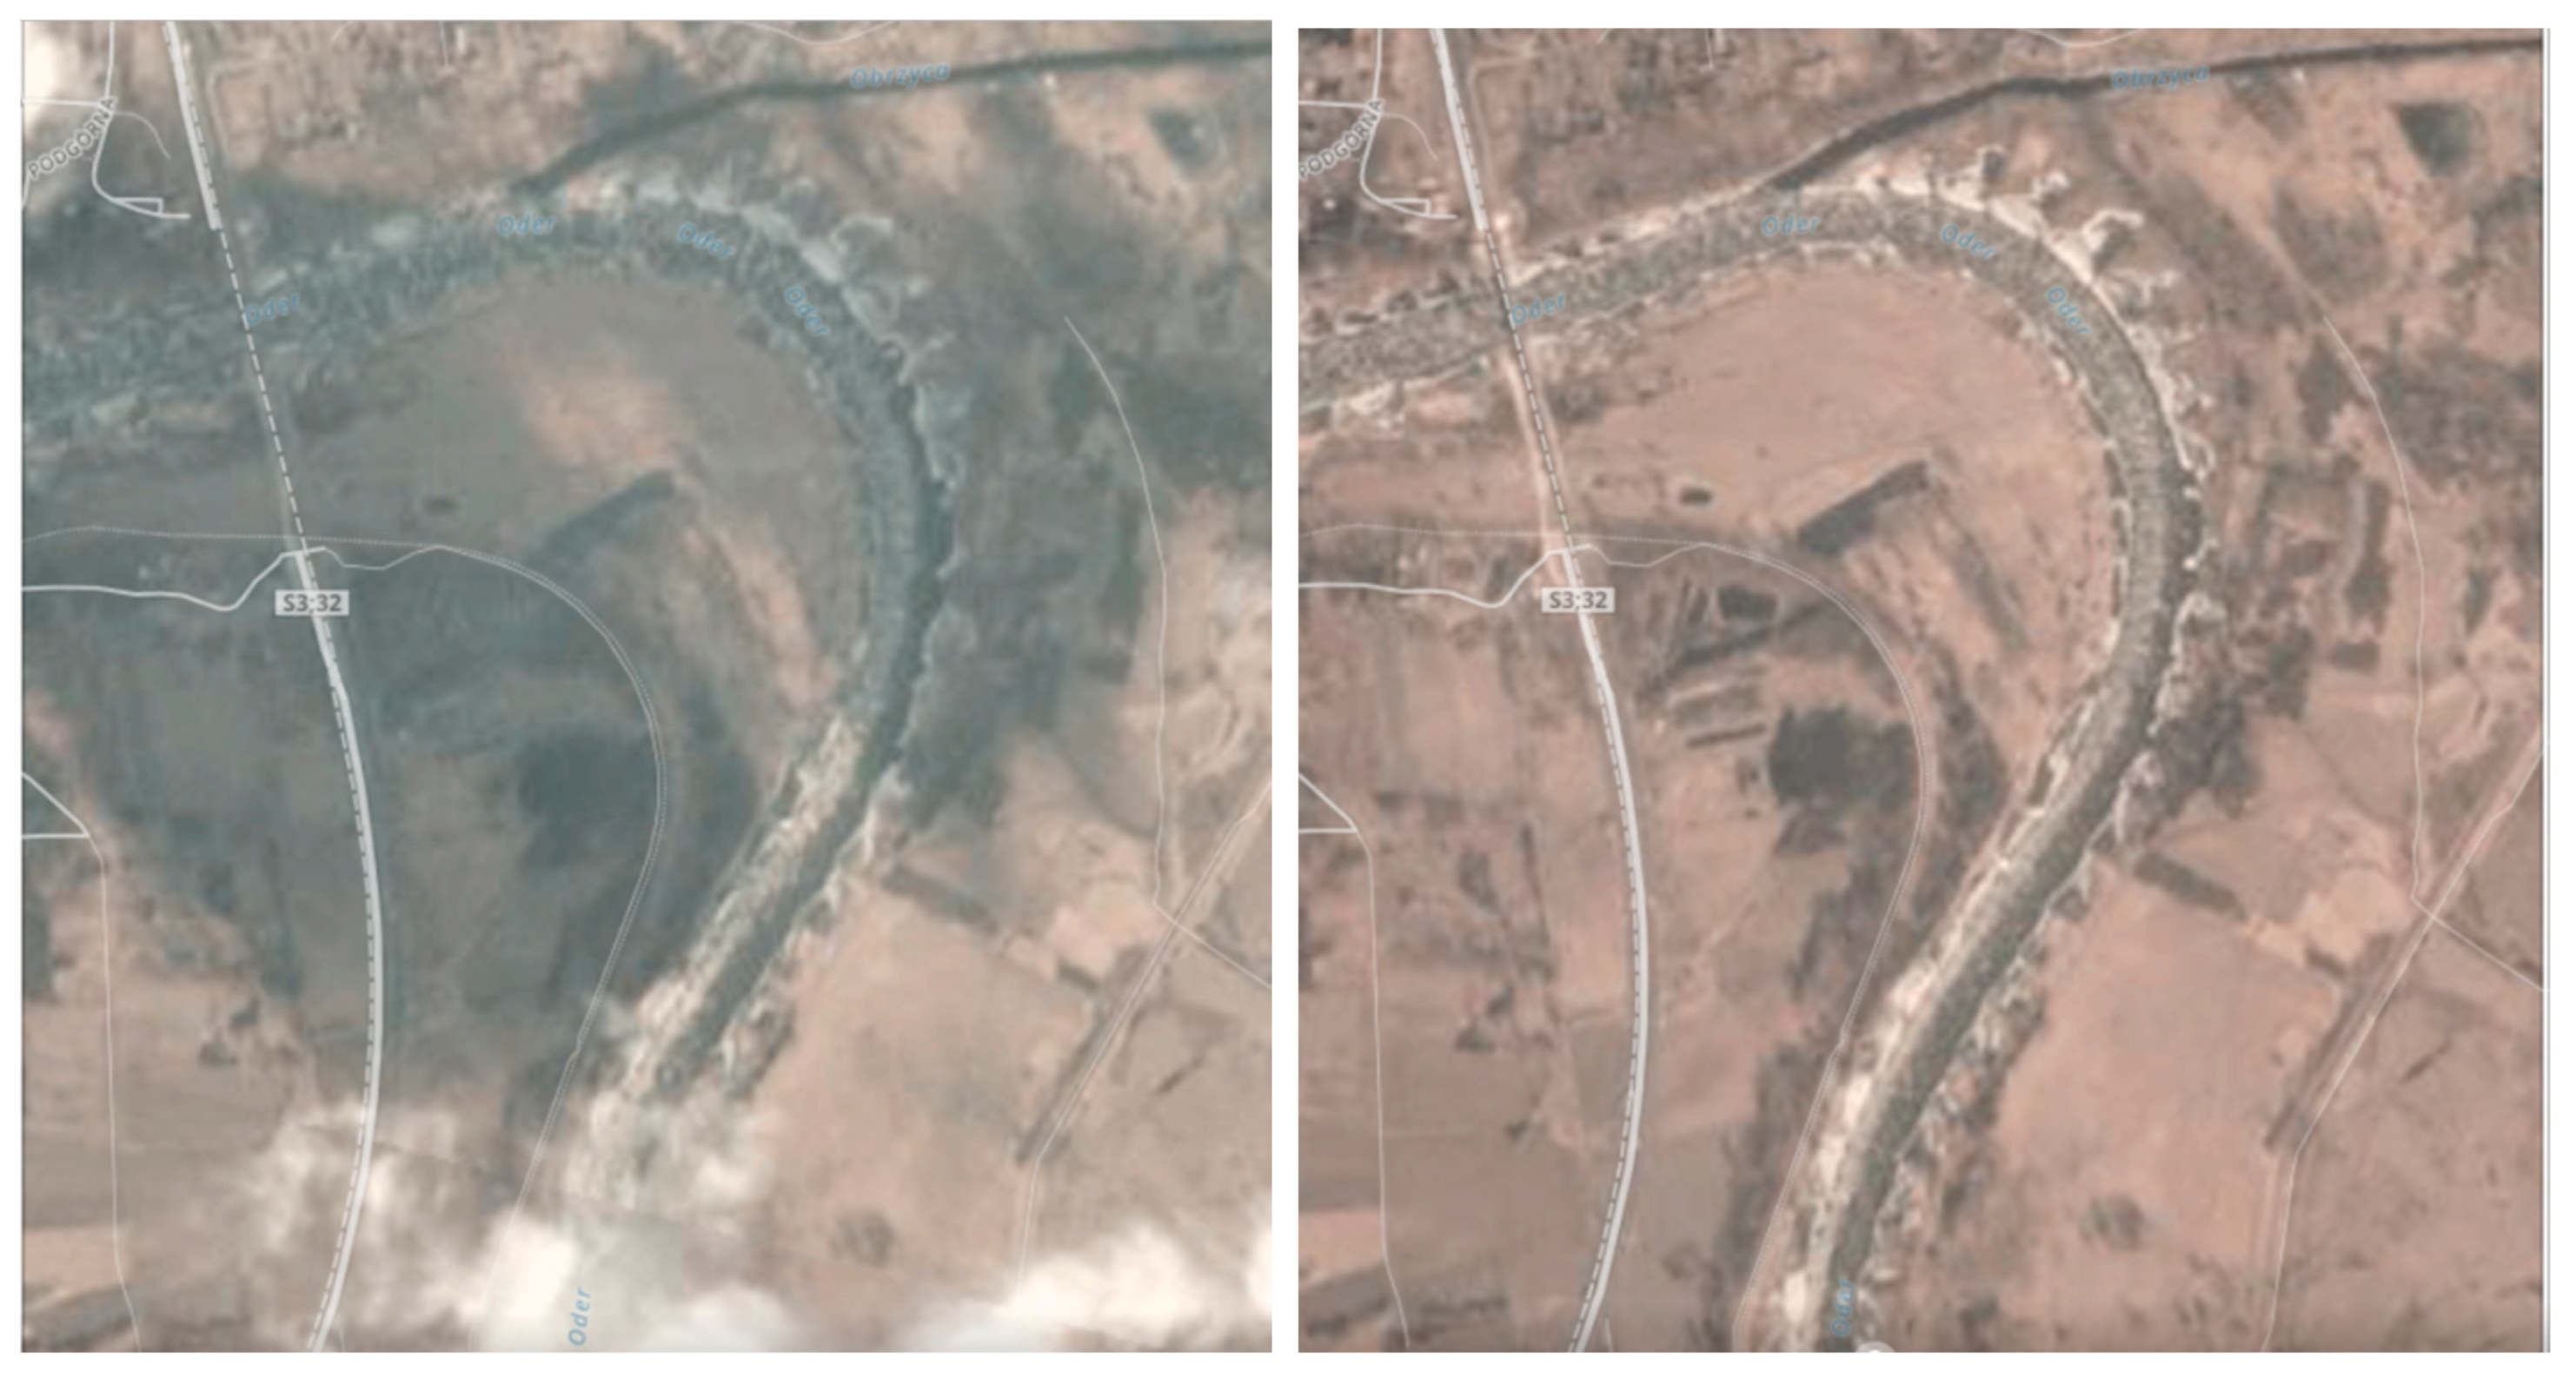
Another situation, shown in satellite images from 28 February and 2 March 2018 (
Figure 8), displays ice movement affected by an east wind (daily average wind velocity of 3.6 m/s). The surface ice distribution shown in the satellite images is similar to the ice thickness distribution obtained from the mathematical model and shown in
Figure 6c. This case indicates that the wind pushed the ice towards the left bank. For the low flow condition, this wind action may lead to ice stopping in shallow areas along the convex river bank.
The icebreaking operation in the Middle Odra River must proceed continuously along both river banks. In the case of ice stopped at the shallow part of the river, its release may be impossible due to the insufficient depth for ships. In order to satisfy flood prevention during the winter season, the Middle Odra must be regulated to meet the required depth of about 2 m.
5. Conclusions
In this paper, it was shown that a mathematical model could be a very useful tool for use in engineering practice to support the design process in river engineering. In cold climate regions, river ice can have a great effect on flow regimes through variable ice formation and ice break-up. Due to the lack of an adequate tool, a significant amount of information on this subject is usually obtained through approximation or on the basis of subjective expertise. By referring to the example of the Odra River, it was shown how the results obtained from a mathematical model can support decision-making when designing river regulation works.
In the case of the Odra River, which is shown in the paper, understanding the ice accumulation process and ice transport will help to reduce the possibility of the creation of ice jams and to enable icebreaking, which is the most efficient tool for minimizing the risks of winter floods. These tasks will ensure the safe passage of ice down the river and at the same time, the reduction of flood risks to adjacent areas.
The application of the DynaRICE model to the Odra River showed the model’s possibility to predict small-scale dynamic river ice processes, e.g., increasing thickness of ice accumulations at locations where ice jamming problems historically occurred. It is a robust, coupled hydrodynamic and ice dynamic model which is able to simulate ice jamming by including all external and internal forces. Therefore, it allows the reproduction of ice phenomena in rivers for typical flow and ice conditions without a subjective user impact. It could also be used to anticipate further ice processes after the river bathymetry is changed by dredging or additional river regulating structures are added according to planned engineering works. The results obtained from the model, even if not compared directly with field observations, are plausible predictions of ice jamming locations under certain environmental conditions.
Based on the practical experience of the Water Resources Board in Szczecin [
35], and the quantitative results of mathematical modeling presented above, it must be said that icebreakers in the Odra River face harsh ice conditions. This means that their power must be adequate and the design draught must not be less than 1.4 m. Opponents of river regulation claimed that river vessels similar to those used in the Danube or Elbe may be used in the Odra; however, on the mentioned rivers, ice jams occur occasionally and the thickness and range of historical jams are relatively small [
8,
47]. It must be emphasized that ice conditions and parameters are site specific and cannot be directly transferred from other climatic zones to Polish rivers. It is important to qualitatively and quantitatively study and describe the local ice conditions on the Odra River. This could be done by implementing both empirical and analytical approaches, which must refer well to historical observations. Based on the results received from the ice research on the Odra River, adequate technical solutions may be proposed. The results of the above study confirmed that the proposed technical parameters of the icebreakers which are planned to be used in the Odra River are correct.


